Organic carbon characteristics in ice-rich permafrost in alas and Yedoma deposits, central Yakutia, Siberia - ePIC
←
→
Page content transcription
If your browser does not render page correctly, please read the page content below
Biogeosciences, 17, 3797–3814, 2020
https://doi.org/10.5194/bg-17-3797-2020
© Author(s) 2020. This work is distributed under
the Creative Commons Attribution 4.0 License.

Organic carbon characteristics in ice-rich permafrost in alas and
Yedoma deposits, central Yakutia, Siberia
Torben Windirsch1,2 , Guido Grosse1,2 , Mathias Ulrich3 , Lutz Schirrmeister1 , Alexander N. Fedorov4,5 ,
Pavel Y. Konstantinov4 , Matthias Fuchs1 , Loeka L. Jongejans1,2 , Juliane Wolter1 , Thomas Opel1 , and Jens Strauss1
1 Alfred  Wegener Institute Helmholtz Centre for Polar and Marine Research, Telegrafenberg A45,
14473 Potsdam, Germany
2 Institute of Geosciences, University of Potsdam, Karl-Liebknecht-Straße 24–25, 14476 Potsdam, Germany
3 Institute for Geography, Leipzig University, Johannisallee 19a, 04103 Leipzig, Germany
4 Melnikov Permafrost Institute, SB RAS, 36 Merzlotnaya str., Yakutsk, Republic of Sakha, 677010, Russia
5 BEST International Centre, North-Eastern Federal University, 58 Belinsky str., Yakutsk, Republic of Sakha, 677027, Russia

Correspondence: Torben Windirsch (torben.windirsch@awi.de)

Received: 2 December 2019 – Discussion started: 3 January 2020
Revised: 4 June 2020 – Accepted: 18 June 2020 – Published: 23 July 2020

Abstract. Permafrost ground is one of the largest reposito-       was strongly disturbed by lake development and permafrost
ries of terrestrial organic carbon and might become or al-        thaw. Similar to the Yedoma core, some sections of the alas
ready is a carbon source in response to ongoing global warm-      core were also OC poor (< 0.1 wt %) in 17 out of 28 sam-
ing. With this study of syngenetically frozen, ice-rich and or-   ples. The Yedoma deposition was likely influenced by flu-
ganic carbon (OC)-bearing Yedoma and associated alas de-          vial regimes in nearby streams and the Lena River shifting
posits in central Yakutia (Republic of Sakha), we aimed to        with climate. With its coarse sediments with low OC con-
assess the local sediment deposition regime and its impact on     tent (OC mean of 5.27 kg m−3 ), the Yedoma deposits in the
permafrost carbon storage. For this purpose, we investigated      Yukechi area differ from other Yedoma sites in North Yaku-
the Yukechi alas area (61.76495◦ N, 130.46664◦ E), which is       tia that were generally characterized by silty sediments with
a thermokarst landscape degrading into Yedoma in central          higher OC contents (OC mean of 19 kg m−3 for the non-ice
Yakutia. We retrieved two sediment cores (Yedoma upland,          wedge sediment). Therefore, we conclude that sedimentary
22.35 m deep, and alas basin, 19.80 m deep) in 2015 and           composition and deposition regimes of Yedoma may differ
analyzed the biogeochemistry, sedimentology, radiocarbon          considerably within the Yedoma domain. The resulting het-
dates and stable isotope geochemistry. The laboratory analy-      erogeneity should be taken into account for future upscal-
ses of both cores revealed very low total OC (TOC) contents       ing approaches on the Yedoma carbon stock. The alas core,
(< 0.1 wt %) for a 12 m section in each core, whereas the         strongly affected by extensive thawing processes during the
remaining sections ranged from 0.1 wt % to 2.4 wt % TOC.          Holocene, indicates a possible future pathway of ground sub-
The core sections holding very little to no detectable OC con-    sidence and further OC decomposition for thawing central
sisted of coarser sandy material were estimated to be between     Yakutian Yedoma deposits.
39 000 and 18 000 BP (years before present) in age. For this
period, we assume the deposition of organic-poor material.
Pore water stable isotope data from the Yedoma core indi-
cated a continuously frozen state except for the surface sam-     1   Introduction
ple, thereby ruling out Holocene reworking. In consequence,
we see evidence that no strong organic matter (OM) decom-         Permafrost deposits represent one of the largest terres-
position took place in the sediments of the Yedoma core un-       trial carbon reservoirs. Perennial freezing largely prevents
til today. The alas core from an adjacent thermokarst basin       decomposition and preserves organic material. These per-
                                                                  mafrost soil conditions are found in the ground of approx-

Published by Copernicus Publications on behalf of the European Geosciences Union.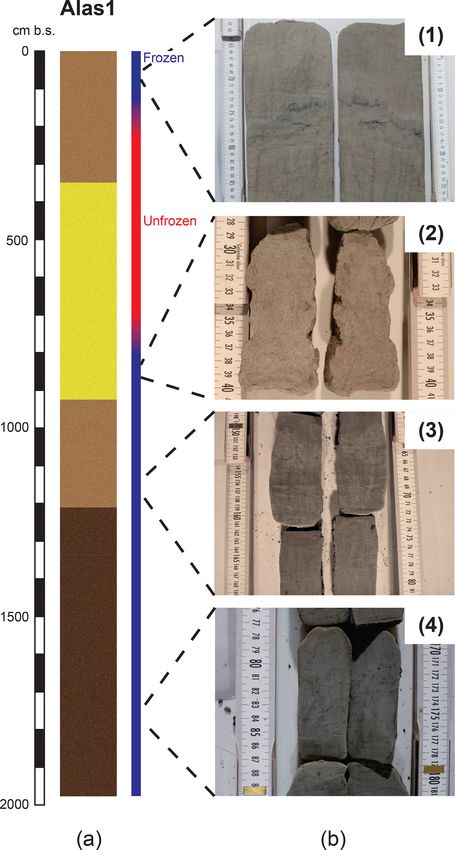
3798                                              T. Windirsch et al.: Organic carbon characteristics in ice-rich permafrost

imately one-quarter of the Northern Hemisphere’s land sur-         can usually be determined by the higher carbon content com-
face (Zhang et al., 1999). The estimated amount of frozen          pared with the adjacent deposits (Strauss et al., 2013).
and unfrozen carbon stored in the terrestrial permafrost re-          The resulting landscape patterns of Yedoma uplands and
gion is 1330 to 1580 Gt (Hugelius et al., 2014; Schuur et          alas basins form a heterogeneous landscape mosaic (Morgen-
al., 2015), which is approximately 45 % more than what             stern et al., 2011). The heterogeneity and carbon character-
is currently present in the atmosphere (∼ 864 Gt, based on         istics within these deposit types, especially below 3 m, are
407 ppm CO2 measured in 2018; Ballantyne et al., 2012;             still poorly studied, as only very few studies examining long
Friedlingstein et al., 2019). Permafrost aggregation and con-      Siberian permafrost cores have been conducted (Zimov et al.,
servation is highly dependent on long-term climatic condi-         2006; Strauss et al., 2013; Shmelev et al., 2017). Studies from
tions, both directly via air temperature and indirectly by the     this area mostly examine natural Yedoma exposures such as
presence or absence of insulating vegetation and snow cover        the Batagay mega thaw slump (Ashastina et al., 2017). In
(Johansson et al., 2013). Currently, these permafrost con-         central Yakutia, several permafrost studies have been con-
ditions are under threat from rapidly increasing global and        ducted, especially on thermokarst processes, related surface
in particular Arctic air temperatures that have resulted in        dynamics and temperature changes (Fedorov and Konstanti-
widespread permafrost warming in recent years (Biskaborn           nov, 2003; Ulrich et al., 2017a, b, 2019). Other studies have
et al., 2019). Gradual permafrost losses of up to 70 % are ex-     shown a direct relation between dense vegetation cover and
pected in the uppermost 3 m by 2100 in a business-as-usual         low permafrost carbon storage due to warmer permafrost
climate scenario (Chadburn et al., 2017; IPCC, 2019) or at         conditions as a result of ground insulation (Siewert et al.,
even greater depths if deep thermokarst-induced rapid thaw         2015). Hugelius et al. (2014) estimate the carbon stock in the
is taken into account (Nitzbon et al., 2020), while rapid per-     circumpolar permafrost region to be approximately 822 Gt
mafrost thaw is not considered at all (Turetsky et al., 2020).     of carbon. However, despite the still high vulnerability of
   A special type of permafrost is the Yedoma ice complex          deeper deposits to thaw by thermokarst and thermo-erosion
deposit (in the following referred to as Yedoma), which is         (Turetsky et al., 2019), very few studies have reported or-
formed syngenetically by late Pleistocene deposition of fine-      ganic carbon characteristics for permafrost deposits deeper
grained sediments with large volumes of ground ice. Yedoma         than 3 m. This lack of data results in very high uncertainties
is ice-rich (50–90 vol %, volume percent, ice) and usually has     regarding the impact of deep thaw in ice-rich permafrost re-
organic carbon contents of 2–4 wt % (weight percent) with          gions and the consequences for the carbon cycle (Kuhry et
an estimated deposit thickness of up to 40 m (Schirrmeis-          al., 2020).
ter et al., 2013; Strauss et al., 2013). In central Yakutia,          By investigating deeper permafrost sediments in the con-
the cryostratigraphic characteristics of these syngenetic Late     tinuous permafrost region of central Yakutia, we aimed to un-
Pleistocene deposits have been previously studied by var-          derstand the processes involved in organic carbon deposition
ious researchers (Soloviev, 1959; Katasonov and Ivanov,            and reworking in the Yedoma and thermokarst deposits of
1973; Katasonov, 1975; Péwé et al., 1977; Péwé and Jour-           this fast changing permafrost landscape (Nitze et al., 2018).
naux, 1983). In the context of global climate change, such            Our main research questions were as follows:
a high ice content, with intrasedimental ice and syngenetic
ice wedges, renders Yedoma deposits highly vulnerable to               1. What sedimentological processes have influenced the
thaw-induced landscape changes (Schirrmeister et al., 2013)               carbon stocks found in the Yedoma and alas deposits
and ground volume loss causing surface subsidence. Thaw-                  of the Yukechi area?
ing leads to ground subsidence which is often associated with
                                                                       2. How did the sedimentological processes affect the local
thaw lake development (Grosse et al., 2013). Thaw lake de-
                                                                          carbon storage?
velopment, surface subsidence, lake drainage and refreez-
ing of the sediments result in a thermokarst basin landform
called alas in central Yakutia (Soloviev, 1973). During these      2    Study site
thermokarst processes, the organic material stored within the
permafrost becomes exposed to decomposition in the thaw            The Yukechi alas landscape (61.76495◦ N; 130.46664◦ E)
bulbs (taliks) underneath the thermokarst lakes. It is subse-      covers an area of approximately 1.4 km2 and is located on
quently released into the atmosphere as a result of microbial      the Abalakh Terrace (∼ 200 m above sea level) in the Lena–
activity in unfrozen and aquatic conditions in the form of         Aldan interfluve of central Yakutia (Fig. 1a; Ulrich et al.,
gases such as carbon dioxide or methane, amplifying global         2019). It is characterized by Yedoma uplands and drained
climate change (Schuur et al., 2008). After a lake drainage        alas basins, indicating active thermokarst processes (Fedorov
event, the resulting thermokarst deposits in the alas basins re-   and Konstantinov, 2003). Yedoma deposits cover 66.4 % of
freeze, and the remaining Pleistocene soil carbon, as well as      the area. The lakes cover about 13.0 % of the Yukechi alas
carbon from new plant biomass forming in thermokarst lakes         landscape, and approximately 20.6 % of the area consists of
and basins, becomes protected from decomposition again.            basins covered by grasslands, which contain alas deposits
The occurrence of these draining and refreezing processes          (Fig. S1 in the Supplement).

Biogeosciences, 17, 3797–3814, 2020                                                    https://doi.org/10.5194/bg-17-3797-2020
T. Windirsch et al.: Organic carbon characteristics in ice-rich permafrost                                                             3799

Figure 1. Study site overview: (a) location of the Yukechi alas study site in central Yakutia on the edge of the Abalakh Terrace (circumpolar
digital elevation model, Santoro and Strozzi, 2012); (b) locations of the Alas1 and the YED1 coring sites within the Yukechi alas landscape
(Planet Ortho Tile, acquisition date: 7 July 2018; Planet Team, 2017).

   Today, central Yakutia is characterized by an extreme                    Lake dynamics have been monitored at the Yukechi alas
continental subpolar climate regime with very low win-                   study site for several decades by the Melnikov Permafrost
ter air temperatures down to minima of −63 ◦ C in Jan-                   Institute in Yakutsk (Bosikov, 1998; Fedorov and Konstanti-
uary (Nazarova et al., 2013). Holocene summer climate re-                nov, 2003; Ulrich et al., 2017a) and have been partially linked
constructions indicate climate settings with slightly colder             to local land use (Crate et al., 2017).
conditions (TJuly for 10 000–8000 BP and 4800–0 BP is
15.6 ± 0.7 ◦ C) compared with modern climate (TJuly is 16.6–
17.5 ◦ C) and a mid–Holocene warming phase between about                 3     Methods
6000 and 4500 BP (TJuly ∼ 1.5 ◦ C higher than the present)
                                                                         3.1    Field work
(Nazarova et al., 2013; Ulrich et al., 2017b). The contempo-
rary mean annual air temperature in central Yakutia (mea-                Field work took place in March 2015 during a joint
sured at Yakutsk Meteorological Station) is −9.7 ◦ C. The                Russian–German drilling expedition. Two long permafrost
modern active layer thickness in central Yakutia is approx-              sediment cores were obtained: one from Yedoma deposits
imately 1.5 m, but it can be thicker in grasslands, such as              and one from the adjacent drained Yukechi alas basin
within alas basins (about 2 m or more), and thinner below                (Fig. 1b). The surface of the alas sample site (61.76490◦ N,
the taiga forest (less than 1 m) (Fedorov, 2006). For the                130.46503◦ E; h = 209 m above sea level) is located ap-
Yukechi alas deposits, the active layer depth can be estimated           proximately 9 m lower than the surface of the sampled
at around 2 m and, therefore, reaches down into an observed              Yedoma site (61.75967◦ N, 130.47438◦ E; h = 218 m above
talik, following Fedorov (2006). Taliks form because of a re-            sea level) (Fig. 2). The distance between the two coring lo-
cent or already drained lake that prevented winter freezing or           cations is 765 m. Both cores were drilled from dry land sur-
due to an incomplete refreezing of the active layer.                     face, kept frozen and sent to Potsdam, Germany, for labo-
   The Yedoma deposits in this region can be more than                   ratory analysis. The Yedoma core (YED1) reached a depth
30 m thick, as has already been shown by older Russian                   of 2235 cm b.s. and includes an ice wedge section from ap-
works (Soloviev, 1959, 1973). Lakes are found in partially               proximately 700 to 950 cm b.s. A talik section, due to an in-
drained basins as well as on the surrounding Yedoma up-                  completely refrozen active layer, was identified between 100
lands (Fig. 1b). The land surface within the alas basins is              and 200 cm b.s. The alas core (Alas1) reached 1980 cm b.s.
covered by grasslands, whereas the boreal forest found on the            A talik section was found in the alas core reaching from ap-
Yedoma uplands mainly consists of Larix cajanderi with sev-              proximately 160 down to 750 cm b.s.
eral Pinus sylvestris communities (Kuznetsova et al., 2010;
Ulrich et al., 2017b). Central Yakutian alas landscapes are
characterized by extensive land use, which mainly consists of
horse and cattle herding and hay farming (Crate et al., 2017).

https://doi.org/10.5194/bg-17-3797-2020                                                           Biogeosciences, 17, 3797–3814, 2020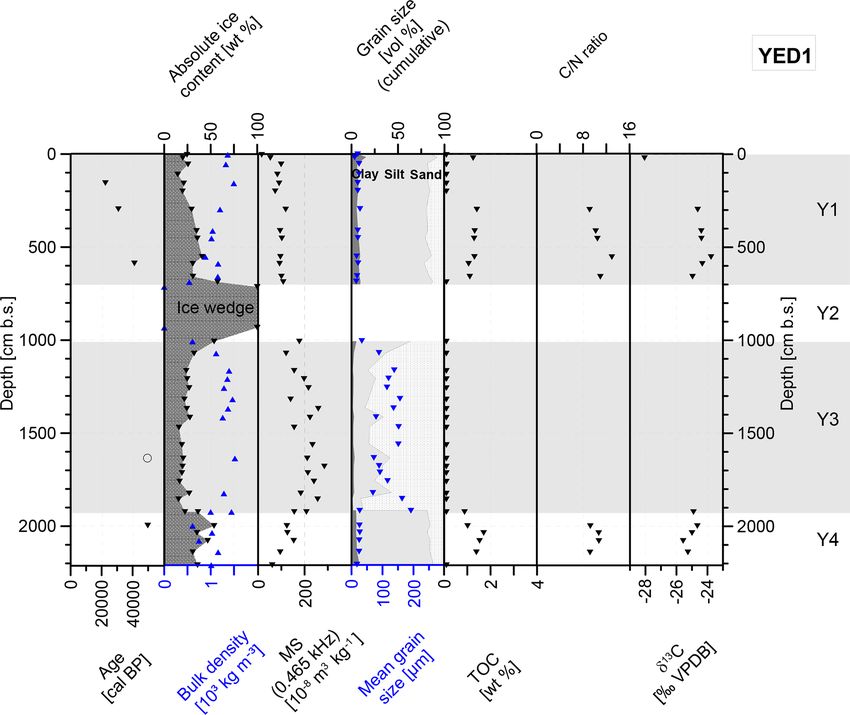
3800                                                T. Windirsch et al.: Organic carbon characteristics in ice-rich permafrost

                                                                     (TN) and total organic carbon (TOC) content were measured
                                                                     through combustion and the analyses of the resulting gases
                                                                     using a vario EL III and a varioMAX C element analyzer.
                                                                     Results give the carbon and nitrogen amounts in relation to
                                                                     the sample mass used for analysis in weight percent (wt %).
                                                                     The carbon to nitrogen ratio (C/N) was calculated from the
                                                                     TN and TOC content. Besides showing an input signal, we
                                                                     used this ratio as a rough indicator of the state of degrada-
                                                                     tion or source of organic matter. Assuming a constant source,
Figure 2. Setting of the drilling locations for the Alas1 and YED1
                                                                     a higher ratio indicates more well-preserved organic matter
cores showing the distance and height difference between the lo-
cations (vertical scale exaggerated). The terms “alas lake” and      (Stevenson, 1994; Strauss et al., 2015).
“Yedoma lake” are chosen following Ulrich et al. (2017a) in ac-
cordance with the deposit type in which the thermokarst lakes are    3.2.3   Magnetic susceptibility and grain size analysis
located; the Yedoma lake can also be called “dyede” due to its de-
velopment stage following Crate et al. (2017).                       Subsamples taken for grain size analysis were first measured
                                                                     for mass specific magnetic susceptibility using a Barting-
                                                                     ton MS2 magnetic susceptibility meter and a frequency of
3.2     Laboratory analyses                                          0.465 kHz. This allowed us to differentiate between different
                                                                     mineral compositions (Butler, 1992; Dearing, 1999).
The frozen cores were split lengthwise using a band saw                 For grain size analysis, the samples were treated with
and were subsequently subsampled. Each subsample con-                hydrogen peroxide and put on a shaker for 28 d to remove
sisted of approximately 5 cm of core material. Subsamples            organic material. The pH was kept at a reaction-supporting
were equally distributed along the cores. According to vi-           level between 6 and 8. Subsequently, the samples were
sual changes, we covered all visible stratigraphic layers, and       centrifuged and freeze-dried. A total of 1 g of each sam-
we sampled at least every 50 cm in order to capture specific         ple was mixed with tetra-sodium pyrophosphate 10-hydrate
sediment properties. The samples were weighed and thawed.            (Na4 P2 O7 · 10H2 O) (dispersing agent) and dispersed in an
Intrasedimental ice or, if the sediment was unfrozen during          ammonia solution. The grain size distribution and propor-
drilling, intrasedimental water was extracted using artificial       tions were determined using a Malvern Mastersizer 3000
plant roots (Rhizones) consisting of porous material with a          equipped with a Malvern Hydro LV wet sample dispersion
pore size of 0.15 µm and applied vacuum. In order to avoid           unit. Statistics of the grain size measurements were calcu-
evaporation, the samples were thawed at 4 ◦ C inside their           lated using GRADISTAT 8.0 (Blott and Pye, 2001). The re-
sample bags and sealed tightly after inserting the Rhizones.         sults are used to identify different stratigraphic layers via ma-
These water samples were then analyzed for stable oxygen             terial composition and to deduce sedimentary processes.
and hydrogen isotopes (see Sect. 3.2.5). The ice wedge ice
was subsampled using a saw for the analysis of stable oxy-           3.2.4   Radiocarbon dating
gen and hydrogen isotopes.
                                                                     Radiocarbon dating was done for nine samples using the
3.2.1    Ice content, bulk density and subsampling
                                                                     Mini Carbon Dating System (MICADAS) at AWI Bremer-
The weighed sediment samples were freeze-dried and                   haven. We used bulk sediment samples for dating due to a
weighed again afterwards for the determination of the abso-          lack of macro-organic remains within the deposits. The re-
lute ice content in weight percent. We decided to use the ab-        sults were calibrated with Calib 7.1 software (Stuiver et al.,
solute ice content, as the gravimetric ice content, normalized       2018) using the IntCal13 calibration curve (Reimer et al.,
with the dry sample weight, was not suitable for further cal-        2013). Results are given in calibrated years before present
culations. Ice content within talik areas represents the water       (cal BP). The age–depth model was developed using the “Ba-
content, which subsequently froze after drilling. Bulk den-          con” package in the R environment (Blaauw and Christen,
sity was calculated from the absolute ice content, assuming          2011; Fig. S2).
an ice density of 0.9127 g cm−3 at 0 ◦ C and a mineral density
of 2.65 g cm−3 (Strauss et al., 2012).                               3.2.5   Stable isotopes

3.2.2    Elemental analyses                                          Besides showing a source signal (Meyers, 1997), stable car-
                                                                     bon isotopes can be used as a proxy for the degree of decom-
Subsamples used for elemental analyses were homogenized              position of organic material; this is due to the fact that 12 C is
using a planetary mill (Fritsch PULVERISETTE 5). Subsam-             lost during decomposition and mineralization, resulting in a
ples were then weighed into tin capsules and steel crucibles         higher share of 13 C and, hence, a higher δ 13 C ratio (Fig. S3;
for the elemental analyses. Total carbon (TC), total nitrogen        Diochon and Kellman, 2008).

Biogeosciences, 17, 3797–3814, 2020                                                     https://doi.org/10.5194/bg-17-3797-2020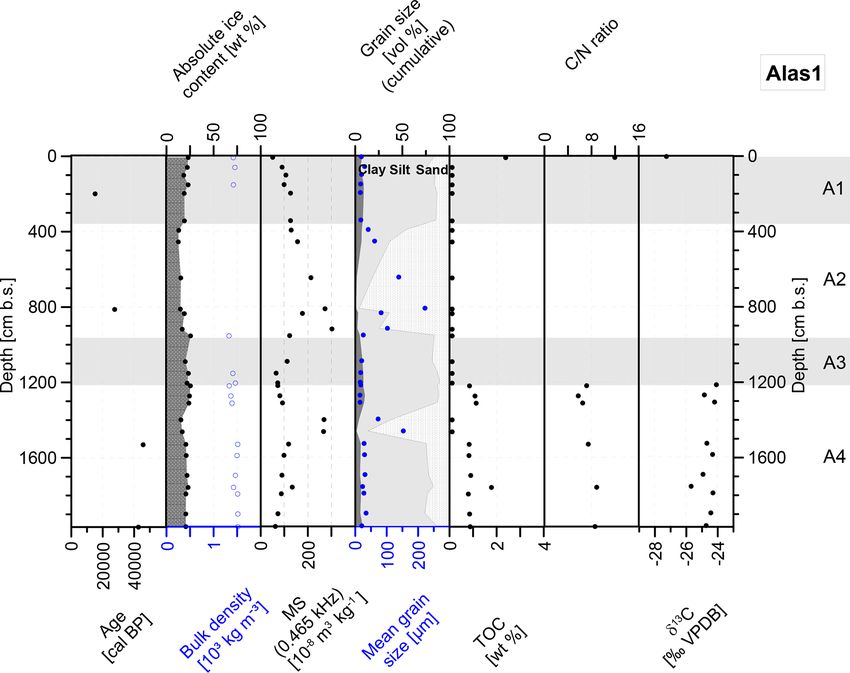
T. Windirsch et al.: Organic carbon characteristics in ice-rich permafrost                                                             3801

   A total of 23 subsamples were ground for δ 13 C analy-                    where the deposit thickness is in meters, the coverage is in
sis, and carbonates were removed by treating the samples                     meters squared, the wedge-ice volume (WIV) is in volume
with hydrochloric acid for 3 h at 97.7 ◦ C. The samples were                 percent, BD is in thousands of kilograms per cubic meter
then vacuum-filtered, dried and weighed into tin capsules                    and TOC is in weight percent. For all TOC values below
for analysis. The stable carbon isotopes were measured us-                   the detection limit (0.1 wt %), a value of 0.05 wt % was set.
ing a DELTA V Advantage isotope ratio mass spectrom-                         Missing bulk density values, resulting from low ice contents
eter supplement equipped with a Flash 2000 organic ele-                      (< 20 wt %) and, therefore, not fully ice-saturated sediments
mental analyzer. The results are compared to the Vienna                      (Strauss et al., 2012), were calculated following Eq. (2),
Pee Dee Belemnite (VPDB) standard and given in per mill                      which describes the relation between TOC and BD in the
(‰) (Coplen et al., 2006) with an analytical accuracy of                     examined cores. This had to be done for 9 samples in YED1
≤ 0.15 ‰.                                                                    and 12 samples in Alas1 (see also Windirsch et al., 2019).
   Stable hydrogen and oxygen isotopes can be used as a tem-
perature proxy. Lower δ 2 H and δ 18 O values indicate lower                 BD = 1.3664−0.115 · TOC                                     (2)
temperatures during precipitation. Samples taken from the
ice wedges generally yield a winter temperature signal (Opel                 The core length of the examined cores was assumed to rep-
et al., 2018), whereas pore ice and pore water signals are                   resent the different ground types, resulting in a deposit thick-
a mix of different seasons with a higher uncertainty due                     ness of 22 m for Yedoma deposits and 20 m for alas deposits.
to alteration and fractionation during deposition and multi-                 A mean wedge-ice volume of 46.3 % for the central Yaku-
ple freeze–thaw cycles as well as evaporation (Meyer et al.,                 tian Yedoma deposits and 7 % for the alas deposits of cen-
2000).                                                                       tral Yakutia was assumed following Ulrich et al. (2014), who
   Our δ 2 H and δ 18 O samples were measured at AWI Pots-                   determined average wedge-ice volumes for several deposit
dam Stable Isotope Laboratory using a Finnigan MAT Delta-                    types in multiple locations in Siberia. We estimated the de-
S mass spectrometer with the equilibration technique follow-                 posit coverage of Yedoma and alas deposits using satellite
ing Horita et al. (1989). In total, 29 samples were measured,                imagery, as shown in Fig. S1. The wedge-ice in YED1 was
of which 16 originated from YED1 pore ice, 8 originated                      excluded in the bootstrapping.
from YED1 wedge ice, and 5 originated from Alas1 pore                           Bootstrapping calculations were carried out following
ice or pore water. The results are given in per mill related                 Jongejans and Strauss (2020) for the upper 3 m, for the dif-
to Standard Mean Ocean Water (‰ vs. SMOW). The analyt-                       ferent core units and for the complete cores (Table 2) using
ical accuracy for δ 2 H was ≤ 0.8 ‰ and it was ≤ 0.1 ‰ for                   the “boot” package in the R environment. Bootstrapping in-
δ 18 O (Meyer et al., 2000). The deuterium excess (d excess;                 cluded 10 000 iterations of random sampling with replace-
d = δ 2 H − 8 · δ 18 O) was also calculated from these values.               ment. We used combined BD and TOC values, as they are
                                                                             not independent, and we corrected for irregular sampling by
                                                                             value replication according to depth interval. We calculated
3.2.6   Statistics and the bootstrapping approach for                        the mean and standard deviation of all iterations.
        carbon budget estimations

For the mean grain size, the mean of each core unit, consist-                4     Results
ing of several samples’ mean values, is given. We estimated
                                                                             4.1    Characteristics of the Yedoma deposits
the carbon budget of the Yukechi alas area following Eq. (1),
using a bootstrapping approach. Bootstrapping is a statisti-                 The Yedoma core YED1 visually appears rather heteroge-
cal method to estimate the sample distribution using resam-                  neous (Fig. 3a) with material varying from fine gray mate-
pling and replacement (Crawley, 2015). Resampling consists                   rial (Fig. 3b.1) to sandy grayish-brown material (Fig. 3b.3)
of drawing randomly selected samples from the dataset (i.e.,                 (Windirsch et al., 2020b). Between 2235 and 1920 cm b.s.
bulk density, BD, and TOC) repeatedly (10 000 iterations),                   and between 691 and 0 cm b.s., brown to black dots up
after which those values are fed into the formula. Replace-                  to 2 cm in diameter may indicate organic-rich material.
ment refers to the fact that the drawn samples in each itera-                Cryostructures include structureless to micro-lenticular ice
tion are available for all following iterations. We used com-                and larger ice veins and bands. The core penetrated an ice
bined BD and TOC values, as they are not independent. In                     wedge between 1005 and 691 cm b.s. and contained an un-
addition, we corrected for irregular sampling by value repli-                frozen layer close to the surface between approximately 200
cation according to depth interval so that values spanning                   and 100 cm b.s., representing a thin initiating talik layer un-
larger intervals had a higher chance of being drawn. We cal-                 derneath the 100 cm thick frozen active layer (Fig. 3a, red).
culated the mean and standard deviation of all iterations.                   All laboratory results are listed in detail in the PANGAEA
                                                                             repository (Windirsch et al., 2019).
                     thickness · coverage ·   100−WIV
                                                        · BD ·   TOC            We divided the Yedoma core into four main Yedoma units
                                                 100             100
OC quantity (kt) =                            3
                                                                       (1)   (Y; Fig. 4). Y4 is the lowest (2235 to 1920 cm b.s.) and old-
                                         10

https://doi.org/10.5194/bg-17-3797-2020                                                             Biogeosciences, 17, 3797–3814, 2020
3802 T. Windirsch et al.: Organic carbon characteristics in ice-rich permafrost
found TOC contents of up to 1.7 wt % (mean of 1.3 wt %).
The C/N ratios within this unit varied between 9.2 and 10.6,
and δ 13 C values ranged between −25.27 and −24.66 ‰ vs.
VPDB (Fig. S3). TN values only reached the detection limit
of 0.1 wt % in 9 out of 36 samples in the whole YED1
core. As just these nine samples exceeded the detection limit
(highest value of 0.16 wt % at 2036 cm b.s.), only they were
used for C/N calculations.
The radiocarbon sample age of Y3 (between 1927 and
1010 cm b.s.) yielded an infinite age (> 49 000 BP) with 14 C
below the detection limit. There is a transition zone between
Y4 and Y3 represented by a diagonal sediment boundary in
the core between 1927 and 1920 cm b.s. (see Fig. 3a). Y3
showed distinctly lower absolute ice contents (< 32.1 wt %).
MS varied between 120.5× 10⁻⁸ and 285.0× 10⁻⁸ m3 kg−1 .
Higher sand contents (> 56.9 vol %) led to an increase in
grain size (72.1 to 191.6 µm) with a mean grain size of
120.5±35.5 µm. Grain size decreased down to 33.3 µm in the
uppermost sample of Y3, and no detectable TOC was found
in this unit.
Y2 (1010 to 714 cm b.s.) consisted of massive wedge ice,
which contained very few sediment inclusions (Fig. 3b.2).
Thus, only water isotopes (δ 2 H and δ 18 O) could be measured
and analyzed. The results are described in Sect. 4.3.
Y1 (714 to 0 cm b.s.) is the uppermost and youngest unit
with carbon ages ranging between 40 608 (589.5 cm b.s.) and
21 890 cal BP (157.5 cm b.s.). The ice content decreased from
the ice wedge towards the surface ranging from 14.6 wt %
(110 cm b.s.) to 57.4 wt % (688 cm b.s.). MS decreased to-
wards the surface from 108.1× 10⁻⁸ to 15.4× 10⁻⁸ m3 kg−1
in the uppermost sample, with a maximum of 118.6 ×
10−8 m3 kg−1 at 298 cm b.s. This unit consisted of fine sed-
iment with a mean grain size of 19.9 ± 4.2 µm. It contained
up to 1.4 wt % TOC (298 cm b.s.). C/N values were in the
range of 9.1 to 12.9. The lowest δ 13 C value was found at
21 cm b.s. with −28.07 ‰ vs. VPDB; the lower part of this
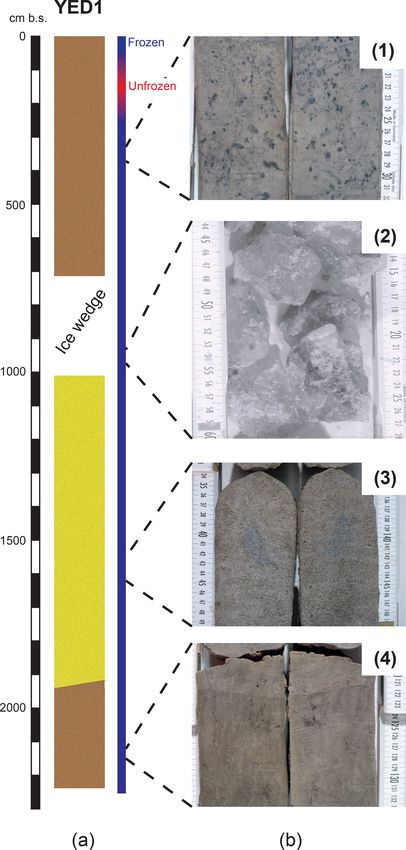
Figure 3. (a) Overview of the Yedoma core. The depth is given section showed a mean value of −24.42 ± 0.6 ‰ vs. VPDB.
in centimeters below the surface (cm b.s.); the state after core re- The grain size distributions (Fig. S5) illustrate the differ-
trieval is given using colors (blue – frozen; red – unfrozen); the
ences between the core units. Silt is the dominant grain size
location of the ice wedge is labeled; brown illustrates silty sedi-
ments and yellow represents sandy sediments. (b) Detailed pictures
class in Y4 and Y1, whereas unit Y3 is dominated by sand.
of the YED1 core: (1) 332–317 cm b.s. – picture of unit Y1 showing The calibrated radiocarbon ages of the Yedoma deposits
black organic-rich inclusions within the gray silty matrix; (2) 960– are listed in Table 1 and assigned to the different core units.
944 cm b.s. – picture of the wedge ice in Y2; (3) 1549–1532 cm b.s. Our age–depth model (Fig. S2a) indicates a steep age–depth
– picture of Y3 showing a coarse sandy material with no visible relationship from approximately 1200 to 2235 cm b.s. and
cryostructures or organic material; (4) 2133–2117 cm b.s. – picture a rather well-defined, gradual age–depth relationship from
of Y4 showing a gray silty matrix with some dark organic dots. 1200 cm b.s. towards the surface (Fig. S2a).
The bootstrapping approach resulted in a mean soil or-
ganic carbon (SOC) estimation of 4.48 ± 1.43 kg m−3 for the
est (radiocarbon age of 49 323 cal BP) stratigraphic unit. The top 3 m of the YED1 core and a mean of 5.27 ± 1.42 kg m−3
absolute ice content slightly increased towards the surface for the entire core (Table 2). We calculated a carbon inven-
(35.8 wt % to 36.6 wt % with a peak value of 53.6 wt % in tory of 56.8 ± 15.2 kt for the Yukechi Yedoma deposits by
between). Magnetic susceptibility (MS) also increased from upscaling the carbon storage to the complete Yedoma cov-
60.7× 10⁻⁸ to 155.4 × 10⁻⁸ m3 kg−1 . The grain size was erage in the Yukechi alas landscape (66.4 %, ∼ 917 000 m2 ;
rather consistent with a mean value of 24.3 ± 3 µm, and the Fig. S1).
soil texture varied between sand and silt (Figs. S4, S5). We
Biogeosciences, 17, 3797–3814, 2020 https://doi.org/10.5194/bg-17-3797-2020T. Windirsch et al.: Organic carbon characteristics in ice-rich permafrost 3803
Figure 4. Characteristics of the Yedoma core YED 1: radiocarbon ages, absolute ice content, bulk density, magnetic susceptibility (MS),
grain size composition, mean grain size, total organic carbon (TOC) content, carbon / nitrogen (C/N) ratio and stable carbon isotope (δ 13 C)
ratio. The hollow circle indicates an infinite radiocarbon (dead) age, and gray and white areas mark the different stratigraphic units (Y1 to
Y4).
Table 1. Radiocarbon measurement data and calibrated ages for the YED1 and Alas1 bulk organic material samples.
Core Mean sample 14 C age ± F14C ± Calibrated ages (2σ )∗ Mean age Core AWI
depth (cm b.s.) (BP) (yr) (%) (cal BP) (cal BP) unit no.
YED1 157.5 18 064 104 0.1055 0.83 21 582–22 221 21 890 Y1 1543.1.1
298 25 973 88 0.0394 1.09 29 822–30 640 30 268 Y1 1544.1.1
589.5 35 965 184 0.0114 2.29 40 116–41 118 40 608 Y1 1545.1.1
1636 > 49 000 n/a 0.0017 6.66 n/a n/a Y3 1547.1.1
1998.5 45 854 501 0.0033 6.23 48 202–calib. limit 49 232 Y4 1548.1.1
Alas1 199 12 826 57 0.2026 0.70 15 144–15 548 15 287 A1 1549.1.1
812.5 23 615 151 0.0529 1.88 27 478–27 976 27 729 A2 1550.1.2
1530.5 42 647 364 0.0049 4.53 45 172–46 619 45 870 A4 1551.1.1
1967.5 39 027 251 0.0078 3.12 42 478–43 262 42 865 A4 1552.1.1
∗ Calibrated using Calib 7.1 (Stuiver et al., 2018) equipped with IntCal 13 (Reimer et al., 2013). n/a – not applicable.
4.2 Characteristics of the alas deposits appearance was more homogeneous than YED1 regarding
color (grayish brown) and material (clayish silt, Fig. 5b.2,
to sandy silt, Fig. 5b.4) (Windirsch et al., 2020a). Cryostruc-
The Alas1 core contains a large proportion of unfrozen sedi-
tures of the frozen core below 750 cm b.s. included horizontal
ment (i.e., talik; ∼ 750 to 160 cm b.s.; Fig. 5a, red), which led
ice lenses up to 5 cm thickness and structureless non-visible
to the loss of some core sections during drilling. The absolute
ice. Blackish dots and lenses (up to 1 cm in diameter) hint
ice content given for samples retrieved from this zone repre-
that organic material is included in the sediments. The frozen
sents absolute water content; samples were frozen directly
after core recovery and field description. The core’s visual
https://doi.org/10.5194/bg-17-3797-2020 Biogeosciences, 17, 3797–3814, 20203804 T. Windirsch et al.: Organic carbon characteristics in ice-rich permafrost
Table 2. SOC contents for the individual core units, based on the bootstrapping results; calculations were carried out for 1 m2 . The measure-
ment data used in the bootstrapping approach (bulk density and TOC density) are provided in the data sheet in the PANGAEA repository.
∗ refers to samples with a TOC content < 0.1 wt %. For the organic carbon pool calculations, we assumed a TOC of 0.05 wt % for these
samples. Note: we excluded unit Y2 from the calculations.
Core Depth (cm b.s.) Number of samples Mean dry bulk density Mean TOC content Mean SOC content,
used in bootstrapping (103 kg m−3 ) (wt %) bootstrapping results (kg m−3 )
YED1 0–300 7 1190 0.42 4.48 ± 1.43
0–714 (unit Y1) 13 1090 0.59 8.31 ± 1.41
1010–1927 (unit Y3) 18 1172 0.10 0.86 ± 0.32
1927–2235 (unit Y4) 5 910 1.14 11.50 ± 1.36
total core 36 1105 0.46 5.27 ± 1.42
Alas1 0–300 5 1257 0.51 6.93 ± 2.90
0–349 (unit A1) 6 1214 0.44 5.00 ± 2.55
349–925 (unit A2) 6 998 0.05∗ 0.50 ± 0
925–1210 (unit A3) 4 1299 0.05∗ 0.66 ± 0.01
1210–1980 (unit A4) 12 1377 0.83 11.03 ± 1.62
Total core 28 1250 0.47 6.07 ± 1.80
sediment of the uppermost 160 cm b.s. represents the season- The characteristics of A2 (925 to 349 cm b.s.) were sim-
ally freezing layer. ilar to those of the sand intrusion found in A4. A radio-
We divided the Alas1 core into four stratigraphic units (A1 carbon age of 27 729 cal BP was measured at 812.5 cm b.s.
to A4), according to soil texture and, if applicable, carbon The absolute ice content had a mean of 15.2 wt % and
content (Fig. 6). The oldest unit is A4 (1980 to 1210 cm b.s.) decreased from 16.7 wt % at 919.5 cm b.s. to 12.9 wt % at
with radiocarbon ages of 42 865 cal BP (1967.5 cm b.s.) and 395 cm b.s. MS decreased upwards from 302.3× 10⁻⁸ to
45 870 cal BP (1530.5 cm b.s.). An age inversion was de- 129.2 × 10⁻⁸ m3 kg−1 . The mean grain size at the bottom
tected here. The absolute ice content did not show a spe- of this unit was 102.3 µm (919.5 cm b.s.); this increased to
cific trend and ranged from 15.3 wt % at 1400.5 cm b.s. to 221.9 µm at 812.15 cm b.s. towards the surface and reached
25.4 wt % at 1220 cm b.s. MS ranged between 62.1× 10⁻⁸ the lowest value of 41.2 µm at the upper boundary of A2
(1967.5 cm b.s.) and 133.9 × 10⁻⁸ m3 kg−1 (1759 cm b.s.) (Fig. S6) with an overall mean of 108.0 ± 59.5 µm. All TOC
with much higher values in a sand intrusion found be- values were below the detection limit.
tween 1530.5 and 1312 cm b.s. (266.7 × 10⁻⁸ m3 kg−1 at The uppermost stratigraphic unit A1 starts at 349 cm b.s. It
1464 cm b.s. and 268.7 × 10⁻⁸ m3 kg−1 at 1400.5 cm b.s.). is the youngest unit of the Alas1 material with a radiocarbon
The mean grain size was constant (35.9 ± 36 µm) except sample at 199 cm b.s. dated to 15 287 cal BP. The absolute
for the sandy intrusion (152.9 µm at 1464 cm b.s., 72.6 µm ice content slightly increased from 19.1 wt % (344.5 cm b.s.)
at 1400.5 cm b.s.), leading to a high standard deviation to 23.1 wt % (9 cm b.s.) throughout this unit. MS de-
(Figs. S4, S6). While TOC values were below the detection creased towards the surface, starting at 126.7× 10⁻⁸ m3 kg−1
limit within this sandy material, the other parts of A4 held (344.5 cm b.s.) and reaching 50.8× 10⁻⁸ m3 kg−1 at 9 cm b.s.
TOC amounts of up to 1.8 wt % (1759 cm b.s.). The C/N ra- The mean grain size decreased again, compared with A2,
tio ranged between 5.8 (1274 cm b.s.) and 8.9 (1759 cm b.s.) representing silty material with values of 18.5+1.4
−1.6 µm. The
with a mean value of 7.4 (Fig. S2). The δ 13 C values showed mean grain size for this unit was 20.0 ± 4.6 µm. TOC was
a range of −25.67 ‰ to −24.06 ‰ vs. VPDB (Fig. S3). Only only detectable in the uppermost sample with a value of
the TN values that exceeded the detection limit, which was 2.4 wt % (9 cm b.s.). The C/N ratio for this sample was 12.0,
the case in 8 out of 28 samples in the entire Alas1 core, were and the δ 13 C was −27.24 ‰ vs. VPDB.
used for C/N ratio calculations. The radiocarbon ages are listed in Table 1. The age–depth
A3 ranged from 1210 to 925 cm b.s. The absolute ice con- model (Fig. S2b) shows a rather continuous slope for all of
tent was stable around 22.7 ± 2.9 wt %. MS increased to- the calibrated ages of Alas1.
wards the surface from 72.1× 10⁻⁸ m3 kg−1 (1205.5 cm b.s.) Bootstrapping resulted in a mean SOC value of 6.93 ±
to 122.6× 10⁻⁸ m3 kg−1 (955 cm b.s.). A3 was characterized 2.90 kg m−3 for the top 3 m of the Alas1 core (Table 2). The
by less coarse material compared with A4 (Fig. S6), with a calculation for the whole core resulted in a mean value of
mean grain size of 19.7 ± 3.7 µm. All TOC values were be- 6.07 ± 1.80 kg m−3 carbon. For the whole alas area within
low the detection limit, so no C/N could be calculated and the Yukechi alas landscape (20.6 %, ∼ 284 000 m2 ; Fig. S1,
no δ 13 C could be measured.
Biogeosciences, 17, 3797–3814, 2020 https://doi.org/10.5194/bg-17-3797-2020T. Windirsch et al.: Organic carbon characteristics in ice-rich permafrost 3805
sample and −30.70 ‰ at 1071.5 cm b.s. with a much less
negative value of −15.53 ‰ closest to the surface. While the
uppermost Yedoma sample had a δ 2 H value of −120.8 ‰, all
of the other Yedoma samples showed much more negative
values between −181.3 ‰ (2209.5 cm b.s.) and −221.6 ‰
(1071.5 cm b.s.). Values almost aligned with the Global Me-
teoric Water Line (GMWL) but also partly with the local
evaporation line (LEL) of central Yakutia (Wetterich et al.,
2008), except for the ice wedge samples of YED1 (Fig. 7a).
The isotope data obtained from the ice wedge samples had
more negative values for both δ 2 H (−220.6 ‰ to −228.6 ‰)
and δ 18 O (−29.58 ‰ to −30.55 ‰) compared with the re-
maining YED1 core. The d-excess values are lowest in the
YED1 ice wedge (lowest value of 9.3). Other values reach
3.5 in the uppermost sample (as an outlier), although they
generally range between 14.7 and 29.5 with no clear trend
visible.
Most of the alas samples were too dry to extract pore water
for water isotope analysis, resulting in a low number of water
samples for this core (Fig. 7c). These Alas1 samples showed
little variance in δ 2 H and δ 18 O data, ranging from −13.33 ‰
(103 cm b.s.) to −15.48 ‰ (1154 cm b.s.) for δ 18 O and from
−130.4 ‰ (61 cm b.s.) to −137.6 ‰ (1464 cm b.s.) for δ 2 H.
d-excess values are lower towards the surface (−22.8 at
61 cm b.s. and −24.3 at 103 cm b.s.) and range from −14.1
to −12.2 in the lower core section.
5 Discussion
5.1 Carbon accumulation and loss at the Yukechi study
site
Figure 5. (a) Overview of the Alas1 core. The depth is given in
centimeters below the surface (cm b.s.); the state after core retrieval We found surprisingly low TOC values in certain core sec-
is given using colors (blue – frozen; red – unfrozen); light brown tions of the Yedoma and alas deposits. These low values
marks silty material, yellow marks sandy material and dark brown appear in core sections with coarser sediments (fine sand),
marks silty material containing more organic material. (b) Detailed
whereas the rather fine sediment layers (silt and sandy silt)
pictures of the Alas1 core: (1) 88–64 cm b.s. – picture of A1 show-
store more TOC. The similarities in sediment structure and
ing the silty gray matrix including dark organic structures; (2) 840–
828 cm b.s. – picture of the sandy A2 unit; (3) 1169–1148 cm b.s. composition of the two cores, in particular between units
– picture of A3 showing a silty gray matrix with some darker or- Y1, Y4 and A4 in terms of grain size composition and OC
ganic dots; (4) 1781–1767 cm b.s. – picture of the fine-grained silt- content, and the increased accumulation rates towards the
dominated A4 unit including black organic-rich inclusions. core bottoms (Fig. S2) indicate that the sedimentary sources’
regime was the same for both cores until approximately
35 000 cal BP (Figs. 4, 6).
green), we calculated a total organic carbon stock of 32.0 ± On the one hand, the low TOC content could result from
9.6 kt using an estimated deposit thickness of 19.8 m. strong organic matter decomposition during accumulation or
during a thawed state, especially in thermokarst deposits. On
4.3 Water isotope analysis of the YED1 and Alas1 core the other hand, it could reflect low carbon inputs. A suit-
able explanation for a low-input scenario is a change in the
Stable hydrogen and oxygen isotope results are shown in sedimentary regime due to fluvial transportation processes,
Fig. 7. We found clear downward trends for δ 18 O and δ 2 H as is explained in more detail in Sect. 5.2. The low sta-
with values becoming more negative between 1000 and ble carbon isotope data of our cores (between −24.06 ‰
400 cm b.s. in the YED1 core (Fig. 7b). Below 1000 cm b.s., and −27.24 ‰) are comparable to other studied sites from
both δ 2 H and δ 18 O become less negative with increasing the Yedoma domain (Schirrmeister et al., 2013; Strauss et
depth. δ 18 O ranged between −25.16 ‰ at the lowermost al., 2013; Jongejans et al., 2018). Our C/N data suggest a
https://doi.org/10.5194/bg-17-3797-2020 Biogeosciences, 17, 3797–3814, 20203806 T. Windirsch et al.: Organic carbon characteristics in ice-rich permafrost Figure 6. Characteristics of the Alas1 core: radiocarbon ages, absolute ice content, bulk density, magnetic susceptibility (MS), grain size composition, mean grain size, total organic carbon (TOC) content, carbon / nitrogen (C/N) ratio and stable carbon isotope (δ 13 C) ratio. The gray and white areas mark the different stratigraphic units (A1 to A4). Figure 7. The characteristics of water stable isotopes in the studied sediment cores. (a) Stable hydrogen (δ 2 H) and oxygen (δ 18 O) isotope ratios of YED1 pore ice (black triangles), YED1 ice wedge ice (hollow triangles), and Alas1 pore ice and pore water (black dots; ‰ vs. SMOW). Global Meteoric Water Line (GMWL): δ 2 H = 8 · δ 18 O + 10; local evaporation line (LEL) of central Yakutia (based on data compiled until 2005 following Wetterich et al., 2008). (b) Oxygen isotopes, hydrogen isotopes and d-excess values of YED1 plotted over depth. (c) Oxygen isotopes, hydrogen isotopes and d-excess values of Alas1 plotted over depth. Biogeosciences, 17, 3797–3814, 2020 https://doi.org/10.5194/bg-17-3797-2020
T. Windirsch et al.: Organic carbon characteristics in ice-rich permafrost                                                  3807

fairly homogeneous source signal of the organic material.         5.2   Yedoma and alas development
Both cores show the lowest δ 13 C values closest to the sur-
face as the organic material is the most recent and, there-       The differences in ice content between both cores and the
fore, the least decomposed. In deeper sections of the cores,      homogeneous ice content throughout the whole Alas1 core
δ 13 C is higher (less negative) with no general trend over       indicate that thaw processes influenced the alas deposit. As
depth in the alas and Yedoma deposits. This indicates that        described above, this is supported by the water isotope sig-
the present material was already further decomposed when it       nals, which are quite homogeneous throughout Alas1. This is
became frozen. We see that decomposition ceased once the          the quantitative evidence that these deposits have been previ-
deposits froze; therefore, δ 13 C values do not show a clear      ously thawed under thermokarst influence. The homogeneity
trend at depth. The C/N ratios in both cores support this hy-     in water isotopes is an outcome of percolating surface water
pothesis and are in line with the results found by Strauss        during a thawed state. Subsequent talik refreezing in sandy
et al. (2015) and Weiss et al. (2016) for other Yedoma and        sediments led to the formation of structureless pore ice, form-
alas sites in Siberia. In comparison to the mean C/N ratio        ing a taberal deposit (Wetterich et al., 2009). Refreezing, in
of 10 in YED1, the mean C/N ratio of 8 for Alas1 indicates        our case, started from the surrounding frozen ground rather
that the alas deposits are slightly more affected by decom-       than from the surface, as a talik is still present in the up-
position due to their temporary thawed state during the lake      per core part. This allowed for the formation of structureless,
phase. As the carbon was freeze-locked in the YED1 core           invisible to micro-lenticular ice structures in the sandy mate-
from the time it was frozen, it did not decomposed after de-      rial providing relatively large pore spaces (French and Shur,
position. The Yukechi C/N ratios are on the lower end of          2010). Due to the formation of those small ice structures,
C/N ratios known from other Yedoma deposits, e.g., from           no sediment mobilization by the formation of, for example,
the Bykovsky Peninsula (Schirrmeister et al., 2013) and Du-       large ice bands occurred in this core, resulting in an unmixed
vanny Yar (Strauss et al., 2012). The hypothesis of an input      and clearly layered sediment. This also excludes cryoturba-
of organic-poor and already pre-decomposed material is sup-       tional processes as an explanation for the age inversions that
ported by the fact that both cores, Alas1 and YED1, show          we found.
low C/N ratios. The carbon characteristics indicate that the         The perennially frozen conditions since the incorporation
low carbon content results from low carbon input rather than      of the Yedoma deposits into permafrost at YED1 are sup-
decomposition in both cores, as no evidence for conditions        ported by the water isotope signals (Fig. 7) with much lower
favoring high decomposition rates is found. Therefore, the        δ 18 O values for the Yedoma pore ice in comparison with the
low carbon content is likely not the result of strong decompo-    uppermost sample (4 cm b.s. in YED1). The latter shows a
sition during aquatic conditions of a lake-covered state but is   water isotope signal reflecting very recent climate and freez-
a legacy of the source material. For a “decomposition during      ing, thawing and evaporation processes in the active layer. If
lake phase” scenario, organic carbon parameters would differ      the Yedoma core had been thawed at some point, intruding
largely in carbon content and isotope signature from those of     water would have led to a more homogeneous oxygen iso-
the still frozen Yedoma (Walter Anthony et al., 2014).            tope signal throughout the core, as is obvious in the alas core.
   We found age inversions in both cores with a similar           Also, the intact ice wedge provides evidence of a perennially
age and depth (YED1 49 232 cal BP, 1998.5 cm b.s.; Alas1          frozen state throughout the depositional history at YED1.
42 865 cal BP, 1967.5 cm b.s.) (Figs. 4, 6 and S2) which is       The stable isotope ratio values of wedge ice (mean δ 18 O of
typical for many Yedoma sites (Schirrmeister et al., 2002).       −30 ‰ and mean δ 2 H of −224 ‰) reflect winter precipi-
While cryoturbation might seem like an obvious explanation,       tation and fit well into the regional pattern for Marine Iso-
we suggest that this process did not play a major role here due   tope Stage (MIS) 3 ice wedges in central and interior Yaku-
to the long-term frozen state of YED1. Rather, we assume          tia (Popp et al., 2006; Opel et al., 2019), whereas the d ex-
that the age inversions indicate a temporary shift in sediment    cess shows a much elevated value (16 ‰) compared with the
input at approximately 35 000 cal BP. This could have caused      regional pattern (Popp et al., 2006; Opel et al., 2019). The
some in-deposit reworking in the watershed and the incorpo-       d-excess values from the middle part of the ice wedge cor-
ration of older material into younger sediments. In addition,     respond well to the regional values from Mamontova Gora,
the dating of bulk sediments very close to the maximum dat-       Tanda and Batagay (Opel et al., 2019), whereas the oth-
able age of approximately 50 000 BP may cause a high uncer-       ers resemble those of the host sediments and are potentially
tainty in the absolute ages of sediment layers (Reimer et al.,    overprinted by exchange processes between wedge ice and
2013). Therefore, the rather small age inversions (> 49 000       pore ice (Meyer et al., 2010). Due to the low number of
to 49 232 cal BP in YED1, and 45 870 to 42 865 cal BP in          data points, no meaningful co-isotopic regression was calcu-
Alas1) could be a result of material mixture in dated bulk        lated. The stable isotope composition of pore ice shows a co-
samples. The radiocarbon ages above this age inversion align      isotopic regression of δ 2 H = 6.61 δ 18 O − 18.0 (R 2 = 0.97,
well with a simulated sedimentation rate, as shown in Fig. S2.    n = 23), which is typical for Yedoma intrasedimental ice
                                                                  (Wetterich et al., 2011, 2014, 2016). The isotope values plot
                                                                  well above the regional Local Meteoric Water Line of the

https://doi.org/10.5194/bg-17-3797-2020                                                  Biogeosciences, 17, 3797–3814, 2020
3808 T. Windirsch et al.: Organic carbon characteristics in ice-rich permafrost cold season (Papina et al., 2017), suggesting a substantial and, therefore, the sediment carrying capacity of the wind proportion of (early) winter precipitation – usually character- (Pye, 1995). A shift in the eastern Siberian climate during the ized by high d-excess values – for the pore ice, which is also beginning of the Kargin interstadial (MIS 3, ∼ 50 000 BP) re- evident for some units of the Batagay megaslump (Opel et sulted in higher winter temperatures (Diekmann et al., 2017) al., 2019). The decreasing trend in pore ice isotopic δ values and, therefore, higher pressure gradients within the atmo- from the bottom to the top indicates a general cooling in cen- sphere, leading to greater wind speeds. This, in turn, resulted tral Yakutia during the time span covered by our study. How- in a higher sediment carrying capacity of the wind which ever, as it is accompanied by an opposite increasing trend provides a suitable explanation for the sediment differences. in d excess, these values may be overprinted by secondary Also, sand dunes of the Lena River valley (Huh et al., 1998) freeze–thaw processes in the active layer and rather reflect could have provided sufficient sandy material throughout the the intensity of these fractionation processes (Wetterich et formation of the sand layers found in the Yukechi deposits al., 2014). (Y3 and A2 in Figs. 4 and 6). The radiocarbon ages of these The age–depth models of both cores show steep curves coarser core segments (Y3 and A2 in Figs. 4 and 6) dated and higher sedimentation rates at the bottom of the cores, between 39 000 and 18 000 cal BP match the timing of these which slow down towards the surface (Figs. 4, 6 and S2). climatic changes. Increased wind speeds at the beginning of This indicates that the depositional environment at Alas1 was a warmer interstadial phase during the MIS 3 (Karginian cli- the same as at YED1 during the early phase of the sediment mate optimum from 50 000 to 30 000 BP) and a subsequent accumulation (∼ 45 000 to 35 000 cal BP). The steepness of decrease in wind speed during the colder stadial MIS 2 are the age–depth model suggests an upward decrease in the ac- a suitable explanation (Diekmann et al., 2017). Those in- cumulation rate or can be interpreted as an increase in sur- creased wind speeds could have led to further transport of face erosion towards the top of the YED1 core (Fig. S3a). the coarser material from the source area, enabling these ma- Especially the sandy core part (Y3) accumulated rapidly, terials to reach our study area (Anderson et al., 1991). as indicated by the radiocarbon sample below dated to From our data we see that the sandy layers were de- 49 232 cal BP (71.5 cm below the bottom of Y3) and the next posited in approximately 7000 years (radiocarbon dates be- radiocarbon sample above dated to 40 608 cal BP (420 cm low and above these layers). As the sediments are rather above the top of Y3). Therefore, these 917 cm of Y3 accu- coarse (115.3 µm mean grain size), a fluvial deposition is mulated in less than 8600 years, whereas the accumulation more likely than an aeolian deposition (Strauss et al., 2012). of 714 cm in Y1 took more than 18 700 years (40 608 cal BP Moreover, the lack of organic material makes fluvial depo- at 589.5 cm b.s. and 21 890 cal BP at 157.5 cm b.s.; Table 1). sition the more plausible process. Thus, we think that peri- The continuous steepness of the age–depth model of Alas1 odic flooding events of Lena River tributaries near our study (Fig. S2b) suggests a rather constant accumulation rate area are a more likely source of the sediments. The origi- throughout the deposition of these sediments. nal Yedoma deposits of the Yukechi area were most likely Due to the alternation of coarse and carbon-poor material formed by deposition of silty sediments and fine organic ma- (i.e., Y3 and A2, see Figs. 4 and 6) with fine carbon-rich terial during seasonal alluvial flooding. The climatic changes material (i.e., Y1 and Y4 in Fig. 4 and A4 in Fig. 6), we sug- (Diekmann et al., 2017; Murton et al., 2017) and the resulting gest shifts in the sedimentary regime at the Yukechi study higher water availability during the deposition period of the site (Soloviev, 1973; Ulrich et al., 2017a, b). This hypothe- sandy layers may have caused changes in fluvial patterns on sis is supported by the MS results, which give higher values the Abalakh Terrace. More water could cause higher flow ve- for sandy core parts, hinting at a different material source, locities under warmer climatic conditions and, therefore, in- compared with the silty and carbon-bearing core units. Due creased erosive power, leading to the formation of new flow to the great thickness of those sandy layers (core units 1 to channels (Reineck and Singh, 1980). 4 in Figs. 4 and 6), the most suitable explanation is material With a climatic backshift to colder conditions during transport by tributaries on top of the (former) Yedoma up- MIS 2, water availability decreased and silty organic-bearing lands of the Abalakh Terrace. This indicates that the sandy material was again deposited by seasonal flooding on top of material in the studied cores was deposited during the river- the sandy layers. This likely led to lake initiation on top of connected flooding phases at our study site. Moreover, fluvial the Yedoma deposits. The underlying ground began to thaw transport gives a suitable explanation for low carbon content, and subside, forming the Yukechi alas basin. During this pro- as organic matter decomposition is often much higher un- cess, ice was lost from the sediment and the ground subsided der aquatic conditions (Cole et al., 2001). Furthermore, high by at least 9 m (height difference of 9 m between YED1 and flow velocity allows larger particles to be deposited, but it Alas1 surface). Surface or lake water was able to percolate keeps lighter particles, like organic material, in suspension through the unfrozen sediments. This is revealed by the ho- (Anderson et al., 1991; Wilcock and Crowe, 2003; Reineck mogeneous water isotope signal that is similar to the YED1 and Singh, 2012). surface sample (Fig. 7). Under the unfrozen aquatic condi- Another explanation for the occurrence of these carbon- tions in the sediment, microbial activity started, resulting in poor sandy layers is shifts in wind direction and wind speed the decomposition of the already small amount of organic Biogeosciences, 17, 3797–3814, 2020 https://doi.org/10.5194/bg-17-3797-2020
T. Windirsch et al.: Organic carbon characteristics in ice-rich permafrost                                                    3809

material (Cole et al., 2001). When the lake drained, the sed-        grassland-covered alas deposits in a setting similar to the
iments started to refreeze both upward from the underlying           Yukechi site.
permafrost and downward from the surface, leaving a talik               In general, Yedoma deposits are estimated to hold
in between (Fig. 5). The subsided ground indicates that core         10+7
                                                                        −6 kg m
                                                                                −3 for the whole column within the Pleistocene

unit A4 (Fig. 6) lay beneath the lowest unit of the Yedoma           Yedoma deposits (approximate depth of 25 m; Strauss et
core, Y4 (Fig. 4), while units A1 to A3 shrank due to thaw-          al., 2013). Jongejans et al. (2018) calculated a larger or-
ing from approximately 2200 to 1200 cm in length. The pres-          ganic carbon stock of 15.3±1.6 kg m−3 for Yedoma deposits
ence of large ice wedges in the area supports this theory of         found on the Baldwin Peninsula in Alaska. Another study
ground subsidence during thaw, as it hints at the large ex-          by Shmelev et al. (2017) reported a Yedoma carbon stock of
cess ice contents of the ground (Fig. S7; Soloviev, 1959).           14.0 ± 23.5 kg m−3 for a study region in northeastern Siberia
These subsidence processes might represent the future path           between the Indigirka River and the Kolyma River.
of the Yukechi Yedoma deposits, as an initiating talik of ap-           Assessing the carbon inventory of the full-length central
proximately 150 cm thickness has already been found at the           Yakutian cores examined in this study, we estimated an or-
YED1 site (Fig. 3a). This is caused by ground temperature            ganic carbon density of 5.27±1.42 kg m−3 for the sediments
warming which itself is affected by snow layer thickness and         of the YED1 core down to a depth of 22.12 m b.s., exclud-
air temperatures among other factors and could lead to alas          ing the ice wedge. The organic carbon density within the
development (Ulrich et al., 2017a).                                  Yukechi Yedoma is approximately 2–3 times lower than esti-
                                                                     mated in previous studies of deep Yedoma deposits (Strauss
5.3   Central Yakutian Yedoma deposits in a                          et al., 2013; Shmelev et al., 2017; Jongejans et al., 2018).
      circumpolar and regional context                               Even when including roughly 10 m of organic carbon-free
                                                                     material, the higher carbon densities for the whole cores
Strauss et al. (2017) reported a mean organic carbon den-            (compared with the carbon densities of the first 3 m) show
sity for the upper 3 m of Yedoma deposits in the Lena–               that large portions of organic carbon are stored below 3 m.
Aldan interfluve of 25 to 33 kg m−3 based on the data of Ro-         The Alas1 core contains slightly more organic carbon with
manovskii (1993) and Hugelius et al. (2014). Using a boot-           a mean value of 6.07 ± 1.80 kg m−3 organic carbon for the
strapping approach (Jongejans and Strauss, 2020) we found            whole core (19.72 m), which is about 20 % of the mean
a much lower organic carbon density of 4.48 ± 1.43 kg m−3            thermokarst deposit carbon content of 31+23  −18 kg m
                                                                                                                           −3 stated

for the top 3 m of the YED1 core. For Alas1, an organic              by Strauss et al. (2017). Within the alas core, organic carbon
carbon density of 6.93 ± 2.90 kg m−3 was calculated for the          storage is slightly higher in the top 3 m (approximately 14 %
top 3 m. Taking both the area covered by each deposit type           more than below). This is likely a result of former lake cover-
within the Yukechi alas landscape and the ice wedge volumes          age that led to an accumulation of the organically richer lake
estimated by Ulrich et al. (2014; see Sect. 2 and Fig. S2)           sediments found in the upper section of Alas1. Most likely
into account, we find a mean organic carbon density of only          there was enhanced growth of aquatic plants along with a re-
4.40 kg m−3 for the top 3 m of dry soil at the Yukechi study         duction in the decomposition of the input organic material
site. This landscape-scale carbon stock density includes the         due to anaerobic conditions during the lake phase.
entire study area (1.4 km2 ), as well as all water bodies (ap-
proximately 0.18 km2 ), which we assumed to contain no soil
carbon. This means that both the average Yukechi site car-           6   Conclusions
bon density and our individual cores’ carbon densities are
                                                                     We conclude that the low organic carbon contents encoun-
substantially below the range (25 to 33 kg m−3 ) reported by
                                                                     tered in sections of both cores are not caused by the decom-
Strauss et al. (2017). This strong difference between previ-
                                                                     position of originally high organic matter contents but are
ously published information and our new data from the same
                                                                     rather a legacy of the accumulation of organic-poor mate-
region can only be explained by the high depositional hetero-
                                                                     rial during the late Pleistocene MIS 3 and MIS 2 periods.
geneity of the central Yakutian permafrost landscapes which
                                                                     The most likely landscape scenario causing the differences
was not represented in sufficient detail in the earlier dataset
                                                                     in sediment and organic carbon characteristics during the
of Strauss et al. (2017). Geographically, the Yukechi area
                                                                     Pleistocene deposition is the temporary existence of tributary
is located in one of the southernmost Yedoma areas in the
                                                                     rivers on the Abalakh Terrace with varying flow velocities
Yedoma domain, which could be a reason for the differences
                                                                     and alternating paths as a result of climatic changes or local
from previously studied Arctic deposits (Schirrmeister et al.,
                                                                     landscape dynamics. While the sedimentation on the Yedoma
2013; Strauss et al., 2013; Jongejans et al., 2018). The re-
                                                                     upland ceased with the onset of the Holocene, the alas was
sults of Siewert et al. (2015) for the Spasskaya Pad/Neleger
                                                                     affected by thaw, subsidence and lake formation processes,
site in a similar setting also differ greatly from our findings at
                                                                     resulting in a compaction of sediments in situ as well as caus-
the Yukechi site, showing carbon densities of approximately
                                                                     ing higher carbon inputs under lacustrine conditions in the
19.3 kg m−3 for the top 2 m of larch forest-covered Yedoma
                                                                     upper parts of the sediments.
deposits and approximately 21.9 kg m−3 for the top 2 m of

https://doi.org/10.5194/bg-17-3797-2020                                                     Biogeosciences, 17, 3797–3814, 2020
You can also read