The Arctic picoeukaryote Micromonas pusilla benefits from ocean acidification under constant and dynamic light - EPIC
←
→
Page content transcription
If your browser does not render page correctly, please read the page content below
Biogeosciences, 17, 635–647, 2020
https://doi.org/10.5194/bg-17-635-2020
© Author(s) 2020. This work is distributed under
the Creative Commons Attribution 4.0 License.
The Arctic picoeukaryote Micromonas pusilla benefits from ocean
acidification under constant and dynamic light
Emily White1 , Clara J. M. Hoppe1 , and Björn Rost1,2
1 Alfred-Wegener-Institut, Helmholtz-Zentrum für Polar- und Meeresforschung, 27570 Bremerhaven, Germany
2 Fachbereich Biologie/Chemie, Universität Bremen, Leobener Strasse, 28359 Bremen, Germany
Correspondence: Emily White (ewhite14@msn.com)
Received: 28 August 2019 – Discussion started: 30 August 2019
Revised: 18 December 2019 – Accepted: 30 December 2019 – Published: 7 February 2020
Abstract. Compared to the rest of the globe, the Arctic 1 Introduction
Ocean is affected disproportionately by climate change. De-
spite these fast environmental changes, we currently know
little about the effects of ocean acidification (OA) on marine Alterations to the ecosystem caused by climate change are
key species in this area. Moreover, the existing studies typ- far more pronounced in the Arctic than in the rest of the
ically test the effects of OA under constant, hence artificial, world (Pörtner et al., 2014). The increase in pCO2 and con-
light fields. In this study, the abundant Arctic picoeukary- comitant decrease in seawater pH, for instance, is particu-
ote Micromonas pusilla was acclimated to current (400 µatm) larly fast in the Arctic Ocean, which is mainly due to the
and future (1000 µatm) pCO2 levels under a constant as well higher solubility of CO2 at low water temperatures (Bates
as a dynamic light, simulating more realistic light fields as and Mathis, 2009). Many studies have investigated the effects
experienced in the upper mixed layer. To describe and un- of ocean acidification (OA) on phytoplankton and have ob-
derstand the responses to these drivers, growth, particulate served species-specific responses on the physiological level
organic carbon (POC) production, elemental composition, (Lohbeck et al., 2012; Riebesell and Tortell, 2011; Rost et al.,
photophysiology and reactive oxygen species (ROS) produc- 2008). The negative effects of OA are thought to result from
tion were analysed. M. pusilla was able to benefit from OA disturbed ion homeostasis under decreasing pH, while posi-
on various scales, ranging from an increase in growth rates tive responses seem to be driven by the physiological mecha-
to enhanced photosynthetic capacity, irrespective of the light nisms of inorganic carbon uptake (Bach et al., 2013; Rokitta
regime. These beneficial effects were, however, not reflected et al., 2012). Photosynthesis requires CO2 as a substrate for
in the POC production rates, which can be explained by en- the carbon-fixing enzyme RuBisCO, which is however char-
ergy partitioning towards cell division rather than biomass acterized by a poor substrate affinity (Badger et al., 1998). To
build-up. In the dynamic light regime, M. pusilla was able avoid CO2 limitation arising from this, larger phytoplankton
to optimize its photophysiology for effective light usage dur- especially typically depend on carbon-concentrating mecha-
ing both low- and high-light periods. This photoacclimative nisms (CCMs). These CCMs involve the transport of CO2
response, which was achieved by modifications to photosys- and/or HCO− 3 into the cell and the prevention of leakage
tem II (PSII), imposed high metabolic costs leading to a re- out of the cell, as well as the expression of carbonic anhy-
duction in growth and POC production rates when compared drase, an enzyme accelerating the interconversion between
to constant light. There were no significant interactions ob- CO2 and HCO− 3 (Reinfelder, 2011). As CCMs are energet-
served between dynamic light and OA, indicating that M. ically expensive, a potential downregulation under OA may
pusilla is able to maintain effective photoacclimation with- be beneficial for phytoplankton (Hopkinson et al., 2011).
out increased photoinactivation under high pCO2 . Based on Also the rates of warming are 2 to 3 times faster than the
these findings, M. pusilla is likely to cope well with future global average (Trenberth et al., 2007), a phenomenon known
conditions in the Arctic Ocean. as Arctic amplification (Miller et al., 2010). Warming causes
changes to mixing regimes in the surface ocean (Houghton
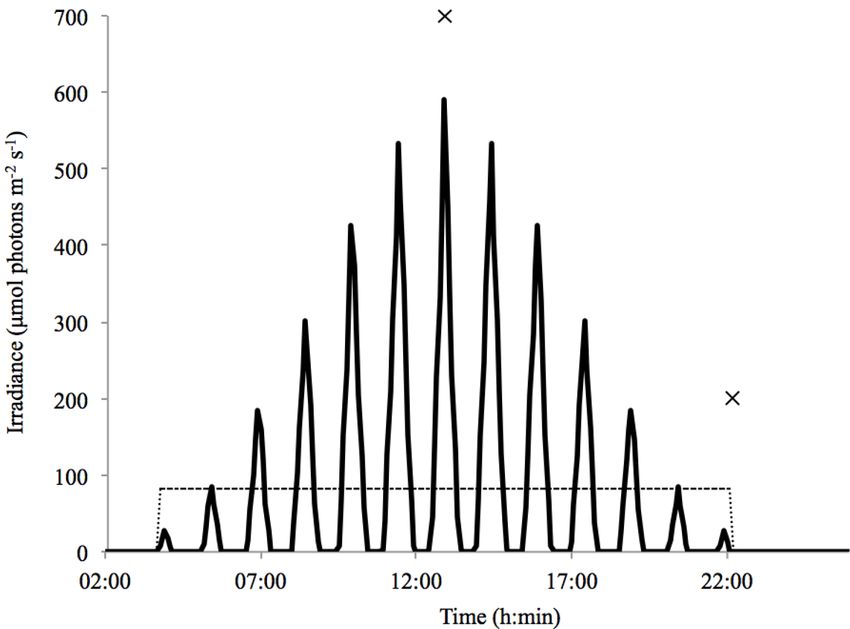
Published by Copernicus Publications on behalf of the European Geosciences Union.636 E. White et al.: Micromonas pusilla benefits from ocean acidification under dynamic light et al., 2001), probably leading to a shoaling of the mixed that smaller phytoplankton will thrive under future OA con- layer due to increased thermal stratification and freshening ditions (Brussaard et al., 2013; Engel et al., 2008; Hoppe et caused by sea-ice melting (Steinacher et al., 2010). Further- al., 2017, 2018; Maat et al., 2014; Meakin and Wyman, 2011; more, models predict that the Arctic Ocean will become Schulz et al., 2017) and are regarded as potential “winners” more frequently nearly ice-free during the summer months of climate change (e.g. Hoppe et al., 2018; Li et al., 2009; (Pachauri et al., 2014). With a decrease in sea-ice cover, the Schulz et al., 2017). primary productivity in the Arctic is expected to increase, Despite their prevalence in all marine habitats, the effect due to higher light availability and longer growing seasons of natural light variability has been mostly ignored in pre- for phytoplankton (Arrigo et al., 2008). At the same time, vious studies on OA effects. Fluctuating light has however however, annual productivity may become increasingly lim- been reported to indeed affect phytoplankton photosynthe- ited by the low nutrient supply in the Arctic Ocean, which sis and growth (Falkowski, 1980; Huisman, 1999; Köhler may decrease even further due to reduced upwelling (Trem- et al., 2018; Litchman, 2000; Litchman et al., 2004). Inter- blay et al., 2015; Wassmann and Reigstad, 2011). These en- active effects between dynamic light regimes and OA have vironmental changes in the Arctic have already led to dif- been observed in the coccolithophore Gephyrocapsa ocean- ferences in community structure and are expected to cause ica, causing decreased productivity (Jin et al., 2013). Hoppe more dramatic regime shifts in the future (e.g. Nöthig et al., et al. (2015) reported that the Antarctic diatom Chaetoceros 2015; Li et al., 2009). In addition to accelerated rates of OA debilis benefitted from OA under static irradiance, while a and warming (Pörtner et al., 2014; Trenberth et al., 2007), dynamic light regime reversed this positive response. This the Arctic is affected by strong changes in wind and weather was attributed to the fact that OA-dependent downregulation patterns (Hu and Bates, 2018), indicating that this region is of the CCM can expose cells to oxidative stress during high- disproportionately affected by overall climate change. light peaks under dynamic light (Hoppe et al., 2015). Ox- Next to climate-driven changes, phytoplankton growing in idative stress occurs when the production of reactive oxy- the turbulent upper mixed layer must generally acclimate to gen species (ROS) exceeds the defensive mechanisms for the dynamics of light availability. Due to the low-light peri- ROS reduction, leading to accumulation in the cells (Apel ods in such dynamic light fields, phytoplankton, on the one and Hirt, 2004). In this study, the response of M. pusilla to hand, need to increase the light harvesting efficiency, e.g. OA was investigated under constant and dynamic light in or- by increasing the photosynthetic pigments like chlorophyll a der to determine whether there was an interactive effect of (Chl a; Palmer et al., 2013). In the high-light periods, on the the two environmental factors. A particular focus was laid on other hand, photoprotective mechanisms need to be activated the physiological mechanisms that determined the observed to prevent photodamage to cells (Ragni et al., 2008). There overall responses. are species-specific differences in the responses to differing light regimes, which can include changes in the number of photoprotective pigments, different photorepair mechanisms 2 Materials and methods and modifications to the number of reaction centres in PSII (photosystem II; Ragni et al., 2008). Such acclimatory re- 2.1 Experimental setup sponses may be particularly important in the Arctic shelf seas, where high organic matter loading leads to particularly Monoclonal cultures of the picoeukaryote M. pusilla (iso- high light attenuation with depth (Granskog et al., 2012). lated in 2014 by Klara Wolf in Kongsfjorden, Svalbard, In the world’s oceans, the picoplankton-size fraction 79◦ N) were grown in l L glass bottles in semi-continuous (< 2 µm) is a significant contributor to overall productivity dilute batch cultures (max 158 000 cells mL−1 ; diluted every (Worden et al., 2015) and Micromonas-like picoeukaryotes 3–5 d). The temperature remained stable at 2.6 ± 0.2 ◦ C. The are also highly abundant in the Arctic region (Lovejoy et al., media was composed of Arctic seawater (from Hausgarten 2007). Micromonas has been described as a shade-adapted observatory, Alfred-Wegener-Institut, 78◦ N, collected dur- species that can persist in Arctic winter darkness (Marquardt ing an RV Maria S. Merian cruise in 2013) filtered through et al., 2016) with the help of mixotrophy (McKie-Krisberg a 0.2 µm membrane filter capsule (Sartorius Stedim Biotech, and Sanders, 2014). Such low-light-adapted organisms are Sartobran 300) and enriched with vitamins and trace met- thought to show a lack of plasticity with regard to Chl a als in accordance with the F/2 protocol (Guillard and Ry- quota and photoacclimation (Talmy et al., 2013). Smaller ther, 1962), as well as with macronutrients in Redfield pro- phytoplankton are furthermore expected to particularly ben- portions (containing 100 µmol L−1 nitrate and silicate and efit from reduced nutrients under enhanced stratification due 6.2 µmol L−1 phosphate). to their high surface : volume ratio, which allows them to Both the constant and the dynamic light regime consisted take up nutrients more efficiently (Brussaard et al., 2013). of a 20 : 4 h light : dark cycle with an average light inten- For the same reasons, picoeukaryotes may benefit from el- sity of 83±5 µmol photons m2 s−1 . The dynamic light regime evated pCO2 levels due to increased CO2 diffusion into the varied between 0 and 590 µmol photons m2 s−1 (Fig. 1). cell. Concurrently, it has been shown in different experiments These light levels were calculated based on conditions Biogeosciences, 17, 635–647, 2020 www.biogeosciences.net/17/635/2020/
E. White et al.: Micromonas pusilla benefits from ocean acidification under dynamic light                                           637

                                                                        2.2   Carbonate chemistry

                                                                        Samples for seawater pH were collected at the start and mid-
                                                                        dle of the experiment (during mid-light phase) and at the end
                                                                        of the experiment (during the first hour of the dark phase).
                                                                        Seawater pH was determined potentiometrically, using a 2-
                                                                        point-calibrated glass reference electrode (IoLine, SCHOTT
                                                                        Instruments) and pH meter (826 pH mobile, Metrohm), and
                                                                        was reported on the NBS scale for incubation temperatures.
                                                                        pH values were temperature-corrected using the CO2SYS
                                                                        program (Pierrot et al., 2006) to 2 ◦ C.
                                                                            The samples for dissolved inorganic carbon (CT ) measure-
                                                                        ments were gently filtered through a sterile 0.2 µm Nalgene
                                                                        syringe filter (Nalgene, Thermo Scientific) and stored in the
                                                                        dark at 2 ◦ C in 5 mL borosilicate bottles. The sample was
                                                                        subsequently analysed colorimetrically in duplicate using an
Figure 1. Light regimes plotted as a function of time over a 24 h
                                                                        autoanalyser (Seal Analytical; Stoll et al., 2001) with a repro-
period. Indicated are the dynamic light cycle (solid line) and the
constant light cycle (dashed line). Time points 1 and 2 are displayed   ducibility of ±8 µmol kg−1 (Table 1). A certified reference
at midday and in the evening at the start of the dark period (×).       standard material (CRM) was used to correct for measure-
                                                                        ment errors (Dickson et al., 2007). The final average CT val-
                                                                        ues were 2141 ± 23 µmol kg−1 at ambient pCO2 levels and
typically observed in the Arctic Kongsfjorden (Svalbard,                2209 ± 11 µmol kg−1 under high pCO2 (Table 1).
79◦ N) in late spring, using maximum surface irradiance of                  The total alkalinity (AT ) samples were gently filtered
905 µmol photons m2 s−1 , a mixed-layer depth of 20 m, an               through pre-combusted 25 mm GF/F filters (glass microfiber
extinction coefficient of 0.35 m−1 (Clara J. M. Hoppe, un-              filter, Whatman, GE Healthcare Life Sciences) and stored in
published results) and a vertical mixing rate of 0.011 m s−1            125 mL dark borosilicate bottles at 2 ◦ C. Standards and sam-
(Denman and Gargett, 1983). The dynamic light field acts to             ples were equilibrated to room temperature prior to potentio-
approximate natural light conditions, assuming homogenous               metric titrations (Brewer et al., 1986) of two 25 mL subsam-
mixing and diurnal changes in incoming irradiance but no                ples with an autoanalyser (TitroLine alpha plus, SCHOTT
weather-associated variability. Light was supplied through              Instruments). An internal standard was applied to correct for
LED lamps (ECONLUX, Solar Stinger Sunstrip), and the                    systematic errors based on measurements of CRMs, and the
dynamic light regime was regulated using a daylight con-                data were processed using TitriSoft 2.71 software. The cor-
troller (LED scaping light control, LiWeBe). In both setups,            rected final AT values ranged between 2194 ± 8 and 2215 ±
the light levels were monitored using a ULM-500 universal               5 µmol kg−1 (Table 1).
light meter with a 4π sensor (Effeltrich), and light intensity              The full carbonate system was calculated with a salinity
was adjusted with neutral density screens.                              of 32.2 and a temperature of 2 ◦ C using the pH and AT data
   The CO2 partial pressures (pCO2 ) were achieved through              with the CO2SYS program (Pierrot et al., 2006), following
aeration of the incubation bottles with two different pCO2              suggestions by Hoppe et al. (2012; Table 1). The calcula-
levels (400 and 1000 µatm) for at least 12 h prior to inoc-             tions used constants of Mehrbach et al. (1973) with a refit by
ulation. The gas mixtures were created using a gas flow                 Dickson and Millero (1987) and a (B)T value according to
controller (CGM 2000, Umwelttechnik MCZ), which mixed                   Uppström (1974). The carbonate system remained stable for
pure CO2 with CO2 -free air to the desired pCO2 level. The              the duration of the experiment; i.e. the average daily pH val-
pCO2 levels were monitored using a non-dispersive infrared              ues, calculated using the start, middle and end measurements,
analyser (LI-6252, LI-COR Biosciences). The humidified                  were 8.12 ± 0.06 for ambient conditions and 7.82 ± 0.03 for
gas mixtures were bubbled through a glass frit and supplied             high pCO2 levels.
via a sterile 0.2 µm PTFE filter (Midistart 2000, Sartorius
Stedim). Cultures were acclimated to the respective pCO2                2.3   Growth and cellular composition
levels for at least five generations prior to the experiment. To
minimize shifts in carbonate chemistry due to biomass pro-              Cell densities of M. pusilla were quantified using a flow cy-
duction, cell densities were kept low at between 5000 and               tometer (FCM; Accuri C6, BD Biosciences). Samples were
158 000 cells mL−1 .                                                    analysed using live cells, where 490 µL of sample was added
                                                                        to 10 µL of 1 µm microspheres fluorescent-beads solution
                                                                        (Fluoresbrite YG, Polysciences Inc), which acted as an in-
                                                                        ternal standard. Cells were identified and counted using the
                                                                        FL3 and FL4 channels as well as forward scatter for 2 min

www.biogeosciences.net/17/635/2020/                                                               Biogeosciences, 17, 635–647, 2020
638 E. White et al.: Micromonas pusilla benefits from ocean acidification under dynamic light
Table 1. Carbonate chemistry measurements for each light and acclimated for 15 min, and measurements were conducted
pCO2 treatment (n = 4; mean ± 1 SD). The measured values are in a temperature-controlled chamber at 3 ◦ C. The maximum
CT (dissolved inorganic carbon), AT (total alkalinity) and pH (NBS (Fm , Fm0 ) and minimum (F0 , F 0 ) chlorophyll fluorescence in
scale). pCO2 was calculated using the CO2SYS program, with pH the dark and light were estimated according to iterative al-
and AT as input values. The values were calculated for 2 ◦ C, with a gorithms for induction (Kolber et al., 1998) and relaxation
salinity of 32.2. The nutrient levels were 6.5 and 100 µmol kg−1 for
phases (Oxborough et al., 2012). The PSII quantum yield ef-
PO4 and Si(OH)4 , respectively.
ficiency was estimated as Fv /Fm using the following equa-
Light pCO2 CT AT pH pCO2 tion:
treatment (µatm) (µmol kg−1 ) (µmol kg−1 ) NBS scale (µatm)
Fv /Fm = (Fm − F0 )/Fm . (1)
Constant 400 2122 ± 16 2194 ± 8 8.15 ± 0.07 397 ± 64
light 1000 2202 ± 6 2215 ± 5 7.79 ± 0.02 956 ± 49
Dynamic 400 2156 ± 15 2207 ± 8 8.06 ± 0.01 492 ± 18 Additional parameters were measured after dark acclimation,
light 1000 2216 ± 11 2208 ± 7 7.79 ± 0.02 963 ± 53 2
including the absorption cross-section size of PSII (σPSII ; Å ·
q −1 ), the connectivity of PSII (ρ) and the PSII reopening rate
(τ ; ms), according to Kolber et al. (1998). F00 was estimated
on slow speed with a maximum of 50 000 events. Specific after Oxborough and Baker (1997) as
growth rate constants (µ) were calculated from exponential
Fv F0
fits of cell numbers over time for each replicate bottle. Sam- F00 = F0 + 0 . (2)
Fm Fm
ples were measured daily within a 1 h time frame for consis-
tency. Thereafter, the coefficient of photochemical quenching qL
Samples for particulate organic carbon (POC) and partic- was calculated after Kramer et al. (2004) as
ulate organic nitrogen (PON) were collected at the end of
qL = Fm0 − F 0 / Fm0 − F00 · F00 /F 0 .
the batch-culture experiment during the dark phase; samples (3)
were gently filtered onto pre-combusted 25 mm GF/F filters.
Before analysis, 200 µL of hydrochloric acid (HCl, 0.2 M) The electron transport rates through PSII (ETR;
was added to each filter and the samples were dried at 60 ◦ C mol e− (mol RCII)−1 s−1 ) were calculated after Xu et
for at least 12 h to remove any inorganic carbon. The samples al. (2017) using the following equation:
were analysed using an elemental analyser (Euro EA 3000, ETR = σPSII × qL × PAR, (4)
HEKAtech). The POC and PON data were corrected by sub-
tracting blank measurements, and values were normalized where σPSII is the absorption cross-section size of
using the specific cell density and volume filtered to yield PSII, and PAR is the photosynthetically active radi-
cell quotas. Subsequently, production rates were calculated ation. Photosynthesis–irradiance (PI) curves were esti-
by multiplying the quota with the specific growth rate con- mated at eight irradiances between 0 and 589 µmol
stant (µ) of the respective incubation. photons m−2 s−1 . According to the model by Webb et
Samples for the Chl a quota were obtained at the end of the al. (1974), the light harvesting efficiency (α; mol e− m2
batch-culture experiment during the dark phase, by gentle fil- (mol RCII)−1 (mol photons)−1 ) and the maximum relative
tration onto 25 mm GF/F filters, and were immediately stored electron transport rate (ETRmax ; mol e− (mol RCII)−1 s−1 )
at −20 ◦ C until analysis. For chlorophyll extraction, 8 mL were estimated using the following equation:
of 90 % acetone was added to the filters and subsequently
stored at 4 ◦ C for at least 4 h in darkness. After centrifugation −αI
ETR = ETRmax 1 − e . (5)
(4500 rpm for 5 min, Sigma 4K10), samples were measured ETRmax
on a fluorometer (TD-700 Fluorometer, Turner Designs) be-
fore and after acidification with HCl (1 M). Chl a concentra- The light saturation index (Ik ; µmol photons m−2 s−1 ) was
tions (µg L−1 ) were calculated as in Knap et al. (1996). calculated as ETRmax /α.
At the light level of 506 µmol photons m−2 s−1 , non-
photochemical quenching (NPQ) was calculated as Y (NPQ)
2.4 Physiological responses
using calculations as described in Klughammer and
Schreiber (2008):
Photophysiological parameters were measured using a
fast-repetition-rate fluorometer (FRRf; FastOcean sensor, F F
Chelsea Technologies) in combination with a FastAct system Y (NPQ) = 0
− . (6)
Fm Fm
(Chelsea Technologies). The fluorometer’s light-emitting
diodes (LEDs) were set to an emission wavelength of Measurements of ROS for both qO−2 free radicals and H2 O2
450 nm. A saturation phase of 100 flashlets on a pitch of 2 µs were assessed using the FCM with the fluorochromes dihy-
was used, with a relaxation phase comprising 40 flashlets and droethidium (HE; D7008, Sigma-Aldrich) and dihydrorho-
a pitch of 50 µs. Prior to measurements, samples were dark damine 123 (DHR123; D1054, Sigma-Aldrich), respectively.
Biogeosciences, 17, 635–647, 2020 www.biogeosciences.net/17/635/2020/E. White et al.: Micromonas pusilla benefits from ocean acidification under dynamic light 639
Methods were adapted from Prado et al. (2012), with fi-
nal dye concentrations adjusted to 158.5 µM for the fluo-
rochrome HE and 28.87 mM for DHR123 and an optimized
incubation time of 30 min in the dark at 2 ◦ C. After entering
the cell, the fluorochrome HE is oxidized by superoxides and
subsequently binds with DNA, whereas DHR123 diffuses
into the cell and accumulates in the mitochondria (Benov et
al., 1998; Prado et al., 2012). To determine cell-specific con-
centrations, gated FL1 (505–550 nm) and FL3 (600–645 nm)
detection channels were used to analyse the relative concen-
tration of qO− 2 free radicals and H2 O2 , respectively. The ROS
measurements were corrected using blank measurements and
normalized to cell size using the forward scatter.
The ROS measurements were taken at two specific time
points on the last day of incubation, whereas the pho-
tophysiological measurements were taken solely at time
point 2 (Fig. 1). The midday measurements, referred to
as time point 1, were conducted at the highest light in-
tensity (590 µmol photons m−2 s−1 ) in the dynamic-light
cycle and at the same time under the average light
intensity (83 µmol photons m−2 s−1 ) in the constant-light Figure 2. (a) Growth rate (d−1 ), (b) POC production
cycle. The evening measurements, referred to as time (fmol cell d−1 ), (c) C : N ratio (mol mol−1 ), (d) chlorophyll a
point 2, were conducted at the start of the dark period quota (fg cell−1 ) of Micromonas pusilla under constant light and
(0 µmol photons m−2 s−1 ) in both the constant- and dynamic- dynamic light and pCO2 levels of 400 µatm (white) and 1000 µatm
(black; n = 4; mean ± 1 SD). The letters indicate significant
light cycles.
differences between treatments (p < 0.05), represented as (a) light
and (b) pCO2 .
2.5 Statistical analysis
The results are presented as means of the n = 4 replicates
with a single standard deviation. To identify significant dif- on the C : Chl a ratio. For all these parameters, no signifi-
ferences between the experimental runs, two-way analysis cant interactive effects between the applied light and pCO2
of variance (ANOVA) tests were performed with a signifi- conditions could be detected (Fig. 2; Table 2).
cance level of P ≤ 0.05. The tests were completed using the
Minitab Express statistical software (Minitab). 3.2 Photophysiological measurements
3 Results The FRRf measurements yielded a number of physiological
parameters, most of which were significantly affected by the
3.1 Growth and cellular composition different light and/or pCO2 treatments applied (Table 3). The
PSII quantum yield efficiency (Fv /Fm ) under dynamic light
In this study, the growth rates of M. pusilla were affected was significantly higher compared to the constant light treat-
by both light regime and pCO2 level (Fig. 2). Growth was ment (ANOVA, F (13) = 88.5, p < 0.0001). Even though to
reduced by at least 50 % in dynamic versus constant light, a lesser extent, high pCO2 levels also significantly increased
irrespective of pCO2 level (ANOVA, F (13) = 1840.4, p < Fv /Fm (ANOVA, F (13) = 4.8, p = 0.0480; Table 3). The
0.0001). In addition, growth rates significantly increased connectivity of PSIIs (ρ) was higher under dynamic versus
(> 4 %) under elevated pCO2 levels in both light regimes constant light (ANOVA, F (13) = 17.6, p = 0.0011), while
(ANOVA, F (13) = 21.9, p = 0.0004). The POC and PON there was no significant effect of pCO2 . Similarly, the ab-
quotas were not altered by changes in light regime or pCO2 sorption cross section of PSII photochemistry (σPSII ) was
levels (Table 2). The POC production rates were significantly significantly higher in dynamic compared to constant light
higher in constant versus dynamic light (ANOVA, F (12) = (ANOVA, F (12) = 7.0, p < 0.0001), irrespective of the ap-
31.2, p = 0.0001), irrespective of the pCO2 level applied. plied pCO2 level. In addition, there was significantly less
The C : N ratio was not significantly affected by the applied NPQ under dynamic compared to constant light (ANOVA,
treatments. While Chl a quotas decreased significantly under F (13) = 110.3, p < 0.0001), but there was no significant
elevated pCO2 levels (ANOVA, F (13) = 26.4, p = 0.0002), pCO2 response in NPQ (p > 0.05). Under dynamic light,
there was no significant response to the light treatments ap- the PSII reopening rate (τ ) was significantly reduced and
plied. The applied treatments did not have a significant effect > 5 % lower when compared to constant light (ANOVA,
www.biogeosciences.net/17/635/2020/ Biogeosciences, 17, 635–647, 2020640 E. White et al.: Micromonas pusilla benefits from ocean acidification under dynamic light
Table 2. Growth and cellular composition of M. pusilla (n = 4; mean ± 1 SD), including the growth rate, POC production, POC quota, PON
quota, chlorophyll a quota, C : N ratio and POC : chlorophyll a ratio. Treatments include constant light and dynamic light and the two pCO2
levels of 400 and 1000 µatm. The letters indicate significant differences between treatments (p < 0.05) represented as (a) light and (b) pCO2 .
Light pCO2 Growth rate POC production POC quota PON quota Chl a quota C:N POC : Chl a
treatment (µatm) µ (d−1 ) (fmol cell−1 d−1 ) (fmol cell−1 ) (fmol cell−1 ) (fg cell−1 ) (mol mol−1 ) (g g−1 )
Constant light 400 0.70 ± 0.01 124 ± 18 177 ± 26 19.2 ± 2.3 11.5 ± 0.49 8.8 ± 0.9 185 ± 28
1000 0.73 ± 0.02 118 ± 21 159 ± 29 21.2 ± 7.6 9.4 ± 0.39 9.9 ± 2.5 203 ± 36
Dynamic light 400 0.37 ± 0.01 56 ± 12 151 ± 28 20.3 ± 4.6 10.4 ± 0.39 7.7 ± 1.0 175 ± 30
1000 0.41 ± 0.02 54 ± 10 132 ± 26 18.5 ± 5.7 9.3 ± 1.07 7.7 ± 1.5 172 ± 42
Significance a, b a b
F (13) = 18.6, p = 0.0008), while τ did not display a sig-
nificant response to pCO2 (Table 3).
The model by Webb et al. (1974) was used to estimate
P − I parameters from the FRRf data. The light saturation
index (Ik ) and maximum photosynthetic rate (ETRmax ) both
increased significantly by > 10 % under elevated pCO2 lev-
els (ANOVA, F (13) = 11.8, p = 0.0047 for Ik and F (13) =
6.8, p = 0.0214 for ETRmax ; Table 3). While there was no
significant response of Ik to the two light treatments, ETRmax
was significantly higher under dynamic light compared to
constant light (ANOVA, F (13) = 41.2, p < 0.0001). The
light harvesting efficiency (α) was significantly reduced by Figure 3. The relative production of (a) oxygen free radicals
high pCO2 versus ambient pCO2 levels (ANOVA, F (13) = ( qO2 −) and (b) hydrogen peroxide (H2 O2 ) in Micromonas pusilla
9.6, p = 0.0084) and significantly higher under dynamic under constant light and dynamic light and pCO2 levels of 400 µatm
(white) and 1000 µatm (black; n = 4; mean ± 1 SD) at time point 1.
light versus constant light (ANOVA, F (13) = 36.0, p <
The letter b indicates a significant difference (p < 0.05) between
0.0001; Table 3). pCO2 treatments.
3.3 ROS levels
The relative concentrations of qO− 2 free radicals and H2 O2
ments, however, they are often exposed to an artificially con-
were used as an indication of oxidative stress under the ap- stant light (Köhler et al., 2018). Simulating a dynamic light
plied treatments (Fig. 3). At time point 1 (midday), the pro- field to be more representative of an Arctic fjord, we could
duction of qO−
2 free radicals was not significantly changed in
show that M. pusilla can photoacclimate to these more re-
response to pCO2 levels or light regimes (p > 0.05). How- alistic variations in light availability without showing signs
ever, there was a significant increase in H2 O2 production of high-light stress. This is supported by significantly higher
in high pCO2 versus ambient pCO2 conditions (ANOVA, PSII quantum yield efficiency (Fv /Fm ) under dynamic light
F (12) = 4.8, p = 0.0488), irrespective of the light treatment (Table 3), which is commonly used as a health indicator of
applied. The applied treatments did not have a significant ef- photosynthetic organisms, indicating successful photoaccli-
fect on the ROS levels at time point 2 (Fig. S1, in the Sup- mation to varying light intensities (Van Leeuwe and Stefels,
plement). 2007).
To achieve this photoacclimation, M. pusilla can appar-
ently adjust its PSII physiology to balance photoprotection
4 Discussion during high-light periods with sufficient absorption during
low-light periods of the dynamic light field. More specif-
4.1 Effective acclimation towards dynamic light ically, there were a number of changes to PSII, including
imposes high metabolic costs a significant increase in the cross-section size of the an-
tenna in PSII (σPSII ), an increase in the connectivity be-
In their natural environment, phytoplankton need to cope tween PSIIs (ρ) and quicker PSII reopening rates (τ ; Ta-
with varying light in the upper mixed layer (MacIntyre et ble 3). An increase in σPSII acts to increase the absorption
al., 2000). Next to variation in insolation, the light fields are of light (Suggett et al., 2007), which would have been bene-
critically dependent on the mixed-layer depth, the light at- ficial within the low-light periods of the dynamic light cycle
tenuation and the vertical mixing rate. In laboratory experi- (Schuback et al., 2017) and is supported by a significant in-
Biogeosciences, 17, 635–647, 2020 www.biogeosciences.net/17/635/2020/E. White et al.: Micromonas pusilla benefits from ocean acidification under dynamic light 641
Table 3. FRRf-based photophysiological parameters for M. pusilla (n = 4; mean ± 1 SD). Displayed is the Fv /Fm (dimensionless),
2
the connectivity between PSIIs (ρ; dimensionless), the absorption cross section of PSII photochemistry (σPSII ; Å · q −1 ), the non-
photochemical quenching (Y (NPQ); dimensionless), the PSII reopening rate (τ ; ms), the maximum photosynthetic rate (ETRmax ;
mol e− (mol RCII)−1 s−1 ), the light harvesting efficiency (α; mol e− m2 (mol RCII)−1 (mol photons)−1 ) and the light saturation constant
(Ik ; µmol photons m−2 s−1 ) for both light regimes and pCO2 levels (µatm). The letters indicate significant differences between treatments
(p < 0.05) represented as (a) light and (b) pCO2 .
Light treatment pCO2 Fv /Fm ρ σPSII Y (NPQ) τ ETRmax Ik α
Constant light 400 0.46 ± 0.01 0.33 ± 0.08 5.2 ± 0.1 12.7 ± 1.8 617 ± 9 369 ± 33 61.4 ± 8.0 6.0 ± 0.4
1000 0.49 ± 0.03 0.31 ± 0.03 5.5 ± 0.1 9.9 ± 3.9 600 ± 11 416 ± 104 122.7 ± 49.7 4.0 ± 1.9
Dynamic light 400 0.54 ± 0.00 0.40 ± 0.01 6.7 ± 0.4 0.7 ± 0.0 573 ± 24 530 ± 40 60.1 ± 11.8 9.0 ± 1.1
1000 0.54 ± 0.01 0.42 ± 0.02 6.8 ± 0.4 0.7 ± 0.0 569 ± 20 640 ± 50 84.2 ± 10.4 7.6 ± 0.6
Significance a, b a a a a a, b b a, b
crease in the light harvesting efficiency under low light (α; 2010; Shatwell et al., 2012; Su et al., 2012; Wagner et al.,
Table 3). The observed increase in ρ under dynamic light al- 2006). In previous studies, acclimation to a dynamic light
lows for higher flexibility in capturing electrons during low- regime has reduced growth rates from 17 % (Hoppe et al.,
light phases while at the same time allowing excess excita- 2015) to 58 % (Boelen et al., 2011), which is comparable
tion energy to be redistributed among PSII centres during to the 47 % reduction in growth rate reported in this study
high-light phases. This increases energy capture efficiency (Table 2; Fig. 2). It thus seems likely that such metabolic
while protecting the PSII centres from damage through mi- costs generally occur and that they are not particularly high
gration of excitation energy between different PSIIs, also in the current study. Changes in light regime strongly in-
termed the lake model (Blankenship, 2014; Trimborn et al., fluence relationships between photochemistry, carbon fixa-
2014), highlighting that M. pusilla has high potential for pho- tion and downstream metabolic processes, optimizing light
toprotection. Additionally, the higher τ under dynamic ver- harvesting to sustain growth (Behrenfeld et al., 2008). In
sus constant light indicates more efficient drainage of elec- view of this, the significant changes to PSII physiology (Ta-
trons downstream of PSII (Kolber et al., 1998). A faster PSII ble 3) suggest that resources were channelled towards light
reopening rate can also compensate for deactivation of func- harvesting rather than protein synthesis and biomass build-
tional PSII reaction centres during the high-light periods of up (Talmy et al., 2013). Therefore, it can be concluded that
the dynamic light field (Behrenfeld et al., 1998). The signifi- the lower growth rates in dynamic light were caused by
cantly lower NPQ in combination with higher ETRmax under the high metabolic costs associated with photoacclimation
dynamic versus constant light reflects photoacclimation to a to the varying light intensities and were not due to pho-
higher light intensity under dynamic light, allowing effective toinhibition. Thus, our results stand in contrast to previous
utilization of high excitation energy without initiating high- evidence based on which Micromonas was considered as
light stress (Ragni et al., 2008). Consequently, M. pusilla a shade-adapted genus (Lovejoy et al., 2007) as such low-
exhibits the physiological plasticity needed to prevent pho- light-adapted species are generally expected to possess lim-
todamage, which otherwise can disturb the balance between ited plasticity in photoacclimative capabilities (Talmy et al.,
production and scavenging of reactive oxygen species (ROS), 2013).
causing oxidative stress and accumulation of ROS (Apel and
Hirt, 2004). Indeed, dynamic light did not cause increased 4.2 Picoeukaryotes benefit from ocean acidification
ROS accumulation in response to the dynamic light field irrespective of the light regime
(Fig. 3). Overall, M. pusilla had the capacity to sufficiently
acclimate its PSII physiology to deal with dynamic light, dis-
playing photoprotection strategies during high-light phases The low seawater temperatures in the Arctic enhance CO2
and upregulated light harvesting during low-light phases. solubility and therefore increase OA, from which photosyn-
The described photoacclimation strategies appear to come thetic organisms may benefit due to increased CO2 availabil-
at a cost, namely lowered energy transfer efficiency to ity for photosynthesis (AMAP, 2018). This seems true for pi-
biomass build-up, which is supported by significantly lower coeukaryotes, as in this study M. pusilla showed increased
growth rates and POC production, despite an increase in growth rates and photophysiological efficiency under ele-
Fv /Fm and ETRmax under dynamic compared to constant vated pCO2 (Table 2; Fig. 2). These results are in line with
light (Fig. 2; Table 3). Our findings agree with previous stud- various studies that have reported picoeukaryotes to bene-
ies, which also found lowered growth under a dynamic light fit from increasing pCO2 (Brussaard et al., 2013; Hoppe et
regime (Hoppe et al., 2015; Jin et al., 2013; Mills et al., al., 2018; Meakin and Wyman, 2011; Newbold et al., 2012;
Schaum et al., 2012; Schulz et al., 2017). In the current study,
www.biogeosciences.net/17/635/2020/ Biogeosciences, 17, 635–647, 2020642 E. White et al.: Micromonas pusilla benefits from ocean acidification under dynamic light however, there was no observed increase in POC production tration have been linked to changes in growth metabolism un- (Fig. 2) under higher pCO2 levels, which could have been der non-stressful conditions (Kim et al., 2004), which would expected assuming lowered costs due to CCM downregula- fit with the Ik -independent behaviour observed here and sug- tion (Iglesias-Rodriguez et al., 1998; Rost et al., 2008). The gests that sufficient sinks for the enhanced flow of photo- observed increase in growth rates nonetheless indicates ben- synthetic energy were present. Thus, there is ample evidence eficial OA effects potentially due to reallocation of energy that, despite no effect on biomass build-up, elevated pCO2 liberated by eased carbon acquisition. Alternatively, the large facilitated carbon acquisition and led to faster and eased pho- surface : volume ratio of M. pusilla (cell size of 2–3 µm) may tosynthetic energy generation and higher rates of cell divi- generally lower the need for an active CCM, allowing cells sion. to depend more strongly on diffusive CO2 uptake (Falkowski The described changes in photoacclimation were not part- and Raven, 2013). As the latter is directly linked to the pCO2 nered with a significant increase in POC production, despite level, it could likewise explain the higher growth rates ob- an increase in growth rate (Fig. 2). These findings contrast served under elevated pCO2 . In any case, the growth strategy with Hoppe et al. (2018), who reported that POC production of the investigated strain involves energy allocation into cell rates of M. pusilla were generally increased under OA. In division rather than biomass build-up. Whether picoeukary- this earlier study, however, the Chl a quota of M. pusilla re- otes such as M. pusilla benefit from OA due to increased dif- mained relatively constant over a large range of pCO2 levels fusive CO2 uptake, lowered CCM costs or both remains to be at two temperatures, so OA effects on the ratio between en- tested. ergy allocated into photosynthesis (i.e. Chl a) and biomass To further explain the increase in growth rate under ele- build-up (i.e. POC) in both studies actually agree. Further- vated pCO2 , it is essential to look into the upstream phys- more, if only the pCO2 levels investigated in the current iological parameters. There was a significant increase in study are considered from Hoppe et al. (2018), varying OA ETRmax under OA (Table 3), which indicates an increase in responses (i.e. decreasing vs. increasing for POC produc- photosynthetic capacity. Previous studies on picoeukaryotes tion, and constant vs. increasing for the Chl a quota) were have reported variable results, displaying either no change observed depending on the applied temperatures. This hints or an increase in ETRmax in response to OA (Brading et at the well-known fact that even small changes in the en- al., 2011; Fu et al., 2007; Kim et al., 2013). In our current vironmental conditions can greatly modulate OA responses study, Ik increased in concert with ETRmax , with increasing of phytoplankton (Riebesell and Gattuso, 2015; Rost et al., pCO2 (Table 3). This Ik -dependent behaviour is known as 2008). In fact, differences between the two studies could also acclimation to higher light levels in order to optimize bal- be caused by differences in the average irradiances (approx. anced growth (Behrenfeld et al., 2008). In the current case, 80 vs. 150 µmol photons m−2 s−1 ). Despite these differences, the increase in Ik under OA could indicate that eased carbon one should note, however, that high growth rates were ob- acquisition shifted the balance of energy acquisition and its tained under the various OA treatments. As growth rate is sinks towards saturation at higher irradiances, which fits with the best available fitness indicator for single-strain studies the reduced Chl a quota under these conditions (Fig. 2). At (Schaum and Collins, 2014), our findings are indicative of the same time, the light harvesting efficiency at low light (α; improved fitness of M. pusilla under OA. please note this unit is per photosystem) also decreased in response to OA (Table 3). Such Ik -independent behaviour is 4.3 M. pusilla’s response does not indicate interactions influenced by changes in the relative contribution of differ- between light regime and pCO2 ent sinks of photosynthetic energy, namely carbon fixation, direct use, and ATP generation via cyclic electron transport The interaction between light field and OA has been in- and other mechanisms (Behrenfeld et al., 2008). Both pho- vestigated for the coccolithophore Gephyrocapsa oceanica toacclimative strategies mimicked acclimation to high light (Jin et al., 2013) and the Antarctic diatom Chaetoceros de- in response to increasing pCO2 , which may be a general OA bilis (Hoppe et al., 2015). In both studies, the species in- response of phytoplankton (e.g. Hoppe et al., 2015; Rokitta creased their photochemical performance in response to el- et al., 2012). At the same time, reduced Chl a quotas indi- evated pCO2 under constant light. Dynamic light fields re- cate that such efficient photosystems decrease the need to versed the positive effect of high pCO2 , which was ex- invest into the total number of them. This potentially bal- plained by increased high-light stress under OA and a reduc- ances the reductive pressure on the entire cell, as we did not tion in the energy transfer efficiency from photochemistry to observe any high-light stress, even during peaks (Fig. 3). Al- biomass build-up (Hoppe et al., 2015). In the current study, though there was a significant increase in H2 O2 concentra- there was no significant interaction between light regime and tion under OA relative to ambient pCO2 levels, no change in pCO2 (p > 0.05; Figs. 2, 3; Tables 2, 3). These opposing qO− concentration was observed (Fig. 3). Thus, even if ROS responses could be caused by group- or species-specific dif- 2 production was enhanced under OA, efficient detoxification ferences in carbon acquisition. Diatoms, for example, have mechanisms (e.g. reduction of qO− 2 to H2 O2 ; Asada, 1999) highly effective CCMs (Burkhardt et al., 2001), which are seem to be in place. Additionally, changes to H2 O2 concen- energetically expensive (Hopkinson et al., 2011). As CCMs Biogeosciences, 17, 635–647, 2020 www.biogeosciences.net/17/635/2020/
E. White et al.: Micromonas pusilla benefits from ocean acidification under dynamic light                                          643

allow cells to efficiently sink energy under sudden high light           Global warming is, due to the phenomenon of Arctic
(Rost et al., 2006), their downregulation in response to high        amplification (Screen and Simmonds, 2010), a particularly
pCO2 can reduce the ability of cells to deal with high-light         important driver for Arctic phytoplankton. M. pusilla has
stress under OA (Hoppe et al., 2015). In contrast to other           been shown to synergistically benefit from OA and warm-
groups or taxa, which were often found to lose their ability         ing (Hoppe et al., 2018), but the results of this study sug-
to cope with excess energy under OA and dynamic light (e.g.          gest that future phytoplankton studies should also investi-
Gao et al., 2012), M. pusilla maintained effective acclimation       gate whether responses differ under dynamic light and deter-
without photoinactivation under these conditions. This could         mine the mechanisms, metabolic costs and trade-offs associ-
be attributed to its size, making it less reliant on CCMs as a       ated with interacting physiological processes. Furthermore,
mechanism to reduce reductive pressure under high light, as          warming causes ocean freshening (Peterson et al., 2002) and
well as to the observed high plasticity in its photophysiolog-       enhanced stratification that further reduce nutrient availabil-
ical characteristics under dynamic light (Table 3).                  ity (Steinacher et al., 2010). Picoeukaryotes may also bene-
   In conclusion, the photoacclimation strategies of M.              fit from these anticipated changes in nutrient supply due to
pusilla were optimized for the dynamic light field, and, as          their high surface : volume ratio, allowing for effective nutri-
this species seems less dependent on CCMs, the previously            ent uptake (Li et al., 2009). Additionally, nutrient uptake may
described interaction between pCO2 and dynamic light (Gao            be facilitated by lower pH under elevated pCO2 (Bach et al.,
et al., 2012; Hoppe et al., 2015; Jin et al., 2013) was not ob-      2017). Nutrient deficiency was not addressed in this study as
served here. This highlights that, depending on their various        the experimental design was aiming to mimic non-limiting
physiological traits, phytoplankton groups may display dif-          nutrient conditions before the spring bloom. Nonetheless, the
ferent types of interactive responses. It is therefore crucial to    often limiting nutrient supply in the Arctic sets the trophic
understand the underlying physiological mechanisms of ob-            status of each region and limits annual productivity (Trem-
served multi-driver responses in order to judge whether gen-         blay et al., 2015) and thus is an important factor to consider
eralizations based on individual studies are feasible or not.        in future studies. Changes in the community size structure
                                                                     are biogeochemically important as picoplankton-dominated
4.4   Implications for the future Arctic Ocean                       systems tend to be less efficient with respect to carbon ex-
                                                                     port to depth (Worden et al., 2015). If smaller phytoplankton
The findings of this study highlight the importance of con-          become more dominant in the Arctic pelagic food web, this
sidering a dynamic light field in laboratory studies. While          may benefit smaller grazers. With these additional steps in
the interaction between OA and other factors, such as higher         the food web, energy transfer efficiency to top predators as
temperature, can easily be tested in the lab (Hoppe et al.,          well as into the deep ocean will likely decrease (Brussaard
2018), light treatments are generally less representative of in      et al., 2013). Based on the current study, an increased abun-
situ conditions. The difficulty of measuring and simulating          dance of M. pusilla under future pCO2 levels can be expected
more realistic variations in light has led to the common use         not only for the more stable low-light environments but also
of constant light fields, which may substantially alter numer-       for the productive mixed layer in springtime with its dynamic
ous parameters including growth rates and underestimate the          light fields.
energetic costs of photoacclimation under in situ conditions
(Köhler et al., 2018). Therefore, dynamic light fields need to
be included when predicting future ecosystem functioning. If         Data availability. The dataset for this study is available from the
the responses of the strain used in this study are representa-       PANGAEA data library, with the identifier https://doi.org/10.1594/
tive for this species, M. pusilla can be expected to cope well       PANGAEA.908691 (White et al., 2019).
with a dynamic light field typical of the surface mixed layer
(Tables 2, 3). While phytoplankton were often found to suf-
fer from OA under dynamic light (Gao et al., 2012; Hoppe             Supplement. The supplement related to this article is available on-
                                                                     line at: https://doi.org/10.5194/bg-17-635-2020-supplement.
et al., 2015; Jin et al., 2013), M. pusilla benefitted slightly
from OA irrespective of the light treatment applied. As bene-
ficial effects by OA were also evident under different temper-
                                                                     Author contributions. CJMH designed and supervised the study.
atures (Hoppe et al., 2018), we can conclude that M. pusilla         EW conducted the research and wrote the paper with contributions
has a high plasticity towards OA, warming and difference in          from CJMH and BR.
light regimes, making it well adapted for conditions expected
for the future Arctic Ocean. The observed high physiological
plasticity, i.e. the ability to adjust physiologically to maintain   Competing interests. The authors declare that they have no conflict
high growth and/or biomass build-up under all tested sce-            of interest.
narios, may thus also explain why picoeukaryotes are often
found to dominate mesocosm assemblages under OA (Brus-
saard et al., 2013; Engel et al., 2008; Schulz et al., 2017).

www.biogeosciences.net/17/635/2020/                                                             Biogeosciences, 17, 635–647, 2020
644 E. White et al.: Micromonas pusilla benefits from ocean acidification under dynamic light
Acknowledgements. We are grateful for field support from the Behrenfeld, M. J., Halsey, K. H., and Milligan, A. J.: Evolved
2014/2015 station team of the AWIPEV Base in Ny-Ålesund (Sval- physiological responses of phytoplankton to their integrated
bard) as well as for Klara K. E. Wolf’s help with strain isolation growth environment, Philos. T. R. Soc. Lon. B, 363, 2687–2703,
and maintenance of M. pusilla cultures. Laura Wischnewski, Chris- https://doi.org/10.1098/rstb.2008.0019, 2008.
tine Schallenberg, Tina Brenneis and Marcel Machnik are acknowl- Benov, L., Sztejnberg, L., and Fridovich, I.: Critical evalua-
edged for assistance in the laboratory. tion of the use of hydroethidine as a measure of super-
oxide anion radical, Free Radical Bio. Med., 25, 826–831,
https://doi.org/10.1016/S0891-5849(98)00163-4, 1998.
Financial support. The article processing charges for this open- Blankenship, R. E.: Molecular mechanisms of photosynthesis, 2nd
access publication were covered by a research centre of the Edn., Wiley Blackwell, USA, 2014.
Helmholtz Association. Boelen, P., van de Poll, W. H., van der Strate, H. J., Neven, I.
A., Beardall, J., and Buma, A. G.: Neither elevated nor reduced
CO2 affects the photophysiological performance of the marine
Review statement. This paper was edited by Carol Robinson and Antarctic diatom Chaetoceros brevis, J. Exp. Mar. Biol. Ecol.,
reviewed by Douglas Campbell, Lennart Bach and one anonymous 406, 38–45, https://doi.org/10.1016/j.jembe.2011.06.012, 2011.
referee. Brading, P., Warner, M. E., Davey, P., Smith, D. J., Achterberg,
E. P., and Suggett, D. J.: Differential effects of ocean acid-
ification on growth and photosynthesis among phylotypes of
Symbiodinium (Dinophyceae), Limnol. Oceanogr., 56, 927–938,
https://doi.org/10.4319/lo.2011.56.3.0927, 2011.
References Brewer, P. G., Bradshaw, A., and Williams, R.: Measurements of
total carbon dioxide and alkalinity in the North Atlantic Ocean in
AMAP: AMAP Assessment 2018: Arctic Ocean Acidifcation, Arc- 1981, in: The changing carbon cycle, Springer, New York, NY,
tic Monitoring and Assessment Programme (AMAP), Tromsø, 348–370, https://doi.org/10.1007/978-1-4757-1915-4_18, 1986.
Norway, 187 pp., 2018. Brussaard, C. P. D., Noordeloos, A. A. M., Witte, H., Collenteur,
Apel, K. and Hirt, H.: Reactive oxygen species: M. C. J., Schulz, K., Ludwig, A., and Riebesell, U.: Arctic mi-
metabolism, oxidative stress, and signal trans- crobial community dynamics influenced by elevated CO2 lev-
duction, Annu. Rev. Plant Biol., 55, 373–399, els, Biogeosciences, 10, 719–731, https://doi.org/10.5194/bg-10-
https://doi.org/10.1146/annurev.arplant.55.031903.141701, 719-2013, 2013.
2004. Burkhardt, S., Amoroso, G., Riebesell, U., and Sültemeyer, D.:
Arrigo, K. R., van Dijken, G., and Pabi, S.: Impact of a shrinking CO2 and HCO− 3 uptake in marine diatoms acclimated to dif-
Arctic ice cover on marine primary production, Geophys. Res. ferent CO2 concentrations, Limnol. Oceanogr., 46, 1378–1391,
Lett., 35, L19603, https://doi.org/10.1029/2008GL035028, 2008. https://doi.org/10.4319/lo.2001.46.6.1378, 2001.
Asada, K.: The water-water cycle in chloroplasts: Scav- Denman, K. L. and Gargett, A. E.: Time and space scales
enging of Active Oxygens and Dissipation of Ex- of vertical mixing and advection of phytoplankton in
cess Photons, Annu. Rev. Plant Phys., 50, 601–639, the upper ocean, Limnol. Oceanogr., 28, 801–815,
https://doi.org/10.1146/annurev.arplant.50.1.601, 1999. https://doi.org/10.4319/lo.1983.28.5.0801, 1983.
Bach, L. T., Mackinder, L. C., Schulz, K. G., Wheeler, G., Dickson, A. G. and Millero, F. J.: A comparison of the equilibrium
Schroeder, D. C., Brownlee, C., and Riebesell, U.: Dissecting constants for the dissociation of carbonic acid in seawater media,
the impact of CO2 and pH on the mechanisms of photosynthesis Deep-Sea Res., 34, 1733–1743, https://doi.org/10.1016/0198-
and calcification in the coccolithophore Emiliania huxleyi, New. 0149(87)90021-5, 1987.
Phytol., 199, 121–134, https://doi.org/10.1111/nph.12225, 2013. Dickson, A. G., Sabine, C. L., and Christian, J. R.: Guide to best
Bach, L. T., Alvarez-Fernandez, S., Hornick, T., Stuhr, A., and practices for ocean CO2 measurements, North Pacific Marine
Riebesell, U.: Simulated ocean acidification reveals winners Science Organization, Sidney, British Columbia, 2007.
and losers in coastal phytoplankton, PloS One, 12, e0188198, Engel, A., Schulz, K. G., Riebesell, U., Bellerby, R., Delille,
https://doi.org/10.1371/journal.pone.0188198, 2017. B., and Schartau, M.: Effects of CO2 on particle size dis-
Badger, M. R., Andrews, T. J., Whitney, S. M., Ludwig, M., Yel- tribution and phytoplankton abundance during a mesocosm
lowlees, D. C., Leggat, W., and Price, G. D.: The diversity bloom experiment (PeECE II), Biogeosciences, 5, 509–521,
and coevolution of Rubisco, plastids, pyrenoids, and chloroplast- https://doi.org/10.5194/bg-5-509-2008, 2008.
based CO2 -concentrating mechanisms in algae, Can. J. Bot., 76, Falkowski, P. G.: Light-shade adaptation in marine phytoplankton,
1052–1071, https://doi.org/10.1139/b98-074, 1998. in: Primary productivity in the sea, Vol. 19, Springer, Boston,
Bates, N. R. and Mathis, J. T.: The Arctic Ocean marine carbon USA, 1980.
cycle: evaluation of air-sea CO2 exchanges, ocean acidification Falkowski, P. G. and Raven, J. A.: Aquatic photosynthesis, 2nd
impacts and potential feedbacks, Biogeosciences, 6, 2433–2459, Edn., Princeton University Press, USA, 2013.
https://doi.org/10.5194/bg-6-2433-2009, 2009. Fu, F.-X., Warner, M. E., Zhang, Y., Feng, Y., and Hutchins, D.
Behrenfeld, M. J., Prasil, O., Kolber, Z. S., Babin, M., A.: Effects of Increased Temperature and CO2 on Photosyn-
and Falkowski, P. G.: Compensatory changes in photo- thesis, Growth, and Elemental Ratios in Marine Synechococcus
system II electron turnover rates protect photosynthe- and Prochlorococcus (Cyanobacteria), J. Phycol., 43, 485–496,
sis from photoinhibition, Photosynth. Res., 58, 259–268, https://doi.org/10.1111/j.1529-8817.2007.00355.x, 2007.
https://doi.org/10.1023/A:1006138630573, 1998.
Biogeosciences, 17, 635–647, 2020 www.biogeosciences.net/17/635/2020/E. White et al.: Micromonas pusilla benefits from ocean acidification under dynamic light 645 Gao, K., Helbling, E. W., Häder, D. P., and Hutchins, D. A.: Re- growth of Chattonella antiqua, Aquat. Microb. Ecol., 35, 57–64, sponses of marine primary producers to interactions between https://doi.org/10.3354/ame035057, 2004. ocean acidification, solar radiation, and warming, Mar. Ecol.- Kim, J.-H., Kim, K. Y., Kang, E. J., Lee, K., Kim, J.-M., Park, Prog. Ser., 470, 167–189, https://doi.org/10.3354/meps10043, K.-T., Shin, K., Hyun, B., and Jeong, H. J.: Enhancement of 2012. photosynthetic carbon assimilation efficiency by phytoplankton Granskog, M. A., Stedmon, C. A., Dodd, P. A., Amon, R. M. W., in the future coastal ocean, Biogeosciences, 10, 7525–7535, Pavlov, A. K., de Steur, L., and Hansen, E.: Characteristics of https://doi.org/10.5194/bg-10-7525-2013, 2013. colored dissolved organic matter (CDOM) in the Arctic outflow Klughammer, C. and Schreiber, U.: Complementary PS II quantum in the Fram Strait: Assessing the changes and fate of terrige- yields calculated from simple fluorescence parameters measured nous CDOM in the Arctic Ocean, J. Geophys. Res.-Oceans, 117, by PAM fluorometry and the Saturation Pulse method, PAM C12021, https://doi.org/10.1029/2012jc008075, 2012. Appl. Notes, 1, 27–35, 2008. Guillard, R. R. and Ryther, J. H.: Studies of marine plank- Knap, A., Michaels, A., Close, A., Ducklow, H., and Dickson, A.: tonic diatoms. I. Cyclotella nana Hustedt, and Detonula Protocols for the Joint Global Ocean Flux Study (JGOFS) Core confervacea (cleve) Gran, Can. J. Microbiol., 8, 229–239, Measurements, UNESCO, Paris, France, 170 pp., 1996. https://doi.org/10.1139/m62-029, 1962. Köhler, J., Wang, L., Guislain, A., and Shatwell, T.: In- Hopkinson, B. M., Dupont, C. L., Allen, A. E., and Morel, fluence of vertical mixing on light-dependency of phy- F. M.: Efficiency of the CO2 -concentrating mechanism toplankton growth, Limnol. Oceanogr., 63, 1156–1167, of diatoms, P. Natl. Acad. Sci. USA, 108, 3830–3837, https://doi.org/10.1002/lno.10761, 2018. https://doi.org/10.1073/pnas.1018062108, 2011. Kolber, Z. S., Prášil, O., and Falkowski, P. G.: Measurements of Hoppe, C. J., Holtz, L. M., Trimborn, S., and Rost, B.: Ocean acidi- variable chlorophyll fluorescence using fast repetition rate tech- fication decreases the light-use efficiency in an Antarctic diatom niques: defining methodology and experimental protocols, BBA- under dynamic but not constant light, New Phytol., 207, 159– Bioenergetics, 1367, 88–106, https://doi.org/10.1016/S0005- 171, https://doi.org/10.1111/nph.13334, 2015. 2728(98)00135-2, 1998. Hoppe, C. J. M., Langer, G., Rokitta, S. D., Wolf-Gladrow, D. A., Kramer, D. M., Johnson, G., Kiirats, O., and Edwards, G. E.: New and Rost, B.: Implications of observed inconsistencies in carbon- fluorescence parameters for the determination of QA redox state ate chemistry measurements for ocean acidification studies, Bio- and excitation energy fluxes, Photosynth. Res., 79, 209–218, geosciences, 9, 2401–2405, https://doi.org/10.5194/bg-9-2401- https://doi.org/10.1023/B:PRES.0000015391.99477.0d, 2004. 2012, 2012. Li, W. K., McLaughlin, F. A., Lovejoy, C., and Carmack, E. C.: Hoppe, C. J., Schuback, N., Semeniuk, D. M., Maldonado, Smallest algae thrive as the Arctic Ocean freshens, Science, 326, M. T., and Rost, B.: Functional Redundancy Facilitates Re- 539–539, https://doi.org/10.1126/science.1179798, 2009. silience of Subarctic Phytoplankton Assemblages toward Ocean Litchman, E.: Growth rates of phytoplankton under Acidification and High Irradiance, Front. Mar. Sci., 4, 229, fluctuating light, Freshwater Biol., 44, 223–235, https://doi.org/10.3389/fmars.2017.00229, 2017. https://doi.org/10.1046/j.1365-2427.2000.00559.x, 2000. Hoppe, C. J. M., Flintrop, C. M., and Rost, B.: The Arctic pi- Litchman, E., Klausmeier, C. A., and Bossard, P.: coeukaryote Micromonas pusilla benefits synergistically from Phytoplankton nutrient competition under dynamic warming and ocean acidification, Biogeosciences, 15, 4353– light regimes, Limnol. Oceanogr., 49, 1457–1462, 4365, https://doi.org/10.5194/bg-15-4353-2018, 2018. https://doi.org/10.4319/lo.2004.49.4_part_2.1457, 2004. Houghton, J., Ding, Y., and Griggs, D.: Climate Change: Scien- Lohbeck, K. T., Riebesell, U., and Reusch, T. B.: Adaptive evolu- tific Basis, IPCC TAR Working Group 1, The Press Syndicate tion of a key phytoplankton species to ocean acidification, Nat. of Cambridge University, UK, 2001. Geosci., 5, 346, https://doi.org/10.1038/ngeo1441, 2012. Hu, A. and Bates, S. C.: Internal climate variability and projected Lovejoy, C., Vincent, W. F., Bonilla, S., Roy, S., Martineau, future regional steric and dynamic sea level rise, Nat. Commun., M. J., Terrado, R., Potvin, M., Massana, R., and Pedrós- 9, 1068, https://doi.org/10.1038/s41467-018-03474-8, 2018. Alió, C.: Distribution, phylogeny, and growth of cold-adapted Huisman, J.: Population dynamics of light-limited picoprasinophytes in Arctic Seas, J. Phycol., 43, 78–89, phytoplankton: microcosm experiments, Ecol- https://doi.org/10.1111/j.1529-8817.2006.00310.x, 2007. ogy, 80, 202–210, https://doi.org/10.1890/0012- Maat, D. S., Crawfurd, K. J., Timmermans, K. R., and Brus- 9658(1999)080[0202:PDOLLP]2.0.CO;2, 1999. saard, C. P.: Elevated pCO2 and phosphate limitation fa- Iglesias-Rodriguez, M., Nimer, N., and Merrett, M.: Carbon vor Micromonas pusilla through stimulated growth and re- dioxide-concentrating mechanism and the development of duced viral impact, Appl. Environ. Microb., 80, 3119–3127, extracellular carbonic anhydrase in the marine picoeukary- https://doi.org/10.1128/AEM.03639-13., 2014. ote Micromonas pusilla, New Phytol., 140, 685–690, MacIntyre, H. L., Kana, T. M., and Geider, R. J.: The ef- https://doi.org/10.1046/j.1469-8137.1998.00309.x, 1998. fect of water motion on short-term rates of photosynthe- Jin, P., Gao, K., Villafañe, V. E., Campbell, D. A., and Helbling, W.: sis by marine phytoplankton, Trends Plant Sci., 5, 12–17, Ocean acidification alters the photosynthetic responses of a coc- https://doi.org/10.1016/S1360-1385(99)01504-6, 2000. colithophorid to fluctuating UV and visible radiation, Plant Phys- Marquardt, M., Vader, A., Stübner, E. I., Reigstad, M., and iol., 162, 2084–2094, https://doi.org/10.1104/pp.113.219543, Gabrielsen, T. M.: Strong seasonality of marine microbial 2013. eukaryotes in a high-arctic fjord (Isfjorden, in West Spits- Kim, D., Watanabe, M., Nakayasu, Y., and Kohata, K.: Production bergen, Norway), Appl. Environ. Microb., 82, 1868–1880, of superoxide anion and hydrogen peroxide associated with cell https://doi.org/10.1128/AEM.03208-15, 2016. www.biogeosciences.net/17/635/2020/ Biogeosciences, 17, 635–647, 2020
You can also read


