Towards the restoration of ancient hominid craniofacial anatomy: Chimpanzee morphology reveals covariation between craniometrics and facial soft ...
←
→
Page content transcription
If your browser does not render page correctly, please read the page content below
Zurich Open Repository and
                                                                         Archive
                                                                         University of Zurich
                                                                         Main Library
                                                                         Strickhofstrasse 39
                                                                         CH-8057 Zurich
                                                                         www.zora.uzh.ch

 Year: 2021

     Towards the restoration of ancient hominid craniofacial anatomy:
   Chimpanzee morphology reveals covariation between craniometrics and
                        facial soft tissue thickness

                        Campbell, Ryan M ; Vinas, Gabriel ; Henneberg, Maciej

Abstract: In modern humans, facial soft tissue thicknesses have been shown to covary with craniometric
dimensions. However, to date it has not been confirmed whether these relationships are shared with
non-human apes. In this study, we analyze these relationships in chimpanzees (Pan troglodytes) with the
aim of producing regression models for approximating facial soft tissue thicknesses in Plio-Pleistocene
hominids. Using CT scans of 19 subjects, 637 soft tissue, and 349 craniometric measurements, statistically
significant multiple regression models were established for 26 points on the face and head. Examination
of regression model validity resulted in minimal differences between observed and predicted soft tissue
thickness values. Assessment of interspecies compatibility using a bonobo (Pan paniscus) and modern
human subject resulted in minimal differences for the bonobo but large differences for the modern human.
These results clearly show that (1) soft tissue thicknesses covary with craniometric dimensions in P.
troglodytes, (2) confirms that such covariation is uniformly present in both extant Homo and Pan species,
and (3) suggests that chimp-derived regression models have interspecies compatibility with hominids who
have similar craniometric dimensions to P. troglodytes. As the craniometric dimensions of early hominids,
such as South African australopithecines, are more similar to P. troglodytes than those of H. sapiens,
chimpanzee-derived regression models may be used for approximating their craniofacial anatomy. It is
hoped that the results of the present study and the reference dataset for facial soft tissue thicknesses of
chimpanzees it provides will encourage further research into this topic.

DOI: https://doi.org/10.1371/journal.pone.0245760

Posted at the Zurich Open Repository and Archive, University of Zurich
ZORA URL: https://doi.org/10.5167/uzh-204855
Journal Article
Published Version

The following work is licensed under a Creative Commons: Attribution 4.0 International (CC BY 4.0)
License.

Originally published at:
Campbell, Ryan M; Vinas, Gabriel; Henneberg, Maciej (2021). Towards the restoration of ancient ho-
minid craniofacial anatomy: Chimpanzee morphology reveals covariation between craniometrics and facial
soft tissue thickness. PLoS ONE, 16(6):e0245760.
DOI: https://doi.org/10.1371/journal.pone.0245760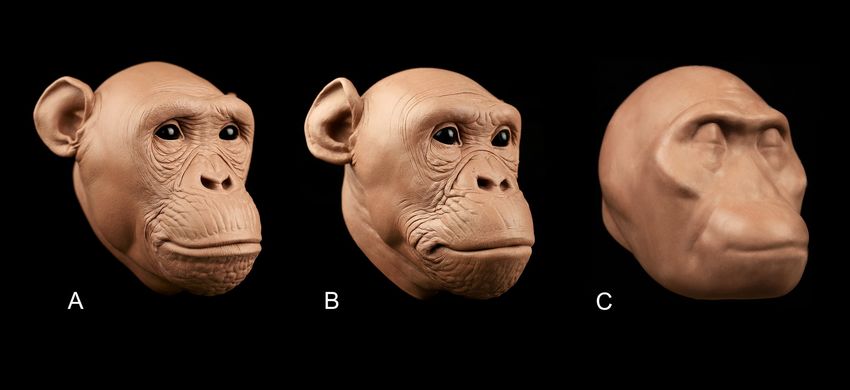
PLOS ONE

                                                    RESEARCH ARTICLE

                                                    Towards the restoration of ancient hominid
                                                    craniofacial anatomy: Chimpanzee
                                                    morphology reveals covariation between
                                                    craniometrics and facial soft tissue thickness
                                                    Ryan M. Campbell ID1*, Gabriel Vinas2, Maciej Henneberg ID1,3

                                                    1 Adelaide Medical School, Biological Anthropology and Comparative Anatomy Research Unit, The
                                                    University of Adelaide, Adelaide, South Australia, Australia, 2 Sculpture Department, Herberger Institute for
                                                    Design and the Arts, Arizona State University, Tempe, Arizona, United States of America, 3 Institute of
                                                    Evolutionary Medicine, Faculty of Medicine, University of Zurich, Zurich, Switzerland
a1111111111
a1111111111                                         * ryan.campbell@adelaide.edu.au
a1111111111
a1111111111
a1111111111                                         Abstract
                                                    In modern humans, facial soft tissue thicknesses have been shown to covary with cranio-
                                                    metric dimensions. However, to date it has not been confirmed whether these relationships
                                                    are shared with non-human apes. In this study, we analyze these relationships in chimpan-
   OPEN ACCESS
                                                    zees (Pan troglodytes) with the aim of producing regression models for approximating facial
Citation: Campbell RM, Vinas G, Henneberg M
                                                    soft tissue thicknesses in Plio-Pleistocene hominids. Using CT scans of 19 subjects, 637
(2021) Towards the restoration of ancient hominid
craniofacial anatomy: Chimpanzee morphology         soft tissue, and 349 craniometric measurements, statistically significant multiple regression
reveals covariation between craniometrics and       models were established for 26 points on the face and head. Examination of regression
facial soft tissue thickness. PLoS ONE 16(6):       model validity resulted in minimal differences between observed and predicted soft tissue
e0245760. https://doi.org/10.1371/journal.
pone.0245760
                                                    thickness values. Assessment of interspecies compatibility using a bonobo (Pan paniscus)
                                                    and modern human subject resulted in minimal differences for the bonobo but large differ-
Editor: Caroline Wilkinson, Liverpool John Moores
University, UNITED KINGDOM
                                                    ences for the modern human. These results clearly show that (1) soft tissue thicknesses
                                                    covary with craniometric dimensions in P. troglodytes, (2) confirms that such covariation is
Received: January 6, 2021
                                                    uniformly present in both extant Homo and Pan species, and (3) suggests that chimp-
Accepted: May 14, 2021                              derived regression models have interspecies compatibility with hominids who have similar
Published: June 4, 2021                             craniometric dimensions to P. troglodytes. As the craniometric dimensions of early homi-
Copyright: © 2021 Campbell et al. This is an open   nids, such as South African australopithecines, are more similar to P. troglodytes than those
access article distributed under the terms of the   of H. sapiens, chimpanzee-derived regression models may be used for approximating their
Creative Commons Attribution License, which         craniofacial anatomy. It is hoped that the results of the present study and the reference data-
permits unrestricted use, distribution, and
reproduction in any medium, provided the original
                                                    set for facial soft tissue thicknesses of chimpanzees it provides will encourage further
author and source are credited.                     research into this topic.
Data Availability Statement: The dataset has been
made publicly available on Figshare (https://doi.
org/10.6084/m9.figshare.13121696).

Funding: The authors received no specific funding
for this work.                                      Introduction
Competing interests: The authors have declared      The primate family of Hominidae is comprised of the African apes, humans and all ancestors
that no competing interests exist.                  leading to these clades. Reconstructing soft tissue characters of extinct members of the

PLOS ONE | https://doi.org/10.1371/journal.pone.0245760 June 4, 2021                                                                                         1 / 25
PLOS ONE Towards the restoration of ancient hominid craniofacial anatomy
Hominidae, called here hominids, has become an increasingly popular practice with many
approximations of their faces presented in museum exhibitions, popular science publications,
and at conference presentations worldwide [1–3]. In these contexts, reconstructions of the face
and body have proven to be an effective vehicle for the dissemination of scientific information
about human evolution. However, there is a recognized problem of variability among recon-
structions of the same individual. A recent study comparing approximations of LB1, the holo-
type of Homo floresiensis [4, 5], reported that they vary significantly among one another [6].
Similarly, in a systematic survey of 860 hominid reconstructions presented in 71 museums
across Australia and Europe, it was found that inconsistencies are prevalent in all other
approximations of extinct hominid species [7]. If practitioners were using consistently reliable
methods this variability would not have occurred. Obviously, the confounding effect of practi-
tioner experience and competency in the reconstruction procedure also plays a role here.
However, there is clearly variation in the replicability across existing reconstruction methods
depending on the robustness of the empirical data supporting them and, since there is cur-
rently very little applicable data that can be extrapolated to Plio/Pleistocene hominids, results
vary depending on methods used and individualities of practitioners.
Worse still, in its present state the practice of hominid reconstruction is particularly vulner-
able to attack. Campbell et al. [8] argues that reconstructions based on unspecified sets of
assumptions and biased misconceptions can actually do harm by perpetuating erroneous ideas
about human evolution. Critics of human evolution are already using discrepancies between
reconstructions of the same individual to undermine the reliability of evolutionary theory.
Therefore, it is of utmost importance to strengthen methods of reconstruction as much as pos-
sible to reduce this variability and avoid such criticisms.
The term used to describe the process of building a face over a skull varies in the literature
between disciplines. In forensics, the name of the process most commonly referred to as ‘facial
reconstruction’ was updated to ‘facial approximation’ because it is a more accurate description
of the results, whereas in paleoanthropology the term ‘facial reconstruction’ is still being used
[2]. Regardless of what term is preferred, the results are always approximate and therefore we
agree with previous authors and prefer the term ‘facial approximation’ [6, 9, 10]. Scientific test-
ing of facial approximation methods has been a major focus in craniofacial identification of
human remains with research dating back at least to Welcker [11], with important contribu-
tions by Gerasimov [12, 13], Prag and Neave [14], and Wilkinson [15]. Methods using means
of soft tissues of the face have received the most attention [16–19], however, there is a recog-
nized flaw in extrapolating means to individuals. As statistically robust as means may be, they
only express means for specific populations. For reconstructing individuals, population means
are not appropriate because they completely ignore variation among individuals. Regarding
the approximation of extinct hominids, interspecies extrapolation of means derived from
either modern humans or the extant great apes (Gorilla, Pan, and Pongo), as suggested in
Hanebrink [18], is equally inappropriate because it also ignores variation among individuals.
One possible solution to this problem is to identify approximation methods that are com-
patible across all members of the Hominoidea superfamily. If a consistent pattern in covaria-
tion between soft tissue and craniometric measurements can be identified in extant hominids,
then extinct hominids can reasonably be assumed to have followed suite. Such covariations
were first explored in human material by Sutton [20] and extended in Simpson and Henneberg
[21]. Correlations were found and multiple linear regression models were used to generate
equations for improving estimations of soft tissue thickness from craniometrics alone in mod-
ern humans, though this covariance has rarely been used in facial approximations. Reactions
to the results of these studies are mixed. Stephan and Sievwright [22], using data measured
with substantial random errors, report that regression models have low correlation coefficients
PLOS ONE | https://doi.org/10.1371/journal.pone.0245760 June 4, 2021 2 / 25PLOS ONE Towards the restoration of ancient hominid craniofacial anatomy
that do not improve soft tissue thickness estimates above population means. However, Dinh,
Ma [23] repeated the use of linear regression models and produced favorable results that
encourage further exploration. Thus, for the purpose of hominid facial approximation, the
possibility of generating soft tissue thickness values that are individualized to a specific homi-
nid specimen is undoubtably better than extrapolation of species-specific means.
The present study is motivated by the aforementioned concerns and while we hold that the
findings reported here are valuable we raise three caveats at the outset: 1) As in previous stud-
ies of chimpanzee soft tissues [24–26], this study includes only a small sample of chimpanzees
and, therefore, the conclusions from the results are subject to further testing on larger samples;
2) We also do not include other members of the African ape clade and so we cannot expand
our findings to the entire Hominoidea superfamily; and 3) We do not claim to eliminate the
need for informed speculation in hominid facial approximation entirely. Not all soft tissue
characters of ancient hominids are addressed here, such as the facial features (eyes, nose,
mouth, and ears), which arguably have a much greater impact on the variability between
reconstructions of the same individual than soft tissue thicknesses alone. This work represents
a step towards an empirical method that will strengthen the practice, but it is by no means a
final solution to the problem.
The aims are: (1) To validate in chimpanzees (Pan troglodytes) that facial soft tissue thick-
nesses covary with craniometric dimensions, and (2) to produce soft tissue prediction models
with interspecies compatibility from chimpanzee material that can be used in the facial
approximation of extinct hominids.
Materials and methods
Computed tomography scans of 28 chimpanzees were collected from two separate data reposi-
tories. Scans were accessed online, via the Digital Morphology Museum, KUPRI (dmm.pri.
kyoto-u.ac.jp) and Morphosource (https://www.morphosource.org), and obtained as Digital
Imaging and Communications in Medicine (DICOM) format bitmap files. After excluding
two neonates, one infant and six subjects showing obvious pathological effects or degradation
caused by decomposition, the study sample contained 19 individuals of known age, sex, and
subject condition. The sex ratio was 1:1.71 (7 male and 12 female) and the mean age was 30.9
years (minimum = 9; maximum = 44; SD = 10.1). Subject condition was varied and included
seven living, five fresh, five frozen, and two subjects that were preserved by immersion. Infor-
mation on whether individual subjects were scanned in the supine or prone position was not
available at the time of this study. Further information on whether subjects had been living in
the wild prior to scanning was also not available but the study sample is assumed to consist of
animals that were housed in captivity only. A complete list of all subjects used in this study is
presented in the (S1 Table).
Prior to measuring, all skulls were oriented in the Frankfurt horizontal plane determined
according to its original definition by a horizontal line passing through the inferior border of
the orbital rim (mid-infraorbital) and the top of the external auditory meatus (porion) on both
sides of the skull. Facial soft tissue thickness was then measured at 39 cephalometric landmarks
(Fig 1; 17 medial and 22 bilateral) in OsiriX, v. 11.02 (Visage Imaging GmbH, Sand Diego,
USA), which has been shown to produce accurate measurements that can be reliably compared
between separate studies [27, 28]. Cephalometric landmarks were selected based on common
depths found in the facial approximation literature [21, 29–31]. However, to allow for other
aspects of the head beyond the face to be investigated, further points were added to include a
wider range of points than normal, particularly points on the lateral areas of the head. The
decision to include additional points can be explained as follows. The purpose of facial
PLOS ONE | https://doi.org/10.1371/journal.pone.0245760 June 4, 2021 3 / 25PLOS ONE Towards the restoration of ancient hominid craniofacial anatomy
Fig 1. Locations of cephalometric landmarks on Pan troglodytes skull in norma frontalis and norma lateralis. See abbreviations in Table 1.
https://doi.org/10.1371/journal.pone.0245760.g001
approximation of modern humans is to generate a specific recognition of a target individual,
however, in facial approximation of ancient hominids the purpose is to show morphological
differences between separate species. As morphological differences extend beyond the face to
the rest of the head, the inclusion of further points allows for such comparisons to be made. A
maximum total of 61 soft tissue depth measurements were possible per individual as well as 21
measurements of craniometric dimensions. All cephalometric points were positioned onto 3D
volume renderings of the skulls prior to measuring with the exception of 6 points (gnathion,
metopion, mid-mandibular body, mid-mandibular border, mid-nasal, mid-philtrum) that
were more precisely aligned in 3D multiplanar reformatting by halving the inter-landmark dis-
tance between two adjacent points along the sagittal plane. When analyzing scans, it was
noticed that some sutures of the cranium had been obliterated. However, as sutures are needed
for the positioning of bregma, dacryon, ectoconchion, nasion, pterion, and zygomaxillare,
these points were positioned and cross-checked against a reference skull of a chimpanzee from
the Vernon-Roberts Anatomy and Pathology Museum, University of Adelaide. Depths at all
landmarks were then measured perpendicular to the bone surface using the coronal, sagittal,
and transverse planes to control the direction of measurement. Xscope, v. 4.4.1 (ARTIS Soft-
ware, Virginia, USA) was used to superimpose horizontal and vertical guides during the mea-
surement procedure to keep measurements parallel to the reference planes. For thicknesses at
bilateral landmarks, measurements were taken from both the right and the left side of the face
and then the mean was calculated. Very few depths were unobtainable with the exception
being those landmarks located in areas of incomplete DICOM data or where the soft tissues
were outside of the anatomical position. For example, craniometrics crossing the occlusal line
were not taken from subjects with open mandibles and soft tissue measurements were not
taken for prosthion and/or infradentale in subjects with folded lips. Table 1 gives a complete
list of all landmarks used in this study, their definitions, as well as their corresponding planes
and angles of measurement. All soft tissue thickness data collected for chimpanzees has been
made available by the authors on Figshare (https://figshare.com/s/8a3ba7df4dad9df7d70d).
PLOS ONE | https://doi.org/10.1371/journal.pone.0245760 June 4, 2021 4 / 25PLOS ONE Towards the restoration of ancient hominid craniofacial anatomy
Table 1. Cephalometric landmarks including their abbreviations, definitions, planes of measurement, and angles of measurement.
Landmark Abbreviation Definition Plane of Angle of
measurement measurement
Alare al Instrumentally determined as the most lateral point on the nasal aperture in a transverse parallel to
transverse plane reference plane
Bregma b Where the sagittal and coronal sutures meet sagittal perpendicular to
bone
Canine eminence ce Most anterior point on the eminence of the maxillary canine sagittal perpendicular to
bone
Condylion laterale cdl Most lateral point on the mandibular condyle coronal parallel to
reference plane
Ectoconchion ec(a) Lateral point of the orbit at a line that bisects the orbit transversely transverse parallel to
anterius reference plane
Ectoconchion ec(l) Most lateral point of the orbit, at a right angle to ec(a) in the transverse plane transverse parallel to
lateralis reference plane
Ectomolare2 ecm2 Most lateral point on the buccal alveolar margin, at the center of the M2 position coronal parallel to
reference plane
Ectomolare2 ecm2 Most lateral point on the buccal alveolar margin, at the center of the M2 position coronal parallel to
reference plane
Euryon eu Instrumentally determined as the most lateral point of the cranial vault, on the transverse parallel to
parietal bone reference plane
Frontotemporale ft Most anterior and medial point of the inferior temporal line, on the zygomatic coronal parallel to
process of the frontal bone reference plane
Glabella g Most projecting anterior median point on lower edge of the frontal bone, on the sagittal parallel to
brow ridge, in-between the superciliary arches and above the nasal root reference plane
Gnathion gn Median point halfway between pg and me sagittal perpendicular to
bone
Gonion go Point on the rounded margin of the angle of the mandible, bisecting two lines. One transverse parallel to
following vertical margin of ramus and one following horizontal margin of corpus of reference plane
mandible
Infra canine iC Point on the inferior alveolar ridge inferior to the crown of the mandibular canine(s) transverse perpendicular to
bone
Infradentale id Median point at the superior tip of the septum between the mandibular central sagittal parallel to
incisors reference plane
Infraorbital foramen if Most inferior point on the margin of the infraorbital foramen transverse perpendicular to
bone
Jugale ju Vertex of the posterior zygomatic angle, between the vertical edge and horizontal part transverse parallel to
of the zygomatic arch reference plane
Mentale ml Most inferior point on the margin of the mandibular mental foramen transverse perpendicular to
bone
Menton me Most inferior median point of the mental symphysis sagittal perpendicular to
bone
Metopion m Median point, instrumentally determined on the frontal bone as the greatest elevation sagittal perpendicular to
from a cord between n and b bone
Mid-infraorbital mio Point on the anterior aspect of the inferior orbital rim, at a line that vertically bisects sagittal parallel to
the orbit reference plane
Mid-mandibular mmbod Point on the lateral border of the corpus of the mandible midway between pg and go coronal perpendicular to
body bone
Mid-mandibular mmbor Point on the inferior border of the corpus of the mandible midway between pg and coronal perpendicular to
border go bone
Mid-nasal mn Point on internasal suture midway beteen n and rhi sagittal perpendicular to
bone
Mid-philtrum mp Median point midway between ss and pr sagittal perpendicular to
bone
Mid-ramus mr Midpoint along the shortest antero-posterior depth of the ramus, in the masseteric coronal perpendicular to
fossa, and usually close to the level of the occlusal plane bone
(Continued )
PLOS ONE | https://doi.org/10.1371/journal.pone.0245760 June 4, 2021 5 / 25PLOS ONE Towards the restoration of ancient hominid craniofacial anatomy
Table 1. (Continued)
Landmark Abbreviation Definition Plane of Angle of
measurement measurement
Mid-supraorbital mso(a) Point on the anterior aspect of the superior orbital rim, at a line that vertically bisects sagittal parallel to
anterius the orbit reference plane
Mid-supraorbital mso(s) Most superior point on the brow ridge, at a right angle to mso(a) in the saggital plane sagittal parallel to
superius reference plane
Nasion n Intersection of the nasofrontal sutures in the median plane sagittal parallel to
reference plane
Opisthocranion op Most posterior median point on the occipital bone, instrumentally determined as the sagittal parallel to
greatest chord length from g. Note that this points is not necessarily at the tip of the reference plane
nasal spine.
Pogonion pg Most anterior median point on the mental eminence of the mandible sagittal perpendicular to
bone
Porion po Most superior point on the upper margin of the external auditory meatus sagittal parallel to
reference plane
Prosthion pr Median point between the central incisors on the anterior most margin of the sagittal parallel to
maxillary alveolar rim reference plane
Pterion pt A circular region, marked by the sphenoparietalis suture at its center. This region transverse parallel to
marks the thinnest part of the cranial vault. reference plane
Rhinion rhi Most rostral (end) point on the internasal suture. It cannot be determined accurately sagittal perpendicular to
if nasal bones are broken distally. bone
Subnasale sn The deepest point seen in the profile view below the anterior nasal spine sagittal perpendicular to
bone
Supra canine sC Point on superior alveolar ridge superior to the crown of the maxillary canine(s) transverse perpendicular to
bone
Supraglabellare sg Deepest part of the supraglabella fossa in the median plane sagittal parallel to
reference plane
Supramentale sm Deepest median point in the groove superior to the mental eminence sagittal perpendicular to
bone
Vertex v Most superior point of the skull sagittal parallel to
reference plane
Zygion zy Instrumentally determined as the most lateral point on the zygomatic arch coronal parallel to
reference plane
Zygomaxillare zm Most inferior point on the zygomaticomaxillary suture transverse parallel to
reference plane
Landmarks are positioned and measurements taken assuming the FH position.
Points are listed in alphabetical order for ease of reference.
https://doi.org/10.1371/journal.pone.0245760.t001
Intra-observer soft tissue and craniometric measurement reliability was assessed by test-
retest measurements following recently discussed data collection protocols in Stephan et al.
[32]. Measurements were taken on a subsample of five individuals that were randomly selected
by a volunteer. Specimens were PRI-9783, PRI- Akira, PRI-10814, PRI-Mari, and PRI-Reiko.
Measurements of each specimen were conducted on separate days over a four-hour period
with retest measurements taken seven days after initial assessment for 40 total measuring
hours (96 hours including the entire sample). Intra-observer measurement reliability was cal-
culated using the technical error of measurement (TEM) equation:
pffiffiffiffiffiffiffiffiffiffiffiffiffiffiffiffi
TEM ¼ SD2 =2n
Where D is the difference between the values obtained for measurements taken on two sepa-
rate occasions for each variable raised to the second power and n is the number of individuals
measured. The relative TEM (r-TEM) was also calculated by dividing TEM by the mean
PLOS ONE | https://doi.org/10.1371/journal.pone.0245760 June 4, 2021 6 / 25PLOS ONE Towards the restoration of ancient hominid craniofacial anatomy
measurement to convert to a percentage value. The addition of another investigator to deter-
mine inter-observer errors was not included in this study as Stephan et al. [32] do not appear
to suggest that it is necessary to do both, especially when the entire study is conducted by a sin-
gle observer.
Two-tail t-tests were used to analyze differences in mean soft tissue thicknesses and cranio-
metric dimensions between males and females as well as between living and deceased subjects.
Significance levels were set at p < 0.05 but altered according to the Bonferroni adjustment for
39 comparisons of soft tissue thicknesses and 21 comparisons of craniometric dimensions.
Post-hoc power analyses were also performed to validate conclusions from two-tail t-tests.
These analyses were conducted in Microsoft1 Excel1, v. 16.39 for Mac.
Data distribution was checked using the Kolmogorov-Smirnov and Shapiro-Wilk tests. All
variables’ distributions did not differ significantly from the normal distribution, so no attenua-
tion correction was made. Stepwise multivariate linear regression analysis was then performed
to examine the relationships between facial soft tissue thicknesses and craniometric dimen-
sions. Due to the small sample size, missing values in the data set were imputed with variable
means rather than using list-wise or pair-wise deletion. These analyses were carried out with
the Statistical Package for the Social Sciences (SPSS1) software, v. 26.0 for Mac (SPSS Inc, Chi-
cago, II, USA).
To assess the validity of the regression models, they were tested on an in-group sample of
19 subjects. We admit that it would have been better to perform this test on a separate sample
of chimpanzees, rather than the same (training) sample. However, given that the total sample
size was already small (n = 19), and no other samples were available, it was decided that it
would be better to maintain the largest possible sample size for the regression analyses, rather
than removing some individuals to generate a separate out-of-group sample just for validation.
With that said, craniometric measurements for each subject, taken from the results of the
above described measurement procedure, were employed with the appropriate regression
models to predict facial soft tissue thickness at 26 landmarks (8 medial and 18 bilateral).
Empirical comparisons were then calculated as the simple difference, z-score and relative per-
cent difference between predicted and observed soft tissue thicknesses. These analyses were
conducted in Microsoft1 Excel1, v. 16.39 for Mac.
To validate the interspecies compatibility of the regression models, an out-of-group test
was conducted on computed tomography scans of one living adult modern human male of
European decent and one wet specimen of a deceased sub-adult male bonobo (Pan paniscus;
subject S9655). Bonobos and chimpanzees are highly similar to each other in many respects,
however, they are classified as distinct species [33]. S9655 is a sub-adult (4 years) male and
thus outside the age-range of this study sample. Therefore, the bonobo served as an indepen-
dent test on a sub-adult individual belonging to a separate species that was not used to generate
the regression models. Moreover, to the knowledge of the authors, this is the only bonobo scan
that is publicly available and as such removes the possibility of selection bias. The bonobo was
accessed online via Morphosource (https://www.morphosource.org). The human subject was
donated specifically for the purpose of this study to the University of Adelaide by an anony-
mous donor. Both subjects were obtained as DICOM format bitmap files. Soft tissue measure-
ments used in the comparison between observed and predicted values were taken following
the aforementioned protocol and the landmarks are listed in Table 1.
To demonstrate the practical utility of the regression models, a 3D facial approximation
was performed on the skull of subjects PRI-Cleo, S9655, as well as on an Australopithecus afri-
canus skull (a composite reconstruction of specimens Sts 5 and Sts 52) previously described in
Strait et al. [34] and Benazzi et al. [35, 36]. The Sts 5 specimen, dated to 2.14 Ma [37] and
found in 1947 at the South African Sterkfontein site by Robert Broom and John Robinson
PLOS ONE | https://doi.org/10.1371/journal.pone.0245760 June 4, 2021 7 / 25PLOS ONE Towards the restoration of ancient hominid craniofacial anatomy
[38], is a perfect candidate for demonstrating the utility of the facial approximation method.
Despite the edentulous maxilla and a break in the cranium associated with a dynamite explo-
sion at the time of discovery, Sts 5 is an exceptionally preserved specimen relative to most
other Plio-Pleistocene hominid skulls [39–41]. It is worth nothing here that while the identifi-
cation of Sts 5 as a female has been and is still the subject of ongoing debate [42–44], the cranial
features of the Sts 5 specimen suggest that it was certainly not a subadult individual; therefore,
it is well within the age-range of this study sample [45, 46]. The Sts 52 mandible was recon-
structed using state-of-the-art digital methods from research quality casts of the original speci-
men. For a full description of the digital reconstruction process, see S1 Table in Benazzi et al.
[35].
To begin the facial approximation procedure, soft tissue thicknesses were estimated for all
three subjects by taking craniometric measurements from the skulls in digital format and
inserting these measurements into the appropriate regression models. The resulting values
were then used to design and place pegs corresponding to the results onto the skulls at their
appropriate cephalometric points in Autodesk Maya, 2018 (Autodesk, San Rafael, CA). Both
skulls were then 3D printed as recommended by Walker and Humphries [47]. Each skull was
printed separately with articulated mandibles on the M200 3D printer (Zortrax1) in acryloni-
trile butadiene styrene via fused deposition modelling. Post-processing of prints involved the
removal of all support material and then mounting the skulls in the Frankfurt horizontal
plane. As a precautionary measure, all three of the 3D printed skulls were measured and cross-
checked against measurements taken from their digital counterparts. No discrepancies were
observed. The soft tissues were then constructed using an oil-based modelling medium by GV
using the pegs to guide the thicknesses at each cephalometric point. Given that facial features
(eyes, nose, mouth, and ears) were not the focus of the present study and are likely to be based
on intuition rather than empirical science, especially in the case of A. africanus, the eyes were
closed, the nose and mouth were left undefined, and the ears were omitted from all three
approximations.
Results
The descriptive statistics for soft tissue measurements and the craniometrics are presented in
Tables 2 and 3 respectively, along with the intra-observer TEM and r-TEM for each variable.
The mean intra-observer r-TEM for measurements of soft tissue thickness was 2.38%. The
lowest intra-observer r-TEM was observed for prosthion (0.45%) and the largest was rhinion
(7.00%). For the craniometrics, the mean intra-observer r-TEM was 0.25%. The lowest intra-
observer r-TEM was observed for the distance from vertex to subnasale (0.05%) and the largest
was for bigonial breadth (0.93%). It may be suggested that the TEM values reported here are
underestimates because the repeat measurements were performed on the same scans rather
than replicating the whole measurement process to include the reacquisition of scans. How-
ever, not only are CT scans of great apes exceptionally rare but also reacquisition of scans of
living apes would expose these endangered animals to needless levels of ionizing radiation and
is, therefore, unethical.
Two-tail t-tests show that there were no significant differences between living and deceased
chimpanzee means across all 39 soft tissue thicknesses (Table 2) and 21 craniometric dimen-
sions (Table 3). This implies that the use of fresh, frozen, and immersed subjects in this study
did not compromise the validity of the results. However, post-hoc power analysis revealed that
the probability of detecting a significant difference was low and that these results should be
taken as tentative. In contrast, post-hoc power analysis revealed that comparisons of sexual
dimorphisms were valid. Our results are in agreement with prior research carried out on living
PLOS ONE | https://doi.org/10.1371/journal.pone.0245760 June 4, 2021 8 / 25PLOS ONE Towards the restoration of ancient hominid craniofacial anatomy
Table 2. Descriptive statistics of facial soft tissue thickness in mm for Pan troglodytes.
Variablea Mean SD Minimum Maximum n TEMb (mm) rTEMc (%)
Median points
v 5.36 2.28 2.40 8.83 13 0.05 0.97
b 4.17 1.50 2.23 7.89 13 0.18 4.55
m 3.29 1.04 1.79 5.44 12 0.19 5.88
sg 3.80 1.56 2.00 8.49 15 0.08 2.18
g 4.00 1.09 2.39 6.13 17 0.20 6.45
n 3.24 0.83 1.98 5.27 19 0.06 1.99
mn 2.33 0.50 1.59 3.42 19 0.06 2.39
rhi 4.07 1.53 1.00 8.31 18 0.26 7.00
sn 7.33 1.94 3.72 12.50 18 0.15 1.70
mp 12.29 4.49 6.42 20.20 12 0.51 3.71
pr 14.06 2.16 10.60 17.85 9 0.07 0.45
id 15.54 3.71 10.10 22.55 14 0.18 0.94
sm 17.79 3.98 10.60 24.35 17 0.43 2.21
pg 12.37 4.18 4.80 19.00 16 0.55 3.35
gn 8.01 3.31 3.17 13.70 17 0.29 2.45
me 5.86 2.04 3.10 10.70 17 0.15 2.35
Bilateral points
mso(a) 7.25 1.63 4.27 9.73 15 0.11 1.80
mso(s) 4.69 1.39 2.83 7.30 15 0.13 2.34
mio 5.86 2.25 3.01 12.35 19 0.11 1.94
ec(a) 6.01 1.84 1.91 8.81 18 0.21 2.98
ec(l) 7.14 2.91 2.43 12.60 17 0.07 0.81
zy 7.13 2.36 2.54 11.70 18 0.21 2.70
cdl 20.83 5.72 10.33 32.95 18 0.20 0.89
ft 26.97 9.25 13.20 41.73 13 0.53 1.67
pt 34.64 9.10 19.75 56.75 15 0.28 0.77
eu 20.16 7.45 10.21 36.30 12 0.23 1.15
ju 7.99 2.96 3.15 14.60 18 0.16 1.74
if 9.52 1.84 5.70 12.48 19 0.07 0.77
zm 9.17 2.66 2.67 13.23 18 0.09 1.03
ce 11.21 3.74 6.05 18.25 18 0.26 2.27
ecm2 22.50 6.52 14.93 37.10 19 0.60 2.88
ecm2 20.04 5.98 12.80 33.50 19 0.60 3.17
sC 9.88 2.19 6.30 13.08 14 0.20 2.02
iC 11.19 2.21 8.41 16.05 18 0.13 1.04
ml 7.17 2.14 3.54 12.25 17 0.31 5.32
mr 26.63 6.70 14.35 44.70 18 0.17 0.59
go 11.44 3.64 5.22 19.78 18 0.51 3.35
mmborder 5.24 2.42 2.15 10.55 17 0.07 1.35
mmbody 13.95 7.15 4.27 34.05 18 0.27 1.58
a
See variable abbreviations in Table 1.
b
Technical error of measurement.
c
Relative technical error of measurement.
https://doi.org/10.1371/journal.pone.0245760.t002
chimpanzees in that there are no significant differences between male and female means [18],
with the exception of two soft tissue landmarks (vertex and frontotemporale) and two
PLOS ONE | https://doi.org/10.1371/journal.pone.0245760 June 4, 2021 9 / 25PLOS ONE Towards the restoration of ancient hominid craniofacial anatomy
Table 3. Descriptive statistics of craniometric dimensions in mm for Pan troglodytes.
Variablea Measurement Mean SD Minimum Maximum n TEMb (mm) rTEMc (%)
v-po auricular height 65.61 4.14 58.80 73.40 13 0.10 0.15
v-g distance from vertex to glabella 89.63 6.02 74.60 99.00 12 0.07 0.08
v-n distance from vertex to nasion 92.45 5.56 78.10 100.00 13 0.11 0.12
v-sn distance from vertex to subnasale 135.25 7.39 118.30 149.50 13 0.07 0.05
v-gn distance from vertex to gnathion 198.87 11.98 178.80 228.10 12 0.45 0.23
g-n supraorbital torus height 11.03 2.51 6.09 15.85 18 0.06 0.56
g-sn distance from glabella to subnasale 60.84 7.26 36.60 68.20 18 0.13 0.21
g-gn total face height 140.92 11.63 125.20 167.70 17 0.22 0.16
g-op maximum head length 142.51 7.29 132.50 153.60 15 0.19 0.13
n-sn nasal height 53.43 4.55 44.30 61.30 19 0.15 0.29
n-pr upper face height 86.63 7.91 75.10 101.10 19 0.11 0.13
id-gn mandibular symphysis height 41.44 5.69 31.00 51.70 19 0.11 0.27
eu-eu maximum head breadth 97.98 3.90 90.95 104.00 13 0.13 0.13
ft-ft minimum frontal breadth 45.51 9.21 32.00 66.40 15 0.08 0.18
zy-zy bizygomatic breadth 131.11 11.05 116.50 156.40 19 0.07 0.05
c-c intercanine breadth 63.00 7.38 47.60 75.10 19 0.39 0.62
go-go bigonial breadth 96.39 10.17 79.50 118.50 19 0.90 0.93
al-al nasal breadth 27.95 1.90 24.40 31.15 19 0.04 0.16
ec-ec biorbital breadth 91.20 5.26 84.00 102.40 19 0.35 0.39
obh orbital height 34.54 2.16 29.90 37.50 19 0.08 0.23
obb orbital breadth 36.13 2.32 31.60 41.38 19 0.08 0.23
a
See variable abbreviations in Table 1.
b
Technical error of measurement.
c
Relative technical error of measurement.
https://doi.org/10.1371/journal.pone.0245760.t003
craniometrics (bizygomatic breadth and inter-canine breadth). The greatest difference
between male and female soft tissue measurements was observed for vertex, and the lowest dif-
ference for the craniometric was observed for bizygomatic breadth. Note that this means there
were only two instances out of 39 soft tissue depths and 21 craniometric dimensions that were
significantly different between the sexes.
In stepwise multivariate linear regression analyses, statistically significant (p < 0.05) corre-
lations between soft tissue depth measurements (Table 2) and craniometric dimensions
(Table 3) were found. Of the 39 cephalometric landmarks assessed, statistically significant
regression models were established for 26 landmarks (8 medial and 18 bilateral) and these are
given in Table 4. Scatterplots showing four examples of bivariate relationships are shown in
Fig 2. As such, it is now possible to reconstruct soft tissue thickness at 44 individual points on
the face of chimpanzees using regression models alone. The mean standard error of the esti-
mate (SEE) was 2.39 mm, ranging from 0.42 mm for menton to 5.29 mm for ectomolare2, and
the mean multiple correlation coefficients (R = 0.67) far exceed those produced in previous
studies of human material [21, 22]. The model with the highest correlation coefficient was
pterion (r = 0.93) and the lowest was mid-nasal (r = 0.46). A factor that should be considered
here is that if this study sample of chimpanzees was indeed composed of subjects that were
scanned in both the supine and prone positions, then the correlations observed here are likely
underestimates and the true strengths of correlations higher than those reported.
The results of the regression models applied to the in-group sample of 19 subjects are
shown in Table 5. Overall, the performance of the regression models was accurate as the
PLOS ONE | https://doi.org/10.1371/journal.pone.0245760 June 4, 2021 10 / 25PLOS ONE Towards the restoration of ancient hominid craniofacial anatomy Table 4. Chimpanzee-derived linear regression models for medial and bilateral facial soft tissue thicknesses. Variable Linear regression modela R SE P Median points Vertex 0.095 (zy-zy)– 0.310 (g-n)– 3.680 0.71 1.40 0.04 Bregma 0.052 (v-gn)– 0.205 (g-n) + 0.048 (g-gn)– 10.689 0.87 0.70 0.04 Metopion 0.113 (v-p)– 0.158 (g-n) + 0.055 (v-sn)– 9.832 0.88 0.42 0.01 Supraglabella 0.149 (v-sn)– 16.370 0.66 1.07
PLOS ONE                                                                                       Towards the restoration of ancient hominid craniofacial anatomy

    Fig 2. Scatterplots showing four examples of covariation between facial soft tissue and craniometric measurements in chimpanzees. (A) Correlation between
    canine eminence and mandibular symphysis height. (B) Correlation between ectomolare2 and nasal breadth. (C) Correlation between euryon and distance from
    vertex to gnathion. (D) Correlation between mid-ramus and bigonial breadth.
    https://doi.org/10.1371/journal.pone.0245760.g002

                                                   model produced a negative result, which clearly indicates a fundamental problem with chimp-
                                                   derived regression models for predicting modern human soft tissue thicknesses. As it is not
                                                   possible for tissues thicknesses to be negative or equal to zero a 3D facial approximation of the
                                                   human subject was not produced.

                                                   Discussion
                                                   Despite the aforementioned limitations of sample size, specimen condition, and complica-
                                                   tions related to the reacquisition of scans, we have observed that soft tissue thicknesses
                                                   covary with craniometric dimensions in chimpanzees. Using Stephan’s [17] previously pub-
                                                   lished soft tissue thicknesses for humans, a comparison can be made for 23 cephalometric
                                                   points between P. troglodytes and H. sapiens means. Fig 5A shows a number of human
                                                   thicknesses that are more similar to chimpanzees than reported in previous research mea-
                                                   suring chimpanzee tissue thicknesses via ultrasound [18]. The thickness of soft tissue in the
                                                   area of the cheeks, which corresponds to landmarks ectomolare2 and ectomolare2, has been
                                                   reported to differ between humans and chimpanzees with humans having thicker cheeks as
                                                   a result of increased adipose tissue at this region [6, 18]. However, our data show that mean

PLOS ONE | https://doi.org/10.1371/journal.pone.0245760 June 4, 2021                                                                                     12 / 25
PLOS ONE Towards the restoration of ancient hominid craniofacial anatomy
Table 5. Average differences between predicted soft tissue thicknesses and ground truth values in this study sample of chimpanzees (Pan troglodytes).
Variablea Difference (mm) Z-score Relative difference (%) n
Median points
v 1.22 0.51 25.33 11
b 0.57 0.35 15.06 11
m 0.33 0.31 10.59 10
sg 0.96 0.56 24.02 11
mn 0.30 0.61 11.62 11
sn 1.55 0.70 19.18 10
pr 1.14 0.42 7.62 5
me 1.23 0.52 20.13 10
Bilateral points
mso(s) 1.45 0.96 26.64 11
ec(l) 1.18 0.38 18.35 11
zy 1.44 0.54 21.02 11
cdl 3.32 0.47 16.69 11
ft 2.78 0.30 9.85 10
pt 2.82 0.28 8.77 10
eu 3.79 0.46 21.32 10
ju 1.83 0.56 23.35 11
if 1.42 0.78 14.82 11
zm 2.03 0.63 26.00 10
ce 1.87 0.55 16.55 10
ecm2 5.18 0.79 22.78 11
ecm2 3.35 0.62 15.99 11
iC 1.60 0.60 13.90 10
mr 3.33 0.54 14.45 11
go 2.57 0.59 21.64 11
mmbor 1.56 0.61 28.50 10
mmbod 2.27 0.38 17.11 11
a
See variable abbreviations in Table 1.
https://doi.org/10.1371/journal.pone.0245760.t005
thicknesses at ectomolare2 are identical between humans and chimpanzees and that ecto-
molare2 is only marginally larger in humans. Similarly, zygion is identical between species
and not smaller in chimpanzees as previously reported. It is worth noting here that since
measurements taken by ultrasound are known to compress the tissues of the face in com-
parison to CT based measurements [32], soft tissue thickness at zygion was most likely
underestimated in the previous study [18]. Of the larger differences shown in Fig 5B, there
are only slight differences between human and chimpanzee means (minimum = 2 mm;
maximum 7.8 mm). It is important to note that this comparison includes only 23 out of the
39 points that were measured in this study and, therefore, a more thorough comparison
composed of a larger sample of human values may reveal less similarities than what is
reported here. It may be argued also that, based on the similarities identified here, human
and chimpanzee means are largely interchangeable and that this may appear like a valid
option in the facial approximations of extinct hominids. However, we would like to remind
the reader of two problems inherent in using means: 1) means have only been verified for a
limited number of landmarks and therefore other regions of the face and head will need to
be intuited or the thicknesses interpolated from species specific means; and, more
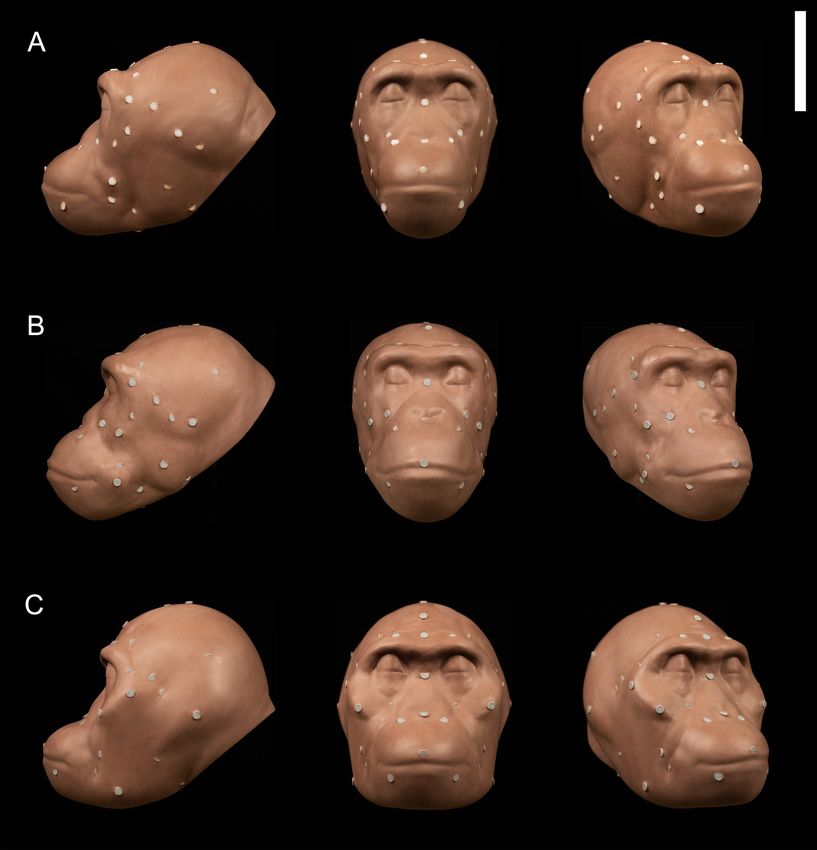
PLOS ONE | https://doi.org/10.1371/journal.pone.0245760 June 4, 2021 13 / 25PLOS ONE Towards the restoration of ancient hominid craniofacial anatomy Fig 3. 3D facial approximations of PRI-Cleo (Pan troglodytes; A), 29655 (Pan paniscus; B), and composite skull of Australopithecus africanus (Sts 5 and Sts 52; C) in right three quarter view (30˚ rotation from full face), norma frontalis and, norma lateralis. Note that the angle of the head in each facial approximation follows standard orientation methods established for modern humans. For P. troglodytes, P. paniscus, and A. africanus this angle may be unjustified biomechanically (Johanson, 1981). Scale bar = 10 cm. https://doi.org/10.1371/journal.pone.0245760.g003 PLOS ONE | https://doi.org/10.1371/journal.pone.0245760 June 4, 2021 14 / 25
PLOS ONE                                                                                       Towards the restoration of ancient hominid craniofacial anatomy

                                           Fig 4. Depth chart comparison of observed (�) and predicted (●) facial soft tissue thickness values between facial
                                           approximations of PRI-Cleo (Pan troglodytes; A), 29655 (Pan paniscus; B), and modern human male of European
                                           descent (Homo sapiens; C). Predicted thickness values for the composite skull of Australopithecus africanus (Sts 5 and
                                           Sts 52; D) are also shown. See abbreviations in Table 1.
                                           https://doi.org/10.1371/journal.pone.0245760.g004

PLOS ONE | https://doi.org/10.1371/journal.pone.0245760 June 4, 2021                                                                                       15 / 25
PLOS ONE Towards the restoration of ancient hominid craniofacial anatomy
Fig 5. Line charts of Pan troglodytes (�) and Homo sapiens (●) means comparing values with differences < 2 mm (A) and differences > 2 mm (B).
https://doi.org/10.1371/journal.pone.0245760.g005
importantly 2), means completely ignore variation among individuals. If we had interpo-
lated chimpanzee means into our facial approximation of S9655 the average difference
between the observed and predicted soft tissue thicknesses would have been 3.1 mm (mini-
mum = 0.2 mm; maximum = 11.3 mm), which is higher than the average difference of 1.5
mm (minimum = 0 mm; maximum = 4.1 mm) that was produced using the regression mod-
els. Furthermore, with regard to our comparison of soft tissue thicknesses and craniometric
dimensions between male and female chimpanzees, we have shown that in general they do
not display sexual dimorphism and that this does not justify producing separate soft tissue
prediction models for males and females because variation between sexes is negligible. In
this respect, sexual dimorphism in chimpanzees is similar to modern humans [48], which
corresponds with previous analyses of craniofacial sexual dimorphism among extant homi-
nids [49, 50].
The results of the out-of-group tests on the bonobo and human subjects suggest that
chimp-derived regression models are compatible with species that have craniometrics that are
more similar to chimpanzees than to those of modern humans. As is presented in Table 6 and
Fig 6, chimpanzees, bonobos, and modern humans do not equally display disparate cranio-
metric differences. Of the 15 craniometrics taken from S9655, only four were outside the range
of variation observed in this study sample of chimpanzees, whereas the human subject pre-
sented 11 craniometrics that were outside the range. The slight differences observed in the cra-
niometric dimensions for S9655, however, did not appear to largely affect the predictive
accuracy of the regression models, whereas large differences observed in the craniometric
dimensions of the human subject produced large estimation errors. With the understanding
that the craniofacial morphology of bonobos is similar to chimpanzees, particularly in cranial
dimensions and the morphology of the masticatory apparatus, this result is to be expected. We
admit that this test was conducted on two individuals only and that this may be perceived as
weak evidence for regression model interspecies compatibility, however, we think it unreason-
able to assert that all 26 regression models have performed fittingly on the bonobo subject and
poorly on the human subject as a result of random chance.
PLOS ONE | https://doi.org/10.1371/journal.pone.0245760 June 4, 2021 16 / 25PLOS ONE Towards the restoration of ancient hominid craniofacial anatomy
Table 6. Craniometrics taken from skulls of PRI-Cleo (Pan troglodytes), 29655 (Pan paniscus), composite skull of Australopithecus africanus (Sts 5 and Sts 52) and
modern human male of European descent (Homo sapiens).
Variablea PRI-Cleo (P. troglodytes) 29655 (P. paniscus) Sts5/Sts52a (A. africanus) Human subject (H. sapiens)
zy-zy 116.50 114.90 125.68 126.40
g-n 8.10 6.22 14.45 8.12
v-gn 178.80 191.55 195.55 224.30
g-gn 128.90 130.60 118.25 116.80
v-po 61.40 63.05 72.01 116.80
v-sn 132.80 141.50 132.90 174.40
id-gn 31.00 30.05 22.43 25.50
al-al 24.40 32.80 27.10 21.00
v-g 90.30 91.20 90.38 134.70
c-c 50.60 52.70 44.50 34.00
v-n 97.20 92.45 92.08 136.50
go-go 79.50 79.45 78.80 91.00
n-pr 77.60 86.60 79.85 67.20
ft-ft 51.60 72.05 63.98 93.50
n-sn 58.40 59.25 44.09 47.80
a
See variable abbreviations in Table 1.
Bolded text indicates where craniometrics were outside ± two standard deviations from chimpanzee sample means.
https://doi.org/10.1371/journal.pone.0245760.t006
Given that covariation between soft tissue thicknesses and craniometric measurements has
been observed in both extant Homo and Pan species, we hold that it is reasonable to assume
that such covariation was present in archaic hominids, such as Sts 5. We submit also that skull
morphology is the prime determinant of regression model interspecies compatibility and that
chimpanzee-derived regression models are valid for reconstructing the facial appearance of Sts
5. The justification for this is as follows. First, Sts 5’s craniometrics were just as different from
chimpanzees as S9655’s were (Table 6 and Fig 6). We must therefore agree with previous
authors [51–53] in that Pan appears to be the most suitable extant hominid upon which
extrapolations of covariation can be made for A. africanus. It is supported by the fact that since
the chimpanzee-bonobo split c.2 Ma ago there have been no musculoskeletal changes in bono-
bos [24]. If bonobos had gone extinct c.2 Ma ago chimpanzee-derived regression models
would still have produced an accurate result. Based on this and the closer affinity of the Sts 5
Fig 6. Skulls of PRI-Cleo (Pan troglodytes; A), 29655 (Pan paniscus; B), the composite skull of Australopithecus africanus (Sts 5 and Sts 52; C), and modern
human male of European decent (Homo sapiens; D) in norma lateralis. Note the similarities and differences in the profiles of the facial projection and their
implications for the thicknesses of the muscles that act on the masticatory system between these hominid species. Scale bar = 10 cm.
https://doi.org/10.1371/journal.pone.0245760.g006
PLOS ONE | https://doi.org/10.1371/journal.pone.0245760 June 4, 2021 17 / 25PLOS ONE Towards the restoration of ancient hominid craniofacial anatomy
skull to Pan, any estimation errors in soft tissue thickness for Sts 5 are likely to be similar to or
only slightly larger than those of S9655. Second, under the assumption that sexual dimorphism
of soft tissue thicknesses in A. africanus did not differ significantly from chimpanzees and
modern humans, it is clear that the lack of consensus surrounding the sex of Sts 5 did not affect
the precision of the regression models’ predictions. Although we agree with Montagu [54] that
the true soft tissue thicknesses for extinct hominids are largely unknowable, we argue that this
fact does not diminish the utility of chimpanzee-derived regression models in formulating an
informed hypothesis about the facial appearance of Sts 5 and other hominids with similar
craniometrics.
To the best of the authors’ knowledge, regression models have not been used in the facial
approximations of Plio-Pleistocene hominids prior to the present study. Earlier reconstruc-
tions have relied heavily on species specific means and/or comparative anatomy of primate
muscle morphology [1]. Here we will focus only on the latter as the limitations of means were
discussed previously. The location and shape of muscle attachment areas on great ape skulls
has been described in detail for bonobos [24], chimpanzees [26], orangutans [55], and gorillas
[56], as well as in comparative anatomy textbooks [57]. In any hominid facial approximation,
there is an obvious importance in knowing the origin and insertion of the various muscles of
the face and head between great apes and humans. However, knowledge of correct anatomical
positions of individual muscles is not a substitute for specific estimates for the volumes of the
muscles themselves and their coverings, namely the thicknesses of subcutaneous adipose tis-
sues and epithelial linings. Gurche [1] reports being able to systematically determine the size,
location, and shape of muscles based on macroscopic surface markings on fossil bones. We
will not be surprised if some readers support Gurche’s method as found throughout the facial
approximation literature is the view that that the face can be reliably approximated from the
construction of the facial musculature alone [14, 15, 31]. However, as Ullrich and Stephan [58]
have shown, this is a gross misinterpretation of the facial approximation method. In actual
fact, facial approximation has always relied heavily on empirical data on soft tissue thicknesses
[12, 13, 59]. Gerasimov, for example, implemented soft tissue thickness measurements, only
ever placed four muscles onto the skull (the masseter and temporalis muscles), and considered
adding any further muscles, such as those of facial expression, to be pointless since their
attachments to the skull are not visible. Furthermore, research attempting to recover the size
and location of 92 muscles in human material reported that only 23 could be reliably recon-
structed from bone alone [60]. Gurche’s reconstructions are not necessarily illogical by any
means but his approximations are not produced from direct observations of bone as com-
monly believed [8]. While a practitioner’s sculptural skills and anatomical expertise is an obvi-
ous benefit in any facial approximation, in isolation the intuited use of this knowledge alone is
highly vulnerable to subjective interpretation. For example, soft tissue may be added or sub-
tracted based on personal preference. In contrast, the regression models of the present study
provide direct evidence for the approximation of hominid soft tissues. We would like to clarify
here that the models do not allow for an entirely speculation-free reconstruction because sub-
jective input is still required to interpolate the surface between landmarks. However, the
regression models certainly help to inform any interpolation that is needed. The models may
also be useful for studies reconstructing the physiology of extinct hominids. The masticatory
system of Australopithecus, for example, may be analyzed in more detail by assigning empiri-
cal values to individual muscles of the head. Regression models for mid-ramus, temporal fossa,
and euryon reflect the volume of the masseter and temporalis muscles, which may be used to
further analyze the biting performance of these hominid species. Regression models may also
be extended in future studies to include the postcranial skeleton and improve upon current
body mass estimates for extinct hominids [61].
PLOS ONE | https://doi.org/10.1371/journal.pone.0245760 June 4, 2021 18 / 25PLOS ONE Towards the restoration of ancient hominid craniofacial anatomy
The strong correlations observed in this study certainly raise questions about the claim that
soft tissue thicknesses do not covary sufficiently enough with craniometric dimensions to
improve soft tissue estimates in craniofacial identification [22]. Given that correlation coeffi-
cients generated from regression analysis are sensitive to measurement error and that these
errors can only detract from the strengths of association, it is possible that measurement error
accounts for some, if not all, of the differences between the correlation coefficients of the pres-
ent study and those reported in previous studies. The mean intra-observer r-TEMs for soft tis-
sue measurements collected in the present study are lower than the mean intra-observer r-
TEM of 8% recorded by Stephan and Sievwright [22], which involved measurements of living
human subjects by B-mode ultrasound. The small mean intra-observer r-TEM for the cranio-
metrics in the current study also stands in contrast to the mean intra-observer r-TEM of 2%
recorded by Stephan and Sievwright [22]. These results follow the usual trend whereby soft tis-
sue measurements pose a greater challenge to measurement accuracy than the craniometrics.
However, they also show that measurements taken from CT scans in OsiriX in the present
study are more accurate than measurements taken in previous studies via ultrasound [22]. As
stated previously, measurements taken by ultrasound are known to compress the soft tissues
in comparison to CT based measurements [32]. It is a basic fact of statistics that random errors
reduce covariations and thus produce poorer results of correlations and regressions [62].
Thus, correlations generated from CT based measurements can be expected to be stronger
than those obtained from ultrasound measurements. With that said, in the specific case of
facial soft tissue thicknesses, it is difficult to evaluate conclusively until further analyses of
covariation are made using human material and more reliable CT based measurements.
It is important for us to be transparent about the limitation of the regression models. The
aim of any facial approximation is to provide an accurate model of a complete subject. Disap-
pointingly, our regression models offer very little information about the facial features of hom-
inids as they only provide a 3D silhouette upon which facial features can be built. In our
approximation of subjects PRI-Cleo and S9655, the facial features can be extrapolated from
photographic evidence of great apes as shown in the completed approximations in Fig 7A and
7B respectively. However, for Sts 5 the challenge is further complicated by the fact that practi-
tioners of facial approximation have no direct information to extrapolate the facial features
from. Numerous facial approximation studies have developed methods for approximating the
facial features in modern humans, although the validity of these methods applied to other
hominids has never been tested. Published methods include the approximation of eyeball
diameter and anatomical placement in the orbits [63]; eyebrow size, position and shape [64–
67]; nasal profile [13, 31, 68–72]; mouth width and shape [12, 14, 31, 58, 73–75]; and size and
shape of the external ear [11–13, 67, 76, 77]. Given that facial features are needed to complete
any facial approximation, the interspecies compatibility of these methods is worthy of detailed
examination in the near future to allow for complete approximations of Plio-Pleistocene homi-
nids to be produced. Until then, the facial features presented in any facial approximation of Sts
5 must obviously remain tentative. For this reason, we chose to present our final reconstruc-
tion of Sts 5, shown in Fig 7C, without facial features. While we could have followed in the
footsteps of previous practitioners and used our intuition to estimate the facial features, we feel
this would only dilute the significance of our results. Mixing up what we know with that which
is unknown would only induce confusion. Thus, incomplete as it may be, in Fig 7C we present
only what the results of the present study can accomplish. The undefined mass of tissue pro-
duced, as a result of the regression models predictions, highlights just how much work there is
yet to be done in this domain.
Second, craniofacial morphology among Plio-Pleistocene hominid taxa is highly variable
and as such not all fossil craniometrics may fall inside or close to the range modelled in the
PLOS ONE | https://doi.org/10.1371/journal.pone.0245760 June 4, 2021 19 / 25You can also read


