Aerosol radiative impact during the summer 2019 heatwave produced partly by an inter-continental Saharan dust outbreak - Part 1: Short-wave dust ...
←
→
Page content transcription
If your browser does not render page correctly, please read the page content below
Atmos. Chem. Phys., 21, 6455–6479, 2021
https://doi.org/10.5194/acp-21-6455-2021
© Author(s) 2021. This work is distributed under
the Creative Commons Attribution 4.0 License.

Aerosol radiative impact during the summer 2019 heatwave
produced partly by an inter-continental Saharan dust outbreak –
Part 1: Short-wave dust direct radiative effect
Carmen Córdoba-Jabonero1 , Michaël Sicard2,3 , María-Ángeles López-Cayuela1 , Albert Ansmann4 ,
Adolfo Comerón2 , María-Paz Zorzano5,6 , Alejandro Rodríguez-Gómez2 , and Constantino Muñoz-Porcar2
1 InstitutoNacional de Técnica Aeroespacial (INTA), Atmospheric Research and Instrumentation Branch,
Torrejón de Ardoz, 28850 Madrid, Spain
2 CommSensLab, Signal Theory and Communications Department, Universitat Politècnica de Catalunya (UPC),

08034 Barcelona, Spain
3 Ciències i Tecnologies de l’Espai-Centre de Recerca de l’Aeronàutica i de l’Espai, Institut d’Estudis Espacials

de Catalunya (CTE-CRAE/IEEC), Universitat Politècnica de Catalunya (UPC), 08034 Barcelona, Spain
4 Remote Sensing of Atmospheric Processes Department, Leibniz Institute for Tropospheric Research (TROPOS),

04318 Leipzig, Germany
5 Centro de Astrobiología (CSIC-INTA), Ctra. Ajalvir, km. 4, Torrejón de Ardoz, 28850 Madrid, Spain
6 School of Geosciences, University of Aberdeen, Aberdeen, AB24 3FX, UK

Correspondence: Carmen Córdoba-Jabonero (cordobajc@inta.es) and Michaël Sicard (msicard@tsc.upc.edu)

Received: 29 September 2020 – Discussion started: 24 November 2020
Revised: 2 March 2021 – Accepted: 10 March 2021 – Published: 30 April 2021

Abstract. The short-wave (SW) direct radiative effect (DRE)         DRE of −9.1 and −2.5 W m−2 , respectively, in Barcelona
during the summer 2019 heatwave produced partly by a mod-           and Leipzig, but the Df/DD DRE ratio is larger for Leipzig
erate, long-lasting Saharan dust outbreak over Europe is anal-      (52 %) than for Barcelona (37 %). Cooling is also observed at
ysed in this study. Two European sites (periods) are consid-        the top of the atmosphere (TOA), although less intense than
ered: Barcelona, Spain (23–30 June), and Leipzig, Germany           on the surface. However, the Df/DD DRE ratio at the TOA is
(29 and 30 June), 1350 km apart from each other. Major data         even higher (45 % and 60 %, respectively, in Barcelona and
are obtained from AERONET and polarised Micro-Pulse Li-             Leipzig) than on the surface. Despite the predominance of
dar (P-MPL) observations. Modelling is used to describe the         Dc particles under dusty conditions, the SW radiative im-
different dust pathways, as observed at both sites. The coarse      pact of Df particles can be comparable to, even higher than,
dust (Dc) and fine dust (Df) components (with total dust,           that induced by the Dc ones. In particular, the Df/DD DRE
DD = Dc + Df) are identified in the profiles of the total par-      ratio in Barcelona increases by +2.4 % d−1 (surface) and
ticle backscatter coefficient using the POLIPHON (POlarisa-         +2.9 % d−1 (TOA) during the dusty period. This study is
tion LIdar PHOtometer Networking) method in synergy with            completed by a second paper about the long-wave and net
P-MPL measurements. This information is used to calculate           radiative effects. These results are especially relevant for the
the relative mass loading and the centre-of-mass height, as         next ESA EarthCARE mission (planned in 2022) as it is de-
well as the contribution of each dust mode to the total dust        voted to aerosol–cloud–radiation interaction research.
DRE. Several aspects of the ageing of dust are put forward.
The mean dust optical depth and its Df/DD ratios are, re-
spectively, 0.153 and 24 % in Barcelona and 0.039 and 38 %
in Leipzig; this Df increase in Leipzig is attributed to a longer
dust transport path in comparison to Barcelona. The dust
produced a cooling effect on the surface with a mean daily

Published by Copernicus Publications on behalf of the European Geosciences Union.
6456                            C. Córdoba-Jabonero et al.: Dust SW radiative impact during the summer 2019 heatwave

1   Introduction                                                    pogenic sources (Ginoux et al., 2012). In addition, Saharan
                                                                    dust is frequently transported far from its sources to Europe
Climate change is an important issue nowadays (IPCC,                and the American continent, being able to reach rather high
2013), extreme events (as heatwaves, droughts, intense              altitudes (up to 8 km height). Hence, changes in the dust
aerosol outbreaks, etc.) being linked to high perturbations         properties are expected, influencing their vertical radiative
in the radiative balance of the atmosphere. In particular,          field. Indeed, there is special interest in characterising the
the knowledge of the aerosol-induced climatological impli-          impact of the dust intrusions on the climate of Europe. The
cations is still preliminary, and the uncertainties associated      arrival of Saharan dust intrusions over Europe is frequently
with the determination of the aerosol direct and indirect ra-       observed in springtime and summertime, mostly in southern
diative effects are difficult to be unambiguously estimated.        Europe; only in very few cases are those intrusions able to
This is mainly due to the change in the aerosol properties dur-     reach central and northern Europe (Ansmann et al., 2003;
ing their transport, the incomplete characterisation of aerosol     Osborne et al., 2019; Akritidis et al., 2020). Several studies
complex mixtures, and the lack of information on aerosol–           have focused on the dust vertical distribution using ground-
cloud interaction mechanisms (e.g. Haywood and Boucher,             based lidar systems (e.g. Ansmann et al., 2003; Papayan-
2000).                                                              nis et al., 2005, 2008; Mona et al., 2006; Córdoba-Jabonero
   Dust particles play an important role in the frame of cli-       et al., 2011) belonging to different aerosol lidar networks
mate forcing due to their direct effect on scattering and ab-       (EARLINET, MPLNET). Recent studies have demonstrated
sorption of solar radiation, as well as their indirect effect       that there is an increasing frequency of Saharan outbreaks,
by acting as both cloud condensation nuclei (CCN) and ice           in particular, over the Iberian Peninsula (IP) when compared
nucleating particles (INPs) (DeMott et al., 2003). Radiative        with long-term records (Sousa et al., 2019), with a signifi-
forcing (RF) is a proxy for climate research and policy, which      cant effect on the production of extreme heatwaves over the
is also linked to the change in global mean surface tempera-        IP. For instance, the heatwave that occurred in June 2019 over
ture as derived from climate models at continental, regional,       Europe, as described by Sousa et al. (2019), was partly pro-
or local scales. In particular, significant uncertainties in the    duced by an inter-continental Saharan dust intrusion reaching
estimation of the dust-induced direct radiative effects are still   the IP and central Europe. This dust event is examined in this
present, hence the necessity to study the radiative properties      work.
of dust particles and to adequately quantify their direct ef-          The aim of this work is threefold: (1) to assess the con-
fect on the earth–atmosphere radiative budget (IPCC, 2013).         tinuous evolution of the SW direct radiative effect (DRE)
The direct radiative effect of the total dust has been widely       of both coarse dust (Dc) and fine dust (Df) particles dur-
investigated at both short-wave (SW) and long-wave (LW)             ing the summer 2019 heatwave over Europe, examining a
spectral ranges (Sokolik and Toon, 1996; Pérez et al., 2006;        case study associated with the dust intrusion reaching two
Balkanski et al., 2007); however, despite dust intrusions be-       European stations in June 2019 by tracking the pathways of
ing usually dominated by large particles, the fine-mode dust        the different air masses; (2) to evaluate the impact of the Df
cannot be disregarded and hence its relative contribution to        particles on the total (Dc + Df) SW DRE; and (3) to show
the total radiative effect. Therefore, the individual radiative     the improved use of polarised Micro-Pulse Lidar (P-MPL)
estimate for both coarse- and fine-mode dust must be sepa-          systems, belonging to NASA’s MPLNET (Micro-Pulse Li-
rately evaluated, and only a few works have addressed this          dar NETwork), for the continuous monitoring of the change
issue. For instance, Sicard et al. (2014b) reported that coarse     in dust properties during transportation and hence the DRE
dust particles seem mainly to affect the LW radiation, their        evolution. The dust plume was first observed in Barcelona
fine mode being mostly responsible of the SW radiative mod-         (BCN, Spain; 41.4◦ N, 2.1◦ E; 125 m a.s.l.) on 23 June and
ulation.                                                            arrived later at Leipzig (LPZ, Germany; 51.4◦ N, 12.4◦ E;
   Mineral dust is the most abundant aerosol in the atmo-           125 m a.s.l.) on 29 June. Measurements with P-MPL systems
sphere; however, dust emissions are very difficult to predict.      were performed at both stations.
Despite emissions of 1000–3000 Tg yr−1 being estimated by              The paper is structured as follows. Section 2 describes
global models (i.e. Zender et al., 2004), a later study car-        the instrumentation and methods used: (Sect. 2.1) the two
ried out by means of a global dust model intercomparison            P-MPL systems as deployed at each of those two urban sta-
(Huneeus et al., 2011) suggested that the emissions may             tions for continuous vertical aerosol observations; (Sect. 2.2)
range from 500 to 4000 Tg yr−1 . Globally the natural dust          the retrieval methods to derive the dust properties for both the
sources account for 75 %, with the remaining 25 % coming            coarse and fine modes and their vertical mass concentration;
from anthropogenic (mainly from agricultural activities) ori-       (Sect. 2.3) the radiative transfer (RT) model for DRE calcu-
gins (Ginoux et al., 2012). In particular, Saharan dust could       lations; and (Sect. 2.4) both trajectory and forecast models
represent half of the airborne abundance (Prospero et al.,          to simulate the origin and pathways of the dusty air masses.
2002). According to Huneeus et al. (2011), North African            Section 3 describes the results, as obtained for (Sect. 3.1) the
deserts could emit between 400 to 2200 Tg yr−1 of dust par-         dust plume origin and transport, (Sect. 3.2) the separation
ticles; hence, 8 % of that amount can be attributed to anthro-      of coarse- and fine-mode dust properties, and (Sect. 3.3) the

Atmos. Chem. Phys., 21, 6455–6479, 2021                                               https://doi.org/10.5194/acp-21-6455-2021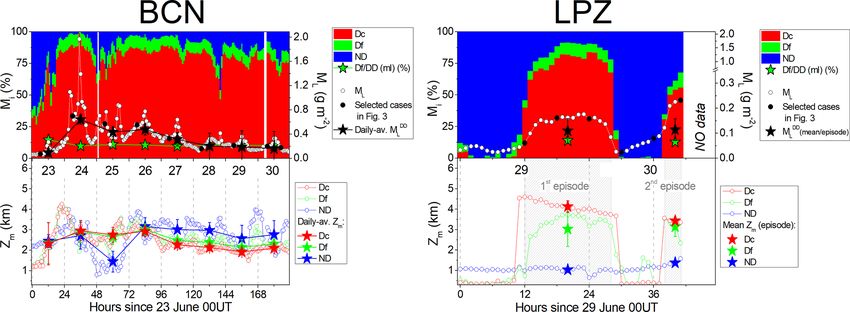
C. Córdoba-Jabonero et al.: Dust SW radiative impact during the summer 2019 heatwave                                           6457

dust direct radiative effect. Sections 4 and 5 present, respec-     respectively, βDf and βND . The ND component is assumed to
tively, the discussion of those results and the main conclu-        belong to the fine mode, associated with background (conti-
sions. In a second work (Sicard et al., 2021) the dust long-        nental, pollution) aerosols in both the urban stations, BCN
wave and net DRE of the same event are analysed.                    and LPZ, studied in this work. In summary, the height-
                                                                    resolved total PBC is βp (z) = βDc (z)+βDf (z)+βND (z), with
                                                                    z denoting the dependence on height. Particle extinction co-
2     Materials and methods                                         efficient (PEC) profiles for each component are obtained
                                                                    from the corresponding PBC and the particular lidar ratio
2.1    P-MPL systems
                                                                    (LR, extinction-to-backscatter coefficient ratio) values, Sa , as
Two polarised micro-pulse lidar (P-MPL) systems, belong-            assumed to be specific for those Dc, Df, and ND components;
ing to NASA’s MPLNET (Micro Pulse Lidar NETwork)                    that is,
and deployed at two European urban stations, namely                 σi (z) = Sai βi (z),                                         (1)
Barcelona (BCN, Spain; 41.4◦ N, 2.1◦ E; 125 m a.s.l.; perma-
                                                                    where σi (z), βi (z), and  Saiare, respectively, the extinction
nent location) and Leipzig (LPZ, Germany; 51.4◦ N, 12.4◦ E;
                                                                    coefficient and the backscatter coefficient as a function of
125 m a.s.l.; planned campaign), were used for vertical dust
                                                                    height, and the particular LR for each i component (i.e.
observations during the dust event examined in this study.
                                                                    i = Dc, Df, and ND). In this procedure, specific δp and Sa
BCN and LPZ are located at around 1500 and 2800 km,
                                                                    values for each pure Dc, Df, and ND component are input
respectively, from the Saharan dust sources, and they are
                                                                    parameters. Table 1 shows the assumed values (correspond-
1350 km apart from each other. Aerosol and cloud profiles
                                                                    ing references are also cited).
are usually recorded in an automatic and continuous (24/7)
                                                                       Total PBC profiles are derived by using the Klett–Fernald
mode. The P-MPL system is an elastic lidar with a rela-
                                                                    (KF) retrieval (Fernald, 1984; Klett, 1985) on the P-MPL
tively high pulse repetition frequency (2500 Hz) using a low-
                                                                    RCS measurements and constrained with the aerosol opti-
energy (∼ 7 µJ pulse−1 ) Nd:YVO4 laser at 532 nm, including
                                                                    cal depth (AOD) values available from NASA’s AERONET
polarisation capabilities. The lidar backscatter signal is reg-
                                                                    (AErosol RObotic NETwork; http://aeronet.gsfc.nasa.gov;
istered in the polarised detection co-channel (Pco ) and cross-
                                                                    last access: 15 July 2020). Columnar AOD data are pro-
channel (Pcross ) using a unique avalanche photo-detector
                                                                    vided by the two AERONET Cimel sun photometers, co-
(APD), sampled for 75 m (BCN) and 15 m (LPZ) vertical
                                                                    located with the P-MPL systems at BCN and LPZ stations.
resolutions and recorded and integrated for 1 min periods.
                                                                    AERONET V3 L2.0 and V3 L1.5 data are available, respec-
The total range-corrected signal (RCS) P (Campbell et al.,
                                                                    tively, from BCN and LPZ sites (see Sect. 3.3.1). PLDR pro-
2002) is the sum of their parallel (Pp = Pco +Pcross ) and per-
                                                                    files are calculated from the PBC and VLDR profiles. More
pendicular (Ps = Pcross ) signal components, as adapted from
                                                                    details of the P-MPL signal processing and optical retrieval
Flynn et al. (2007), i.e. P = Pco + 2Pcross . Those RCS pro-
                                                                    are described in Córdoba-Jabonero et al. (2018). Relative un-
files are averaged for 1 h to increase the signal-to-noise ratio.
                                                                    certainty values associated with those optical properties are
The volume linear depolarisation ratio (VLDR), δ V , can be
                                                                    shown in Table 2.
also estimated from the perpendicular-to-parallel RCS ratio,
                                                                       Additionally, once σDc , σDf , and σND are determined,
i.e. δ V = PcoP+P
               cross
                        . More details of the P-MPL signal pro-
                  cross                                             the mass concentration (MC) profiles of each i component,
cessing are described in Córdoba-Jabonero et al. (2018).
                                                                    mi (z) (g m−3 ; i = Dc, Df, and ND), can be calculated (the
2.2    POLIPHON retrieval: separation of the optical and            expected values with relative uncertainties are included in
       mass features                                                Table 2) with the relation (Ansmann et al., 2017; Córdoba-
                                                                    Jabonero et al., 2016, 2019)
The POLIPHON (POlarisation LIdar PHOtometer Network-                mi (z) = fmi σi (z),                                         (2)
ing) approach (Mamouri and Ansmann, 2014, 2017) is used
in combination with the P-MPL observations (P profiles) for         where fmi (g m−2 ) are the specific AERONET-based
the separation of both fine and coarse extinction components        extinction-to-mass conversion factors (Ansmann et al., 2019)
of the desert dust (DD) particles, as described in Córdoba-         for each component (i = Dc, Df, and ND). Note that
Jabonero et al. (2018). The algorithm is based on a two-                          −1
                                                                    fm = dp cv = km  ,                                           (3)
step method for separating the three components of dusty
                                                                    where dp , cv , and km are, respectively, the particle density
mixtures. First, by using both the lidar-derived total particle
                                                                    (g cm−3 ), the volume conversion factor (10−12 Mm), and the
backscatter coefficient (PBC), βp , and the particle linear de-
                                                                    mass extinction efficiency (MEE; m2 g−1 ). The assumed val-
polarisation ratio (PLDR), δp , profiles, the coarse mode (pre-
                                                                    ues of all those parameters are shown in Table 1. The vertical
dominantly coarse dust particles, Dc), βDc , and the fine mode
                                                                    profile of the total mass concentration (MC , g m−3 ) is calcu-
of the PBC are separated. Second, the fine mode of the PBC,
                                                                    lated as the summatory of each mass component, i.e.
which is composed of the fine dust particles (Df) and non-                     X
dust aerosols (ND), is separated in two more components,            MC (z) =        m (z),
                                                                                  i i
                                                                                                                                (4)

https://doi.org/10.5194/acp-21-6455-2021                                               Atmos. Chem. Phys., 21, 6455–6479, 2021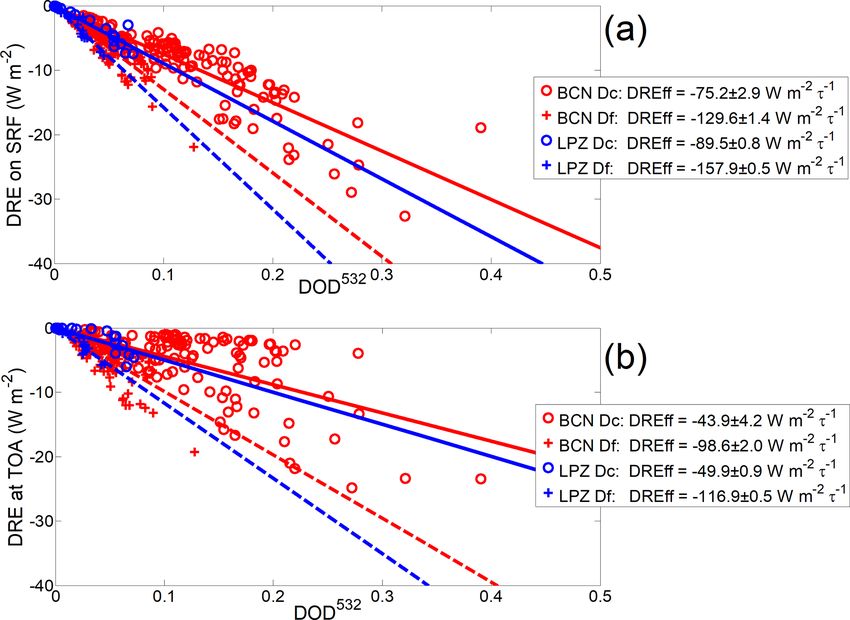
6458                               C. Córdoba-Jabonero et al.: Dust SW radiative impact during the summer 2019 heatwave

Table 1. Assumed specific values of PLDR (δp ) and LR (Sa , sr), together with the mass conversion factor (fm , g m−2 ), particle density (dp ,
g cm−3 ), volume conversion factor (cv , 10−12 Mm), and MEE (km , m2 g−1 ), for the Dc, Df, and ND components.

                      Parameter         Dc        Df       ND     References
                      δp              0.39      0.16       0.05   Mamouri and Ansmann (2017)
                      Sa                55        55         50   Ansmann et al. (2017)
                      cv             0.83 a    0.23 a    0.30 b   a Ansmann et al. (2019) for the North African region
                                                                  b Mamouri and Ansmann (2017)
                      dp               2.6        2.6     1.55    Mamouri and Ansmann (2017)
                      fm              2.16       0.60    0.465    Eq. (3) (this work)
                      km              0.46       1.67     2.15    Eq. (3) (this work)

Table 2. Relative uncertainties (%) associated with the lidar-derived      2.3   GAME radiative transfer model
particle optical properties and mass features (i is for the Dc, Df, and
ND components).                                                            Solar flux was calculated for 18 layers of the atmosphere
                                                                           distributed between the ground level and 20 km height with
         Parameter                   Dc         Df        ND               the radiative transfer (RT) model GAME (Dubuisson et al.,
         βp             10–15
                                                                           1996, 2004, 2006). The solar spectral range was set from 0.2
         δp             15–25                                              to 4.0 µm (wave number resolution of 400 cm−1 from 0.2
         σi                       25–30       40–50     25–30              to 0.7 µm and 100 cm−1 from 0.7 to 4.0 µm). GAME cal-
         mi                       25–30       40–50     35–40              culates solar flux values at the boundary of plane and ho-
                                                                           mogenous atmospheric layers by using the discrete ordinates
                                                                           method (Stamnes et al., 1988). Gas (H2 O, CO2 , O3 , N2 O,
and their vertically integrated mass values (i.e. mass load-               CO, CH4 , and N2 are considered) absorption is calculated
ings; g m−2 ), denoted as MLi and ML , are                                 from the correlated k distribution (Lacis and Oinas, 1991).
        X                                                                  More details about the computation of the gas transmission
MLi =       mi (z)1z and                                 (5)               functions can be found in Dubuisson et al. (2004) and Sicard
       Xz                                                                  et al. (2014a). The gas absorption is parameterised from pro-
ML =       M (z)1z,
          z C
                                                         (6)
                                                                           files of pressure, temperature, and relative humidity. In BCN,
where 1z is the vertical resolution of the lidar measurements              radiosoundings launched twice a day at 00:00 and 12:00 UTC
(75 and 15 m, respectively, for BCN and LPZ).                              by the University of Barcelona in collaboration with the
   The relative height-integrated mass contribution of each                Servei Meteorològic de Catalunya, the Catalonia meteoro-
component with respect to the total mass loading (Mi , %)                  logical agency, were used. No radiosoundings are available
(i = Dc, Df, and ND), which is expressed as                                in LPZ; thus, the 6 h profiles from the Global Data Assim-
                                                                           ilation System (GDAS) provided by the National Oceanic
       MLi                                                                 and Atmospheric Administration (NOAA) were used instead.
Mi =       · 100,                                                  (7)
       ML                                                                  Aerosols are fully parameterised in the GAME model by the
                                                                           user in terms of spectrally and vertically resolved aerosol op-
is also examined during the dust event as observed in BCN
                                                                           tical depth (AOD), single scattering albedo (SSA), and asym-
and LPZ.
                                                                           metry factor (asyF). The spectrally resolved surface albedo
    Regarding the vertical impact of each component, their rel-
                                                                           (SA) is another input of the model. All those latter parame-
ative contribution in terms of a mass-weighted altitude, the
                                                                           ters are described in Sect. 3.3.1.
so-called centre-of-mass (CoM) height, is calculated, and its
                                                                              GAME has been used to calculate solar flux values for
evolution is examined along each particular dust event period
                                                                           scientific purposes in several works (e.g. Roger et al., 2006;
in BCN and LPZ. The CoM height, Zm , is defined similarly
                                                                           Mallet et al., 2008; Sicard et al., 2012). It was validated by
as in Córdoba-Jabonero et al. (2019); that is,
       P                                                                   means of an intercomparison exercise of radiative transfer
           zk mi (zk )1z                                                   models (Halthore et al., 2005) which concluded that GAME
Zm = Pk
  i
                         ,                                  (8)
           k mi (zk )1z
                                                                           is accurate to a few watts (1–3) for an incoming solar flux
                                                                           of 1000 W m−2 . Since this work is focused on the dust ra-
mi (zk ) being the mass concentration profile for each i com-              diative impact, the expression of the aerosol direct radiative
ponent (see Eq. 2 with i = Dc, Df, and ND) and zk the height,              effect (ARE) is particularly defined for dust as the dust direct
where k denotes the height-step defined by the vertical res-               radiative effect (DRE) at a given height level, L; that is,
olution (1z; 75 and 15 m, respectively, for BCN and LPZ                                 h                 i h                    i
                                                                                           ↓         ↑           ↓          ↑
measurements).                                                             DRE(L) = Fd (L) − Fd (L) − F0 (L) − F0 (L) ,                 (9)

Atmos. Chem. Phys., 21, 6455–6479, 2021                                                       https://doi.org/10.5194/acp-21-6455-2021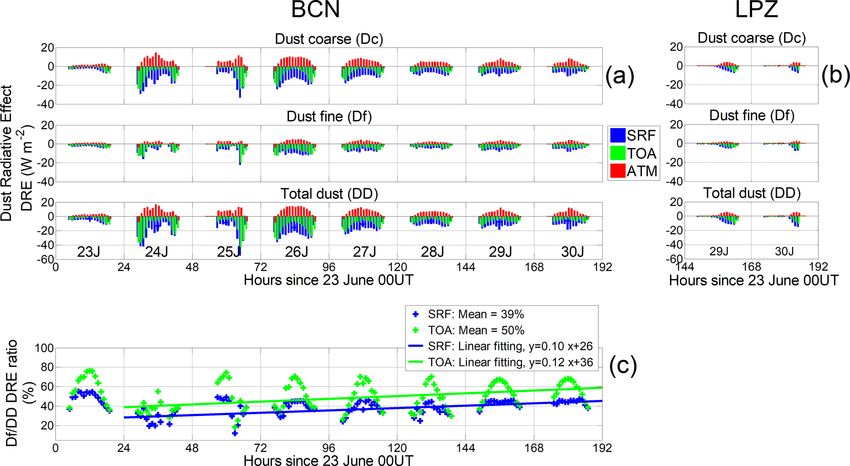
C. Córdoba-Jabonero et al.: Dust SW radiative impact during the summer 2019 heatwave                                      6459

where Fd and F0 are the radiative flux values with and with-     the NMMB/BSC-Dust forecast images. Figure 1 shows the
out dust, while the ↓ and ↑ arrows indicate whether the          dust optical depth (DOD) at 550 nm and the 700 hPa wind
fluxes are downward or upward, respectively. By that def-        field (the positions of BCN and LPZ stations are marked, re-
inition, negative (positive) DRE values represent a cooling      spectively, by a red and a blue point). On 24 June 06:00 UTC,
(warming) effect. The DRE was calculated at two climate-         DOD values greater than 0.15 were observed at BCN with
relevant altitude levels: at the top of atmosphere (TOA) and     stable dust conditions throughout the study period. The Sa-
on the surface (SRF). The dust contribution in the atmo-         haran dust outbreak moved towards northern Europe and
spheric column is quantified by the atmospheric radiative ef-    looped down on 29 June, reaching LPZ at 12:00 UTC. In
fect, DRE(ATM), which is defined as follows:                     this station, unlike in BCN, two consecutive, close in time
                                                                 dust events occurred. DOD values greater than 0.15 were
DRE(ATM) = DRE(TOA) − DRE(SRF).                          (10)    first observed until the early hours of 30 June (first dust pe-
                                                                 riod in LPZ). This was followed by non-dust conditions until
2.4    Air masses transport modelling                            14:00 UTC when dust evidence was detected again until the
                                                                 end of the day (second dust period).
In order to determine the origin and pathway of the dusty           A similar pattern is found by analysing the HYSPLIT 5 d
air masses affecting both stations involved in this study, a     height-dependent back trajectories shown in Fig. 2. Regard-
trajectory analysis using two different models is performed.     ing the particular height-dependent back trajectories over
The Hybrid Single-Particle Lagrangian Integrated Trajec-         BCN , Saharan air masses at 2500 and 4000 m coming from
tory (HYSPLIT) model version 4, developed by NOAA’s              North Africa can be observed for the whole dust event (23–
Air Resources Laboratory (ARL) (https://www.ready.noaa.          30 June) (see Fig. 2; note that dates and times are the same
gov/HYSPLIT.php; last access: 28 April 2020; Draxler and         as those shown in Fig. 1). On the other hand, those observed
Hess, 1998; Stein et al., 2015; Rolph et al., 2017) is used      at 4500 m over LPZ from 29 to 30 June mainly come from
in conjunction with the Global Data Assimilation System          the Iberian Peninsula, which was still under dust outbreak
(GDAS) meteorological files (https://www.emc.ncep.noaa.          conditions in the same period. This indicates that the dusty
gov/gmb/gdas/; last access: 28 April 2020; spatial resolu-       conditions observed at LPZ are due to dust transport from
tion of 1◦ × 1◦ every 3 h) in order to identify the source re-   the Iberian Peninsula (i.e. BCN area), observing two slightly
gions of the dust particles. HYSPLIT 5 d back trajectories       separated dust events. The first one, occurred from 29 June
of air masses arriving at each station (BCN and LPZ) are         12:00 UTC to 30 June 05:00 UTC, reached altitudes higher
obtained. The NMMB/BSC-Dust model (https://ess.bsc.es/           than 3000 m height, while the second one (from 30 June
bsc-dust-daily-forecast; last access: 30 January 2020; Pérez     15:00 UTC to the end of the day) was detected at lower
et al., 2011) is an online multi-scale atmospheric dust model    heights (see Fig. 2).
providing short- to medium-range dust forecasts for both re-
gional and global domains. It has been designed and devel-       3.2     Coarse- and fine-mode dust separation
oped by the Barcelona Supercomputing Center (BSC) and
is fully embedded in the Non-hydrostatic Multi-scale Model       3.2.1    Optical properties: backscatter coefficient and
(NMMB) developed at NOAA’s National Centers for Envi-                     depolarisation ratios
ronmental Prediction (NCEP) (Janjic et al., 2011). This toll
has been used to obtain dust forecasts over both BCN and         The evolution of the aerosol optical properties during the
LPZ stations during the period from 23 to 30 June 2019.          dusty events as observed at BCN (23–30 June) and LPZ
                                                                 (29 and 30 June) is analysed regarding their vertical struc-
                                                                 ture. Figure 3 shows the total PBC, βp , and those separated
3     Results
                                                                 into dusty, βDc and βDf , and non-dusty, βND , components,
This section is divided in three subsections on the dust plume   together with the PLDR, δp , and VLDR, δ V , for represen-
origin and transport, the application of the POLIPHON al-        tative cases of that evolution (date and times are shown in
gorithm to the P-MPL observations in terms of coarse- and        each panel, corresponding to the HYSPLIT images shown in
fine-mode dust contributions to the optical and mass prod-       Fig. 2).
ucts, and the estimation of the dust direct radiative forcing.      In general, by looking at the successive selected panels
                                                                 in Fig. 3a, a gradual dust occurrence can be observed at
3.1    Dust plume origin and transport                           BCN during the whole dusty event. The greatest incidence
                                                                 of dust intrusion is observed on 24 June, showing a pro-
The summer 2019 heatwave as observed across Europe               nounced dust (DD = Dc + Df with Dc predominance) layer
(Sousa et al., 2019) was produced partly by an inter-            extending from 1.5 to 5.5 km height and with a total PBC
continental Saharan dust outbreak. An overview of this dust      peak of 5.6 ± 0.4 Mm−1 sr−1 at around 3 km height. In this
intrusion coming from the African continent to Europe,           dust layer, the mean δp is 0.31 ± 0.02 from 1.5 to 3.5 km,
mostly observed from 23 to 30 June 2019, is illustrated with     decreasing to 0.23 ± 0.01 at higher altitudes up to 5.5 km.

https://doi.org/10.5194/acp-21-6455-2021                                          Atmos. Chem. Phys., 21, 6455–6479, 2021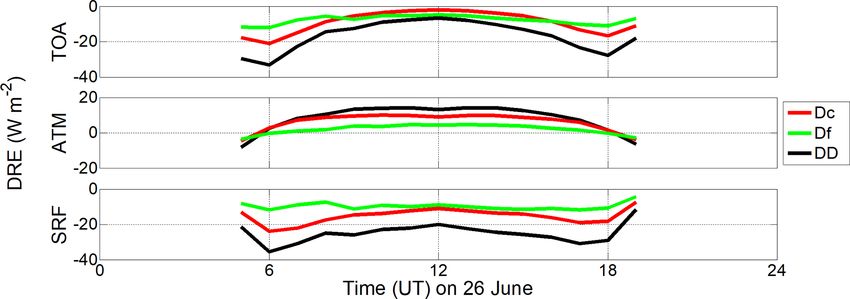
6460                            C. Córdoba-Jabonero et al.: Dust SW radiative impact during the summer 2019 heatwave

Figure 1. NMMB/BSC-Dust forecast images showing both the dust optical depth at 550 nm and 700 hPa wind field, illustrating the inter-
continental Saharan dust outbreak observed from 23 to 30 June 2019. Both stations, BCN (41.4◦ N, 2.1◦ E) and LPZ (51.4◦ N, 12.4◦ E), are
marked, respectively, by a red and a blue point. Dates and times (UT stands for UTC) are indicated in each image.

Also, a narrow dust layer with a mean δp of 0.28 ± 0.06               ues found on 28 and 29 June, they are smaller than 0.20
is found above at around 6.2 km height. During the fol-               (with mean values of 0.15 ± 0.05 and 0.14 ± 0.06, respec-
lowing days, a DD layer with a small ND contribution,                 tively) above 2 km and 0.28 ± 0.04 and 0.25 ± 0.04, on av-
also extensively ranging from 1 km to, respectively, 5 km             erage, below 2 km. As stated before, this points out that the
(25 June) and 6 km (26 June) height, can be observed. In              DD signature is more intense at heights lower than around
this case, the dust incidence is smaller: βp peak values              2 km. Similarly, the DD incidence still decreases on 30 June,
of 2.2 ± 0.2 and 1.8 ± 0.1 Mm−1 sr−1 are found on 25 and              being rather low in the afternoon with δp values smaller than
26 June (approx. 30 %–40 % of that on 24 June), respec-               0.2 (0.12 ± 0.04, on average), indicating the final stage of the
tively, with mean δp values of 0.25 ± 0.04 and 0.27 ± 0.03.           dust event over BCN.
On 27 June, the DD layer descends down (0–4 km) with βp                  In the case of the dust intrusion at LPZ, the dust pat-
of 1.5 ± 0.1 Mm−1 sr−1 and similar δp values (0.26 ± 0.05,            tern is different from that observed at the BCN site, as also
on average). On 28 and 29 June, the DD signature is also              confirmed by BSC/NMMB-Dust and HYSPLIT modelling
observed from around 4 km down to the surface; however,               (see Figs. 1 and 2). During the 29 and 30 June dust event,
the main DD occurrence is found from 2.0–2.5 km with a                two dusty periods can be differentiated. The first one starts
weaker dust incidence: the βp peak is less than 1 and around          on 29 June at 12:00 UTC when a two-peak emerging dust
1.4 Mm−1 sr−1 on 28 and 29 June, respectively (i.e. around            layer (4.5 and 5.3 km) with δp values close to 0.4, indicating
17 % and 25 % of that found on 24 June). Regarding δp val-            a major presence of Dc particles (Mamouri and Ansmann,

Atmos. Chem. Phys., 21, 6455–6479, 2021                                                  https://doi.org/10.5194/acp-21-6455-2021
C. Córdoba-Jabonero et al.: Dust SW radiative impact during the summer 2019 heatwave                                                  6461

Figure 2. HYSPLIT 5 d back trajectories arriving at altitudes of 1000 (red), 2500 (blue), and 4500 m a.g.l. (green) over BCN (Spain, 41.4◦ N
2.1◦ E) and LPZ (Germany, 51.4◦ N 12.4◦ E) (marked by black stars), illustrating the inter-continental Saharan dust outbreak observed from
23 to 30 June 2019. Note that dates and times (UT stands for UTC) are the same as those shown in Fig. 1 (also indicated in each plot).

2017) (see Fig. 3b, 29 June 12:00 UTC), is observed and                 dust incidence (16 %–21 %) with respect to BCN and being
finishes on 30 June at 05:00 UTC. The second one extends                only comparable with that present during the last days. How-
from 30 June at 13:00 UTC to the end of that day (unfortu-              ever, δp values are higher, ranging between 0.39 ± 0.07 at
nately, no P-MPL data were available after 18:00 UTC). Fig-             the beginning of the episode and 0.31–0.34 (± 0.02) later on,
ure 3b illustrates the evolution of the dust intrusion once it          indicating a high predominance of Dc particles (Mamouri
arrived at LPZ on 29 June at 12:00 UTC. For the first dusty             and Ansmann, 2017). On the second dust period, a mix-
period, from 18:00 UTC on, a well-developed two-layered                 ing of Dc, Df, and ND particles is observed (see Fig. 3b,
structure is observed: an evident DD layer with a high pre-             30 June 17:00 UTC): the DD layer is extended from the
dominance of Dc particles is clearly confined from 3.5 to               ground to 5 km height, approximately, but with a weak in-
5.5 km height, and no DD signature at lower altitudes can be            cidence (βp = 0.3–0.8 Mm−1 sr−1 ). The DD signature below
detected. In this dust layer, βp peak values are between 0.9            2 km only corresponds to Df particles, scarcely present in this
and 1.2 Mm−1 sr−1 (± 0.03, on average), showing a lower                 layer where the ND aerosols dominate, as indicated by the

https://doi.org/10.5194/acp-21-6455-2021                                                   Atmos. Chem. Phys., 21, 6455–6479, 2021
6462                             C. Córdoba-Jabonero et al.: Dust SW radiative impact during the summer 2019 heatwave

Figure 3. Vertical profiles of the optical properties for representative cases (date and time, UT stands for UTC, are shown in each panel)
of the dusty events as observed at (a) BCN and (b) LPZ: the total βp (black) and those separated into dusty (βDc , red, and βDf , green) and
non-dusty (βND , blue) components (left panels), together with δ V (dark blue) and δp (magenta) (right panels). These particular cases are
marked by black circles in Fig. 4. For clarity, errors (grey bars) are shown only for βp and δp (particular uncertainties are in Table 2).

Atmos. Chem. Phys., 21, 6455–6479, 2021                                                    https://doi.org/10.5194/acp-21-6455-2021
C. Córdoba-Jabonero et al.: Dust SW radiative impact during the summer 2019 heatwave                                                      6463

Figure 4. Evolution of the dusty events occurring at (left) BCN and (right) LPZ stations in June 2019 in terms of (top) the relative mass
loading ratio (Mi , in %) for each component i: Dc (red), Df (green), and ND (blue), together with the total mass loading (ML , g m−2 ; white
circles) and the daily averaged and mean M L values for the total dust (MLDD ; black stars); and (bottom) the centre-of-mass (CoM) height
(Zm , km) for each component: Dc (red), Df (green), and ND (blue), together with their daily averaged and mean values (full coloured stars;
see legend). Black circles in the top panels indicate the representative profiles as shown in Fig. 3. White blanks represent either no retrieval
achieved or no data available.

Table 3. AERONET values at 440 nm of SSA, asyF, and SA for BCN on 25 June afternoon (25J-pm) and for LPZ on 29 and 30 June
afternoon (29J-pm and 30J-pm, respectively). The mean DOD at 440 nm (DOD440 ) in the same time interval is also included. Dc, Df, and
DD (Dc + Df) denote coarse dust, fine dust, and total dust aerosols, respectively.

                                                         BCN, 25J-pm       LPZ, 29J-pm      LPZ, 30J-pm
                                      DOD440      Dc              0.212            0.056            0.041
                                                  Df              0.052            0.027            0.026
                                                  DD              0.264            0.083            0.067
                                      SSA440      DD              0.940            0.939            0.946
                                      asyF440     Dc              0.865            0.857            0.864
                                                  Df              0.629            0.610            0.612
                                      SA440       DD              0.062            0.052            0.052

meanδp = 0.063 ± 0.003 in this layer. The Dc and Df compo-                Eq. 7), together with the total mass loading (ML , g m−2 ; top
nents are mainly present in layers at higher altitudes, as also           panels) and the CoM height (Zm , km; bottom panels), for
indicated by the PLDR: mean δp values of 0.25 ± 0.03 and                  each component along the particular dust event. Daily aver-
0.16 ± 0.03 are found, respectively, in layers ranging from               aged (BCN) and episode-averaged (LPZ) ML and Zm values
around 4 to 5 km and from 2 to 4 km height, representing a                are denoted using a bar over the variable, i.e. ML and Zm .
dominant presence of Dc particles in the first of those layers.           A maximal ML of 0.66 ± 0.42 g m−2 is found on 24 June at
                                                                          BCN, representing maxima 3–5 times higher than those ob-
3.2.2   Mass features: relative mass loadings and                         served in LPZ (0.14 ± 0.03 and 0.20 ± 0.04 g m−2 , respec-
        centre-of-mass height                                             tively, for the first and second episodes). That high dispersion
                                                                          found for ML (∼ 64 %) is due to the high variability in the
The aerosol mass features during the dusty events as ob-                  dust mass loading during this day, showing a pronounced ML
served at BCN (23–30 June; continuous dust incidence) and                 peak of 1.97 ± 0.6 g m−2 at 11:00 UTC (88 % and 9 % of that
LPZ (29 and 30 June; two separated dust episodes) are anal-               corresponding to the contribution of the Dc and Df particles,
ysed in terms of the relative mass contribution of the Dc, Df,            respectively).
and ND components and their centre-of-mass (CoM) height                      In general, as shown in Fig. 4 (top panels), Dc particles
as a measure of the vertical mass impact of each component.               mostly dominate over BCN (MDc > 80 %) during 59 % of
Figure 4 shows the time evolution of the relative mass load-              the overall dust period (23–30 June), although prevailing for
ing for each component (Mi , %) (i: Dc, Df, and ND; see                   90 % of that time in a rather high percentage (MDc around

https://doi.org/10.5194/acp-21-6455-2021                                                     Atmos. Chem. Phys., 21, 6455–6479, 2021
6464 C. Córdoba-Jabonero et al.: Dust SW radiative impact during the summer 2019 heatwave
Table 4. DRE (W m−2 ) and DREff (W m−2 τ −1 ) on the surface (SRF) as induced by Dc, Df, and DD particles along the particular dust
periods in BCN and LPZ. X and X(max) indicate daily averaged and maximal instantaneous values, respectively. The daily DOD at 532 nm
(DOD532 ) and the mass loading (ML , in g m−2 ) are also included. Df/DD denotes the Df-to-total dust ratio.
BCN LPZ*
June 2019 23 24 25 26 27 28 29 30 23–30 29 30 29–30
DOD532 Dc 0.055 0.189 0.098 0.193 0.140 0.090 0.092 0.071 0.116 0.028 0.020 0.024
Df 0.019 0.041 0.031 0.062 0.045 0.029 0.039 0.031 0.037 0.016 0.013 0.015
DD 0.074 0.230 0.129 0.255 0.185 0.119 0.131 0.102 0.153 0.044 0.033 0.039
Df/DD (%) 26 18 24 24 24 22 30 30 24 36 39 38
ML Dc 0.083 0.585 0.386 0.425 0.284 0.181 0.169 0.145 0.282 0.098 0.099 0.098
Df 0.012 0.055 0.047 0.050 0.030 0.021 0.020 0.017 0.032 0.012 0.015 0.014
DD 0.095 0.640 0.434 0.476 0.314 0.202 0.188 0.162 0.314 0.110 0.114 0.112
Df/DD (%) 14.5 10 11 10.5 9.5 10 10 10 11 14 13 13.5
DRE Dc −2.0 −9.6 −5.7 −9.5 −6.8 −4.4 −4.4 −3.4 −5.7 −1.4 −0.9 −1.2
Dc(max) −7.0 −29.0 −32.6 −23.9 −17.6 −9.6 −9.7 −10 −32.6 −7.4 −7.4 −7.4
Df −1.7 −3.7 −3.2 −6.1 −4.1 −2.4 −3.3 −2.7 −3.4 −1.4 −1.1 −1.3
Df(max) −4.5 −15.6 −21.9 −11.7 −8.6 −5.3 −6.6 −8.0 −21.9 −5.0 −7.8 −7.8
DD −3.7 −13.3 −8.9 −15.6 −10.9 −6.8 −7.7 −6.1 −9.1 −2.8 −2.0 −2.5
DD(max) −11.3 −41.8 −54.5 −35.6 −24.5 −14.5 −17.9 −18 −54.5 −11.7 −14.6 −14.6
Df/DD (%) 46 28 36 39 38 35 43 44 37 50 55 52
DREff Dc −73.4 −75.3 −85.9 −78.5 −72.5 −66.5 −66.9 −62.2 −75.2 −86.1 −95.6 −89.5
Dc(max) −116.3 −113.3 −105.4 −111.0 −116.4 −103.6 −104.2 −103 −116.4 −115.1 −107.0 −115.1
Df −123.0 −145.5 −143.9 −133.4 −124.8 −111.0 −119.1 −112.3 −129.6 −148.8 −167.6 −157.9
Df(max) −176.7 −181.0 −173.6 −181.7 −188.5 −158.2 −161.9 −157 −188.5 −188.7 −172.1 −188.7
DD −89.3 −87.9 −100.3 −93.4 −86.2 −77.5 −82.7 −77.7 −88.9 −106.6 −123.5 −113.4
DD(max) −133.7 −129.8 −121.5 −128.3 −130.3 −114.6 −121.7 −120.0 −133.7 −153.9 −147.7 −153.9
* 29 and 30 June represent the first and second DD episode, respectively, as observed in LPZ.
60 %); the Df presence is significantly lower (MDf < 10 % fore for the optical properties of dust particles (Sect. 3.2.1),
for 72 % of the dust length). Comparable results are found that dust particles (Dc and Df components) are highly mixed
in BCN under dusty conditions when similar extinction-to- with ND aerosols (Dc proportion is highly reduced) dur-
mass conversion factors are provided (Hess et al., 1998; ing the second dust episode at LPZ in comparison with the
Ansmann et al., 2019), depending only on the strength (in- first one, which presented a well-differentiated dust layer
tense and extreme) of dust intrusions (Córdoba-Jabonero between 3.5 and 5.5 km height with a predominance of Dc
et al., 2018, 2019). The relative Df mass contribution with particles (MDc of 78 %–84 % is found for the most intense
respect to the total dust mass loading is 11 %. The mean dust incidence period occurring from 29 June 18:00 UTC to
daily averaged mass loading is 0.28 ± 0.17, 0.03 ± 0.02, and 30 June 02:00 UTC). In addition, these results are in accor-
0.31 ± 0.19 g m−2 , respectively, for Dc, Df, and DD com- dance with Sect. 3.1 since the second dust event at LPZ cor-
ponents for the whole 23–30 June period (see Table 4). As responded to Saharan air masses coming directly from the
a comparison, during an extreme dust situation over BCN Iberian Peninsula when dusty conditions were still present,
(Córdoba-Jabonero et al., 2019) mass loadings reached up to crossing Europe and thus allowing for a higher dust mixing
2.8 g m−2 . than that observed in BCN. However, for the first dust event
However, the situation at LPZ is slightly different. The at LPZ (when a defined high dust layer was observed), only
relative Dc (Df) contribution during the first dust episode air masses at higher altitudes experienced a pathway slightly
is lower than (similar to) that at BCN (MDc = 68 % and crossing the Iberian Peninsula but arriving at LPZ mainly
MDf = 9 %, on average). During the second episode, despite without crossing Europe (see Fig. 2), thus avoiding a high
the mean ML being 1.50 times higher than in the first one, degree of dust mixing.
MDc and MDf decrease, on average, 48 % and 7 %, respec- As stated before, the dust intrusion arrived at BCN on
tively. The relative Df/DD mass contribution is higher than 23 June. Figure 4 (bottom panels) shows that, in the night of
that found in BCN (13.5 %) (see Table 4). The mean mass 23 to 24 June, the CoM height of the dust intrusion reaches its
loading per episode is lower in comparison, representing highest value, i.e. Zm is around 4 km. Regarding daily aver-
35 %, 44 %, and 36 %, respectively, of that found in BCN aged Zm values for Dc and Df particles, the time evolution of
for Dc, Df, and DD particles. As stated before, this is con- their CoM heights follows a similar descending pattern from
sequence of the particular transport of dust intrusions to around 3 km height on 24 June down to 2 km on 30 June.
BCN and LPZ. These results reflect the fact, as stated be- Besides, Zm for Df particles is slightly higher than that for
Atmos. Chem. Phys., 21, 6455–6479, 2021 https://doi.org/10.5194/acp-21-6455-2021C. Córdoba-Jabonero et al.: Dust SW radiative impact during the summer 2019 heatwave 6465
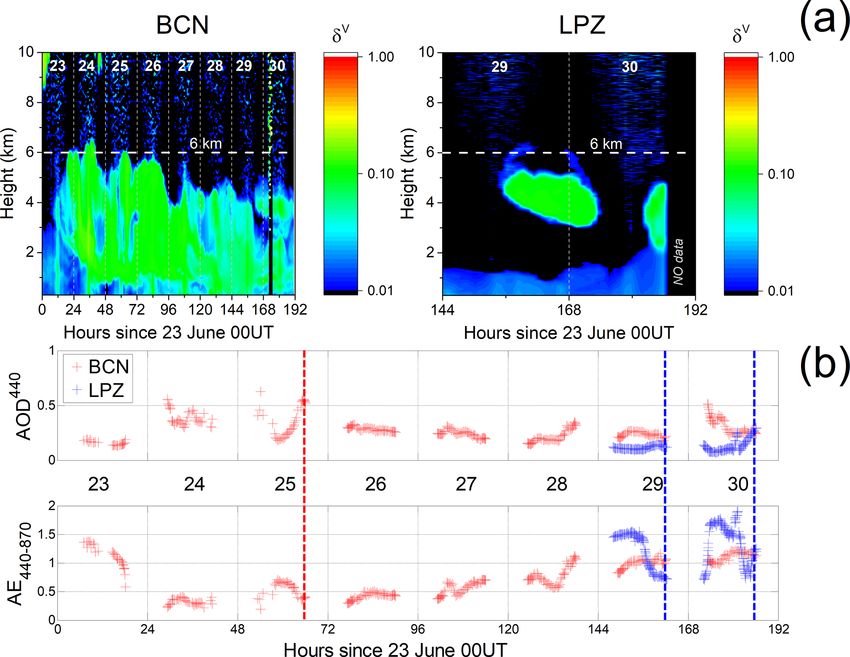
Figure 5. (a) The time-height plot (UT stands for UTC) of the P-MPL VLDR, δ V , in (left) BCN and (right) LPZ. (b) AERONET AOD440
and AE440−870 at BCN (red symbols) and LPZ (blue symbols) during the dust event period. The vertical dashed red (BCN) and blue (LPZ)
lines indicate the time corresponding to the AERONET representative values of the single scattering albedo (SSA), asymmetry factor (asyF),
and surface albedo (SA) used in the RT simulations.
the Dc component (200–250 m difference) on 27 June until Therefore, as also mentioned before, differences in the ver-
the end of the dust event. These two results can indicate the tical mass impact of the dust particles (their relative mass
removal of larger particles along with the progression of the loading and CoM height) found in both distant BCN and LPZ
dust intrusion over BCN. locations are associated with the particular pathway of trans-
In the case of LPZ, two consecutive, but different, dust ported dust particles from the Saharan sources and between
episodes are observed. The first dust episode (a high well- stations (see Sect. 3.1).
defined dust layer) arrived at LPZ on 29 June at 11:00 UTC,
mostly composed of Dc particles and with a CoM height of 3.3 Dust direct radiative effect
4.6 km (slightly higher with respect to BCN); then, it showed
a constant descending evolution down to 3.7 km on 30 June This section is divided into four parts. The dust radiative
at 05:00 UTC. Concerning the Df particles, their Zm progres- properties as input data in the radiative transfer computations
sion along this first episode is from 1.1 to 1.8 km height, are introduced in Sect. 3.3.1. The direct radiative effect and
peaking at 3.7 km on 29 June at 20:00 UTC. A mean Zm radiative efficiency of dust particles, considered separately in
value of 4.1 ± 0.3 and 3.0 ± 0.9 km is obtained, respectively, both coarse and fine modes and on the surface (SRF), at the
for the Dc and Df components during this dust episode. Af- top of the atmosphere (TOA), and in the overall atmospheric
ter that, a complete removal of the DD particles is observed. column (ATM), are presented in Sects. 3.3.2 and 3.3.3, re-
Later on 30 June, the dust signature is detected at 14:00 UTC spectively. In Sect. 3.3.4, the diurnal cycle of the dust direct
again (second DD episode, with a high aerosol mixing, as radiative effect is examined.
discussed before), lasting until the end of that day (unfortu-
nately, no P-MPL data were recorded later than 18:00 UTC). 3.3.1 Dust radiative properties
The CoM height also shows a descending behaviour, and
the mean Zm values during this episode for the Dc and Df At the time of writing this article AERONET V3L2.0 data
particles are, respectively, 3.4 ± 0.1 and 3.1 ± 0.5 km height were available from BCN, while only V3L1.5 data were
(slightly lower than those found in the first episode). available from LPZ. Figure 5 shows the time-height plot of
the VLDR, δ V , during the overall dust event period in BCN
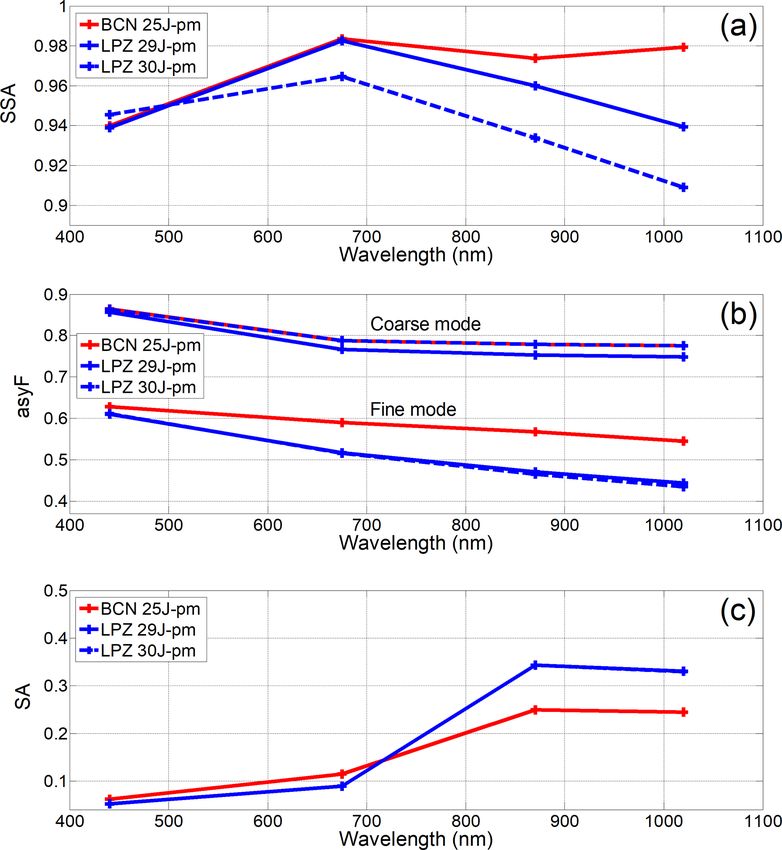
https://doi.org/10.5194/acp-21-6455-2021 Atmos. Chem. Phys., 21, 6455–6479, 20216466 C. Córdoba-Jabonero et al.: Dust SW radiative impact during the summer 2019 heatwave (23–30 June) and LPZ (29 and 30 June) in the top panels, 1020 nm value beyond that limit. The asyF is given sepa- together with the AERONET AOD at 440 nm (AOD440 ) and rately for the coarse and the fine mode. Since both available Ångström exponent (AE440−870 ) at both sites in the bottom SSA and asyF are columnar variables, they are assumed con- panels. The AERONET AOD and Ångström exponent are stant with height. Because AERONET forces AOD > 0.4 for given with an uncertainty of ± 0.02 (Eck et al., 1999) and the retrieval of level 2.0 SSA, AERONET V3L2.0 SSAs are ± 0.25, respectively, for AOD440 > 0.1 and in the order of only available in BCN on 24 June (one value in the morn- 50 % for AOD440 < 0.1 (Toledano et al., 2007). ing) and 25 June (three values in the afternoon). Hence, av- According to the δ V values plotted, the presence and the eraged DOD values on 25 June afternoon (25J-pm, denoted intensity of the dust outbreak in BCN is clearly visible, by a dashed red line in Fig. 5b) are used to be representative reaching a maximum 6 km height during the night of 23 to of the whole event for BCN. Only AERONET V3L1.5 inver- 24 June (marked as a dashed white line in Fig. 5a). The sions are available at LPZ from both 29 and 30 June, at the dust plume top height remains pretty constant at around 6 km moment of writing. Averaged afternoon values (29J-pm and during the whole dusty period, while the vertical structure 30J-pm, denoted by dashed blue lines in Fig. 5b) are assumed exhibits some variability. Although the dust event is still to be representative for each day. The same time intervals are visible on 30 June, the intensity already starts decreasing considered for the SSA, asyF, and SA. Their spectral depen- from 27 June onwards. During 23–27 June the VLDR val- dence is represented in Fig. 6, and their corresponding val- ues below and above 1 km height are significantly different ues at 440 nm are reported in Table 3. AERONET SSA and (less than 5 % and greater than 10 %, respectively) which asyF are given with an uncertainty of, respectively, ± 0.03 could indicate that during that period the dust plume stayed for AOD440 > 0.5 for dust and biomass burning and ± 0.04 aloft, decoupled from the local boundary layer. This fact can for desert dust particles (Dubovik et al., 2000, 2006). be confirmed by the vertical analysis of the optical prop- The SSA values found (approx. 0.94 at 440 nm; see erties, PBC and PLDR, as presented in Sect. 3.2.1, which Fig. 6a) are representative of moderately absorbing dust par- highlights the location of the dust signature at altitudes be- ticles. The typical spectral behaviour of SSA for dust is ex- tween 1 and 6 km height (see Fig. 3a). In addition, as shown pected to grow with increasing wavelength (Dubovik et al., in Fig. 5b (red points) the AOD440 reaches maximum val- 2002; Sicard et al., 2016). In the case of BCN, the SSA in- ues on 24 and 25 June and starts decreasing afterwards. In- creases from 440 to 675 nm, with variations smaller than 0.01 versely, AE440−870 reaches minimum values on both 24 and beyond 675 nm. Given the high SSA values (0.98) for wave- 25 June and increases afterwards. AOD440 peaks at 0.63 on lengths greater than 675 nm and the estimated accuracy of 25 June (AE440−870 = 0.19); daily averaged AOD440 values this product (± 0.03; see Sicard et al., 2016), the spectral of 0.39 ± 0.07 and 0.35 ± 0.14 are found on 24 and 25 June, shape of SSA in BCN is that expected for dust. In the case of respectively. LPZ, SSA increases between 440 and 675 nm and decreases In the case of LPZ (see Fig. 5b, blue points), the event is beyond 675 nm. This behaviour has been observed before by less intense than in BCN, and, as stated before, the dust intru- Sicard et al. (2016) for mixtures of dust and pollution when sion occurs in two close but separated periods (see Sect. 3.1). two opposite tendencies (dust SSA increases, while pollu- AOD440 increases in the afternoon of 29 June (peaks at 0.15), tion SSA decreases with increasing wavelength) combine. while at the same time AE440−870 drops from 1.5 down to These results suggest that AERONET columnar observations 0.75. On 30 June AOD440 decreases in the morning and in- in LPZ reveal a mixing of dust and, most probably, pollu- creases again in the afternoon up to a peak of 0.30 associated tion particles. However, although the columnar SSA pattern with values of AE440−870 oscillating around 1.0. is similar for both DD episodes, suggesting a certain dust– The dust radiative properties accepted by the GAME RT pollution mixing, lidar observations highlight the differences model are the AOD, the single scattering albedo (SSA), and between those two episodes at LPZ: a well-separated dust the asymmetry factor (asyF). These three parameters should layer above 3.5 km height is observed for the first one, and be spectrally defined for each height layer. The vertical pro- a more mixed dust environment is found for the second one files of coarse- and fine-mode dust extinction coefficients at (as also stated in Sect. 3.2), both depending on the dusty air 532 nm are obtained from the application of the POLIPHON mass pathways reaching the LPZ station (see Sect. 3.1). method to the continuous hourly averaged P-MPL measure- The spectral behaviour of the asymmetry factor is shown ments (see Sect. 2.2). These profiles are integrated along 18 in Fig. 6b for both the coarse and the fine modes. The for- layers, obtaining mean DOD values for both the coarse and ward scattering is much more pronounced for large particles fine mode. The spectral mean DOD value for each layer is (asyF440 = 0.86) than for small particles (asyF440 = 0.61– calculated from the layer-mean DOD at 532 nm (DOD532 ) 0.63) for all wavelengths. This result implies that, at constant using the AERONET AE440−870 . The SSA and asyF, as AOD and low solar zenith angle (SZA), and independent of well as the surface albedo (SA), are available from the the wavelength, the solar radiation scattered to the surface AERONET database. These three properties are interpolated is greater for the coarse mode than for the fine mode. The at the model wavelengths up to the highest AERONET wave- spectral asyF decreases with increasing wavelength for both length (1020 nm) and assumed constant with the AERONET modes, being similar for the coarse mode in BCN and LPZ. Atmos. Chem. Phys., 21, 6455–6479, 2021 https://doi.org/10.5194/acp-21-6455-2021
C. Córdoba-Jabonero et al.: Dust SW radiative impact during the summer 2019 heatwave                                         6467

Figure 6. AERONET spectral behaviour of (a) SSA, (b) asyF, and (c) SA for BCN (red lines) on 25 June afternoon (25J-pm) and for LPZ
(blue lines) on 29 and 30 June afternoon (29J-pm, solid lines, and 30J-pm, dashed lines, respectively).

This indicates that the scattering properties of this mode will      reaching the surface, more radiation will be reflected up-
have a similar effect on the radiative effect retrievals at both     ward in LPZ than in BCN. The spectral values of the sur-
sites. If the coarse mode in the column is formed exclusively        face albedo found are similar to those reported in Granados-
of dust particles, it can be stated that the ageing of dust has no   Muñoz et al. (2019), which were measured in Granada,
effect on the absorption capabilities of the coarse mode. The        Spain, at the same period of the year.
forward scattering of the fine mode at wavelengths greater
than 675 nm is slightly higher at BCN (asyF675 = 0.59) than          3.3.2   Dust direct radiative effect on the surface
at LPZ (asyF675 = 0.52). This result implies that, at near-
infrared wavelengths (> 675 nm), for constant AOD, and low           GAME simulations were performed for the 8 d considered in
SZA, the solar radiation scattered to the surface by fine par-       BCN (23–30 June) and the 2 d in LPZ (29 and 30 June), each
ticles should be greater at BCN than LPZ.                            day from 05:00 to 19:00 UTC when the sun was above the
   The surface albedo shows (see Fig. 6c) a general grow-            horizon (SZA < 90◦ ). The short-wave dust direct radiative
ing trend with increasing wavelength. Similar SA values are          effect (DRE) was calculated by using Eqs. (9) and (10) and
found at both sites at 440 (0.05 < SA440 < 0.06) and 675 nm          is plotted separately for the coarse-mode dust (Dc) and fine-
(0.09 < SA675 < 0.11). At wavelengths larger than 870 nm             mode dust (Df) plus the combined effect (DD = Dc + Df) in
higher SA values are found in LPZ (SA870 = 0.34) than in             Fig. 7. The fine-to-total ratio (Df/DD) was also calculated
BCN (SA870 = 0.25), indicating that at near-infrared wave-           for both the DOD and DRE. The instantaneous dust radia-
lengths the surface will appear “brighter” at LPZ compared           tive efficiency (DREff) was calculated as the ratio of instan-
to BCN, and accordingly, at constant incoming radiation              taneous DRE to DOD and the daily DREff as the best linear

https://doi.org/10.5194/acp-21-6455-2021                                             Atmos. Chem. Phys., 21, 6455–6479, 2021
6468                             C. Córdoba-Jabonero et al.: Dust SW radiative impact during the summer 2019 heatwave

Figure 7. Instantaneous dust direct radiative effects (DRE) on the surface (SRF) (blue), TOA (green), and in the atmosphere (red) in (a) BCN
and (b) LPZ. (c) Fine-to-total (Df/DD) ratio of the instantaneous dust DRE on the surface (SRF) and at the TOA in BCN; the best linear fit
has been calculated between 24 and 30 June (i.e. discarding 23 June) (both mean values and linear fittings are included in the legend). The
absolute increase in Df/DD DRE ratio on SRF (TOA) of +0.10 % h−1 (+0.12) is equivalent to an increase of +2.4 % d−1 (+2.9). UT stands
for UTC.

fit forced to 0 of the scatterplot of instantaneous values of 1         (2005) found daily values of DRE in the central Mediter-
full day of DRE as a function of DOD (see explanations in               ranean of −6.7 W m−2 (AOD550 = 0.227; SSA440 = 0.96
next paragraphs). Daily and maximal instantaneous values of             and asyF440 = 0.80) and −10.2 W m−2 (AOD550 = 0.227;
DRE and DREff on the surface are shown in Table 4.                      SSA440 = 0.88 and asyF440 = 0.81). Compared to climato-
    For both size modes the dust direct radiative effect on the         logical values, our findings are also in agreement with recent
surface (SRF), DRE(SRF), is negative for the overall dusty              works reporting about the same region. For instance, Tsik-
period (see Fig. 7, blue bars), indicating an aerosol cooling of        erdekis et al. (2019) simulated with RegCM4 the dust short-
the surface. In BCN, most of the instantaneous coarse-mode              wave direct radiative effect for a 10 year period (1 December
(fine-mode) DRE, DREDc (DREDf ), are above −20 W m−2                    1999 to 30 November 2009) and found for the summer sea-
(−10 W m−2 ). These values suggest that in terms of in-                 son values of −14.9 and −5.5 W m−2 over the Saharan re-
stantaneous radiative effect, the dust event should be clas-            gion and for the Mediterranean Basin, respectively. The fine-
sified as moderate. The singular aspect of the event lies               to-total ratio (Df/DD) of the daily DRE varies between 28 %
in its duration and geographical extension. Instantaneous               and 46 %, being 37 % on average over the whole dust event;
values of the total DRE, DREDD , below −20 W m−2 are                    that is, the Df/DD ratio of DRE produce a little more than
reached during 4 d from 24 to 27 June, which can be iden-               one-third of the total DRE. This result can be interestingly
tified as the most intensive period of the event in BCN                 related to the Df/DD ratio of the daily DOD (24 %), mean-
(the daily DOD at 532 nm, DOD532 , varies between 0.13                  ing, in relative terms, that the fine dust particles contribute
and 0.26), as stated before in Sect. 3.2. Peak values of the            more to the total DRE than they do to the DOD.
instantaneous DRE are reached at the same time for both                    Figure 8 nicely illustrates the dust direct radiative effect
modes on 25 June at 17:00 UTC and produce a peak of to-                 on the surface, DRE(SRF), and at the TOA, DRE(TOA).
tal DRE of −54.5 W m−2 (DOD532 = 0.45). This maximum                    Figure 8a shows the instantaneous DRE(SRF) for both
is in the range of values as calculated by Sicard et al. (2014a)        coarse (red) and fine (blue) modes as a function of their re-
(−55.4–−53.1 W m−2 ) for two mineral dust outbreaks oc-                 spective DOD532 . By using linear regression analysis (re-
curring in Barcelona in summer 2009 and AODs of 0.38.                   garding DRE = 0 with DOD = 0), the DREff corresponds
In terms of daily averaged values (see Table 4), DREDc                  to the slope of the linear fittings. In BCN, the total
and DREDf were −5.7 ± 2.8 and −3.4 ± 1.3 W m−2 on av-                   dust DREff on the surface, DREff(SRF), over the whole
erage over the whole event (23–30 June), leading to a daily             event is −75.2 and −129.6 W m−2 τ −1 , for the coarse
DREDD of −9.1 ± 3.9 W m−2 . For comparison, Meloni et al.               and fine modes respectively, producing a total dust DR-

Atmos. Chem. Phys., 21, 6455–6479, 2021                                                    https://doi.org/10.5194/acp-21-6455-2021
You can also read


