A numerical study to investigate the roles of former Hurricane Leslie, orography and evaporative cooling in the 2018 Aude heavy-precipitation event
←
→
Page content transcription
If your browser does not render page correctly, please read the page content below
Weather Clim. Dynam., 2, 795–818, 2021
https://doi.org/10.5194/wcd-2-795-2021
© Author(s) 2021. This work is distributed under
the Creative Commons Attribution 4.0 License.

A numerical study to investigate the roles of former
Hurricane Leslie, orography and evaporative cooling
in the 2018 Aude heavy-precipitation event
Marc Mandement and Olivier Caumont
CNRM, Université de Toulouse, Météo-France, CNRS, Toulouse, France

Correspondence: Marc Mandement (marc.mandement@meteo.fr)

Received: 22 October 2020 – Discussion started: 29 October 2020
Revised: 15 June 2021 – Accepted: 8 July 2021 – Published: 31 August 2021

Abstract. In south-eastern France, the Mediterranean coast        strong updraughts near the location of the maximum rainfall
is regularly affected by heavy-precipitation events. On 14–       were lifted above the quasi-stationary front. Downwind of
15 October 2018, in the Aude department, a back-building          the Albera Massif, mountains bordering the Mediterranean
quasi-stationary mesoscale convective system produced up          Sea, cells formed by orographic lifting were maintained by
to about 300 mm of rain in 11 h. At synoptic scale, the for-      low-level leeward convergence, mountain lee waves and a
mer Hurricane Leslie was involved in the formation of a           favourable directional wind shear; when terrain is flattened,
Mediterranean surface low that channelled conditionally un-       rainfall is substantially reduced. The location of the excep-
stable air towards the coast. At mesoscale, convective cells      tional precipitation was primarily driven by the location of
focused west of a decaying cold front that became quasi-          the quasi-stationary front and secondarily by the location of
stationary and downwind of the terrain. To investigate the        convective bands downwind of orography.
roles of the moisture provided by Leslie, orography and
evaporative cooling among the physical processes that led
to the location and intensity of the observed rainfall, numer-
ical simulations are run at 1 km and 500 m horizontal grid        1   Introduction
spacing and evaluated with independent near-surface analy-
ses including novel crowd-sourced observations of personal        Heavy-precipitation events (HPEs), usually defined as events
weather stations. Simulations show that, in a first part of the   with daily rainfall exceeding 150 mm (Ricard et al., 2012),
event, low-level conditionally unstable air parcels found in-     affect all the coastal areas of the western Mediterranean re-
side strong updraughts mainly originated from areas east of       gion, often producing flash floods (Nuissier et al., 2008). Due
the Balearic Islands, over the Mediterranean Sea, whereas in      to the large societal impact of these events causing casual-
a second part, an increasing number originated from Leslie’s      ties and damage, they were extensively studied during the
remnants. Air masses from areas east of the Balearic Is-          HyMeX programme extending from 2010 to 2020 (Ducrocq
lands appeared as the first supplier of moisture over the en-     et al., 2016). Large rainfall amounts observed in time peri-
tire event. Still, Leslie contributed to substantially moisten-   ods from a few hours to several days during HPEs are the
ing mid-levels over the Aude department, diminishing evap-        result of deep convection focusing over the same area. Con-
oration processes. Thus, the evaporative cooling over the         vective organization often consists of continuous convective
Aude department did not play any substantial role in the          cell renewal constituting quasi-stationary mesoscale convec-
stationarity of the quasi-stationary front. Regarding lifting     tive systems (MCSs).
mechanisms, the advection of conditionally unstable air by           Ricard et al. (2012) built a climatology of HPE envi-
a low-level jet towards the quasi-stationary front, confined      ronments over the north-western Mediterranean area based
to altitudes below 2 km, reactivated convection along and         on 3D-Var ALADIN (Aire Limitée Adaptation Dynamique
downwind of the front. Most of the air parcels found inside       Développement InterNational) mesoscale analyses of a 5-

Published by Copernicus Publications on behalf of the European Geosciences Union.
796                      M. Mandement and O. Caumont: A numerical study of the 2018 Aude heavy-precipitation event

year period (2002–2006). With this climatology, synoptic           or maintenance of cold pools (Ducrocq et al., 2008; Duffourg
situations favouring HPEs over Languedoc-Roussillon, the           et al., 2018).
maritime part of the Occitanie region in southern France              Among these mechanisms, those at the origin of the HPE
(Fig. 1), are now well known (e.g. Fig. 11 of Ricard et al.,       of the night of 14 to 15 October 2018, on which this ar-
2012; Fig. 1 of Ducrocq et al., 2016). At upper levels, a          ticle focuses, are studied. During that night, in the centre
trough extends over the Iberian peninsula in a south-east–         and north-west of the Aude department (Fig. 1), part of
north-west orientation. This trough is associated with a cold      Languedoc-Roussillon, rainfall accumulations over 200 mm
low in the middle and high troposphere and generally entails       in less than 12 h affected an approximately 60 km long and
a diffluent south-westerly flow at upper levels. MCSs develop      10 km wide band oriented south-east to north-west. Inside
preferentially northwards of a slowly evolving surface low         the band, an automatic rain gauge in Trèbes (Fig. 2) mea-
located between the Iberian Peninsula and the Balearic Is-         sured 295.5 mm in 11 h, including 243.5 mm in 6 h and
lands focusing a south-easterly low-level jet (LLJ). The loca-     110.5 mm in 2 h. Météo-France volunteer observers mea-
tion and the deepening of the slowly evolving surface low is       sured 318.9 mm in Conques-sur-Orbiel and 306.6 mm in
a key ingredient in focusing convection over the same area         Cuxac-Cabardès with manual rain gauges in 2 d, probably
and continuously initiating convection inside MCSs (Duf-           fallen almost entirely in 12 h as 93 % to 99 % of the 2 d
fourg et al., 2016; Nuissier et al., 2016). The Mediterranean      rainfall fell in 12 h in nearby Météo-France automatic rain
Sea supplies moisture – up to 60 % of the total air parcel         gauges. In the centre and north-western part of the band,
moisture in previous HPEs according to water budgets of            such 12 h rainfall accumulations were unprecedented in re-
Duffourg and Ducrocq (2013) – and heat to this low-level air-      cent meteorological records, and return periods were esti-
flow through evaporation and heat exchange, which both de-         mated over 100 years. The orientation of the band, par-
pend on the sea surface temperature (SST). Thus, abnormally        allel to the small Trapel river catchment, led to a ma-
warm SSTs can destabilize atmospheric lower levels up to           jor flash flood in this catchment in particular, overflowing
2–3 km a.s.l. (above sea level) (Lebeaupin et al., 2006), mod-     and destroying bridges. It caused 15 fatalities; injured 75;
ulating the intensity of convective precipitation. All these in-   and caused around EUR 325 million of damages, including
gredients favour a persistent LLJ transporting low-level con-      EUR 256 million in insurable assets for around 29 000 in-
ditionally unstable air parcels over the Gulf of Lion.             surance claims and EUR 69 million in non-insurable as-
   Several mechanisms are responsible for lifting this con-        sets (Préfecture de l’Aude, 2018; Ayphassorho et al., 2019;
ditionally unstable low-level marine flow, triggering convec-      French Insurance Federation, 2019; Petrucci et al., 2020).
tion over the same area. First, the mountainous terrain bor-       This episode is part of a series of HPEs that occurred in Oc-
dering the Mediterranean shore leads to orographic lifting.        tober and November 2018 over the north-western Mediter-
Secondly, in the lower levels of the atmosphere, mesoscale         ranean and particularly affected the Balearic Islands on 9 Oc-
boundaries, when stationary, can lift air parcels over the         tober (Lorenzo-Lacruz et al., 2019) and Italy between 27 and
same areas. Such stationary boundaries can be fronts (Trap-        30 October (Davolio et al., 2020).
ero et al., 2013), outflow boundaries of cold pools (Ducrocq          As described by Kreitz et al. (2020) and Caumont et al.
et al., 2008) or local convergence lines (Buzzi et al., 2014)      (2021), at large scale, a remarkable feature was the extrat-
among others. Lifting mechanisms include mechanical lift-          ropical transition of Hurricane Leslie before landfall in the
ing in convergence areas and buoyancy differences between          Portuguese coast on the evening of 13 October, 1 d before
air masses. The action of these mesoscale boundaries is com-       the HPE started. Transitioning hurricanes over the North At-
bined with the action of the terrain itself and explains why       lantic are known to disturb the midlatitude flow close to
large rainfall amounts are observed over the mountains as          or downstream of them, causing or modifying the location
well as in the Mediterranean plains and over the sea (Duf-         and intensity of high-impact weather such as HPEs (Grams
fourg et al., 2018). Once convection initiated, the locations      and Blumer, 2015; Pantillon et al., 2015). As hurricanes can
of these mesoscale boundaries and the amplitudes of their          supply large amounts of moisture and because the mois-
temperature, humidity, pressure and wind speed gradients           ture structure in the lower troposphere was shown to play
can be continuously modified by the MCS thanks to small-           a key role in the timing and location of precipitation of pre-
scale feedback mechanisms of the convection to the en-             vious HPEs (Lee et al., 2018), it is of interest to quantify
vironment (Duffourg et al., 2016). Cold pools, which are           the amount of moisture supplied by Leslie to the convec-
favoured by a dry or weak upstream low-level flow accord-          tive system. At a smaller scale, the largest rainfall accumu-
ing to the idealized study of Bresson et al. (2012) over south-    lations were aligned along bands downstream of the Pyre-
ern France, are affected by such feedback mechanisms. In           nees relief. Within the bands, the largest accumulations were
previous HPEs, dry air parcels at altitudes between 1 and          found west of a quasi-stationary front and a quasi-stationary
4 km a.s.l., when mixed with precipitation of the MCS, were        mesoscale trough. Because of the heavy convective rain ob-
humidified and cooled through evaporation processes, form-         served west of this front, evaporative cooling may have addi-
ing vigorous downdraughts, which resulted in the formation         tionally cooled the west side of the front. This additional cold
                                                                   air may have caused a dynamic feedback that contributed to

Weather Clim. Dynam., 2, 795–818, 2021                                                 https://doi.org/10.5194/wcd-2-795-2021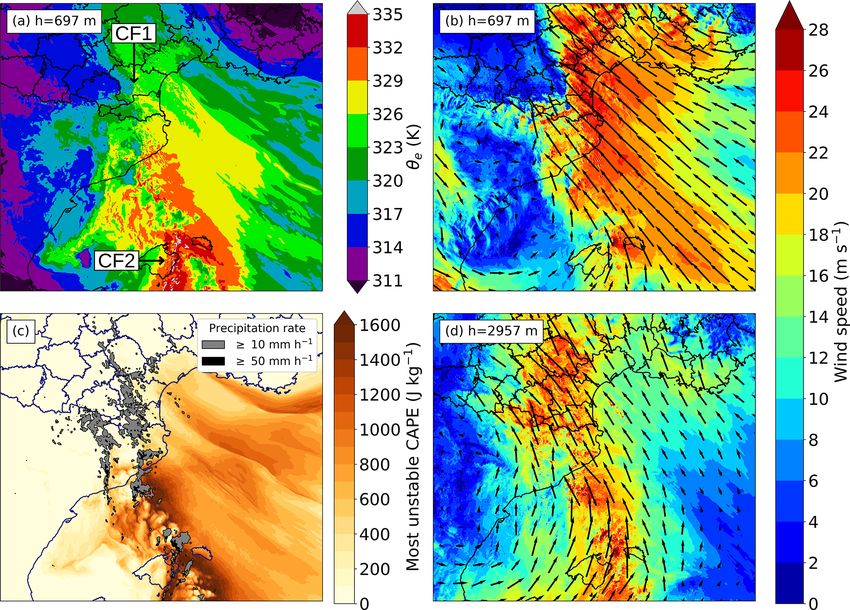
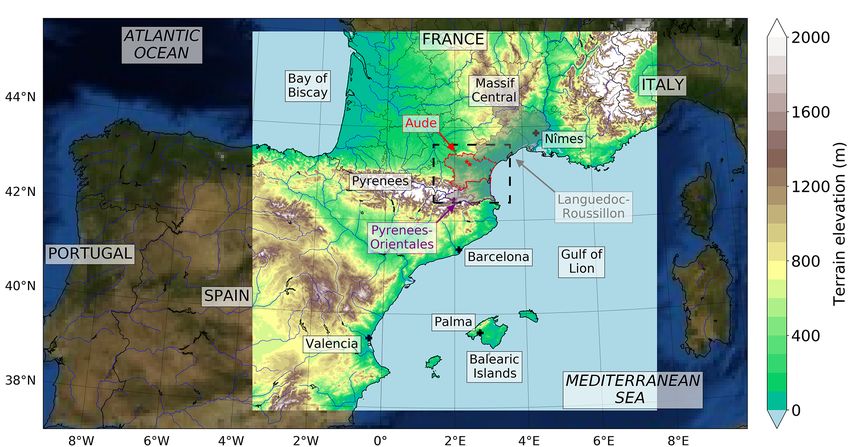
M. Mandement and O. Caumont: A numerical study of the 2018 Aude heavy-precipitation event                                               797

Figure 1. Map of south-western Europe. The bright square and the dashed black line correspond to the two grid-nested model domains.
Inside the bright square, terrain elevation from the parent model is shown; outside, it is the NASA visible blue marble image (from https:
//visibleearth.nasa.gov, last access: 20 July 2021). Solid black lines indicate French departments and country borders. Languedoc-Roussillon,
a region including Aude and Pyrenees-Orientales departments, is shaded. The two little red stars, landmarks displayed in other figures,
indicate from north to south the locations of Villegailhenc and Trèbes, which are two towns that were affected by the HPE.

Figure 2. Orography of the south Languedoc-Roussillon including the Aude department in the simulations (a) REF and (b) NOALB, in
which the Albera Massif is removed. Solid black lines indicate French departments and country borders. Stars indicate towns which were
affected by the HPE: “V” is Villegailhenc, “T” is Trèbes, “Cu” is Cuxac-Cabardès, and “Co” is Conques-sur-Orbiel. Red contours indicate
mountain massifs.

the stationarity of the front. A similar dynamic feedback was            evaporative cooling in the physical processes that led to the
described by Davolio et al. (2016) over north-eastern Italy: in          location and intensity of the observed rainfall? Investigation
cases of upstream events, a cold air layer formation preceded            of these questions is carried out as follows. First, the case
the convection onset, and evaporation and sublimation of pre-            study is presented in Sect. 2. Numerical simulations of this
cipitation beneath the convective system were able to addi-              HPE are described in Sect. 3. The realism of the reference
tionally cool this cold air layer, which influenced the propa-           simulation is evaluated in particular near the surface through
gation of this cold air mass. Consequently, the goal of the ar-          a comparison with independent analyses built from screen-
ticle is to address the following questions raised by Caumont            level observations of standard and personal weather stations
et al. (2021): what were the roles of (i) the moisture pro-              (Mandement and Caumont, 2020) in Sect. 4. The reference
vided by Leslie, (ii) the eastern Pyrenees relief and (iii) the          simulation and a simulation to study the sensitivity to the ter-

https://doi.org/10.5194/wcd-2-795-2021                                                      Weather Clim. Dynam., 2, 795–818, 2021
798 M. Mandement and O. Caumont: A numerical study of the 2018 Aude heavy-precipitation event
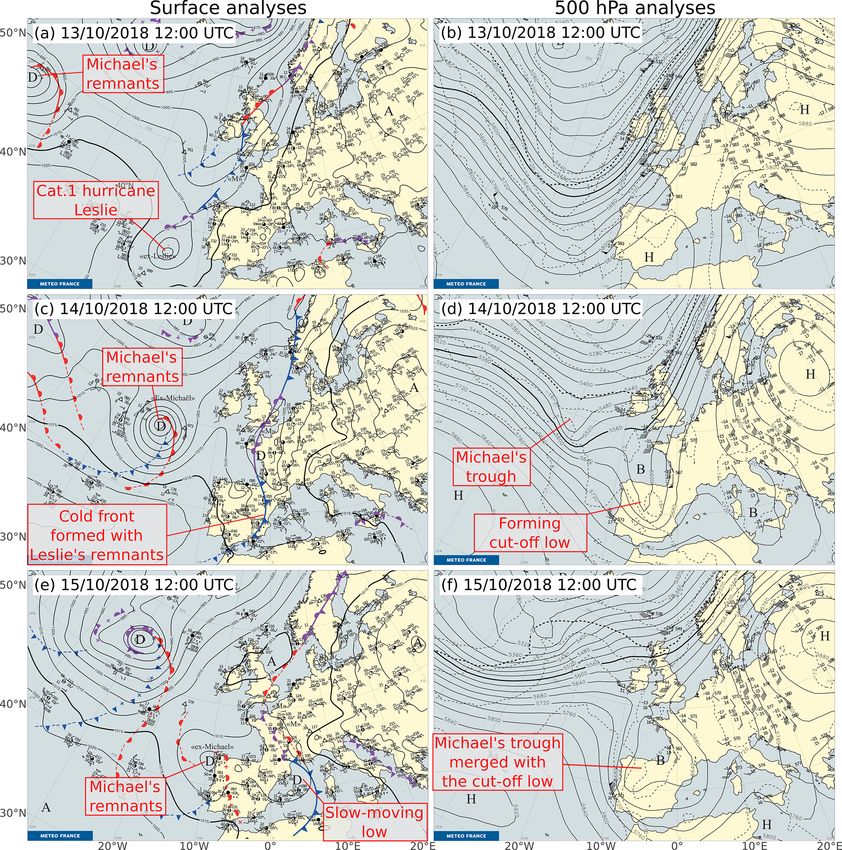
Figure 3. Météo-France (a, c, e) surface and (b, d, f) 500 hPa analyses (Santurette and Joly, 2002) at (a, b) 12:00 UTC on 13 October 2018,
(c, d) 12:00 UTC on 14 October 2018 and (e, f) 12:00 UTC on 15 October 2018. Surface fronts are manually drawn using conventional
observations, satellite and radar images, and short-term forecasts (instead of analyses due to availability time constraints). Mean sea level
pressure (in hPa), 500 hPa geopotential height (in geopotential metres, gpm) and temperature (in ◦ C) are from the operational global model
ARPEGE (Courtier et al., 1991) 6 h forecast of the T − 6 h run (T : time of the chart). Surface (altitude) low-pressure centres are indicated
by “D” (“B”) and high-pressure centres by “A” (“H”).
rain are used in Sect. 5 to investigate processes that led to the 2 Case description
observed rainfall, in particular the role of Leslie. Then, the
role of the cooling associated with the evaporation of precip- 2.1 Synoptic-scale situation
itation is evaluated in Sect. 6.
Between 13 and 15 October, the synoptic situation over west-
ern Europe was disturbed by the remnants of hurricanes
Leslie and Michael (NOAA NESDIS, 2018), while the sit-
uation remained blocked over eastern Europe due to a quasi-
stationary high at all levels of the troposphere. At 500 hPa,
on 13 October at 12:00 UTC, a large trough extended from
the west of Iceland towards the west of Portugal (Fig. 3b).
Weather Clim. Dynam., 2, 795–818, 2021 https://doi.org/10.5194/wcd-2-795-2021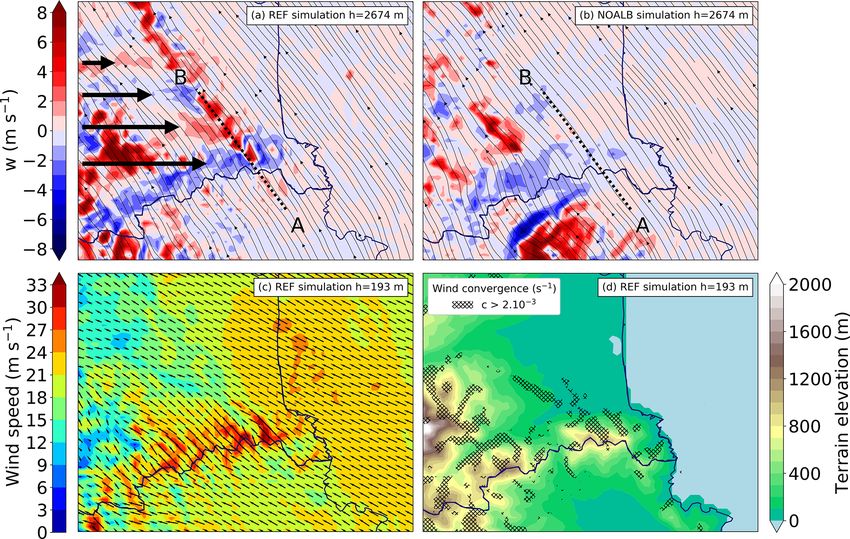
M. Mandement and O. Caumont: A numerical study of the 2018 Aude heavy-precipitation event                                               799

Figure 4. ARPEGE analyses of water vapour mixing ratio and geopotential height (in gpm) at 925 hPa on 13 October 2018 at (a) 18:00 UTC;
on 14 October 2018 at (b) 00:00 UTC, (c) 06:00 UTC, (d) 12:00 UTC and (e) 18:00 UTC; and (f) on 15 October 2018 at 00:00 UTC. The
approximate location of moist air masses carried by Leslie (solid red line) or found over the Mediterranean Sea (dashed red line) is circled.

The trough split and evolved in a cut-off low over Spain on              Roussillon (Caumont et al., 2021). This low moved slowly
14 October at 12:00 UTC (Fig. 3d), while the remnants of                 northwards overnight, which increased the MSLP gradient
former Hurricane Michael generated a secondary trough at                 along the Languedoc-Roussillon coast. Consequently, the
the rear of the cut-off. On 15 October at 12:00 UTC (Fig. 3f),           east–south-easterly wind between the surface and 925 hPa
this secondary trough merged with the existing cut-off low,              strengthened (not shown). This resulting LLJ supplied sig-
which slowed its eastward movement.                                      nificantly moist air from the Mediterranean Sea (dashed lines
   Near the surface, on 13 October at 12:00 UTC (Fig. 3a),               in Fig. 4d–f).
category 1 Hurricane Leslie approached the Portuguese coast                 In the meantime, on 14 October, the active part of the cold
(NOAA NWS National Hurricane Center, 2018a). Leslie                      front located north of the Pyrenees (called CF1; Fig. 3c)
brought a large amount of moisture at all levels of the tro-             moved eastwards. CF1 decayed (precipitation along it de-
posphere: over large areas, water vapour mixing ratio ex-                creased and almost stopped) as it moved east (not shown),
ceeded 12 g kg−1 at 925 hPa (Fig. 4a), 7 g kg−1 at 700 hPa               while its near-surface mark in the form of a thermal gra-
(not shown) and 2.5 g kg−1 at 500 hPa (not shown) accord-                dient remained (Caumont et al., 2021). Then CF1 stopped
ing to ARPEGE analyses on 13 October at 18:00 UTC. These                 in the middle of the Aude department and became a quasi-
values are in the upper range of mixing ratios observed                  stationary front, slightly west of the MSLP trough. Both
within the boundary layer over the Gulf of Lion by Di Giro-              CF1 and the MSLP trough remained quasi-stationary be-
lamo et al. (2016) (8–15 g kg−1 ) or within the free tropo-              tween 22:30 UTC on 14 October and 04:00 UTC on 15 Oc-
sphere below 3 km a.g.l. (2–8 g kg−1 ) over the Balearic Is-             tober (Caumont et al., 2021).
lands by Chazette et al. (2016) during southerly marine flows               In the morning of 15 October, the north-eastwards advance
of the HyMeX SOP1. Leslie made landfall in Portugal be-                  of the slow-moving low and its associated cold front (CF2;
tween 21:00 and 22:00 UTC (NOAA NWS National Hurri-                      Fig. 3c and e) brought additional low-level moisture over
cane Center, 2018b) as a post-tropical cyclone. After land-              Languedoc-Roussillon. This moisture originated from both
fall, Leslie’s mean sea level pressure (MSLP) low filled up              Leslie’s remnants and a moist area over southern Spain
quickly, and Leslie’s remnants participated in extending to-             (Fig. 4).
wards the south and increase the activity over Spain and
France of the existing cold front on 14 October (Fig. 3c).               2.2   Mesoscale situation
During the evening and the night of 14–15 October, around
the cold front, in an area of deep convection, a low rapidly             At mesoscale, rain started over the Pyrenees-Orientales and
deepened over the Mediterranean Sea, between the Balearic                Aude departments in the morning of 14 October. A first
Islands and Valencia region (Fig. 3e). A trough formed                   part of the HPE began around 19:00 UTC on 14 October:
and extended this Mediterranean low towards Languedoc-                   east of a large area of stratiform rain advected from Spain,
                                                                         two parallel lines of convective cells formed (red arrows

https://doi.org/10.5194/wcd-2-795-2021                                                      Weather Clim. Dynam., 2, 795–818, 2021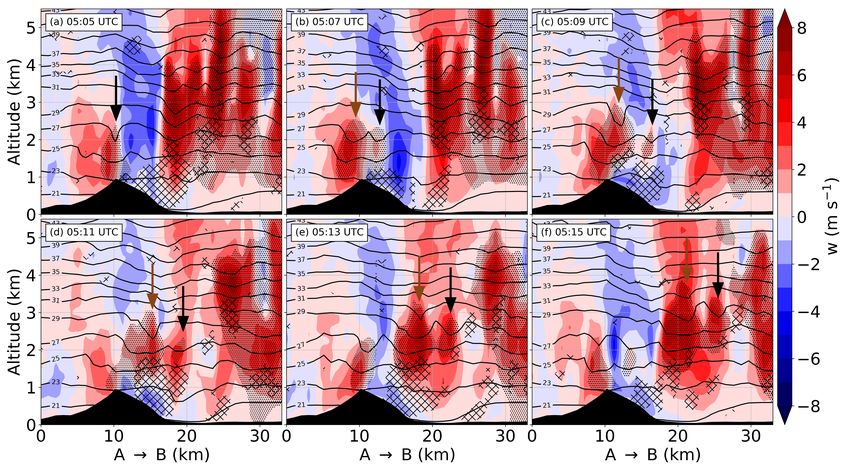
800                       M. Mandement and O. Caumont: A numerical study of the 2018 Aude heavy-precipitation event

Figure 5. Radar base reflectivity from the Météo-France operational mosaic on 14 October at (a) 21:35 UTC and (b) 23:00 UTC and on
15 October at (c) 02:00 UTC and (d) 05:05 UTC. Red arrows show the axes of continuous convective cell renewal and the movement of
individual cells shown by radar. “A” and “P” recall the location of the Albera Massif and the eastern slopes of the Pyrenees, respectively.
Locations of CF1 and CF2 are indicated by bold black frontal symbols.

in Fig. 5a), starting over the Albera Massif and the east-              rainfall persisted over the Aude department and strengthened
ern slopes of the Pyrenees, and rapidly became the active               in particular west of CF1 (Fig. 5d). After 05:00 UTC, the
parts of a back-building MCS. The eastern line was more ac-             large rain band associated with CF2 headed slowly north-
tive than the western line: reflectivities exceeded 40 dBZ at           eastwards, and precipitation stopped around 07:00 UTC over
21:35 UTC along the eastern line but remained below 40 dBZ              the western part of the Aude department (around 09:00 UTC
along the western line (Fig. 5a). One shall note that the Opoul         over the entire department; not shown).
radar (Fig. 5a), well covering the area, had a failure between             Figure 6a shows the resulting 24 h accumulated precipi-
21:55 UTC on 14 October and 06:05 UTC on 15 October:                    tation from the standard and personal weather stations (SP-
observed reflectivities are likely underestimated in Fig. 5b–           WSs) ANTILOPE quantitative precipitation estimate (QPE)
d, particularly south of this radar.                                    at 1 km horizontal grid spacing, blending radar and SPWS
    At 23:00 UTC, Fig. 5b shows that convective cores fed the           rain gauge observations, described by Caumont et al. (2021).
eastern line from its eastern flank and that reflectivities were        Estimated accumulated precipitation reached 342 mm a few
particularly strengthened in the north-western part of the line,        kilometres south-west of Trèbes, close to where an automatic
west of CF1. This organization in two lines was observed un-            rain gauge measured 295.5 mm, and a personal weather sta-
til around 00:00 UTC. After 00:00 UTC, the eastern line ori-            tion measured 311 mm. The line organization identified on
entation slightly turned anticlockwise, and a third active line         radar observations resulted in two precipitation bands, re-
formed (Fig. 5c) starting from the upstream slopes of the Cor-          ferred to as eastern and western bands, with the eastern band
bières Massif. Reflectivities of all lines were still strength-         a little curved due to the formation of the aforementioned
ened in their north-western parts. At 02:00 UTC (Fig. 5c),              third line between 00:00 and 02:00 UTC. The consequences
an extended region of reflectivity > 12 dBZ appeared over               were catastrophic near the precipitation maximum because
the Mediterranean Sea showing the advance of the rain band              most of the rain fell in 6 to 12 h (Préfecture de l’Aude,
associated with CF2. After 02:00 UTC, in a second part of               2018; Ayphassorho et al., 2019). Another local maximum
the HPE, this rain band modified the MCS organization in                of 317 mm was estimated over mountains north-east of the
lines observed until then: active cells with reflectivity above         bands but without reported consequences since hourly pre-
40 dBZ were continuously advected from the sea. Heavy                   cipitation accumulations remained moderate.

Weather Clim. Dynam., 2, 795–818, 2021                                                       https://doi.org/10.5194/wcd-2-795-2021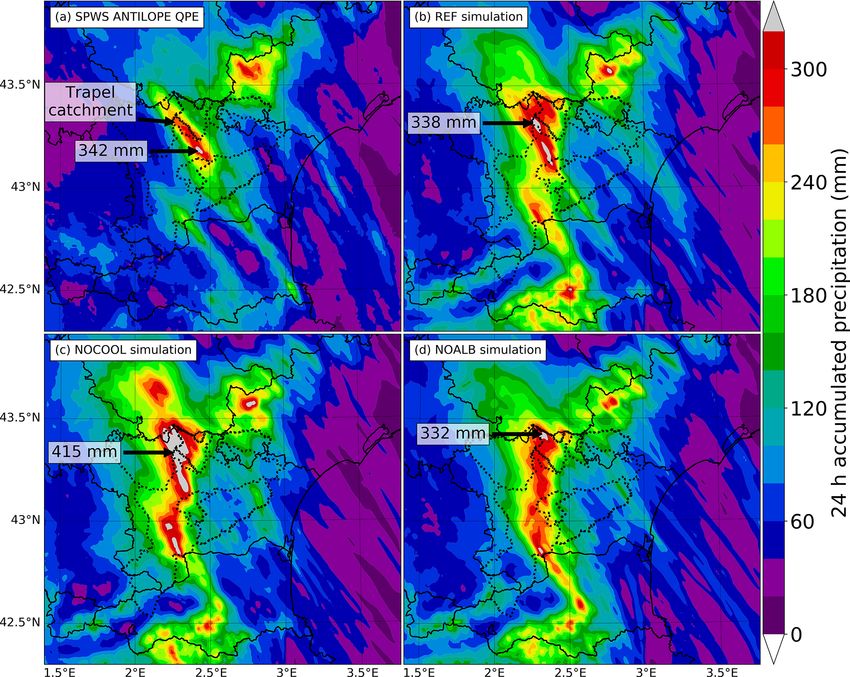
M. Mandement and O. Caumont: A numerical study of the 2018 Aude heavy-precipitation event                                    801

Figure 6. Accumulated precipitation over 24 h between 12:00 UTC on 14 October and 12:00 UTC on 15 October from the (a) SPWS
ANTILOPE QPE, (b) REF, (c) NOCOOL and (d) NOALB simulations. Solid black lines indicate French departments and country borders.
Dotted black lines indicate catchment limits of the Aude basin and its tributaries.

3     Numerical simulations                                       parent model given by AROME analyses every 3 h. Further
                                                                  details are given in Appendix A.
Simulations are performed with the non-hydrostatic numeri-
cal research model Meso-NH version 5.4.2 (Lac et al., 2018),      3.2   Experiments
extensively used to study Mediterranean MCSs (Bouin et al.,
2017; Martinet et al., 2017; Duffourg et al., 2018).              Three simulations are shown in the study. The first one is car-
                                                                  ried out to realistically simulate the rainfall observed during
                                                                  the case and is called REF hereafter.
3.1    Meso-NH configuration                                         The second simulation, called NOALB, investigates the
                                                                  role of the Albera Massif in precipitation. The Albera Mas-
A two-way interactive grid nesting is chosen in order to          sif is the easternmost massif of the Pyrenees, bordering the
study the sensitivity to a modification of model physics only     Mediterranean Sea (Fig. 2); its highest mountain is the Neu-
within the child domain. A 960 km × 900 km horizontal do-         los peak, which culminates at an altitude of 1256 m. Its alti-
main with a 1 km grid spacing covering southern France and        tude is 1023 m (1128 m) in the parent (child) model. In the
the north-western Mediterranean Sea is chosen for the par-        2018 Aude HPE, radar observations in Fig. 5a–c show that a
ent domain, and a 180 km×135 km horizontal domain with a          large number of convective cells were continuously initiated
500 m grid spacing centred over Aude is chosen for the child      during several hours over the Albera Massif and remained
domain (Fig. 1). For both domains, configurations close to        aligned downstream. These observations support the occur-
the AROME operational model (Seity et al., 2011; Brousseau        rence of quasi-stationary convective banding. Similar con-
et al., 2016) are chosen to realistically simulate deep con-      vective band generation was observed in the south-eastern
vection. The Gal-Chen and Somerville (1975) height-based          flank of the Massif Central by Miniscloux et al. (2001) and
vertical coordinate is used with 89 stretched vertical levels     Cosma et al. (2002): rainfall bands were enhanced on the lee
from 5 m up to 23.75 km, including 33 levels below 2 km           side of small-scale topography ridges. Cosma et al. (2002)
height. Simulations start on 14 October at 12:00 UTC and          showed in both idealized and real-case simulations that the
last 24 h, with initial and lateral boundary conditions of the    extension of precipitation lines downwind of orography re-

https://doi.org/10.5194/wcd-2-795-2021                                             Weather Clim. Dynam., 2, 795–818, 2021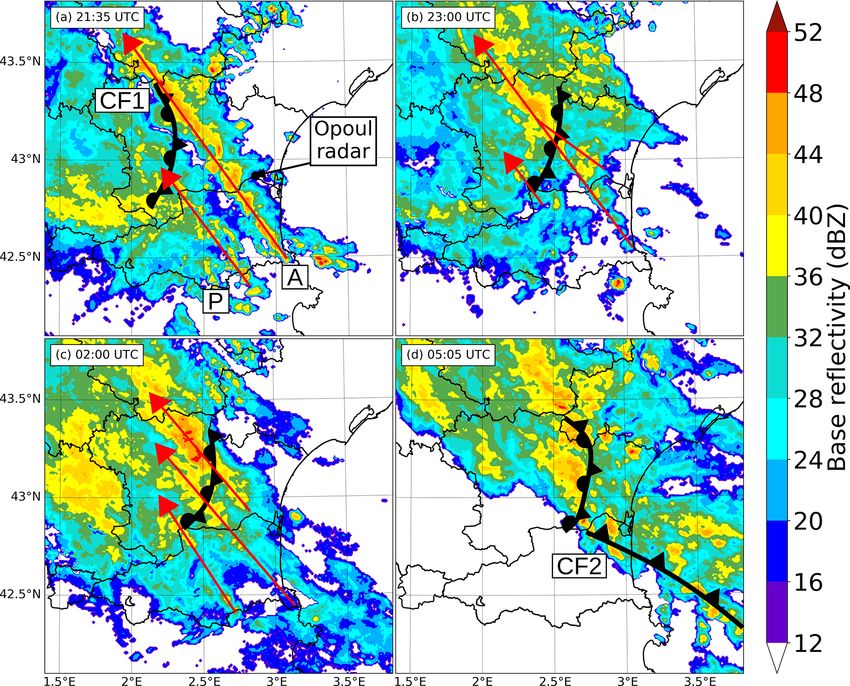
802                      M. Mandement and O. Caumont: A numerical study of the 2018 Aude heavy-precipitation event

sulted from (i) the formation of a mountain wave immedi-                Because the stationarity of precipitation is correlated to the
ately downwind of the crest and (ii) the lee-side convergence        quasi-stationarity of an MSLP trough and a virtual potential
created by deflection around the obstacle. Sensitivity tests in-     temperature (θv ) gradient (Sect. 2.1) and because of the avail-
dicated that the structure (length, width) and the intensity of      ability of near-surface observations that are not assimilated
the rain band were quite dependent on the upwind meteoro-            in the AROME model, this section focuses on validating the
logical conditions and on the topographic configuration. The         REF simulation near the surface. Near-surface fields of the
strengthening of convection downstream of small-scale topo-          REF simulation are compared to independent SPWS analy-
graphic structures due to lee-side convergence was also noted        ses built from screen-level observations of SPWS described
by Ricard (2005) during the 1995 Cévennes HPE or Bar-                by Mandement and Caumont (2020). Instead of directly com-
rett et al. (2015) over the United Kingdom, combined in that         paring the two fields, to disentangle physical departures from
last case with thermally forced convergence. Also, the Albera        departures due to both gridding methods and model features
Massif could have played a role in precipitation in previous         that cannot be resolved by the observation network used in
HPEs such as the 1999 Aude HPE described by Nuissier et al.          the SPWS analyses, REF is interpolated in the same way as
(2008) and Ducrocq et al. (2008). In 1999, precipitation re-         the SPWS analyses. This interpolation, called REF_SP, con-
mained stationary along a narrow line, and the precipitation         sists of replacing the value and altitude of each weather sta-
maximum was found 30 km east of the 2018 Aude HPE max-               tion used in the SPWS analyses with the value and altitude of
imum, downstream of the Albera Massif, which was identi-             the nearest REF grid point, keeping the exact same weights
fied as one of the sources of lifting (see parcel number 1 in        and gridding method. Thus, in this section, the REF_SP fields
Fig. 9 of Ducrocq et al., 2008). In NOALB, the Albera Mas-           are compared to the SPWS analyses (the REF fields are also
sif (Fig. 2a, red solid lines) is flattened at a constant altitude   shown to illustrate the method). For precipitation, REF is di-
of 25 m a.s.l., except west of the massif in order to avoid an       rectly compared to the SPWS ANTILOPE QPE since the
abrupt transition to higher terrain. West of the Albera Mas-         horizontal resolution of radar observations used in the QPE
sif, terrain elevations are set to gradually decrease at a rate      is close to the horizontal grid spacing of REF.
of 40 m every kilometre eastwards (4 % slope) until reach-              Regarding rainfall accumulations, the REF simulation is
ing 25 m a.s.l. Such transition is not necessary north or south      able to reproduce the organization in two bands oriented
of the Albera Massif because terrain elevation is mainly be-         south-east to north-west (Fig. 6a and b) found in the QPE.
low 25 m a.s.l. The topography resulting from these changes          Both bands, including local maxima, are located quite cor-
is shown in Fig. 2b.                                                 rectly. Along the eastern band, two local precipitation max-
   The third simulation, called NOCOOL, investigates the             ima are simulated: a first one north of the Trapel catchment
role of the evaporation of raindrops in cooling the cold sector      with 338 mm and another one with 331 mm at the same lat-
west of CF1 and its influence on the movement of CF1. In-            itude but 7.3 km west of the 342 mm QPE maximum. Rain-
deed, because convective cells are formed or enhanced down-          fall along the southern part of this eastern band is underesti-
stream of CF1 (Fig. 5), enhanced evaporative cooling could           mated. Along the western band, the local maximum is largely
serve to anchor CF1 at the same location since downdraughts          overestimated with 296 mm, whereas the QPE estimates
of these cells do not destroy the frontal zone (Chappell,            206 mm, and in the southern part of the band, simulated rain-
1986). In NOCOOL, negative temperature tendency from                 fall amounts reach more than twice the observations. In the
evaporation of raindrops is set to zero for the child model          upper right corner of Fig. 6b, the shape of the area affected by
(black dashed square in Fig. 1), which allows us to quan-            heavy rainfall and the maximum accumulated rainfall simu-
tify the impact of this process only over the area affected by       lated (343 mm) are similar to QPE (317 mm estimated). Else-
the HPE.                                                             where, the REF simulation generally overestimates rainfall,
                                                                     particularly over orography. These overestimations are sub-
                                                                     stantial north and east of the local maximum indicated by the
4   Validation of the REF simulation                                 black arrow (Fig. 6b) or over the Pyrenees mountains.
                                                                        Regarding the timing of rainfall (not shown), REF sim-
Since the initial conditions of REF are provided by the
                                                                     ulates longer rain than observed over the Aude department,
AROME analyses in which all conventional observations are
                                                                     particularly over its western part. The HPE begins at the same
assimilated, there is little deviation from these observations
                                                                     time as in observations, but the beginning of the second part
at the initial time. At 12:00 UTC on 14 October, comparison
                                                                     (around 05:00 UTC in REF) and the end of rainfall over the
of REF fields on all vertical levels to high-resolution sound-
                                                                     western part of the Aude department (around 10:00 UTC in
ings of Nîmes, Barcelona and Palma (not shown; see Fig. 1
                                                                     REF) are delayed by 3 h; this delay reduces to 1.5 h regarding
for the locations) reveal absolute bias (root mean square er-
                                                                     the end of rainfall over the entire Aude department (around
ror) of < 0.3 K (< 0.6 K) in temperature, < 0.3 g kg−1 (<
                                                                     10:30 UTC in REF).
0.8 g kg−1 ) in water vapour mixing ratio, < 0.5 m s−1 (<
                                                                        Regarding the location of the MSLP trough, at 00:00 UTC,
1.9 m s−1 ) in wind speed and < 7◦ (< 16◦ ) in wind direction.
                                                                     REF_SP (Fig. 7b) locates it slightly west compared to the
                                                                     SPWS analysis (Fig. 7a). Then, the trough remains quasi-

Weather Clim. Dynam., 2, 795–818, 2021                                                   https://doi.org/10.5194/wcd-2-795-2021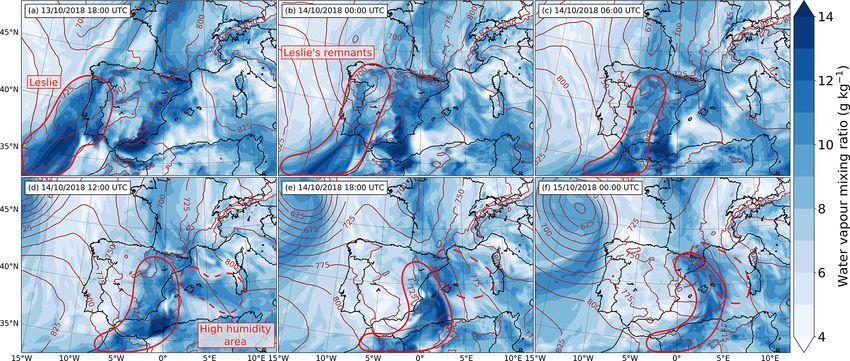
M. Mandement and O. Caumont: A numerical study of the 2018 Aude heavy-precipitation event                                            803

Figure 7. Mean sea level pressure on 15 October at (a–c) 00:00 UTC and (d–f) 07:00 UTC from (a, d) the SPWS analysis, (b, e) REF_SP
and (c, f) the REF simulation. Solid black lines indicate French departments and country borders. Dashed white lines indicate the approx-
imate location of the MSLP trough. Analyses are not computed over the Mediterranean Sea (in white) because of the lack of near-surface
observations over the sea.

Figure 8. Location of the 19 ◦ C virtual potential temperature (θv ) isotherm at 2 m height between 19:00 UTC on 14 October and 09:00 UTC
on 15 October from (a) the SPWS analysis, (b) REF_SP and (c) the REF simulation. Terrain elevations above 750 m a.s.l. are shaded in grey.
Red stars are as in Figs. 1 and 2.

stationary in REF_SP until about 07:00 UTC (Fig. 7e), which            westwards shift remains mostly below 10 km. Comparison
reveals a time lag of approximately 3 h in the movement of             between REF_SP and REF (Fig. 8b and c) shows some small-
the trough compared to the SPWS analysis.                              scale movements of CF1 simulated by REF that cannot be
   Regarding the movement of CF1, whose location is indi-              reproduced in REF_SP, indicating the magnitude of depar-
cated by the 19 ◦ C θv isotherm, REF_SP simulates a quasi-             tures that cannot be seized by the SPWS analyses and thus
stationarity that begins around 21:00 UTC (22:30 UTC in the            should not be considered to be substantial. This small west-
SPWS analysis) and ends around 07:00 UTC (04:00 UTC in                 ward shift is confirmed by the comparison of 10 m height
the SPWS analysis) according to Fig. 8a and b. Thus, CF1 is            REF wind fields with near-surface observations (not shown),
quasi-stationary approximately 4.5 h longer in REF than in             comparison which also reveals that inland, between CF1 and
analyses.                                                              the coast, REF slightly underestimates the wind speed and
   Regarding the location where CF1 remained quasi-                    simulates south-easterly instead of easterly wind directions
stationary, setting aside delays, REF_SP generally locates             in some places.
CF1 slightly farther west than the SPWS analyses, but the

https://doi.org/10.5194/wcd-2-795-2021                                                    Weather Clim. Dynam., 2, 795–818, 2021
804                     M. Mandement and O. Caumont: A numerical study of the 2018 Aude heavy-precipitation event

   Regarding θv gradient amplitude (not shown), at                or when a trajectory intersects the terrain along the projection
23:00 UTC, REF_SP simulates a similar amplitude as the            axis because the terrain along the axis differs substantially
SPWS analyses even if θv is 1 ◦ C higher in REF_SP than           from the one along the trajectory.
in analyses on both sides of CF1. Between 23:00 and
04:00 UTC, west of CF1, θv is simulated to decrease by less       5.1   First part of the HPE
than 1 ◦ C, while analyses indicate a decrease of 2 ◦ C, show-
ing little difference between simulation and observations.        This part lasts approximately between 19:00 UTC on 14 Oc-
   In summary, the REF simulation produces realistic near-        tober and 05:00 UTC on 15 October in the REF simu-
surface fields in comparison with the SPWS analyses and           lation. At 00:00 UTC on 15 October, air parcels below
scattered wind observations. The main differences are sub-        10 km a.s.l. found in the atmospheric column “D” (Fig. 9a)
stantial time lags in the stationarity of mesoscale boundaries:   where a convective updraught is simulated originate from
the MSLP trough and CF1 remain quasi-stationary between           3 preferential directions. Backward trajectories simulated at
3 and 4.5 h longer over the Aude department in the REF sim-       the end of this first part, e.g. at 04:00 UTC on 15 October
ulation than in the SPWS analyses. After 04:00 UTC, it re-        (not shown), are similar to 00:00 UTC backward trajectories,
sults in an approximately 3 h delay in the movement of these      showing that the latter are representative of this first part.
mesoscale boundaries in REF compared to analyses. This               Parcels found under 800 m a.s.l. in “D”, shown along the
longer stationary period probably causes prolonged rainfall       axis A–D, are inside the cold sector west of CF1, where
over the area that may explain some of the overestimations        virtual potential temperature is below 21 ◦ C (Fig. 9b). They
found. Also, the westerly shift of about 10 km found between      originate from the west, mainly the south-east of the Bay of
REF and the SPWS analyses in the quasi-stationary location        Biscay and the north of Spain, following the same trajectory
of CF1 or the MSLP trough is correlated with the similar          as CF1 (see Fig. 3c). They remain below 500 m a.s.l. most of
westerly shift found in the location of the heaviest precipita-   the time, and some are slightly lifted near the CF1 boundary.
tion between REF and the SPWS ANTILOPE QPE. Keeping                  Parcels found between 800 m a.s.l. and 7 km a.s.l. in “D”,
in mind these departures, the REF simulation is taken as the      shown along the axis B–D, are ascending air parcels
reference in the following sections.                              (Fig. 9c). These parcels originate from east and north-east of
                                                                  the Balearic Islands, over the Mediterranean Sea, away from
                                                                  the convective system ahead of CF2 located between the
5   Origin of the conditionally unstable air and lifting          Balearic Islands and the Pyrenees at 00:00 UTC (Fig. 10c).
    mechanisms                                                    They are carried over the Mediterranean Sea by the marine
                                                                  LLJ shown in Fig. 10b and remain at an almost constant alti-
This section investigates which mechanisms supply con-            tude between 0 and 1.4 km a.s.l. At 697 m height, the speed of
ditionally unstable air to the convective system, including       this south-easterly LLJ exceeds 20 m s−1 between the east of
studying whether its moisture comes from areas that are par-      the Balearic Islands and the Aude department, up to 26 m s−1
ticularly humidified by Leslie’s remnants. Trajectories and       near the Languedoc-Roussillon shore and inland. Such a
thermodynamic properties of air parcels that contribute to the    wind speed transports these air parcels quickly: they travel
formation of the strongest convective cells in the REF sim-       from B to D (Fig. 9a) in approximately 12 h. When they reach
ulation as well as those of cold parcels located west of CF1      the coast, some experience slight lifting over the Albera Mas-
are described. Lifting mechanisms are also studied, in partic-    sif and the Corbières Massif but remain below 2 km a.s.l.
ular the role of the Albera Massif. To carry out the investiga-   They are finally lifted up to 6.5 km a.s.l. above CF1. Over the
tion, a series of backward trajectories are computed using the    Aude department, large wind convergence is simulated: hor-
Lagrangian trajectory tool of Gheusi and Stein (2002). It is      izontal wind speed decreases from 26 m s−1 to near 0 m s−1 ,
based on the technique of Schär and Wernli (1993) in which        leading to enhanced ascending movements along CF1.
three Eulerian passive tracers are initialized with the initial      These 19 air parcels shown in Fig. 9c originate from moist
grid point position and are advected online by the resolved       areas over the Mediterranean Sea (dashed lines in Fig. 4b):
and subgrid-scale wind; a review of existing Lagrangian tra-      at 14:00 UTC on 14 October, they already have a mean wa-
jectory tools is given by Miltenberger et al. (2013). Starting    ter vapour mixing ratio of 9.1 g kg−1 (Table 1). Their mean
points of the backward trajectories constitute atmospheric        water vapour mixing ratio increases through their trans-
columns with strong mid-level updraughts close to the loca-       port above the Mediterranean Sea by 1.3 g kg−1 , reaching
tion of the 24 h maximum rainfall. Inside each column, 40 air     10.4 g kg−1 at 20:00 UTC on 14 October. During their lift-
parcels taken every two vertical levels of the model from the     ing, between 22:00 and 00:00 UTC, they release moisture:
second level (18 m height) to the 80th (about 13.5 km height)     their water vapour mixing ratio decreases by an average of
are followed, and their trajectories are shown in the figures.    4.0 g kg−1 . Some of this moisture is released through con-
Some trajectories (in grey in Fig. 9a) are not projected on       densation processes inside the convective clouds before some
vertical sections either when vertical movements of the air       of the water condensates eventually precipitate. The high
parcels are of small amplitude around the Aude department         moisture and relatively warm temperatures in the area of ori-

Weather Clim. Dynam., 2, 795–818, 2021                                                https://doi.org/10.5194/wcd-2-795-2021
M. Mandement and O. Caumont: A numerical study of the 2018 Aude heavy-precipitation event 805
Figure 9. (a) Horizontal projection of the 40 backward trajectories from air parcels taken inside the atmospheric column located in “D”
(43.25◦ N, 2.25◦ E) at 00:00 UTC on 15 October in the REF simulation. Trajectories in colour are the ones projected in (b–d): their colour
varies according to the water vapour mixing ratio of the parcels. Other trajectories are in grey. Trajectories are computed until 12:00 UTC on
14 October, except for parcels that reach domain boundaries before that time. (b–d) Vertical projections of backward trajectories along the
dashed black lines shown in (a) and corresponding cross-sections of virtual potential temperature at 00:00 UTC on 15 October. Each parcel
is projected on the section closest to its trajectory inland. Terrain is in black.
Table 1. Mean water vapour mixing ratio (g kg−1 ) of air parcels originating from below 1500 m height along axes shown in Figs. 9 and 12
as a function of time. Dashes indicate that at least one parcel was out of the simulated domain at that time.
Trajectory Axis Number Time (UTC)
end (UTC) of parcels 14:00 16:00 18:00 20:00 22:00 00:00 02:00 04:00 07:00
00:00 Fig. 9c: B → D 19 9.1 9.6 9.9 10.4 10.1 6.1
07:00 Fig. 12b: A → B 7 – – – – – 8.6 9.8 10.4 5.3
gin of these parcels is shown in Fig. 10a by equivalent poten- convective cells are triggered ahead of CF2. Several con-
tial temperatures above 326 K at 697 m height. Consequently, vective cells are advected by the south–south-easterly mid-
air parcels carried by the LLJ are conditionally unstable: level wind towards Languedoc-Roussillon. Thus, in Fig. 9d
simulated most unstable convective available potential en- some parcels above 7 km a.s.l., shown along the axis C–
ergy (MUCAPE) reaches 100 to 600 J kg−1 over Languedoc- D, originate from the Mediterranean low and its associated
Roussillon and 600 to 1200 J kg−1 over the sea. The 3D con- front CF2. These parcels, from altitudes between 1.8 and
vective available potential energy (CAPE) field (not shown) 5.5 km, have lower water vapour mixing ratios than parcels
indicates that the highest CAPE values are mostly reached at carried by the LLJ. Some of these parcels are lifted over the
the first model level (5 m height) and decrease rapidly with Pyrenees mountains, and one is lifted over CF1.
height. REF simulates a directional wind shear in the lower part
The MSLP low that drives the LLJ is located in the area of of the troposphere: inland, wind veers from east–south-east
light winds over Spain shown in Fig. 10b. North-east and east at 10 m height (not shown) to south-east at 697 m height
of it, between the Balearic Islands and the Pyrenees, strong (Fig. 10b) to south–south-east at 2957 m height (Fig. 10d).
https://doi.org/10.5194/wcd-2-795-2021 Weather Clim. Dynam., 2, 795–818, 2021806 M. Mandement and O. Caumont: A numerical study of the 2018 Aude heavy-precipitation event
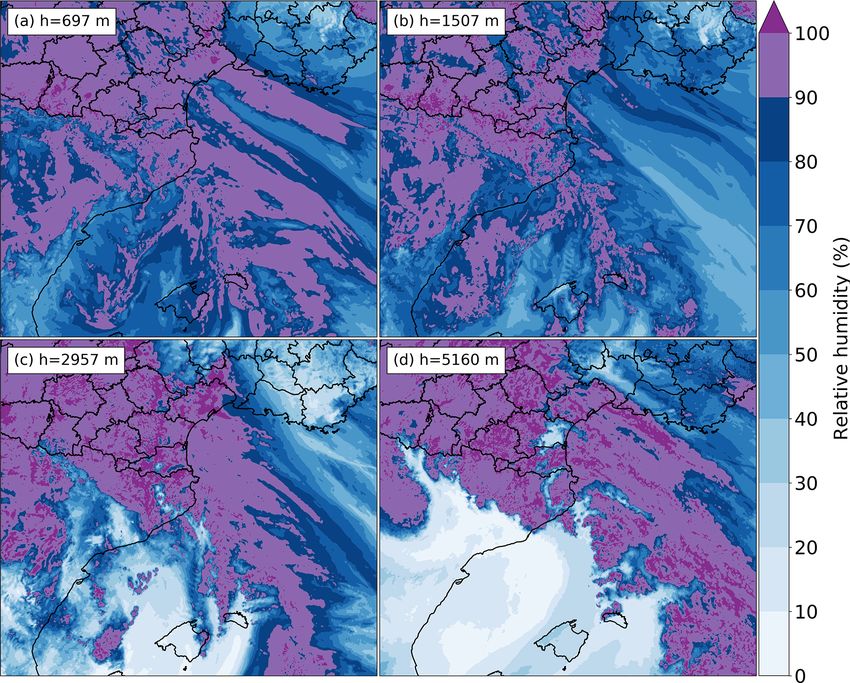
Figure 10. REF simulation at 00:00 UTC on 15 October of (a) equivalent potential temperature (θe ) at 697 m height, (b) wind at 697 m
height, (c) MUCAPE with instantaneous precipitation rate and (d) wind at 2957 m height.
Backward trajectories confirm it: the lower the air parcel port above the Mediterranean Sea by 1.8 g kg−1 (Table 1).
comes, the farther east it originates (Fig. 9a). Some descending dry air parcels are also found to originate
from dry mid-level areas located at the rear of CF2 (Fig. 12d).
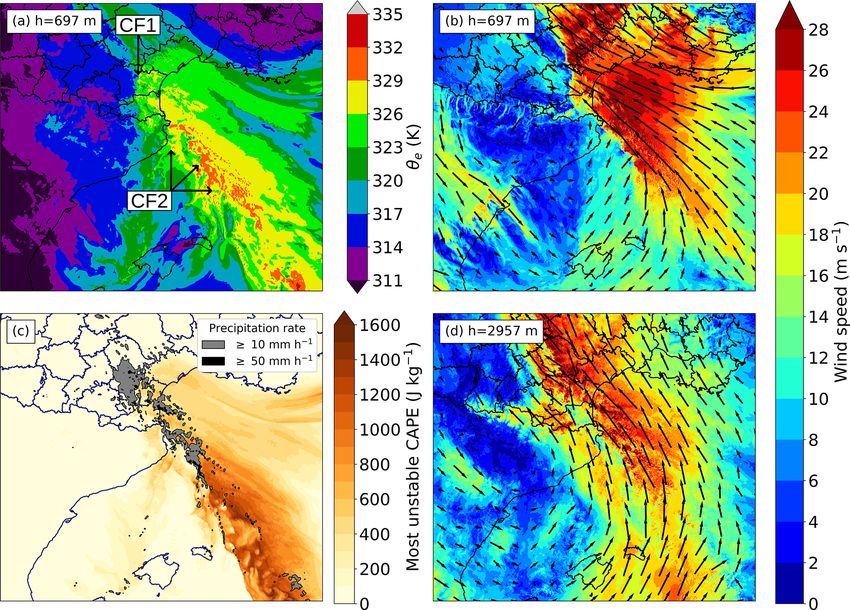
5.2 Second part and end of the HPE In the lower levels, at 697 m, REF simulates a strong wind
variation along CF2: ahead of CF2, the south-easterly LLJ
This part lasts approximately between 05:00 and 10:00 UTC reaches 22 to 26 m s−1 , while at the rear wind turns south-
on 15 October in the REF simulation and begins when the westerly and only reaches 6 to 12 m s−1 (Fig. 11b). Be-
rain band associated with the cold front CF2 reaches the tween 07:00 and 09:30 UTC, the north-eastwards advance
Pyrenees-Orientales coast. Contrary to the first part, dur- of CF2 propagates this wind variation over the Aude de-
ing which most convection is triggered inland, in this sec- partment (not shown). When wind speed abruptly decreases
ond part, convection is triggered over the Mediterranean Sea along CF1, CF1 stationarity breaks, and the cold air west of
(Fig. 11c) and carried inland by the mid-level wind (see wind CF1 immediately starts flowing eastwards in a similar man-
around 3 km height in Fig. 11d), diminishing the influence ner to a density current and later spreads out circularly over
of local forcing in triggering convection. Convection trig- the Mediterranean Sea (not shown). It indicates that, dur-
gered over the sea is fed by a warm and moist air mass ing the HPE, the propagation of the cold air located west
ahead of CF2 with equivalent potential temperature up to of CF1 is countered by the LLJ blowing perpendicularly to
332 K (Fig. 11a). Consequently, this air mass is more unsta- it, in a similar manner to the propagation of a cold pool be-
ble than in the first part: simulated MUCAPE values are up ing countered by the environmental wind (Miglietta and Ro-
to 1600 J kg−1 (Fig. 11c). tunno, 2014).
At 07:00 UTC an increasing number of air parcels found
inside updraughts over the Aude department originate from 5.3 Amount of moisture supplied by Leslie’s remnants
south of the Balearic Islands, i.e. from the front CF2 formed
with Leslie’s remnants (Fig. 12a), in comparison with the To quantify the amount of moisture brought over the Aude
first part. These parcels, projected in Fig. 12c, originate from department during the HPE by Leslie’s remnants, the geo-
altitudes between 1 and 4 km, altitudes generally higher than graphic origin of air parcels found in the atmospheric col-
in the first part. Some air parcels carried by the LLJ, coming umn above the 338 mm precipitation maximum simulated by
from the east of the domain at altitudes between 0 and 1 km, REF (see Fig. 6b; now referred to as C338 ) is tracked. Ev-
are still found (Fig. 12b). If their number decreases compared ery 30 min from 19:00 UTC on 14 October to 10:00 UTC on
to the first part, their average water vapour mixing ratio of 15 October (the time period of the HPE in the REF simula-
10.4 g kg−1 remains high and increases through their trans- tion), backward trajectories of 36 air parcels taken every two
Weather Clim. Dynam., 2, 795–818, 2021 https://doi.org/10.5194/wcd-2-795-2021M. Mandement and O. Caumont: A numerical study of the 2018 Aude heavy-precipitation event 807 Figure 11. As Fig. 10 at 07:00 UTC on 15 October. Figure 12. (a–d) As Fig. 9 for trajectories ending at 07:00 UTC on 15 October at 43.26◦ N, 2.34◦ E. Air parcels are projected along the same A–B axis but separated depending on their origin and behaviour: (b) ascending parcels from the east, (c) ascending parcels from the south or west, and (d) descending parcels from the south. https://doi.org/10.5194/wcd-2-795-2021 Weather Clim. Dynam., 2, 795–818, 2021
808                      M. Mandement and O. Caumont: A numerical study of the 2018 Aude heavy-precipitation event

Figure 13. Instantaneous precipitation rate at 05:00 UTC on 15 October superimposed on the terrain elevation of (a) REF and (b) NOALB
simulations.

Table 2. Properties and geographic origin of air parcels found in the atmospheric column C338 as a function of time, aggregated in time
intervals from 19:00 UTC on 14 October to 10:00 UTC on 15 October. Mean water vapour mixing ratio 2 h before reaching C338 (i.e. before
some parcels are lifted) is indicated by rv . Bold values indicate the highest number at each time interval.

  Initial parcel     Properties                                 Time interval (hours in UTC)                                  Total (%)
  location                          [19, 21[   [21, 23[   [23, 01[   [01, 03[     [03, 05[   [05, 07[   [07, 09[   [09, 10]
                     Number              76        67          76         70          75          52         25        30     471 (42 %)
  East of 4.5◦ E
                     rv (g kg−1 )      10.6        9.7        9.4        9.4          8.7        9.0       10.2        9.7    9.5 (54 %)
  West of 4.5◦ E –   Number              66        55         48          33          31         39          64        44     380 (34 %)
  south of 42◦ N     rv (g kg−1 )       2.6        1.7        3.7        4.6          4.8        4.9        4.7        4.1    3.7 (17 %)
                     Number               2         22         20         41           38         53         55        34     265 (24 %)
  Other
                     rv (g kg−1 )       9.6        9.9       10.2        9.6          9.3        8.9        8.9        8.4    9.2 (29 %)

vertical levels of the model between 18 m and about 10 km              event. This result suggests that air parcels originating from
height are computed until the beginning of the REF simula-             the Mediterranean Sea, east of the Balearic Islands, supply
tion. Here, parcels above 10 km height are not taken because           more moisture to convective cells than air parcels originating
most parcels followed above this height are not found inside           from Leslie’s remnants.
any updraught over the Aude department.
   The computation of backward trajectories provides the ini-          5.4      Lifting by the Albera Massif and effect on
tial parcel location: it is either its location at 12:00 UTC on                 precipitation
14 October or where the parcel enters the parent domain if
the parcel is out of the domain at that time. The geograph-            To understand the role of the Albera Massif in generating
ical origin is divided into three categories (Table 2): east of        convective bands downwind, as is observed and simulated
4.5◦ E; west of 4.5◦ E and south of 42◦ N, corresponding to            by REF, the simulations REF and NOALB are compared.
air parcels from Leslie’s remnants; and other. The “other”                Heavy precipitation is simulated by REF at 05:00 UTC
category includes mostly low-level cold and stable air parcels         over the highest slopes of the Albera Massif and along a line
located west of CF1 (Fig. 9b). Because these parcels are sta-          downstream of the massif (Fig. 13a, dashed red area). When
ble, only the first categories including conditionally unstable        the Albera Massif is removed in NOALB (Fig. 13b), no pre-
air parcels are compared.                                              cipitation is simulated over or downstream of it. Also, along
   Table 2 shows that 42 % of air parcels found in C338 orig-          the eastern Pyrenees, west of the dashed red line, a slightly
inate from east of 4.5◦ E, i.e. from east of the Balearic Is-          larger area of instantaneous precipitation above 10 mm h−1
land, and they carry 54 % of the water vapour mixing ratio             is found than in REF. Over and downstream of the Albera
of all air parcels tracked. In contrast, 34 % of air parcels           Massif, heavy precipitation in REF results from aligned con-
coming from Leslie’s remnants carry only 17 % of the wa-               vective cells exhibiting ascending vertical velocities above
ter vapour mixing ratio of all air parcels tracked, although           4 m s−1 (Fig. 14a), whereas no substantial ascending move-
their number increases particularly in the second part of the          ment is found along this line in NOALB (Fig. 14b). The

Weather Clim. Dynam., 2, 795–818, 2021                                                       https://doi.org/10.5194/wcd-2-795-2021
M. Mandement and O. Caumont: A numerical study of the 2018 Aude heavy-precipitation event 809
Figure 14. Vertical velocity (w) and horizontal wind streamlines at 2674 m height in the (a) REF and (b) NOALB simulations. Horizontal
wind (c) speed and direction and (d) convergence > 2 × 10⁻³ s−1 at 193 m height in the REF simulation at 05:00 UTC on 15 October.
orientation of the line of updraughts (along the A–B axis N = 9.9 × 10⁻³ s−1 and Nw = 8.9 × 10⁻³ s−1 , which gives
in Fig. 14a) is parallel to the horizontal wind streamlines F rm = 1.9 and F rw = 2.1. According to Kirshbaum et al.
at 2674 m height, showing that convective cells are aligned (2018), F rm = 1.9 > 1 indicates that the flow tends to di-
with the south–south-easterly mid-level wind direction. Su- rectly ascend the terrain over the windward slope instead of
perimposed with this line of updraughts, lee waves resulting being deflected around the obstacle. This ascent mechani-
in quasi-stationary, evenly spaced couplets of positive and cally lifts the conditionally unstable air parcels supplied by
negative vertical velocities are simulated by REF (Fig. 14a, the LLJ but also likely triggers the aforementioned lee waves.
large black arrows) but are not found in NOALB (Fig. 14b). F rw = 2.1 corresponds to the flow regime IV of Chen and
To quantify the flow regime of the situation at 05:00 UTC Lin (2005), described as a flow with an orographic strat-
U
on 15 October, the mountain Froude number F rm = Nh (Kir- iform precipitation system over the mountain and possibly
shbaum et al., 2018) is estimated, where U is the mean a downstream-propagating cloud system (a stratiform cloud
wind speed of the layer, N is the Brunt–Väisälä frequency, is defined by the authors as having a cloud depth less than
and h is the mountain height. Here h = 1128 m, the max- 4 km).
imum height of the Albera Massif in the model. To com- To closely look at how convective cells are initiated and
pute N, the bulk method described by Reinecke and Dur- maintained, a time evolution of the vertical cross-section A–
ran (2008) is used considering a single layer which
q has ap- B simulated by REF is shown in Fig. 15. At 05:05 UTC, a
g θ(25) −θ(1) convective cell containing hydrometeors is formed above the
proximately the height of the mountain: N = θ h ,
Albera Massif (Fig. 15a, black arrow). Inside this cell, the
where g = 9.81 m s−2 is the standard acceleration of grav- potential temperature is higher than the environment around
ity, θ(n) is the potential temperature at model level n (1st 2 km height probably due to latent heat release associated
level is at 5 m height, and the 25th is at 1143 m height), and with water phase changes. This cell is advected towards B by
θ is the mean potential temperature over the layer. The moist the mid-level wind. A second cell is initiated at the rear of the
Froude number F rw = NUw h (Chen and Lin, 2005) is also first one by orographic lifting, and the surface of hydrome-
computed, where Nw is the moist Brunt–Väisälä frequency teor mixing ratio above 1 g kg−1 rapidly increases (Fig. 15b,
that differs from N because θ is replaced by θv . The compu- brown arrow). On the lee side of the mountain, these convec-
tation of U , N and Nw is an average over 100 grid points tive cells propagate in the middle of a large subsidence area
located upwind of the mountain, precisely the grid points (related to the aforementioned lee wave). Subsidence appears
less than 10 km east and 10 km south of grid point A (A is counteracted by a quasi-stationary wind convergence zone
shown in Fig. 14a). Computation leads to U = 21.3 m s−1 , located near the ground, which connects with the updraughts
https://doi.org/10.5194/wcd-2-795-2021 Weather Clim. Dynam., 2, 795–818, 2021810 M. Mandement and O. Caumont: A numerical study of the 2018 Aude heavy-precipitation event
Figure 15. Vertical velocity (w; m s−1 ), potential temperature (black contours; ◦ C), horizontal convergence > 2 × 10⁻³ s−1 (black diagonal
hatches) and hydrometeor mixing ratio > 1 g kg−1 (little black dots) between 05:05 and 05:15 UTC on 15 October. Terrain is in black.
and invigorates them. This wind convergence zone is simu- precipitation over plains is reduced from 338 mm in REF to
lated downwind of the mountain (Fig. 14d) and seems to be 310 mm in NOALB, and the maximum in NOALB (332 mm)
due to rapid wind decrease and some wind confluence on the is shifted over mountains. Concomitantly, precipitation is en-
lee side of the Albera Massif (Fig. 14c). Then, as shown by hanced along the western band downstream of the eastern
Fig. 15d and e, both cells connect with an ascending zone of slopes of the Pyrenees: maximum precipitation is increased
the lee wave around 20 km along the axis A–B and rapidly from 296 to 327 mm in NOALB compared to REF. Precipi-
grow: the hydrometeor mixing ratio surface above 1 g kg−1 tation is also enhanced between both bands, along the quasi-
and the vertical velocity are found to rapidly increase inside stationary CF1. Consequently, the south-east–north-west ori-
both cells. These findings are consistent with the descrip- entation of the precipitation zone exceeding 240 mm in REF
tion of the flow regime IV of Chen and Lin (2005): verti- is replaced by a south–north orientation in NOALB.
cal velocities above 1 m s−1 and hydrometeor mixing ratios This sensitivity experiment shows the large importance of
above 1 g kg−1 remain below 4 km a.s.l. over the mountain, the Albera Massif in the shape of the precipitation field, fo-
and convective cells propagate downstream of the mountain. cusing precipitation downstream of it while reducing precip-
Once convective cells are on the lee side of the mountain, itation elsewhere. The proposed mechanism describing con-
as they are advected by the south–south-easterly mid-level vection initiation over the Albera Massif – first relief inter-
wind (Fig. 14a), the south-easterly LLJ (Fig. 14c) supplies cepting the marine LLJ – and the convective cell maintenance
conditionally unstable air parcels that do not cross the Albera downstream of the Albera Massif may be applied to simi-
Massif to the cells from their south-eastern flank. Backward lar reliefs. Additional simulations (not shown) in which the
trajectories starting from their updraughts (not shown) indi- Corbières Massif and the eastern slopes of the Pyrenees are
cate that the number of low-level moist air parcels that do not successively flattened show a substantial decrease in maxi-
cross the Albera Massif found inside the cells increases as mum accumulated precipitation downstream of these peaks,
they are advected. This slight directional vertical wind shear associated with a spread of precipitation above 200 mm over
simulated in the lower part of the troposphere possibly ex- a larger area along the quasi-stationary front.
plains the maintenance of the convective cells long after they
are formed.
This preferential organization of convection along a line 6 Influence of the cooling associated with the
downstream of the Albera Massif results in substantial de- evaporation of precipitation
partures in 24 h rainfall accumulations between NOALB and
REF (Figs. 6b and d). Precipitation along the eastern band This section investigates the possible influence of the cool-
(see Sect. 2), downstream of the Albera Massif, is reduced by ing associated with the evaporation of precipitation over the
as much as 100 mm in NOALB compared to REF. Maximum Aude department on CF1. The following questions are ad-
dressed. Does this process (i) modify the location of CF1,
Weather Clim. Dynam., 2, 795–818, 2021 https://doi.org/10.5194/wcd-2-795-2021You can also read


