Multi-step vs. single-step resistance evolution under different drugs, pharmacokinetics, and treatment regimens
←
→
Page content transcription
If your browser does not render page correctly, please read the page content below
RESEARCH ARTICLE

                                    Multi-step vs. single-step resistance
                                    evolution under different drugs,
                                    pharmacokinetics, and treatment
                                    regimens
                                    Claudia Igler1*, Jens Rolff2, Roland Regoes1*
                                    1
                                     Institute of Integrative Biology, ETH Zurich, Zurich, Switzerland; 2Evolutionary
                                    Biology, Institute for Biology, Freie Universität Berlin, Berlin, Germany

                                    Abstract The success of antimicrobial treatment is threatened by the evolution of drug
                                    resistance. Population genetic models are an important tool in mitigating that threat. However,
                                    most such models consider resistance emergence via a single mutational step. Here, we assembled
                                    experimental evidence that drug resistance evolution follows two patterns: (i) a single mutation,
                                    which provides a large resistance benefit, or (ii) multiple mutations, each conferring a small benefit,
                                    which combine to yield high-level resistance. Using stochastic modeling, we then investigated the
                                    consequences of these two patterns for treatment failure and population diversity under various
                                    treatments. We find that resistance evolution is substantially limited if more than two mutations are
                                    required and that the extent of this limitation depends on the combination of drug type and
                                    pharmacokinetic profile. Further, if multiple mutations are necessary, adaptive treatment, which
                                    only suppresses the bacterial population, delays treatment failure due to resistance for a longer
                                    time than aggressive treatment, which aims at eradication.

*For correspondence:
claudia.igler@env.ethz.ch (CI);
                                    Introduction
roland.regoes@env.ethz.ch (RR)      The rapid rise and spread of antimicrobial resistance severely curb the efficacy of drug treatments
                                    against pathogen infections. Treatment strategies are designed to maximize efficacy and limit toxic-
Competing interests: The
                                    ity, but their long-term applicability depends on the risk of resistance evolution (Nielsen and Fri-
authors declare that no
                                    berg, 2013; Foo and Michor, 2009; Bonhoeffer et al., 1997). This highlights the importance of
competing interests exist.
                                    careful consideration of drug type, dose, and duration to guarantee the desired patient outcome
Funding: See page 20                whilst also reducing the risk of resistance evolution (Nielsen and Friberg, 2013; Drusano, 2004). In
Received: 18 October 2020           order to prevent drug resistance and preserve drug efficacy, treatment strategies should also be
Accepted: 04 May 2021               guided by an understanding of resistance evolution and the ability to assess its risk
Published: 18 May 2021              (Andersson et al., 2020; Read et al., 2011) – a task that is substantially facilitated through mathe-
                                    matical modeling (Nielsen and Friberg, 2013; Andersson et al., 2020; Read et al., 2011;
Reviewing editor: Ben S
Cooper, Mahidol University,
                                    Clarelli et al., 2020).
Thailand                                The main class of models used to predict drug action and treatment outcome are pharmacoki-
                                    netic and pharmacodynamic (PKPD) models (Clarelli et al., 2020; Drlica, 2003; Abel Zur Wiesch
   Copyright Igler et al. This
                                    et al., 2017; Chakrabarti and Michor, 2017), which describe the change in drug concentration over
article is distributed under the
                                    time (PKs) and the corresponding effect on a pathogen population (PDs). PKPD approaches are
terms of the Creative Commons
Attribution License, which          most commonly employed to study the efficacy of treatment without considering the possibility of
permits unrestricted use and        resistance evolution, but coupled with bacterial population models, they can be used to investigate
redistribution provided that the    drug resistance evolution over time (Yu et al., 2018).
original author and source are          One severely understudied aspect in such approaches is that there are two fundamentally differ-
credited.                           ent patterns of de novo antibiotic (AB) resistance evolution: (i) ‘single-step’ resistance: a single

Igler et al. eLife 2021;10:e64116. DOI: https://doi.org/10.7554/eLife.64116                                                         1 of 24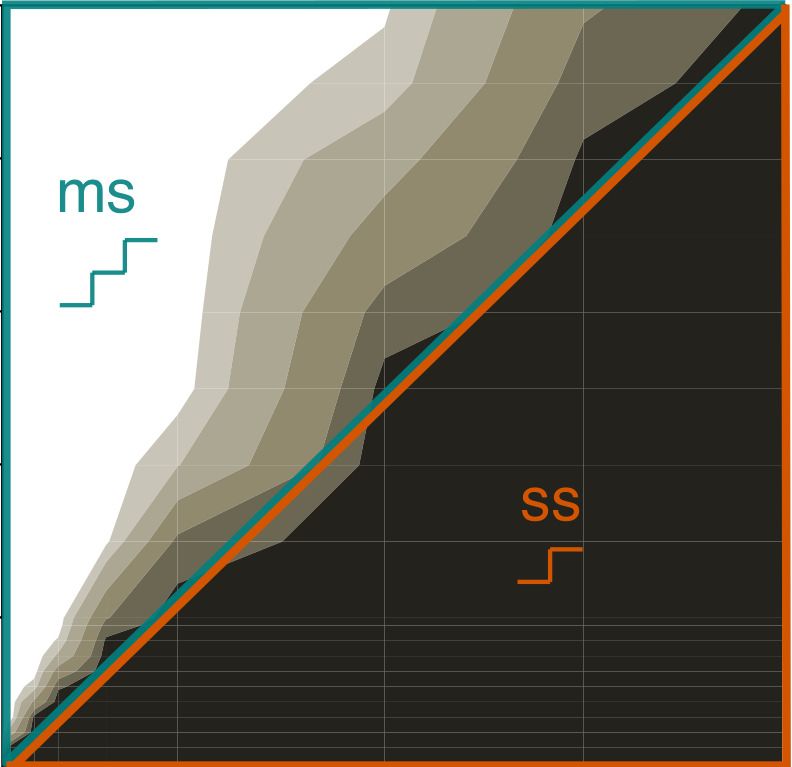
Research article                                                                                               Evolutionary Biology

                                    eLife digest The rise in antibiotic resistance is threatening our ability to treat bacterial
                                    infections. Bacteria often evolve resistance by acquiring new genetic mutations during the treatment
                                    period. Understanding how resistance emerges and spreads through a bacterial population is crucial
                                    to prevent antibiotic drugs from failing.
                                        Mathematical models are a useful tool for exploring how bacteria will respond to antibiotics and
                                    assessing the risk of resistance. Usually, these models only consider instances where bacteria acquire
                                    one genetic mutation that makes them virtually impervious to treatment. But, in nature, this is not
                                    the only possibility. Although some mutations do give bacteria a high level of resistance, numerous
                                    others only provide small amounts of protection against the drug. If these mutations accumulate in
                                    the same bacterial cell, their effects can combine to make the strain highly resistant to treatment.
                                    But it was unclear how the emergence of multiple mutations affects the risk of treatment failure and
                                    the diversity of the bacterial population.
                                        To answer this question, Igler et al. devised a mathematical model in which each bacterium is
                                    able to mutate multiple times during the treatment period. The model revealed that if one mutation
                                    provides a high level of resistance on its own, the risk of bacteria surviving treatment is very high.
                                    But, if it takes more than two mutations to achieve a high level of resistance, the risk drops to almost
                                    nothing.
                                        Igler et al. also found that the chance of bacteria evolving high enough resistance is affected by
                                    the type of antibiotics used and how fast the drug decays. With low-level resistance mutations,
                                    adapting treatment to maintain an acceptable number of sensitive bacteria as competitors for (a
                                    small number of) resistant bacteria was more effective at delaying treatment failure than trying to kill
                                    all the bacteria at once.
                                        These findings suggest that adjusting the treatment strategy used for bacterial infections
                                    according to the proportion of low- and high-level resistance mutations could slow down the
                                    evolution of resistance. To apply these models in the real world, it will be important to measure the
                                    level of resistance conferred by single mutations. The type of models used here could also predict
                                    the response of other diseases that resist treatment, such as cancer.

                                    mutation provides high drug resistance (Nielsen and Friberg, 2013; Drlica, 2003; Yu et al., 2018);
                                    or (ii) ‘multi-step’ resistance: the accumulation of several mutations of low individual benefit is neces-
                                    sary for high-level resistance (where high resistance here means higher than a given treatment dose).
                                    The availability of either pattern to a pathogen population under drug selection will affect the poten-
                                    tial for resistance evolution and therefore the evolutionary dynamics in response to various treatment
                                    strategies.
                                        We focus on resistance by de novo mutations as long-lasting infections such as those caused by
                                    Pseudomonas aeruginosa become hard to treat due to resistance evolving via mutations within the
                                    host during the course of the treatment (Oliver et al., 2000). Another example is tuberculosis (TB),
                                    arguably the infectious disease that has caused the highest number of deaths globally (Castro et al.,
                                    2020). During persistent TB infections, drug resistance evolves by chromosomal mutations while
                                    resistance by horizontal gene transfer (HGT) has not been observed (Castro et al., 2020). HGT is a
                                    common path to resistance in hospital-acquired infections and in cases of shorter treatment dura-
                                    tions, as exemplified by Staphylococcus epidermidis infections that became resistant by acquiring
                                    plasmids carrying genes for linezolid resistance (Dortet et al., 2018).
                                        In this study, we will comprehensively study the influence of the mechanistic pattern of resistance
                                    evolution itself (namely the benefits and costs of mutations) by considering ‘single-step’ resistance
                                    vs. ‘multi-step’ resistance. The emergence of mutations and their selection depend on an interplay
                                    between various treatment factors like drug type, dose, and treatment duration. These factors have
                                    been studied before to various extent in isolation (Nielsen and Friberg, 2013; Drusano, 2004),
                                    although rarely how their interactions shape resistance evolution (Martinez et al., 2012;
                                    Olofsson and Cars, 2007). We will first establish the existence of single-step and multi-step resis-
                                    tance patterns by reviewing evidence in the experimental literature, and then use the obtained

Igler et al. eLife 2021;10:e64116. DOI: https://doi.org/10.7554/eLife.64116                                                            2 of 24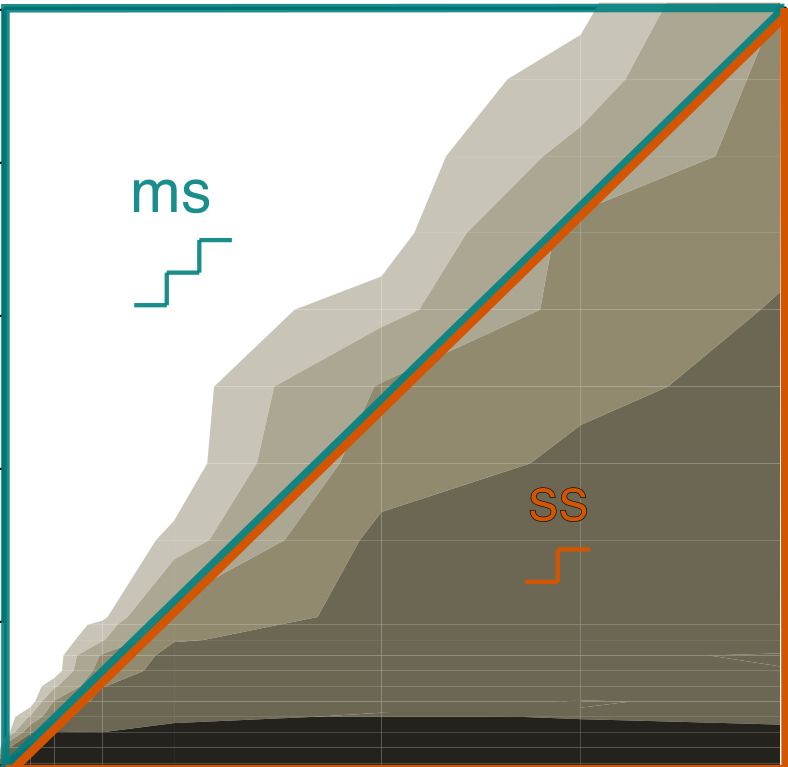
Research article                                                                                               Evolutionary Biology

                                    parameter values to inform a stochastic PKPD model of multi-step resistance evolution, which we
                                    will explore under various treatment regimens.
                                       We will establish the fundamental differences between evolutionary dynamics emerging from
                                    these two patterns in one specific treatment setting, but also explore the impact of various clinically
                                    relevant treatment strategies. First, we will compare two types of drugs, ABs and antimicrobial pep-
                                    tides (AMPs). AMPs are key components of innate defenses but also important new antimicrobial
                                    drugs, which work by disrupting the bacterial membrane (Zasloff, 2002; Mookherjee et al., 2020) –
                                    as opposed to ABs, which usually target intracellular structures. AMPs have been found previously to
                                    significantly reduce the risk of resistance evolution compared to conventional ABs (Yu et al., 2018;
                                    Lazzaro et al., 2020), partly explained by their distinct PDs like higher killing rates (Yu et al., 2018).
                                    Second, we will consider three different shapes of drug PKs, which are all clinically relevant
                                    (Nielsen and Friberg, 2013), but have rarely been compared in a systematic manner
                                    (Chakrabarti and Michor, 2017; Foo et al., 2012). These comprise fluctuating drug concentrations,
                                    increasing concentrations (which are then maintained at the highest level), and finally constant (which
                                    can be achieved in high-dose IV (intravenous) interventions). Third, as a number of recent studies
                                    have questioned the practice of ‘radical pathogen elimination’ (Read et al., 2011; Hansen et al.,
                                    2017; Hansen et al., 2020), we will compare aggressive elimination treatment with adaptive sup-
                                    pression – a strategy where the drug concentration is regularly adapted to the pathogen load – in a
                                    multi-step mutational framework (Hansen et al., 2017; Gatenby et al., 2009). Lastly, depending on
                                    the drug type, resistance evolution can be shaped either by chromosomal mutations or HGT, or
                                    both (van Hoek et al., 2011; Woodford and Ellington, 2007). Assuming a scenario where both
                                    options are available, we will study the relative importance of resistance resulting from de novo
                                    mutations as compared to HGT, which plays an important role in AB resistance evolution (van Hoek
                                    et al., 2011), although likely not as much in AMP resistance (Kintses et al., 2019). Taken together,
                                    this allows us to obtain an empirically informed modeling framework, which predicts evolutionary
                                    dynamics of ‘single-step’ resistance vs. ‘multi-step’ resistance in the context of drug type, PKs, and
                                    treatment strategies. We show how this framework provides critical insights into drug resistance
                                    emergence in clinically relevant treatment settings.

                                    Results
                                    Antibiotic resistance evolves via multiple low- or single high-benefit
                                    mutation(s)
                                    Experimental studies document single target mutations as well as a sequence of mutational steps to
                                    drug resistance evolution in bacterial populations (Spohn et al., 2019; Chevereau et al., 2015;
                                    Melnyk et al., 2015; Lofton et al., 2013; Makarova et al., 2018; Kubicek-Sutherland et al., 2017),
                                    but no systematic review of these patterns has been conducted so far. Here, we only selected stud-
                                    ies that report on both parameters, benefit and costs of resistance (see Materials and methods)
                                    (Spohn et al., 2019; Chevereau et al., 2015; Melnyk et al., 2015; Lofton et al., 2013;
                                    Makarova et al., 2018; Kubicek-Sutherland et al., 2017), in order to obtain a complete picture of
                                    the mutational effects. We define the benefit and cost of a mutation as an increase in the minimum
                                    inhibitory concentration (MIC) and as a reduction in growth (in the absence of drug), respectively.
                                    Despite differences in study setup and type of resistance mutations, we clearly found a wide range
                                    of effects, with a large number of benefits below typical clinical MIC breakpoint values (defining
                                    whether a bacterial strain is resistant), which are often 10xMIC or higher (EUCAST, 2020; Table 1,
                                    Figure 1) – hence likely necessitating multiple mutations for high resistance. The corresponding fit-
                                    ness costs range from almost none to a 25% reduction of the population growth rate and show a
                                    very weak positive correlation (R2 = 0.07, p=0.09) with (log) benefit over all studies taken together
                                    (Figure 1B, Figure 1—figure supplement 1). In general, mutations seem likely to incur more costs
                                    than benefits. Notably, our literature search suggests a difference in mutational benefit available for
                                    two different antimicrobials: the average benefit of resistance mutations to AMPs is substantially
                                    lower than for commonly used ABs (Table 1, Figure 1—figure supplement 1). In the following, we
                                    use the correlation observed with these assembled benefit and cost values to inform a PKPD model
                                    that reflects the two patterns of resistance evolution.

Igler et al. eLife 2021;10:e64116. DOI: https://doi.org/10.7554/eLife.64116                                                            3 of 24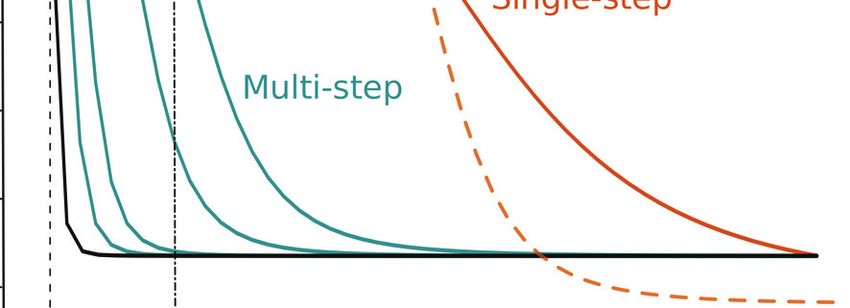
Research article                                                                                                           Evolutionary Biology

Table 1. Benefits and costs of drug resistance mutations from experimental studies reported for antibiotics (ABs) and antimicrobial
peptides (AMPs), with small mutational benefits (likely giving rise to multi-step resistance patterns) given in blue and large ones
(likely giving rise to single-step resistance patterns) in red, assuming a typical clinical drug dose of about 10 minimum inhibitory
concentration (MIC) (Figure 1A, B).
                             Organism and                                Benefit per             Cost per
                        Drug evolution                   Number and type mutational              mutation         Benefit             Fitness
Source                  type environment                 of mutations    event                   event            measurement         measurement
Spohn et al., 2019      AMP   Escherichia coli K-12      197 independent      All MIC samples: 0.2 (±0.16)        Serial broth (MS)    Continuous
(benefits and costs           BW25113 populations        mutational events    5.1 (±7.2) xMIC  ~=0.04/            dilution medium;    monitoring of optical
calculated for                were evolved in            (deletions,          ~=1 xMIC/        mutation           MIC was defined     density of liquid
individual AB classes         minimal salt (MS)          insertions, SNPs     mutation                            as OD600 < 0.05     cultures (in MS); area
are given in                  medium over 20             (Single nucleotide   Only the ones                       fold-increase       under the growth
Figure 1—source               transfers every 72 hr      polymorphisms),      where costs were                    compared to         curve from 1 to 24 hr,
data 1)                       at 30˚C (~120              and intergenic       measured as                         ancestor            normalized by the
                              generations) with          mutations)           well:                                                   wildtype (WT)
                              successively               ~5.2 (±0.8)          31.4 (±8.5) xMIC
                              increasing dosages of      mutational events/   ~=6.0 xMIC/
                              the antimicrobial          genome               mutation
                        AB                               N.D.                 All MIC samples: 0.47 (±0.29)
                                                         Assumed: ~5          72.0 (±2.8) xMIC ~=0.1/mutation
                                                                              ~=14.4 xMIC/
                                                                              mutation
                                                                              Only the ones
                                                                              where costs were
                                                                              measured as
                                                                              well:
                                                                              120.0 (±2.8) xMIC
                                                                              ~=24.0 xMIC/
                                                                              mutation
Melnyk et al., 2015 AB        Borrelia burgdorferi,  Single mutational 96.4 (±19.8) xMIC 0.13 (±0.24)             MIC fold-increase Competitive fitness
(benefits and costs           Campylobacter jejuni, events (in total 128                                          to ancestor       (via in vitro growth
calculated for                E. coli, Enterococcus mutations)                                                                      assays with WT)
individual AB classes         faecium,
are given in                  Mycobacterium
Figure 1—source               smegmatis,
data 1) (and                  Mycobacterium
references therein:           tuberculosis,
synthesis of 24 studies)      Staphylococcus
                              aureus, Streptococcus
                              pneumonia (all
                              pathogenic) in various
                              environments
Chevereau et al.,       AB    E. coli K-12 BW25113       Single-gene          Mecillinam: 1.2    0.13 (±0.07)     IC50 (in LB)        Reduction in growth
2015                          knockout strains (Keio     deletions (3913      (±1.1) xIC50       N.D.                                 rate (in LB); calculated
                              collection) were           mutant strains)      Trimethoprim:                                           from a linear fit of log
                              incubated at 30˚C for      ~4 mutations, all    1.2 (±1) xIC50                                          (OD) in the range
                              20 hr in rich media (LB)   types (day 10)       Ciprofloxacin:                                          0.022 < OD < 0.22;
                              with various ABs                                1.3 (±1.2) xIC50                                        given relative to WT
                                                                              ~18.7 (±1.1) xIC50
Lofton et al., 2013     AMP   Salmonella                 SNPs and             LL-37: 1.5–6       0.076 (±1.1)     MIC through         Growth rate from
                              typhimurium LT2 was        deletions            xMIC               ~=0.025–0.038/   serial broth        OD600
                              passaged daily in rich     2–3 mutational       ~=0.5–3 xMIC/      mutation         (refined LB)        measurements (in
                              media (refined LB) at      events               mutation           0.11             dilution            refined LB) in the
                              37˚C with successively                          WGH: 12–48         ~=0.037–0.055/                       range 0.02 < OD <
                              increasing AMP                                  xMIC               mutation                             0.2; given relative to
                              concentrations for                              ~=4–24 xMIC/       0.17                                 WT
                              400–500 generations                             mutation           ~=0.057–0.085/
                                                                              CNY100HL: 2–6      mutation
                                                                              xMIC
                                                                              ~=1–3 xMIC/
                                                                              mutation
Table 1 continued on next page

Igler et al. eLife 2021;10:e64116. DOI: https://doi.org/10.7554/eLife.64116                                                                           4 of 24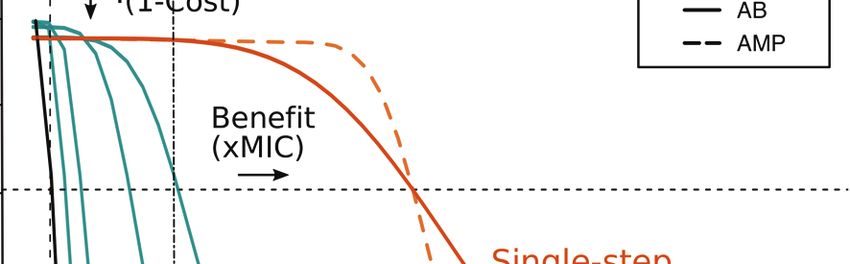
Research article                                                                                                            Evolutionary Biology
Table 1 continued
                            Organism and                              Benefit per               Cost per
                       Drug evolution                 Number and type mutational                mutation          Benefit              Fitness
Source                 type environment               of mutations    event                     event             measurement          measurement
Kubicek-               AMP    S. aureus (MRSA) WT 1–3 (adaptive)          LL-37: 6.5 (±6.2)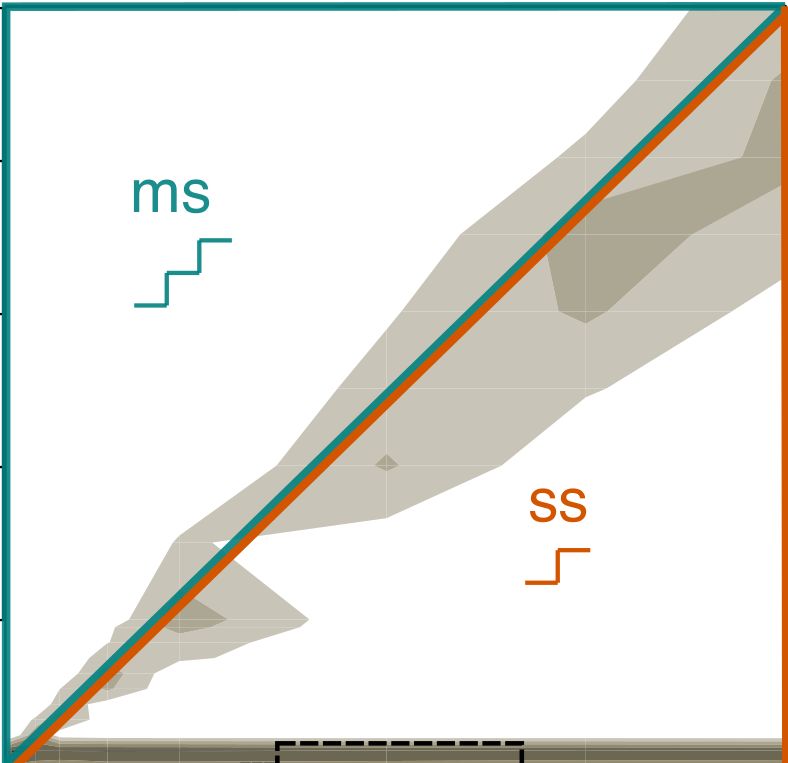
Research article Evolutionary Biology
A B
0.3
Antimicrobial
ax (1-Cost)
m
Cost
0.2
Benefit
0.1
(xMIC)
Net growth
0
0.0
0 2 4 6
Log(Benefit) per mutation
B
m
in A C r(1-c)i r(1-c)i+1
P
M
in A
m Mi Mi+1
1 10 20 30 40 50 i(bi) i+1(bi+1)
Drug dose (xMIC)
Figure 1. Pharmacodynamic (PD) model of single- and multi-step resistance. (A) The PD curve relating bacterial net growth (which is between the
maximal growth rate max and the maximal killing rate min ) to antimicrobial drug concentration (given in fold minimum inhibitory concentration (MIC))
illustrating a sensitive wildtype (black) and mutants with either small (blue) or large (orange) MIC increases per mutation (benefit), assuming a typical
clinical drug dose of 10xMIC. Characteristic PD curves for antibiotic (AB) (solid lines) and antimicrobial peptide (AMP) (dashed lines) single-step
resistance are compared (orange), demonstrating the typically steeper decrease (k) and lower min observed with AMPs. (B) Shown are costs and
benefits from various empirical studies (Table 1), each dot representing resistance mutations to a specific AB or AMP class. The cost of a mutation
shows a very weak positive correlation with the log (benefit) (R2 = 0.07, p=0.09). Blue and orange colors show multi- or single-step resistance benefits
given the drug dose in (A). (C) Schematic of the PD model with several mutated subpopulations (Mi ), which grow with a cost r(1-c)i, determined by the
number of mutations i, mutate with rate m, and die at a constant rate g and a drug-specific rate g i ðbi Þ, which is dependent on the benefit bi conferred
per mutation.
The online version of this article includes the following source data and figure supplement(s) for figure 1:
Source data 1. Empirical data used to obtain Figure 1B.
Figure supplement 1. Direct comparison of mutational benefits and costs between antimicrobial peptides (AMPs) and antibiotics (ABs) from
Spohn et al., 2019.
Figure supplement 2. Number of mutations necessary for resistance.
pathogen population initially consists of completely susceptible bacteria and defined a treatment as
failed if the pathogen population was not eradicated after 200 hr. We found that the probability of
treatment failure was always close to 1 for single-step resistance evolution, but decreased rapidly if
multiple mutations were required. Notably, already if three mutations were necessary to overcome
the applied dose, the probability of pathogen survival approached 0 (Figure 2A, Figure 1—figure
supplement 2). The qualitative picture of these results was not dependent on the specific cost-bene-
fit correlation that we are assuming for most of our simulations (Figure 2—figure supplement 1).
One aspect of resistance evolution that is especially important when considering multiple muta-
tions is the mutational diversity that arises in the pathogen population: high genetic diversity (here
meaning diversity in the resistance phenotype) increases the probability that some individuals will be
able to survive a given environment – such as treatment with other drugs (Castro et al., 2020) – and
increases the adaptive potential overall (Van Egeren et al., 2018). Using the Shannon index to
determine the highest mutational diversity obtained in the population over the treatment period, we
clearly observed higher diversity with single-step than multi-step resistance evolution (Figure 2B),
even if we increased the mutation rate proportionally to the number of mutations required
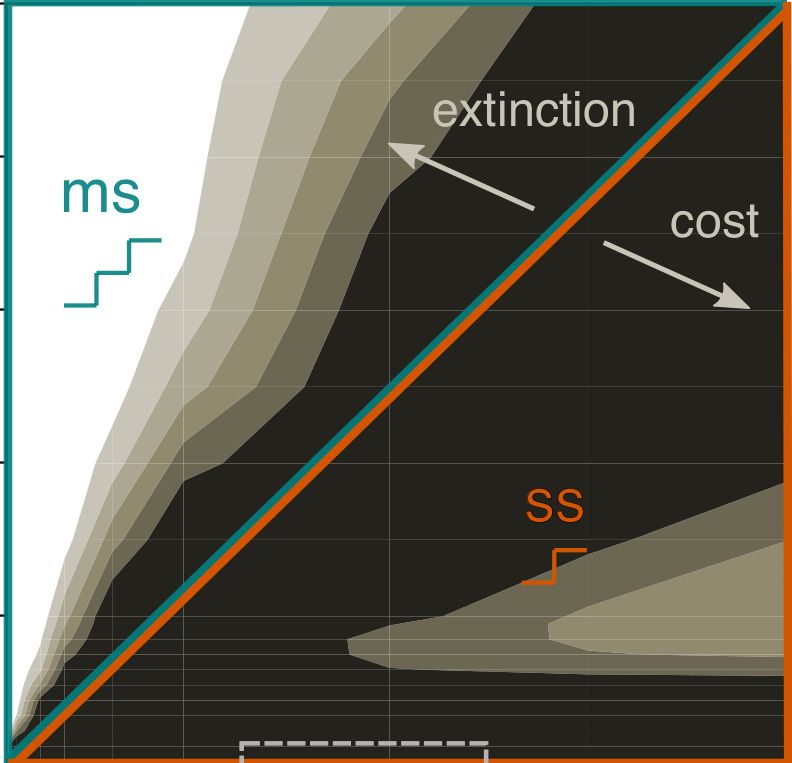
Igler et al. eLife 2021;10:e64116. DOI: https://doi.org/10.7554/eLife.64116 6 of 24Research article Evolutionary Biology Figure 2. Resistance evolution with single- and multi-step patterns for peak pharmacokinetic (PK). (A) Treatment failure probability (measured at the end of the treatment period) and (B) mutational diversity (calculated over the whole treatment period) are shown for two different antimicrobial classes (antibiotics (ABs), left; antimicrobial peptides (AMPs), right) for different combinations of mutational benefits (xMIC) and drug doses (xMIC). The diagonal line shows where the benefit per mutation is exactly equal to the given drug dose and separates single-step (ss, lower orange triangle), where one mutation gives a benefit higher than the applied dose, from multi-step (ms, upper blue triangle) resistance, where more than one mutation is needed for the accumulated benefit to match the drug dose. The arrows indicate the decrease in diversity either due to increasing extinction (too many mutations are needed for survival) or due to increasing cost per mutation (costs are too high compared to the additional benefit). A representative example of subMIC mutational diversity is shown magnified below the plots in (B). MIC: minimum inhibitory concentration. The online version of this article includes the following figure supplement(s) for figure 2: Figure supplement 1. Resistance evolution with single- and multi-step patterns for peak pharmacokinetic (PK) with steeper correlation between cost and log(benefit). Figure supplement 2. Resistance evolution with increased mutation rates (proportional to the number of mutations required for resistance). Figure supplement 3. Relative population frequencies with horizontal gene transfer (HGT). Figure supplement 4. Treatment failure is similar with and without horizontal gene transfer (HGT). Figure supplement 5. Resistance evolution with random mutational benefit and cost. Figure 2 continued on next page Igler et al. eLife 2021;10:e64116. DOI: https://doi.org/10.7554/eLife.64116 7 of 24
Research article                                                                                                       Evolutionary Biology

Figure 2 continued
Figure supplement 6. Resistance evolution with single-step (ss) and multi-step (ms) patterns for peak pharmacokinetic (PK) starting from neutral
mutation heterogeneity.

                                     (Figure 2—figure supplement 2). It can be shown analytically that a mutant strain can invade at the
                                     mutant-free equilibrium if the death rate of the sensitive strain is higher than the death rate of the
                                     mutant, where the mutant death rate is a combination of intrinsic and drug-induced death as well as
                                     the mutational cost (Materials and methods). The observed higher diversity with single-step patterns
                                     seems counterintuitive as the need for multiple mutations should increase diversity (Figure 2B), but
                                     can be explained as follows: at high drug doses and low benefits, this effect is due to extinction that
                                     effectively reduces genetic diversity, while at low doses and high benefits, high mutational costs
                                     inhibit the build-up of diversity. These findings agree with an experimental study showing that resis-
                                     tance alleles with low costs are favored (Wichelhaus et al., 2002).

                                     Consistently lower treatment failure with multi-step resistance for
                                     various PKs and PDs
                                     Our results clearly show less resistance if multiple mutations are necessary, but the relative impor-
                                     tance of the number of resistance mutations compared to other treatment considerations like the
                                     dose-response profile of a drug (PD) (Yu et al., 2018; Spohn et al., 2019) or the administration
                                     mode (PK) required further investigation. Hence, we compared three different PKs: ‘peak’ (fast
                                     absorption and exponential decay), ‘ramp’ (slow, linear absorption and no decay), and ‘constant’
                                     (immediate absorption and no decay) (Figure 3A). Whereas constant PKs distinctly lowered the
                                     probability of treatment failure and the emergence of mutational diversity, peak and ramp PKs
                                     showed similar magnitudes of resistance evolution (Figure 3B, C, Figure 3—figure supplements 1
                                     and 2). However, ramp PKs lead to more than twice the mutational diversity with multi-step resis-
                                     tance patterns (Figure 3—figure supplement 1), which suggests that treatment failure and patho-
                                     gen diversity are connected in a non-trivial manner: while higher mutational diversity increases the
                                     risk of resistance evolution, neither its presence nor absence is obviously predictive of the treatment
                                     outcome (Figure 2, Figure 3—figure supplements 1 and 2).
                                         The evolutionary dynamics can also be contrasted for different antimicrobial drugs, AMPs and
                                     ABs, by using two different PD parameter sets (Materials and methods, Figure 1—source data 1).
                                     Briefly, AMP treatments are characterized by higher killing rates, steeper dose-response curves
                                     (Figure 1A), and lower mutation rates than AB ones (Yu et al., 2018). Consistent with previous find-
                                     ings that AMPs lead to a lower risk of resistance evolution and a narrower mutant selection window
                                     (MSW) than ABs (Yu et al., 2018), treatment failure and mutational diversity was lower for AMPs
                                     with peak and constant PK treatments (Figures 2 and 3, Figure 3—figure supplement 2). Notably,
                                     in accordance with empirical studies (Andersson and Hughes, 2014), we generally see mutations
                                     accumulating at sublethal drug doses, but the maximal diversity is substantially lower in AMP treat-
                                     ments (Figure 2B, Figure 2—figure supplement 1).
                                         Interestingly, the steeper dose-response curve of AMPs seems to make their resistance dynamics
                                     more sensitive to the shape of the PK than those of ABs (Figures 2 and 3, Figure 3—figure supple-
                                     ments 1, 2, and 4): in contrast to the other two PK profiles, ramp PKs lead to a drastic increase in
                                     treatment failure with AMPs, especially in multi-step scenarios (Figure 3, Figure 3—figure supple-
                                     ment 1). Accordingly, for ramp PKs, AMPs did not perform better and under some conditions even
                                     worse than ABs (Figure 3—figure supplement 4). By varying the ramp duration (or equivalently the
                                     rate of drug uptake), we found that there is an intermediate range (48–84 hr), which showed
                                     increased treatment failure with AMPs over ABs (Figure 3—figure supplement 5A). Paradoxically,
                                     while a narrow MSW generally hinders the emergence of numerous mutations in the population, for
                                     ramp PKs it can lead to optimal selection conditions for the sequential emergence of increasingly
                                     higher resistance mutations due to the strong selection for the next mutation combined with suffi-
                                     cient time for its emergence. Hence, especially the risk of multi-step resistance is increased if AMPs
                                     are used with ramp treatments as compared to the other PKs (Figure 3B, C). The broader selection
                                     windows in the presence of ABs, on the other hand, overlap and resistance mutations are less
                                     strongly favored (Figure 3—figure supplement 5B). Overall, the number of resistance mutations

Igler et al. eLife 2021;10:e64116. DOI: https://doi.org/10.7554/eLife.64116                                                                        8 of 24
Research article Evolutionary Biology
Figure 3. Resistance evolution patterns with different pharmacokinetics (PKs). (A) The three PKs used in the model
are shown over time (in hours) for the same peak drug concentration (xMIC). (B) The treatment failure probabilities
and (C) mutational diversities are given for the three PKs from (A) and two antimicrobial drug classes
(antibiotics (ABs) and antimicrobial peptides (AMPs)). Blue (orange) bars show averages calculated over the blue
(orange) framed triangular areas of multi-step (ms) (single-step (ss)) resistance evolution shown in Figure 2,
Figure 3—figure supplements 1 and 2. MIC: minimum inhibitory concentration.
The online version of this article includes the following figure supplement(s) for figure 3:
Figure supplement 1. Resistance evolution with single-step (ss) and multi-step (ms) patterns for ramp
pharmacokinetic (PK).
Figure supplement 2. Resistance evolution with single-step (ss) and multi-step (ms) patterns for constant
pharmacokinetic (PK).
Figure supplement 3. Mutational diversity at the end of the treatment period.
Figure supplement 4. Comparison of resistance evolution with antibiotic (AB) and antimicrobial peptide (AMP)
treatments using peak or ramp pharmacokinetic (PK).
Figure supplement 5. Selection coefficient analysis.
Figure supplement 6. Resistance evolution patterns with different pharmacokinetics (PKs) and pharmacodynamics
(PDs) for bacteriostatic drug action.
Figure supplement 7. Resistance evolution patterns with different pharmacokinetics (PKs) for simulations starting
from neutral mutation heterogeneity.
Igler et al. eLife 2021;10:e64116. DOI: https://doi.org/10.7554/eLife.64116 9 of 24Research article Evolutionary Biology
was the main determinant of treatment outcome, but we also found a complex dependence on PK
and PD characteristics.
This complexity in resistance determinants raises the question in how far the type of drug action
influences treatment outcome. Specifically, antimicrobials can have bactericidal action (which we
were modeling so far, through a drug-dependent death rate), but they can also act bacteriostatically,
that is, decreasing bacterial growth. We would expect bacteriostatic antimicrobials to slow down the
rise of mutations in comparison to bactericidal ones as the acquisition of mutations is also coupled
to bacterial growth. However, we find that this is only true for ramp and constant PK treatments (Fig-
ure 3—figure supplement 6A). Peak PKs allow for regrowth of bacterial cells due to drug decay,
which increases bacterial survival and treatment failure, especially with multi-step resistance. Interest-
ingly, mutational diversity only increased for AMP treatments (Figure 3—figure supplement 6B).
Multi-step resistance can lower the threshold for adaptive treatment
application
The conventional treatment goal is to ‘eradicate’ the pathogen population, but it has been sug-
gested that under certain conditions ‘mitigation’ could be a superior strategy (Hansen et al., 2017;
Hansen et al., 2020; Gatenby et al., 2009), for example, if it is likely that a resistant subpopulation
already exists at the beginning of the treatment. This strategy is called adaptive treatment as drug
doses are adapted to keep the sensitive population as big as possible and the total pathogen bur-
den below a given limit. (In practice, this is challenging as it requires monitoring of the pathogen
burden and adjusting drug doses accordingly, which is difficult to implement even for measurements
of total within-patient loads.) In adaptive treatment, the sensitive population provides a benefit by
competitively inhibiting the resistant subpopulation, but also a risk by supplying mutational input
(Figure 4). This trade-off creates a threshold for the size of the pre-existent resistant subpopulation
above which adaptive treatment is more effective than aggressive ‘eradication’ in containing the
infection (Hansen et al., 2017).
Previously, the threshold for adaptive treatment was derived in a single-step resistance scenario
(Hansen et al., 2017). When we incorporated adaptive treatment in our multi-step resistance frame-
work (Figure 4—figure supplement 1), we found that the resistant subpopulation threshold above
which adaptive treatment is more beneficial can be much lower in the multi-step scenario than in the
single-step one (Figure 4A). This can be intuitively explained by the fact that all (partially) sensitive
bacteria serve as competitors for fully resistant cells, but only the subpopulation one mutation away
from being fully resistant constitutes the risk population (Figure 4B). Thus, with multi-step resistance
there is a smaller population to supply resistant bacteria than with single-step resistance, changing
the trade-off towards adaptive treatment. Additionally (in scenarios where adaptive treatment is
favorable), the difference between adaptive and aggressive treatment in the duration until treatment
failure can be several-fold larger for multi-step than single-step resistance patterns (Figure 4—figure
supplement 2). Hence, assuming either single- or multi-step evolution could lead to considerably
different treatment strategy assessments with regard to treatment failure through resistant
pathogens.
HGT does not change the treatment failure probability
In addition to chromosomal mutations (Woodford and Ellington, 2007), antimicrobial resistance
can be conferred through HGT (van Hoek et al., 2011), which could facilitate resistance in multi-
step scenarios. To account for this possibility, we extended the model to allow for acquisition of a
gene conferring full resistance, initially only at a low rate from the environment, and then at a den-
sity-dependent rate from other cells carrying the HGT gene (for assumption and implementation
details, see Materials and methods). The HGT gene always provided immediate resistance to the
applied maximal dose, regardless of the benefit or costs conferred by mutations. In order to com-
pare the population dynamics of these two main antimicrobial resistance acquisition mechanisms, we
assumed that resistance through mutations or HGT can be acquired independently of each other
and that their effects are multiplicative.
Even though HGT carriers dominated the remaining pathogen population at the end of the treat-
ment (Figure 2—figure supplement 3), the addition of HGT did not change the probability of treat-
ment failure (Figure 2—figure supplement 4). This result holds true as long as the acquisition rate
Igler et al. eLife 2021;10:e64116. DOI: https://doi.org/10.7554/eLife.64116 10 of 24Research article Evolutionary Biology
Figure 4. Adaptive treatment threshold. (A) The dependence of the threshold number of resistant bacteria cells
Mm is given for different proportions of the risk population to the whole competitor population for single-step
(orange stars), where the risk population is always equal to 1, and multi-step (blue lines) resistance patterns.
Different benefits (and correlated costs) per mutation are shown as different color shades. (B) The minimum
inhibitory concentration (MIC) increases with every mutation (given by bi), but only an MIC above the given drug
dose will lead to a reproductive number R0 >1, that is, growth of the population (resistant cells). All other
subpopulations serve as competitors, and the subpopulation one mutation away from resistance is the risk
population.
The online version of this article includes the following figure supplement(s) for figure 4:
Figure supplement 1. Optimal pharmacokinetic (PK) for adaptive treatment.
Figure supplement 2. Differences in time to treatment failure are more pronounced with multi-step patterns.
from the environment is lower than the mutation rate (this constraint is examined further in the Dis-
cussion). Consequently, initial rescue of the population is due to mutations – and therefore depen-
dent on the magnitude of the mutational benefit – whereas HGT resistance is acquired later during
the infection, after which it spreads rapidly.
Discussion
In this study, we compared the risk of drug resistance evolution patterns that either feature single
resistance mutations with large costs and benefits or multiple steps involving mutations with smaller
costs and benefits. We extended this comparison across a wide range of PD and PK profiles, which
cover a multitude of antimicrobials and treatment strategies. We first showed that the single- and
multi-step resistance patterns are relevant by gathering evidence of multi-step resistance patterns in
the experimental literature (Table 1, Figure 1). While it is intuitive that drug resistance requiring
Igler et al. eLife 2021;10:e64116. DOI: https://doi.org/10.7554/eLife.64116 11 of 24Research article Evolutionary Biology
more than one mutation will arise more slowly, we find that it can be a surprisingly strong inhibitor
of resistance evolution and mutational diversity, depending on the drug class and administration
route (Figure 3). We demonstrated that the number of mutations necessary for resistance strongly
affects predictions of treatment outcome and optimality with regard to antimicrobial resistance – in
a manner that is robust to variations in mutation rates and in the cost per mutation (Figure 2—figure
supplements 2 and 5). Experimental support for our simulation results comes from studies reporting
that mutational input limited to low benefits (Drlica, 2003) leads to decreased drug resistance evolu-
tion as compared to systems, in which high-benefit mutations are available (Allen et al., 2004).
Moreover, limited access to high-benefit mutations seems to curtail MIC increase beyond a certain
threshold (Chevereau et al., 2015).
The pattern of resistance evolution (single- and multi-step) is likely to be associated with the
molecular mechanisms of resistance for a given antimicrobial: as an overall rule, the magnitude of
the resistance benefit correlates with the mechanism of resistance, for example, efflux pumps yield
low benefits, whereas specific drug target mutations yield high benefits (Hughes and Andersson,
2017).
Unfortunately, the specific mutations linked to the benefit and cost of mutations in our literature
analysis (Table 1) are generally not known. Overall, however, MIC increase was low for drugs, which
typically show unspecific resistance mechanisms via two-component systems or lipopolysaccharide
modifications – as generally seen for AMP resistance (Lofton et al., 2013; Makarova et al., 2018;
Kubicek-Sutherland et al., 2017) – and high for drugs with typical resistance via specific target
modifications, as seen for some AB classes (e.g., rifampicin resistance via RNAP subunit mutations)
(Goldstein, 2014). For most drugs, the prevalent resistance mechanisms are known (van Hoek
et al., 2011); hence, this information can be used to determine drug and dosing regimens that mini-
mize resistance evolution based on the inferred pattern of resistance evolution (i.e., using the proba-
bility that a single- or multi-step pattern is underlying resistance evolution). A recent study also
suggests that resistance evolution in biofilms, which are often associated with clinical infections, is
prone to occur through unspecific mechanisms, even if specific mechanisms are favored in planktonic
cultures (Santos-Lopez et al., 2019).
Interestingly, the risk of resistance evolution does not seem to be related to the emerging muta-
tional diversity in the population in a trivial manner as it is either limited by fast extinction or high
mutational cost (Figure 2, Figure 3—figure supplements 1 and 2). Reducing mutational diversity is
however a worthwhile goal in its own right as mutational diversity can increase adaptation by fixing
more mildly deleterious mutations, which can then act as stepping stones for multi-drug resistance
evolution (Van Egeren et al., 2018). Further, the diversity arising during the treatment period will
help to determine if escalating the drug dose is expected to be beneficial or if, conversely, it would
be detrimental because higher-resistance mutations are already present in the population and would
be selected. The strength of this selection is determined by the MSW of the antimicrobial. Hence,
the number of resistance mutations emerging over the treatment can be useful in estimating the
width of the MSW – even though the diversity remaining at the end of the treatment will likely be
lower (Figure 3—figure supplement 3).
We find that mutational diversity arises from a combination of selection pressure, bacterial
growth, and fitness costs and cannot be predicted from the mutational benefit or the probability of
treatment failure alone. Diversity is also shaped in unexpected ways by interactions between the
drug type and drug concentration changes, making drug choice not only dependent on the PD char-
acteristics, but also the specific drug PK in the target body compartment. Notably, this can lead to
more favorable assessment of a specific drug application mode for one type of drug (e.g., AMPs for
bolus drug application), but a different mode for another drug (e.g., ABs for drug infusions). While
we mostly focused on the action of bactericidal drugs in this study, we note that purely bacterio-
static effects can lead to different trends for PK and PD influence on treatment failure and mutational
diversity, for example, making peak PKs the least favorable drug administration route (Figure 3—fig-
ure supplement 6). The unexpected complexity in predicting which treatment strategies will mini-
mize resistance evolution highlights the need of critically evaluating assumptions such as single-step
resistance made in current PKPD models. The role of specific drug characteristics in resistance evolu-
tion is exemplified by the steepness of the PD curve, k. By analyzing the selection coefficients for
various treatments, we find that k governs not only the size of the MSW (Yu et al., 2018;
Chevereau et al., 2015), but generally shapes the selection pressure for resistance evolution in a
Igler et al. eLife 2021;10:e64116. DOI: https://doi.org/10.7554/eLife.64116 12 of 24Research article Evolutionary Biology
qualitative manner. min , the minimal bacterial growth rate, on the other hand, leads to substantial
quantitative changes in selection pressure, meaning that k and min shape the form and strength of
drug selection independently (Figure 3—figure supplement 5C). Ultimately, the interactions
between PD and PK characteristics give rise to complex, and dynamic, fitness landscapes that are
navigated by mutations of various benefit and cost sizes.
Interestingly, AMP-like drugs show considerably more resistance evolution with ramp PKs than in
the other PK scenarios. This is noteworthy as natural AMP expression patterns in the producing
organisms resemble ramp PKs (Johnston et al., 2014; Haine et al., 2008). This finding could sug-
gest another reason why natural AMP production in cocktails is favorable (Zanchi et al., 2017) as
AMP cocktails will limit the selection pressure and potential for resistance evolution to individual
components. Intuitively, we would expect that a gradual increase in drug concentration would facili-
tate the rise of multiple mutations and indeed we find that ramp PKs lead to the highest probability
of treatment failure and mutational diversity (Figure 3). However, a high probability of treatment
failure is still mostly observed with high mutational benefits (Figure 3—figure supplement 1),
that is, limited with the small-benefit mutations likely associated with multi-step resistance
(Jochumsen et al., 2016). For clinical settings, our simulations caution that attention should be paid
to the drug application mode when using AMPs. AMP-like colistin and daptomycin, for example, are
typically applied as (short) IV treatments (Liu et al., 2011; Tsuji et al., 2019), which resemble peak
PKs, and they are still active as last-resort drugs for multi-drug-resistant bacterial pathogens
(Liu et al., 2011; Tsuji et al., 2019). Overall, our results agree with Yu et al., 2018 in that AMP
treatment lowers resistance evolution and mutational diversity. This is particularly notable as multi-
step patterns seem to be the common mechanism by which AMP resistance evolves (Table 1;
Spohn et al., 2019; Jochumsen et al., 2016; Joo et al., 2016) – thereby suggesting another advan-
tage over ABs, for which single- and multi-step evolution is common (Drlica, 2003; Weinreich et al.,
2006; Wistrand-Yuen et al., 2018; Marcusson et al., 2009; Jin and Gross, 1988).
Unfortunately, distributions of mutational effects have rarely been characterized experimentally
for drug resistance, and even then only for a single mutational step (Chevereau et al., 2015). We
show, however, that this information is crucial as input for PKPD models to accurately predict resis-
tance evolution and population diversity in response to drug treatment. Even between mutations
involved in multi-step resistance to a single drug, benefit and costs of individual mutations are likely
to vary (Figure 1B). In addition, epistasis in benefit and or cost magnitude can facilitate or preclude
certain evolutionary pathways (Jochumsen et al., 2016). Both options can be easily included in our
model, but empirical data in this regard is sparse, and we expect our main results with regard to PD
and PK influence on single- and multi-step resistance to be robust to such changes. The empirical
data that we used to inform our simulations did also not provide explicit information about potential
compensatory mutations, which arguably can influence the dynamics of resistance evolution
(Andersson and Hughes, 2010) – although likely in a very complex manner, as recent studies sug-
gest (Dunai et al., 2019). According to our results, these mutations might even be a necessary
means to allow multi-step resistance patterns to arise. If they emerge fast enough to compensate for
the cost of the first mutation, they would increase the selection coefficient of this mutational sub-
population and thereby provide a stepping stone to high-level resistance. This might either be akin
to crossing a fitness valley, if the first mutation does not provide a benefit, or it might facilitate
climbing a fitness peak by making low-benefit mutations more favorable.
For many antimicrobial drugs, resistance evolution can not only arise through chromosomal muta-
tions, but also by acquisition of resistance genes through HGT (van Hoek et al., 2011). Notably, our
results highlight the importance of transfer rates as we find rescue of the pathogen population
through HGT resistance only if the initial acquisition rate is higher than the mutation rate. HGT is not
only dependent on the recipient population size but also on the donor population size, hence using
typical experimentally measured conjugation rates of 10 11–10 13 ml cell 1 h-1 (Licht et al., 1999),
environmental donors have to be more abundant than 105 cells ml 1 to be faster than chromosomal
mutation rates (Rodrı́guez-Rojas et al., 2014) of 10 6, which might not always be the case at bacte-
rial infection sites (Stecher et al., 2012). This implies either (i) that HGT resistance is acquired after
chromosomal mutations, (ii) that HGT spreads mostly at sublethal drug doses, or (iii) that acquisition
rates from a pre-existent pool of HGT carriers are high. Plasmid transfer rates are likely increased at
low AB doses (Cairns et al., 2018), but generally they are highly variable, and even though they are
biased towards spread between clone-mates, there seems to be no obvious correlation between
Igler et al. eLife 2021;10:e64116. DOI: https://doi.org/10.7554/eLife.64116 13 of 24Research article Evolutionary Biology
transfer rates and genetic distance of donors and recipients (Dimitriu et al., 2019). Hence, deter-
mining the relative importance of resistance evolution through HGT or chromosomal mutations is
difficult, but for specific drugs like AMPs, for which spread of HGT resistance from the gut micro-
biota seems to be low (Kintses et al., 2019), the risk of treatment failure is mainly shaped by the
beneficial mutations available to the population.
Most of our results assumed a completely susceptible pathogen population at onset of treatment,
as seen in many bacterial infections (Balmer and Tanner, 2011). However, the fast growth and high
mutation rates can lead to significant heterogeneity in bacterial populations and we would expect
this (neutral) heterogeneity to increase treatment failure, even with multi-step resistance patterns, by
giving the population a ‘head-start’ in the accumulation of mutations. This is indeed what we see
with our model when we start from a heterogeneous population, but we still find on average less
than 50% treatment failure in each multi-step resistance scenario (considering various PKs and PDs)
(Materials and methods, Figure 2—figure supplement 6, Figure 3—figure supplement 7).
When starting from populations that likely already contain resistance mutations, aiming for ‘miti-
gation’ (adaptive treatment) can be more effective in reducing resistance spread than trying to
completely ‘eradicate’ the pathogen population (aggressive treatment). If multiple steps are neces-
sary to obtain full resistance to the highest possible drug dose, we find that the threshold for choos-
ing adaptive over aggressive treatment can be much lower than if only a single mutation were
necessary (Figure 4). Additionally, in drug-free environments, we expect a lower frequency of resis-
tant cells for multi-step patterns as it is less likely that neutral heterogeneity produces cells carrying
all resistance mutations. Hence, the high competitive benefit is paired with a low risk for resistance
evolution. Even though determination of the number and size of resistant subpopulations is very dif-
ficult in practice, this suggests that adaptive treatment is likely to be superior in containment of
resistant infections for many drugs, for which multi-step patterns are the most common resistance
mechanism. Further, the assumptions in our model are not specific to bacterial populations or anti-
microbials, which makes them more broadly applicable to other drug treatments, like cancer therapy
(Chakrabarti and Michor, 2017). Our results suggest a way forward to develop treatment strategies
that – in addition to all other important considerations – explicitly account for the risk of drug resis-
tance evolution.
Materials and methods
Key resources table
Reagent type (species) or resource Designation Source or reference
Software, algorithm R package adaptivetau Johnson, P. Tau-Leaping Stochastic Simulation. R package version 2.2–3 (2019) (Johnson, 20
Other Previously published datasets Melnyk A, Wong A, Kassen R. The fitness costs of antibiotic resistance mutations. (2015) (Me
Literature review of costs and benefits of antimicrobial drug resistance
mutations
We compounded a comprehensive set of experimental evolution studies (or reviews thereof) that
measured both fitness costs (usually growth rate reductions in the absence of drugs) and benefits
(usually increases in MIC) of AB or AMP resistance mutations within the same set of experiments.
The studies used various bacterial species, including pathogenic isolates (see Table 1). From empiri-
cally measured data of sample replicates, we calculated costs as the arithmetic mean of 1-(relative
fitness to wildtype) and the benefit as the geometric mean (due to the logarithmic scale of MIC/IC50
measures) of MIC or IC50 increase relative to the wildtype. (Note: Chevereau et al., 2015 used IC50
instead of MIC but our calculation of IC50 and IC90 – which is likely very close to MIC – in their data
gave a good correlation [R2 = 0.45, pResearch article Evolutionary Biology
Table 1, with the exception of Melnyk et al., 2015, where we only list the eight different pathogenic
strains used, as this paper synthesizes 24 different studies, grown under various conditions.
We obtained the type and average number of mutational events observed from supplemental
data in most studies, but there was generally no possibility to link any individual resistance mutation
with a specific cost and benefit. Hence, we divided the overall costs and benefits by the average
number of observed (adaptive) mutations (i.e., mutations that were not observed in control lines),
assuming that each mutation provides a similar share to the overall magnitude. As most studies have
a very low number of mutational events linked to resistance, this assumption is not expected to lead
to strong biases. Overall, the results from all of the studies gave only a very weak positive linear cor-
relation between the log(benefit) and cost of a mutational event (Figure 1B). Mutations seem to be
more likely to incur costs than benefits. This result is largely determined by the large data set from
Spohn et al., 2019, which gives a very weak correlation between cost and benefit (Figure 1—figure
supplement 1), similar to the data points from Melnyk et al., 2015. The dataset from Spohn et al.,
2019 is the only one that fulfilled our criteria and directly compared AB and AMP mutational effects,
which we summarize in Figure 1—figure supplement 1. The calculated benefit and cost per muta-
tion for each individual AB and AMP in the Spohn et al., 2019 and Melnyk et al., 2015 data is given
in Figure 1—source data 1.
PD model
We combined a PD model, which connects the growth of bacterial (mutant) subpopulations to anti-
microbial drug concentration (Figure 1A; Nielsen and Friberg, 2013; Andersson et al., 2020;
Read et al., 2011; Clarelli et al., 2020; Yu et al., 2018; Regoes et al., 2004), with a population
model to predict the emergence of resistance mutations in individual bacterial cells.
In the population model, bacteria can grow up to a certain carrying capacity and can accumulate
mutations during replication at a certain rate. In order to simulate de novo mutation emergence, we
started most of our simulations from a completely susceptible population M0, but we also ran simula-
tions starting from neutral diversity (meaning that we ran the simulation for 50 hr without AB treat-
ment and then started from the observed neutral heterogeneity) (Figure 2—figure supplement 6,
Figure 3—figure supplement 7). We do not allow for reversion of resistance mutations, which has
been found to be rare (Dunai et al., 2019) and likely does not play a role in multi-step resistance
networks (over the time frame of a single treatment period). The population dynamics is captured by
the following deterministic equations (which were implemented in a stochastic manner):
dMi M M
¼ r ð1 cÞi 1 u Mi 1 1 þ r ð1 cÞi ð1 uÞ Mi 1 ð g þ g i Þ Mi
dt K K
with i ¼ 0; 1; 2; . . .
X
M¼ Mi
i
Here, Mi is the bacterial subpopulation carrying i mutations, r the wildtype growth rate (set to 1
in our simulations), c the cost of each mutation, u the mutation rate, K the carrying capacity of the
system, g the natural death rate, and gi the death rate caused by drugs (which captures the PD
properties of a drug and the resistance level of the bacterial population via the mutational benefit).
The PD function
In our population model, cells die at a low intrinsic rate g, whereas death due to antimicrobials (gi ) is
dependent on the properties of the antimicrobial applied, the benefit conferred by each mutation,
and the PK profile. Specifically, gi is calculated from the maximal and minimal growth rates max and
min (note that min can be negative in the presence of drugs, meaning that we generally consider
bactericidal AB action), the (time-dependent) concentration of the drug a, the MIC of the mutation-
free population (set to 1 in our simulations), the benefit bi conferred by each mutation, and the sen-
sitivity of the dose–growth relationship k (the Hill coefficient or steepness of the curve):
Igler et al. eLife 2021;10:e64116. DOI: https://doi.org/10.7554/eLife.64116 15 of 24Research article Evolutionary Biology
k
ð max min Þ ða=ðMIC bi ÞÞ
gi ¼
ða=ðMIC bi ÞÞk min = max
max ¼ r ð1 cÞi g
Considering bacteriostatic antimicrobial action can be achieved in our model by using a small
min value and incorporating antimicrobial effect into the growth, not the death term. Note that
introducing antimicrobial action into the birth term here leads to density-dependent antimicrobial
effects. This is not entirely unrealistic, considering persister bacteria, whose dormant state protects
them from killing by ABs (Kussell et al., 2005). However, bacteriostatic action in itself would result
in a high bacterial presence at the end of the treatment – even if bacteria are fully susceptible to the
antimicrobial – as intrinsic bacterial death is very low. Hence, we incorporated an extrinsic removal
rate g cl Mi , akin to immune system clearance of inert bacterial cells, with gcl ¼ 0:1h 1 being in a
realistic range (Roach et al., 2017). The model for bacteriostatic drug action is then given by
dMi M M
¼ r ð1 cÞi 1 g i 1 u Mi 1 1 þ r ð1 cÞi gi ð1 uÞ Mi 1
ðg þ gcl Þ Mi
dt K K
with i ¼ 0; 1; 2; . . .
X
M¼ Mi
i
Benefits and costs of mutations
The main interest of our study is the comparison of AB resistance evolution via ‘typical’ single muta-
tions with complex, multi-step processes as shown in Jochumsen et al., 2016. The latter are charac-
terized by a network of mutations of small benefits in multiple genomic resistance loci that create
evolutionary pathways to high-level AB resistance (Jochumsen et al., 2016). We model this mutation
accumulation via sequential acquisition of mutations with a certain benefit and cost, that is,
decreases in drug-induced death and decreases in the maximum growth rate. Benefits and costs of
each mutation were taken from the positive correlation that was observed with literature values
(slope = 0.0087) – except for simulations testing the dependence of our results on this relationship,
where we took a steeper correlation (slope = 0.0467) (Figure 2—figure supplement 1).
As benefits and costs are likely to vary, we also confirmed that our results are robust with regard
to drawing benefits and costs of each mutation from a normal distribution. Similarly, we ran simula-
tions with ‘peak PK’, where only the first mutational benefit/cost was fixed (i.e., deciding if a single-
or multi-step pattern was necessary) and the other mutations were sampled from the whole range of
benefits and costs obtained from the literature, independently of each other (Figure 2—figure sup-
plement 5). We ignore the possibility of positive epistasis between these mutations (which would
speed up resistance evolution as fewer mutations would be required for higher levels of resistance),
as well as the possibility of negative epistasis, which would limit access to some mutations and the
available pathways to resistance (thereby slowing down resistance evolution as ‘effective’ mutation
rates might be lower than we assume in our model). Both of these processes are complex and not
well understood, hence by ignoring these possibilities we aim to provide a more fundamental and
intuitive comparison between single- and multi-step resistance evolution.
Resistance mutation rates were generally kept the same for each simulation run (i.e., regardless
of the benefit magnitude). In reality, there might be more mutations available that provide a low
benefit – which are likely to be less specific and therefore have a larger genomic target size, but
using higher mutation rates for mutations with lower benefits and costs – which was done propor-
tional to the number of steps needed to obtain resistance – did not change our results noticeably
(Figure 2—figure supplement 2).
Igler et al. eLife 2021;10:e64116. DOI: https://doi.org/10.7554/eLife.64116 16 of 24You can also read