Recency of Faulting and Subsurface Architecture of the San Diego Bay Pull-Apart Basin, California, USA
←
→
Page content transcription
If your browser does not render page correctly, please read the page content below
ORIGINAL RESEARCH
                                                                                                                                                published: 11 June 2021
                                                                                                                                        doi: 10.3389/feart.2021.641346

                                             Recency of Faulting and Subsurface
                                             Architecture of the San Diego Bay
                                             Pull-Apart Basin, California, USA
                                             Drake M. Singleton 1,2* † , Jillian M. Maloney 1 , Daniel S. Brothers 3 , Shannon Klotsko 4 ,
                                             Neal W. Driscoll 2 and Thomas K. Rockwell 1
                                             1
                                              Department of Geological Sciences, San Diego State University, San Diego, CA, United States, 2 Scripps Institution
                                             of Oceanography, University of California, San Diego, San Diego, CA, United States, 3 Pacific Coastal and Marine Science
                                             Center, U.S. Geological Survey, Santa Cruz, CA, United States, 4 Department of Earth and Ocean Sciences, University
                                             of North Carolina Wilmington, Wilmington, NC, United States

                                             In Southern California, plate boundary motion between the North American and Pacific
                                             plates is distributed across several sub-parallel fault systems. The offshore faults of
                                             the California Continental Borderland (CCB) are thought to accommodate ∼10–15%
                           Edited by:
                 James D. Muirhead,          of the total plate boundary motion, but the exact distribution of slip and the mechanics
           The University of Auckland,       of slip partitioning remain uncertain. The Newport-Inglewood-Rose Canyon fault is the
                         New Zealand
                                             easternmost fault within the CCB whose southern segment splays out into a complex
                         Reviewed by:
                         Jack Williams,
                                             network of faults beneath San Diego Bay. A pull-apart basin model between the Rose
    Cardiff University, United Kingdom       Canyon and the offshore Descanso fault has been used to explain prominent fault
                  Francesco Mazzarini,
                                             orientations and subsidence beneath San Diego Bay; however, this model does not
      Istituto Nazionale di Geofisica e
              Vulcanologia (INGV), Italy     account for faults in the southern portion of the bay or faulting east of the bay. To
                  *Correspondence:           investigate the characteristics of faulting and stratigraphic architecture beneath San
                   Drake M. Singleton        Diego Bay, we combined a suite of reprocessed legacy airgun multi-channel seismic
                   dsinglet@ucsd.edu
                                             profiles and high-resolution Chirp data, with age and lithology controls from geotechnical
                  † Presentaddress:
                  Drake M. Singleton,
                                             boreholes and shallow sub-surface vibracores. This combined dataset is used to create
  Pacific Coastal and Marine Science         gridded horizon surfaces, fault maps, and perform a kinematic fault analysis. The
     Center, U.S. Geological Survey,
                                             structure beneath San Diego Bay is dominated by down-to-the-east motion on normal
       Santa Cruz, CA, United States
                                             faults that can be separated into two distinct groups. The strikes of these two fault
                   Specialty section:        groups can be explained with a double pull-apart basin model for San Diego Bay. In our
         This article was submitted to
                                             conceptual model, the western portion of San Diego Bay is controlled by a right-step
    Structural Geology and Tectonics,
                a section of the journal     between the Rose Canyon and Descanso faults, which matches both observations and
            Frontiers in Earth Science       predictions from laboratory models. The eastern portion of San Diego Bay appears to be
       Received: 14 December 2020            controlled by an inferred step-over between the Rose Canyon and San Miguel-Vallecitos
           Accepted: 08 April 2021
          Published: 11 June 2021
                                             faults and displays distinct fault strike orientations, which kinematic analysis indicates
                               Citation:
                                             should have a significant component of strike-slip partitioning that is not detectable in
            Singleton DM, Maloney JM,        the seismic data. The potential of a Rose Canyon-San Miguel-Vallecitos fault connection
  Brothers DS, Klotsko S, Driscoll NW
                                             would effectively cut the stepover distance in half and have important implications for
  and Rockwell TK (2021) Recency of
 Faulting and Subsurface Architecture        the seismic hazard of the San Diego-Tijuana metropolitan area (population ∼3 million
       of the San Diego Bay Pull-Apart       people).
                 Basin, California, USA.
            Front. Earth Sci. 9:641346.      Keywords: pull-apart basin, fault structure, marine paleoseismology, marine geophysics, Newport-Inglewood-
      doi: 10.3389/feart.2021.641346         Rose Canyon fault system, Inner California Continental Borderland, San Diego bay

Frontiers in Earth Science | www.frontiersin.org                                   1                                              June 2021 | Volume 9 | Article 641346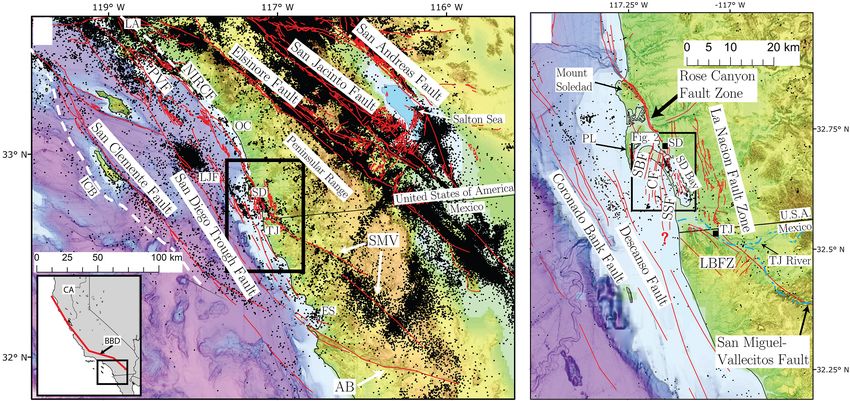
Singleton et al.                                                                                                     San Diego Bay Pull-Apart Basin

INTRODUCTION                                                                models produced by such studies investigate strike-slip fault
                                                                            step-overs and oblique deformation at a range of different
Pull-apart basins form in extensional step-overs between strike-            scales and boundary conditions. Kinematic models using plate
slip fault sections and are common features of strike-slip fault            boundary conditions and fault geometry (but not explicitly
systems around the word (Mann, 2007 and references therein).                considering stress conditions), provide a broad scale perspective
These structures receive considerable attention in academic                 on deformation characteristics and strain partitioning (e.g.,
studies not only due to their abundance, but also their high                Tikoff and Teyssier, 1994; Teyssier et al., 1995). Predictions of
potential in resource extraction, and their role in earthquake              smaller scale (intra-basin) faulting and deformation through time
rupture processes (e.g., Mann et al., 1983; Oglesby, 2005; Mann,            is provided by analogue and numerical models that simulate
2007; Wesnousky, 2008; Brothers et al., 2009; 2011; Wu et al.,              lithospheric conditions with either proxy material (e.g., sand
2009; Watt et al., 2016; van Wijk et al., 2017). A significant              and clay) (e.g., Dooley and Schreurs, 2012), or simplified fault
amount of previous work has focused on the evolution of pull-               geometries and stress conditions (e.g., Ye et al., 2015). While
apart basins, from early-stage spindle-shaped basins through                valuable as a framework for field observations, these models
the extreme case of significant lithospheric thinning and the               may have scaling limitations, or may be over simplified due
development of a spreading ridge (Mann et al., 1983; Lonsdale,              to real-world crustal heterogeneities. These studies highlight
1995; Mann, 2007; Wu et al., 2009; Dooley and Schreurs, 2012;               the advances that have been made in understanding pull-apart
Ye et al., 2015; van Wijk et al., 2017).                                    basins but are primarily focused on basins that are located
    As a result of the continuum of development exhibited by                between two master strike-slip segments. Less well known is
pull-apart basins (Mann, 2007), a variety of structural conditions          the resulting evolution or fault structure of a basin in which an
have been observed ranging from relatively simple geometries,               additional, competing principal displacement zone may influence
i.e., two parallel fault strands experiencing pure strike-slip motion       the basin development.
with a central depocenter [e.g., the Dead Sea (Garfunkel and                    In the San Diego, California, region, the Rose Canyon fault
Ben-Avraham, 1996)], to more complex fault structures found                 represents the boundary between the Peninsular Range geologic
in basins undergoing transtension [e.g., the Gulf of California-            province and the complex tectonic fabric of the Inner Continental
Salton Trough system (Lonsdale, 1995; Brothers et al., 2009)].              Borderland (ICB) (Figure 1). The Rose Canyon fault is the
Distinctive structural features have been identified that can               southern section of the larger Newport-Inglewood-Rose Canyon
separate pull-apart basins into two end-member models based                 fault system, which is the easternmost fault in the ICB and has
on deformation style (i.e., pure strike-slip or transtensional)             been mapped as a continuous ∼190 km long fault zone from Los
(Wu et al., 2009). In the classical model of a pull-apart                   Angeles to San Diego (Figure 1B; Moore, 1972; Wright, 1991;
basin experiencing pure strike-slip deformation, a central basin            Lindvall and Rockwell, 1995; Maloney et al., 2016; Sahakian et al.,
is bounded by terraced normal faults striking ∼30◦ to the                   2017). A broad area of transtension exists south of downtown San
master strike-slip fault sections; in contrast, basins undergoing           Diego, where the Rose Canyon fault splays out into a complex
transtension appear to develop en-echelon sidewall faults and               network of faults that together results in the subsidence of the
more complex central basins with multiple depositional centers              San Diego Bay pull-apart basin (Figure 1C).
(Wu et al., 2009).                                                              The boundaries of the San Diego Bay pull-apart basin are the
    From a seismic hazard perspective, pull-apart basins are of             offshore Descanso fault to the west, the La Nacion fault zone to
particular interest as regions where extensional normal stress is           the east, the Rose Canyon fault to the north, and the Tijuana
elevated (i.e., unclamping), which may promote the nucleation               River valley to the south (Figure 1C) (Kennedy, 1975; Marshall,
of earthquake ruptures that can continue onto the larger master             1989; Maloney, 2013). Faults in the northwestern portion of the
strike-slip faults (Oglesby, 2005; Brothers et al., 2011; Watt              bay can be explained as linking faults oriented ∼30–40◦ to the
et al., 2016). Additionally, analysis of mapped historical ruptures         dextral Rose Canyon and Descanso faults in a classic pull-apart
indicate that step-over regions may sometimes act as barriers               basin model (Figure 1C) (Legg, 1985; Treiman, 1993; Kennedy
to through-going ruptures and so potentially act as termination             and Clarke, 1996; Rockwell, 2010). In southeastern San Diego
points (Wesnousky, 2008). Therefore, the potential role of pull-            Bay, a series of faults has been imaged that together with the
apart basins in earthquake rupture length and consequently                  La Nacion fault zone, strike at a low angle to the Rose Canyon
magnitude, as well as nucleation and potential rupture directivity,         and Descanso faults and are located outside of the apparent
highlights their importance for an accurate regional seismic                active basin (Figure 1C; Kennedy and Welday, 1980; Kennedy
hazard assessment.                                                          and Clarke, 1996), suggesting additional factors are influencing
    Through field observation (e.g., Garfunkel and Ben-Avraham,             deformation in San Diego Bay.
1996; Mann, 2007; Wesnousky, 2008; Brothers et al., 2009; Watt                  Some studies have suggested a possible connection between
et al., 2016), analogue models (e.g., Wu et al., 2009; Dooley and           the Rose Canyon and the San Miguel-Vallecitos fault to the south
Schreurs, 2012), and numerical studies (e.g., Oglesby, 2005; Ye             that may be responsible for the orientations of the southeastern
et al., 2015; van Wijk et al., 2017), a basic understanding of pull-        bay faults (Figure 1C; Wiegand, 1970; Marshall, 1989; Treiman,
apart basins has emerged that focuses on fault structure and                1993). However, the exact mechanics of this connection remain
stratigraphic character of the central region of subsidence that            uncertain and definitive evidence of faulting south of San Diego
develops in the space between the two principal displacement                Bay remains elusive. The southern continuation of the Newport-
zones (i.e., the main strike-slip fault sections). The predictive           Inglewood-Rose Canyon fault has important consequences

Frontiers in Earth Science | www.frontiersin.org                        2                                      June 2021 | Volume 9 | Article 641346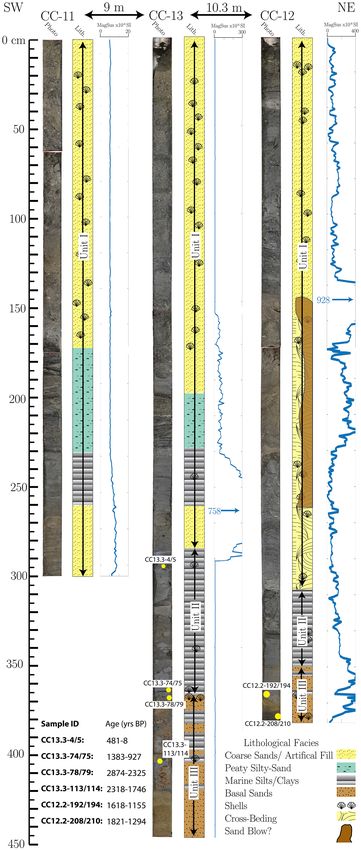
Singleton et al. San Diego Bay Pull-Apart Basin
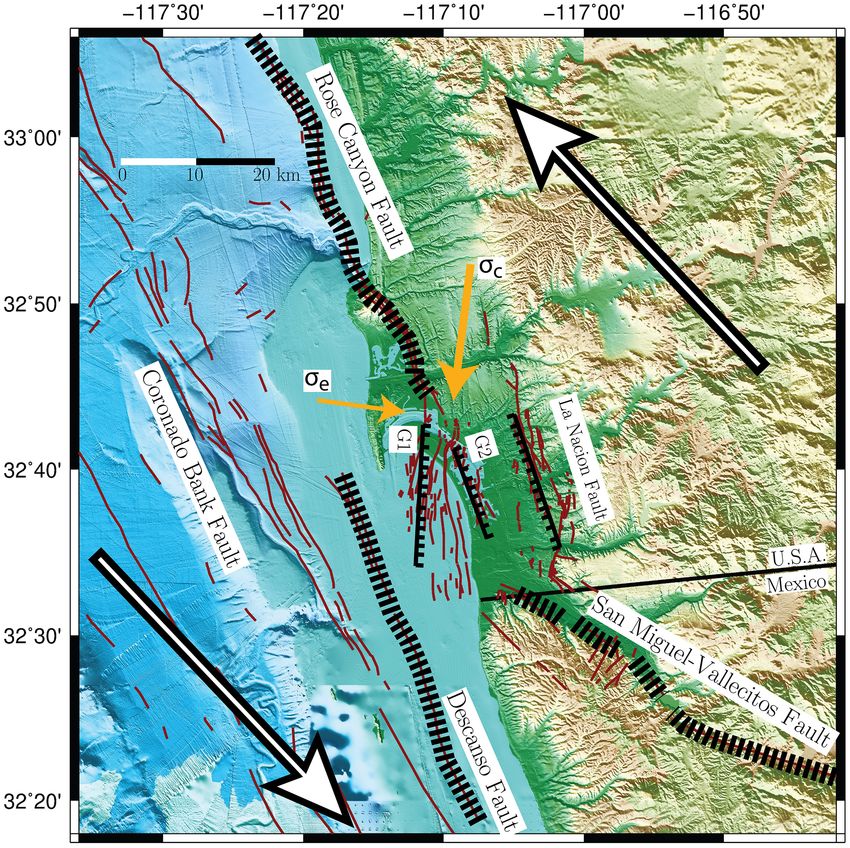
FIGURE 1 | (A) Map of the southwestern United States and northern Baja California, Mexico. Red line marks general trace of the San Andreas Fault. Black box
corresponds to location of (B). (B) Map of southwestern California and northwestern Baja California, Mexico. Quaternary active faults are shown in red and the
transpeninsular faults are labeled (i.e., AB and SMV). White dashed line indicates boundary of ICB. Regional seismicity (black circles) between 1981-2019 are from
Hauksson et al. (2012) and Ross et al. (2019). Black box corresponds to location of (C). (C) Overview map of the San Diego region with regional faults (red lines).
The faults that trend south away from San Diego Bay (i.e., SBF, CF, SSF) likely continue beyond the international border, but lack reliable data to extend the mapped
trace. Black box marks location of Figure 2. AB, Agua Blanca fault; BBD, Big Bend Domain of the San Andreas Fault; CA, California; CF, Coronado fault; ES,
Ensenada; LJF, La Jolla Fan; LBFZ, Los Buenos fault zone; ICB, Inner Continental Borderland; NIRCF, Newport-Inglewood-Rose Canyon fault; OC, Oceanside; PL,
Point Loma; SD, San Diego; SMV, San Miguel-Vallecitos fault; SBF, Spanish Bight fault; SSF, Silver Strand fault; TJ, Tijuana. Fault traces north of the international
border are from the USGS fault database (USGS, 2019) and the USGS offshore fault database (Walton et al., 2020a); faults south of the border are from Fletcher
et al. (2014). Background topography and bathymetry are from ESRI topography and the National Centers for Environmental Information Southern California Coastal
Relief Model (v2) (Calsbeek et al., 2013).
for understanding the distribution of plate boundary strain the Western Transverse Ranges (Humphreys and Weldon, 1991;
accommodated in the ICB, and thus regional seismic hazard. Platt and Becker, 2010). Slip is fed into the ICB by the faults
In this study, we use a combination of high-resolution seismic of the Transpeninsular fault system in Baja California, Mexico,
Chirp profiles, reprocessed legacy multi-channel seismic (MCS) mainly the Agua Blanca (and associated strands) and the San
lines, and borehole-core sampling to resolve the stratigraphic Miguel-Vallecitos faults (Figure 1).
character and structural framework beneath San Diego Bay
and to determine the recency of faulting. Additionally, we
develop conceptual models using structural analysis of the The Agua Blanca Fault and Associated
fault orientations and regional plate boundary characteristics Offshore Strands
to explain the observed features of the San Diego Bay pull- The Agua Blanca fault cuts across the Baja Peninsula and
apart basin. transfers ∼2–8 mm/yr of slip into the faults of ICB (Legg
et al., 1991; Rockwell et al., 1993; Dixon et al., 2002; Gold
et al., 2020). Within the ICB, the Descanso and Coronado
REGIONAL GEOLOGY AND LOCAL Bank faults are strands of the Agua Blanca fault zone that help
TECTONICS carry a portion of this slip northward, potentially partitioning
it into the Rose Canyon fault through the San Diego Bay pull-
The ICB is the offshore extension of the Big Bend Domain of the apart basin (Figure 1; Legg, 1985; Legg et al., 1991). Studies
San Andreas plate boundary, which dominates the tectonics of in the 1980s and 1990s (e.g., Legg, 1985; Legg et al., 1991)
Southern California (Figure 1). The San Diego Bay pull-apart lies postulated that the Coronado Bank fault is a section of an
along a complex transitional area that separates predominantly extensive Palos Verdes-Coronado-Agua Blanca fault system, but
transpressional structures to the north, from transtensional recently collected seismic reflection data have shown that the
structures to the south (Legg et al., 2015; Wetmore et al., 2019). Coronado Bank fault decreases in recency and continuity of
Faults within the ICB play an important role in transferring faulting offshore Oceanside, California, and does not have a clear
10-15% of plate motion from the Gulf of California around connection to the Palos Verdes fault (Figure 1B; Ryan et al., 2009;
the big bend in the San Andreas Fault and into the faults of Brothers et al., 2015). Therefore, any slip carried northward by
Frontiers in Earth Science | www.frontiersin.org 3 June 2021 | Volume 9 | Article 641346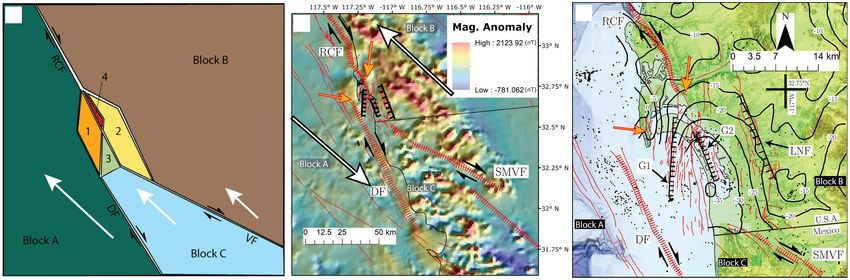
Singleton et al.                                                                                                   San Diego Bay Pull-Apart Basin

the Coronado Bank fault is likely transferred onto an adjacent            (Figure 1). The primary structural fabric in this area consists
fault structure (Conrad et al., 2018). The Descanso fault trends          of north-south oriented normal faults that run parallel to the
N25◦ W offshore San Diego (Figure 1), and its termination may             coastline, and secondary northeast-southwest and northwest-
mark the northern limit of the larger Estero-Descanso fault, but          southeast oriented normal faults. The north-south faults are
the exact location of the Descanso fault south of the international       dominantly down-to-the-east (Minch, 1967), similar to faults
border is poorly understood due to a “lack of good seismic data”          in San Diego Bay. Pleistocene deposits are offset and folded
(Legg, 1985).                                                             along several faults, but most deformation appears to have
   Reprocessed industry MCS profiles suggest that at the latitude         occurred during the Miocene (Minch, 1967). The Pleistocene
of San Diego Bay, the Descanso fault is an eastern strand of the          Avondale Terrace, mapped by Ellis and Lee (1919), is at an
larger Coronado Bank fault system (Maloney, 2013). Hanging                elevation of 106–121 m and is offset by faults in the Los
wall rollover imaged in MCS data along the eastward-dipping               Buenos fault zone, but north of the Tijuana River valley the
Coronado Bank fault indicates a degree of soling at depth that            same terrace is at 60 m elevation and is not offset by faulting
may be a consequence of participation in the San Diego Bay pull-          (Gastil et al., 1979).
apart basin (Maloney, 2013). Combined high-resolution Chirp
and MSC data show that the Descanso-Coronado Bank fault
zone reaches its locally greatest width adjacent to the deepest           The Rose Canyon Fault Zone and San
portion of the San Diego Bay pull-apart basin where it displaces          Diego Bay
the transgressive surface (Maloney, 2013). Northward, the fault           North of San Diego, the Rose Canyon fault trends ∼S25◦ E
zone narrows and Chirp data indicate a non-faulted transgressive          from offshore Oceanside and extends for 35 km south to
surface, suggesting a northward decrease in activity on the               La Jolla, where the fault takes a leftward compressional bend
Descanso fault (Maloney, 2013). Recent faulting is observed on            uplifting Mt. Soledad before continuing on a similar trend
the Coronado Bank fault until it reaches and becomes buried by            south along the I-5 corridor towards San Diego Bay (Figure 1).
the La Jolla Fan (Ryan et al., 2009). Several earthquakes (M < 4)         The Rose Canyon fault has ∼4 km of total offset based on
have been located between the Coronado Bank fault and the                 the displaced Eocene Mt. Soledad Formation and is thought
Rose Canyon fault, providing additional evidence of a connection          to have initiated in Pliocene-Quaternary time as the upper
between these two fault systems (Figure 1C; Astiz and Shearer,            portion of the late-Pliocene age San Diego Formation is
2000; Hauksson et al., 2012; Ross et al., 2019).                          a tectono-stratigraphic unit that records the down-dropping
                                                                          and sedimentation in San Diego Bay (Demere, 1983; Kies,
The San Miguel-Vallecitos Fault and                                       1982; Treiman, 1993). The San Diego Formation is overlain
                                                                          by a series of marine terraces of Pleistocene age that are
Associated Strands                                                        locally deformed in the San Diego region in response to
The San Miguel-Vallecitos fault is composed of en-echelon fault           movement on regional faults (Kern and Rockwell, 1992;
sections that trend northwest across the Baja Peninsula and is            Haaker et al., 2016).
well-aligned to connect with the Rose Canyon fault (Figure 1).                Just north of downtown San Diego, the Rose Canyon fault
Mapped offsets of magmatic dikes suggest a small (∼600–                   splays out into a complex network of faults that make up the San
1000 m) total offset, while slip rate estimates vary considerably,        Diego Bay pull-apart basin (Figures 1C, 2). The northernmost
with geologic estimates (∼0.2 mm/yr) significantly lower than             splay trends offshore into northern San Diego Bay as the Spanish
geodetic estimates (∼2–4 mm/yr) (Hirabayashi et al., 1996; Dixon          Bight fault (Figures 1C, 2). Through downtown, the Rose Canyon
et al., 2002; Wilson et al., 2011). Together, these characteristics       fault zone is mapped as the western San Diego fault and an
(i.e., short en-echelon segments, small total offset, and order of        eastern zone of faulting that includes the “downtown graben”
magnitude difference between geologic and geodetic slip rates)            (Figure 2; Treiman, 1993, 2002; Weidman et al., 2019). These
may be an indication of the fault’s incipient nature. The San             splays trend into the bay as the Coronado and Silver Strand faults,
Miguel-Vallecitos fault is active, hosting several M > 6 surface          respectively (Figures 1C, 2). Gravity measurements indicate
rupturing earthquakes in the past century and high rates of               that San Diego Bay overlies a northwest-oriented, ∼20-km-long,
microseismicity (Figure 1B; Hirabayashi et al., 1996; Frez et al.,        ∼12-km-wide, and 2–3-km-deep basin that reaches its greatest
2000). The mapped trace of the San Miguel-Vallecitos fault ends           depth beneath south San Diego Bay (Marshall, 1989). The faults
∼30 km south of San Diego Bay, but previous studies have                  in the northwestern bay (the Spanish Bight, Coronado, and Silver
postulated a connection to the Rose Canyon fault zone based               Strand faults) are well-defined and well-imaged. These faults have
on the alignment of warm water wells, elongated north-south               a north-northeasterly surface trend and have been mapped from
trending depressions (possible sag ponds), offset terraces, and           the northern portion of San Diego Bay, across the Coronado
stratigraphic and lithological changes across the proposed fault          Peninsula, and offshore to at least the United States-Mexico
lineament (Wiegand, 1970; Gastil et al., 1979; Treiman, 1993).            border, where poor data quality prevented the establishment of
Youthful faulting may be obscured by fluvial sedimentation along          a southern continuation (Figures 1C, 2; Legg, 1985; Maloney,
the Tijuana River and its tributaries.                                    2013). These three ‘linking’ faults all show predominantly down
    Faults west of the Tijuana River valley, in northwestern              to the east displacement in seismic data and displace sediment
Tijuana, Mexico, have been studied in detail by Minch                     close to the bay floor with potential displacement of the bay floor
(1967) and are referred to as the Los Buenos fault zone                   on some strands (Maloney, 2013).

Frontiers in Earth Science | www.frontiersin.org                      4                                      June 2021 | Volume 9 | Article 641346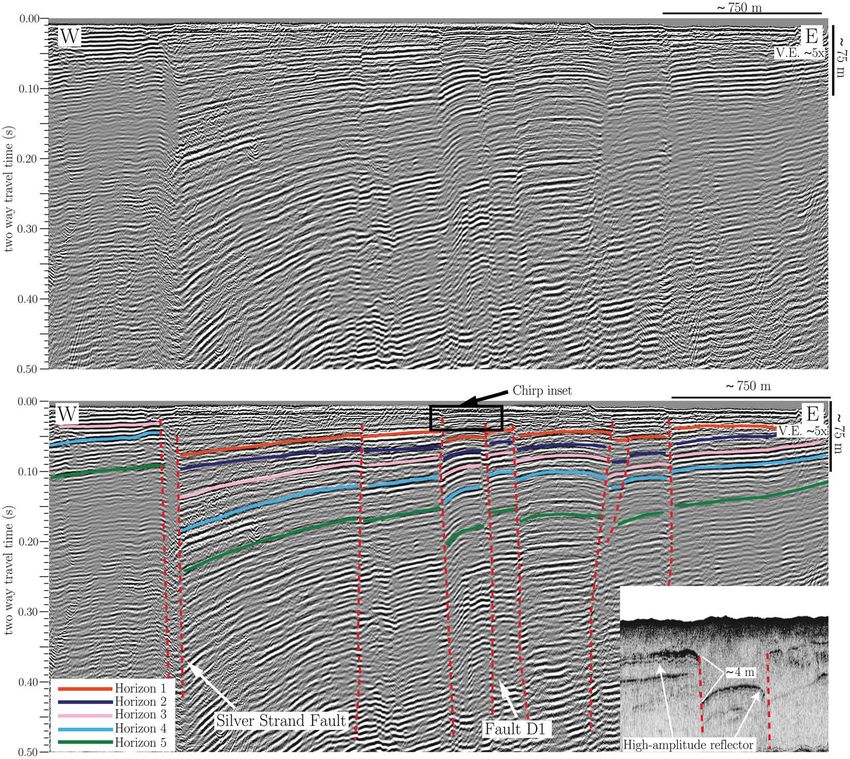
Singleton et al.                                                                                                                          San Diego Bay Pull-Apart Basin

  FIGURE 2 | Map of San Diego Bay showing previously mapped fault traces from USGS Quaternary fault database (red lines) (USGS, 2019), seismic data used in this
  study (yellow and black lines), and extended fault traces as part of this study (white lines). Bolded seismic lines are the location of figures presented in the text.
  Dashed red fault lines are older Quaternary fault traces, dashed white fault traces are obscured, but inferred fault traces. Figure created using Generic Mapping Tools
  (Wessel et al., 2019).

   South of the Silver Strand fault, in the southeastern portion of                     collected 130 km of MCS lines with a 14-cubic-inch sleeve-
San Diego Bay, is a series of north-northwest trending faults that                      gun source, 24-channel streamer, and 3.125-m shot spacing.
also exhibit normal motion with down-to-the-east displacement                           Unfortunately, all of the original computer data (stored on
(Figure 2). These southeastern bay faults appear to lie outside                         magnetic tape files) were destroyed in a warehouse fire before
of the Rose Canyon-Descanso pull-apart basin. East of San                               they could be transferred to modern digital format, including
Diego Bay, the La Nacion fault zone is composed of north-south                          the original navigation files. Thus, the only surviving copies
oriented, west-dipping, anastomosing normal faults (Figure 1C)                          of the MCS data were thought to be working paper copies
with more than 60 m of vertical offset of the Pliocene San Diego                        (owned by the original investigators) and the figures included
Formation (Hart, 1974). Holocene activity has not been observed                         in the final report filed with the City of San Diego and the
in paleoseismic excavations (Hart, 1974), and the long-term slip                        California Division of Mines and Geology (Kennedy and Clarke,
rate is likely very low (Anderson et al., 1989). The La Nacion fault                    1996). However, a spring-cleaning effort at the offices of the
has traditionally been interpreted as the eastern boundary of the                       United States Geological Survey-Menlo Park unearthed a set of
San Diego Bay pull-apart basin.                                                         the original magnetic tape copies of the MCS lines collected in
                                                                                        San Diego Bay. These lines were transcribed to modern digital
                                                                                        format and reprocessed through the Shearwater Reveal software
METHODS AND DATASETS                                                                    package (Reveal., 2019).
                                                                                           The original 24-trace shot gathers were sampled at 250 ms
The MCS data used in this study were collected as part of a                             with a total length of 0.75 s. Linear moveout and f-k filters
seismic hazard assessment of the Coronado Bridge in the mid-                            were applied to shot gathers to reduce linear coherent noise
1990s (Kennedy and Clarke, 1996; 1999). The original survey                             and energy from refracted arrivals at longer offsets, which were

Frontiers in Earth Science | www.frontiersin.org                                    5                                               June 2021 | Volume 9 | Article 641346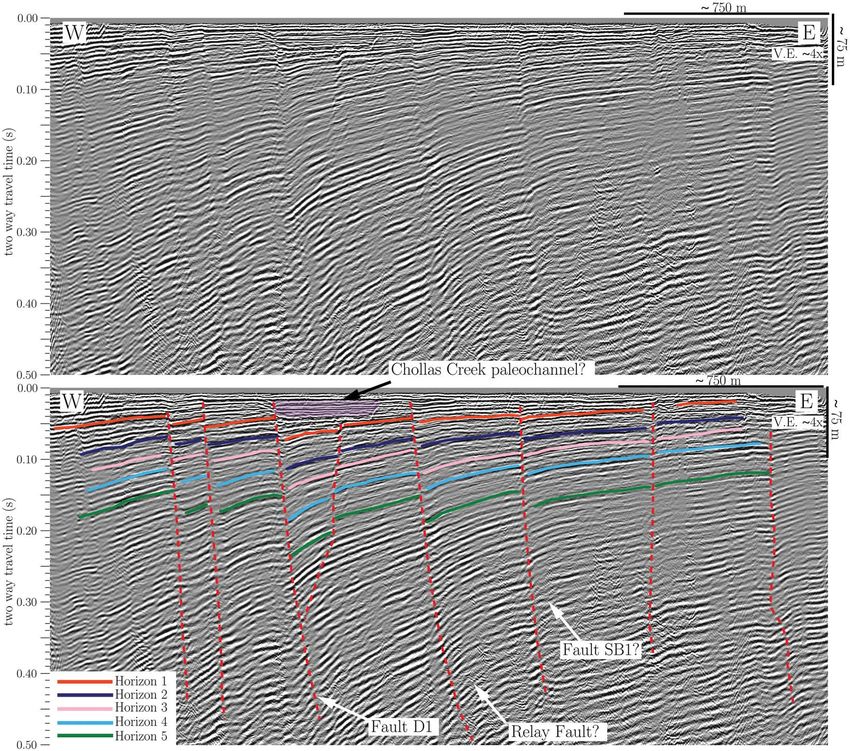
Singleton et al.                                                                                                 San Diego Bay Pull-Apart Basin

especially prevalent in shallow San Diego Bay and in portions of        by accelerated mass spectrometry at the University of California-
the bay proximal to large cement structures such as Naval docks.        Irvine Keck Carbon Lab. An age model was constructed using
Next, shot gathers were sorted into common-mid-point (CMP)              OxCal v4.3.2 and Marine Calibration Curve 13 (Reimer et al.,
gathers using a 3.125-m bin spacing (12-fold). Velocity analysis        2013; Bronk Ramsey, 2017) with a local reservoir age of 171 +
was performed every 100 CMPs by maximizing semblance for                154 years before present (Holmquist et al., 2015).
supergathers constructed using 15 CMPs, and the resulting                  To develop kinematic models of the San Diego Bay pull-
velocity models were used to apply normal moveout corrections           apart basin, the surface trends of faults potentially involved
(NMO). Following NMO corrections, water-bottom and stretch-             with the San Diego Bay pull-apart basin were measured
mutes were applied, and the traces were stacked. Lastly, Stolt          within 1.5 × 1.5 km grid cells from an overlay of a recent
migration was applied to stacked sections using a constant              fault map (Kennedy and Tan, 2005). Averages of fault trends
velocity of 1600 m/s. Reprocessing the older MCS data with              were calculated using Fisher statistics. Assuming plate motion
improved computational techniques dramatically improved the             provides boundary conditions, and deformation of a continuum
imaging at depth allowing for better characterization of fault          provides the best kinematic analysis (Jackson and McKenzie,
geometry and stratigraphy.                                              1983; Fossen and Tikoff, 1993), the relationship between plate
   The magnetic tapes did not include navigation for the MCS            motion, instantaneous strain axes, and degree of strike-slip
lines, so the locations were determined from the figures included       partitioning were used to distinguish between two end-members:
in the original paper report (Kennedy and Clarke, 1996). To             wrench (simple-shear) dominated and pure-shear dominated
rectify the MCS lines, the figures were scanned and georeferenced       deformation (Fossen and Tikoff, 1993).
in ESRI ArcMap, then the individual MCS lines were digitized.
The total length of each digitized line was divided into equal
spaced points at 3.125-m spacing (representing CMP gathers).            RESULTS
A comparison of previously mapped fault locations in the
norther portion of the bay (i.e., crossing the Spanish Bight            Observations From Nested MCS and
fault) showed good agreement with the same features imaged              Chirp Datasets With Age Control
in the reprocessed, georeferenced MCS profiles. However, due            Reprocessing the legacy MCS data resulted in good-quality,
to uncertainties in the digitization of the original figure, the        interpretable data down to ∼450–500 ms two-way travel time
final locations of some profiles likely carry a location error of       (twtt) and imaged many of the fault segments previously mapped
∼10–100 m. Given the uncertainty associated with the MCS                in San Diego Bay. The processed Chirp data resulted in sub-
navigation from georeferencing, higher precision fault locations        meter vertical resolution seismic images down to ∼50 ms twtt
are determined from Chirp profiles where possible.                      (∼40 m using a sonic velocity of 1500 m/s). Previous studies in
   In 2011, 2013, and 2019, high-resolution seismic reflection          San Diego Bay have delineated relatively narrow fault zones in the
data were collected in San Diego Bay using Scripps Institution          northwestern portion of the bay that trend north-south across the
of Oceanography’s Edgetech Chirp subbottom profiler, operated           width of the bay (e.g., the Spanish Bight, Coronado, and Silver
with a 30 ms sweep pulse of 1–15 kHz and a 50 ms sweep pulse            Strand faults) (Figure 2; Kennedy and Clarke, 1996; Kennedy,
of 0.7–3.0 kHz, providing sub-meter vertical resolution with sub-       1975; Maloney, 2013; USGS, 2019). The southeastern portion of
bottom penetration up to ∼40 m, and location accuracy within            the bay is characterized by short discontinuous fault segments
5 m. Chirp data were processed using SIOSEIS and Seismic Unix.          and is comparatively understudied (Kennedy and Clarke, 1996;
   Both the MCS and Chirp data were interpreted using IHS               USGS, 2019).
Kingdom Suite to examine changes in stratigraphy and fault                  With no tie-lines collected in the southern portion of
geometry. Gridded surfaces of mapped horizons were generated            the bay during the original MCS survey (Figure 2), we
for improved visualization. However, due to the geometry of             relied on several distinctive stratigraphic sequences to correlate
the original MCS survey, several large (∼1.0 km2 ) areas of             stratigraphy between survey lines that were spaced on average
the gridding interpolation are unconstrained (Figure 2). Survey         ∼400 m apart. Five distinctive sets of high-amplitude reflections
details and access to the reprocessed MCS dataset is available          separate packages of more chaotic to homogenous low-amplitude
through Singleton et al. (2021). The high-resolution Chirp data         reflections (Figure 3) and were used to divide the stratigraphy
are publicly available through the USGS National Archive of             into four main units. These five horizons were mapped across the
Marine Seismic Surveys (NAMSS; Triezenberg et al., 2016).               study area to observe changes in stratigraphic character. As the
   The original Coronado Bridge seismic hazard assessment               deepest map horizon, horizon 5 will have experienced the longest
included a transect of boreholes beneath the Coronado                   record of deformation associated with San Diego Bay pull-apart
Bridge that provided age constraints (radiocarbon, amino acid           basin (Figures 3, 4, and 5). Therefore, the horizon 5 gridded
stratigraphy, and paleontological analysis) on the underlying           surface is chosen to best represent the deformational record of
strata (Kennedy and Clarke, 1999). In the southern portion of           the San Diego Bay pull-apart basin during later discussions on
San Diego Bay, shore-based vibracores provide ground-truthing           basin evolution and fault models.
and age correlation for the southern Chirp profiles. The cores              In the northernmost portion of the bay, previous observations
were split, photographed, and described, before being scanned           are confirmed as both the Spanish Bight and the Coronado faults
for magnetic susceptibility to aid in stratigraphic correlation.        exhibit northerly trends and dip steeply to the east, with a down-
Samples from the sediment cores were dated for radiocarbon ages         to-the-east sense of displacements. The Silver Strand fault is a

Frontiers in Earth Science | www.frontiersin.org                    6                                      June 2021 | Volume 9 | Article 641346
Singleton et al.                                                                                                                              San Diego Bay Pull-Apart Basin

  FIGURE 3 | Multi-channel seismic (MCS) profile T196-098 showing large displacement across the Silver Strand fault and westward dip of stratigraphy into both the
  Silver Strand fault and Fault D1. West of the Silver Strand fault, stratigraphy is flat lying to gently west dipping. Large apparent offset across the Silver Strand fault
  and uniform character of reflectors west of the fault make stratigraphic correlations difficult and increase uncertainty in interpretations across the fault. Inset shows
  offset high amplitude irregular reflector interpreted to represent the MIS stage 5e Nestor Terrace. Shown in the bottom panel are the five horizons used to observe
  changes in stratigraphy across San Diego Bay. Profile location shown in Figure 2.

major fault in San Diego Bay and dips steeply east with ∼100 m of                          Two of these continuous faults (D1 and SB1) trend for longer
down-to-the-east displacement of the horizon 5 surface observed                            distances and exhibit larger vertical displacements than other
in the Glorietta Bay area (using ∼1500 m/s velocity) (Figure 3).                           fault segments in the southeastern portion of the bay (Figures 3–
However, poor data quality on the western side of the Silver                               6, Supplementary Figures 1, 3).
Strand fault hampered efforts to correlate stratigraphy across the                             Fault D1, previously mapped by Kennedy and Clarke (1996),
fault confidently, therefore a large uncertainty may be associated                         is located just south of the Coronado Bridge and trends ∼N10◦ W
with this estimate. Nevertheless, the amount of displacement on                            towards the Silver Strand tombolo. We confirm and extend
the Silver Strand fault appears to decrease northward towards                              its trace south from the Coronado Bridge towards the Silver
downtown San Diego (Figure 5).                                                             Strand tombolo (Figures 2–4, Supplementary Figures 1, 2,
   South of the Coronado Bridge, fault segments are generally                              moving north to south). Fault D1 dips steeply to the east
northwest trending, discontinuous, and exhibit a down-to-                                  for its entire length but changes its sense of slip from locally
the-east sense of displacement (Moore and Kennedy, 1975;                                   down-to-the-west in the north near the intersection with the
Kennedy and Clarke, 1996). Sporadic small (∼50–300 m                                       Silver Strand fault and the faults of the “downtown graben”
length), northeast-trending fault segments with variable senses                            (where its dip is nearly vertical) (Figure 3), to down-to-the-
of displacement are also observed. By combining the MCS and                                east southward (Figure 4 and Supplementary Figure 1). As first
Chirp datasets, the surface traces of short discontinuous fault                            noted by Kennedy and Clarke (1996), at the latitude of the
segments are extended to form longer continuous faults in south                            Coronado Bridge, Fault D1 forms a localized horst and graben
San Diego Bay (see Figure 2 for locations of seismic profiles).                            structure with the adjacent Silver Strand and downtown graben

Frontiers in Earth Science | www.frontiersin.org                                       7                                               June 2021 | Volume 9 | Article 641346
Singleton et al.                                                                                                                      San Diego Bay Pull-Apart Basin

  FIGURE 4 | MCS profile T196-088 showing distributed faulting associated with Fault D1, and potential relay fault structure between Faults D1 and SB1. Location
  shown in Figure 2.

faults (Figure 3). Faulting associated with D1 is distributed across                  away from the Chollas Creek drainage and is diverted upon
several closely spaced strands that are typically observed in the                     contact with the Fault D1, following the fault trace south towards
footwall of the main fault and appear to act as a localized nested                    the Silver Strand with the western channel bank potentially
graben to accomplish the down-to-the-east sense of motion                             aligning with an apparent paleo-scarp of Fault D1 (Figures 4, 7,
(Supplementary Figure 1). Towards the southern end of the                             Supplementary Figures 1–3). The paleochannel intersects with
mapped trace, fewer auxiliary strands are observed. Some strands                      the larger Sweetwater River paleochannel and together exits San
located in the hanging wall dip west and exhibit a down-to-the-                       Diego Bay through the Silver Strand tombolo (Figure 7). The
west sense of motion as a result of hanging wall collapse (Figure 4;                  exact location of where the paleochannels intersect the Silver
Kennedy and Clarke, 1996).                                                            Strand tombolo is unknown due to a gap in data coverage, but
   Increasing stratigraphic dips and progressively larger                             Chirp profiles indicate that these paleochannels did not flow
separations with depth are observed along D1 in the MCS data                          south of the current Sweetwater channel and likely exited San
(Figure 4 and Supplementary Figure 1). At the location of                             Diego Bay between Crown Cove and Fiddlers Cove (Figure 7).
Figure 4, observed down-to-the-east displacements across D1                               Potential recency of faulting for D1 is difficult to establish due
include a vertical separation of ∼22 m for horizon 1, ∼34 m                           to the shallow location of the water bottom multiple reflection
for horizon 2, ∼39 m for horizon 3, ∼48 m for horizon 4,                              in the Chirp data and a general lack of coherent reflectors in
and ∼64 m for horizon 5 (assuming a velocity of 1500 m/s).                            the water-saturated upper ∼5 ms of data. The high-amplitude
The gridded horizon 5 surface (Figure 5) shows that as Fault                          reflection surface that is displaced across Fault D1 (inset of
D1 extends away from the intersection with the Silver Strand                          Figure 3) and adjacent faults has been dated by amino acid
fault, the horizon surface reaches its locally greatest depth of                      stratigraphy and paleontological analysis to most likely correlate
∼163 m (assuming a 1500 m/s velocity) and begins to shallow                           with MIS stage 5e (Kennedy and Clarke, 1996), providing a
southward. A lens shaped channel feature is observed to extend                        maximum age of this offset of ∼125 ka. Additional radiocarbon

Frontiers in Earth Science | www.frontiersin.org                                  8                                            June 2021 | Volume 9 | Article 641346
Singleton et al. San Diego Bay Pull-Apart Basin
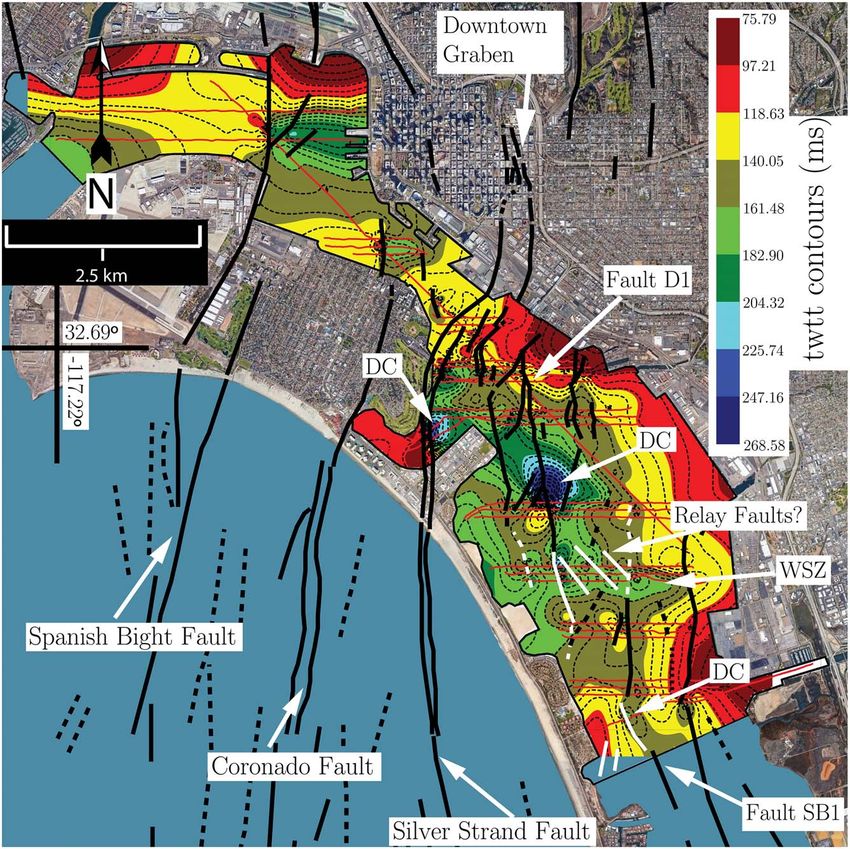
FIGURE 5 | Horizon 5 gridded surface representing depth to horizon 5 in two-way travel time (twtt). Faults from the USGS Quaternary fault database are shown as
black lines (USGS, 2019). White lines are the extended fault traces from this study. Localized depositional centers are seen adjacent to D1, SB1, and the Silver
Strand faults. A more westerly oriented area of subsidence (WSZ) is observed between Faults SB1 and D1, possibly corresponding to a potential relay fault structure.
Outside the study area, in the northeastern part of San Diego Bay local depositional centers are also observed adjacent Spanish Bight and Coronado faults. DC,
Depositional Center; WSZ, Western Subsidence Zone. Figure 5 is approximately collocated with Figure 2. Background satellite image from Google Earth
(earth.google.com/web).
dates from beneath the Coronado Bridge may suggest that this into the southern extreme of San Diego Bay (Figures 2, 8).
fault is Holocene active, but conclusive evidence is not present in The MCS data show progressively increasing vertical separation
the high-resolution Chirp profiles (Kennedy and Clarke, 1999). and stratigraphic dips with depth associated with Fault SB1.
To the southeast of Fault D1 is Fault SB1, which trends Observed down-to-the-east displacements across SB1 include a
∼N25◦ W and is aligned with the long axis of the bay (Figure 2). vertical separation of ∼11 m for horizon 1, ∼21 m for horizon
The fault dips steeply to the east and exhibits a down-to-the- 2, ∼25 m for horizons 3 and 4, and ∼32 m for horizon 5
east sense of motion (Figures 2, 4, 6, Supplementary Figures 1, (Figure 6). Additionally, growth strata terminating against the
3). The character and geometry of Fault SB1 is variable along fault are imaged in the high-resolution Chirp data (Figures 6, 8,
strike. In the south, displacement is concentrated onto a single and 9). The high-resolution Chirp data also show that the down-
fault and a few hanging wall splays (Figures 6, 8). As the fault to-the-east sense of displacement develops into a negative flower
trends northward, deformation becomes distributed onto a series structure towards the surface (Figure 6).
of sub-parallel fault strands that continue to express a down-to- Fault SB1 may offset a high-amplitude, irregular reflection
the-east sense of motion (Supplementary Figures 1, 3). To the that is spatially extensive throughout the southern portion of
east of Fault SB1, several MCS profiles image a fault with notable San Diego Bay, although the location of the bayfloor multiple
displacement (Figures 4, 6, Supplementary Figure 3), but the makes interpretations difficult (Figures 6, 8). At ∼0.01 s twtt,
surface trace appears to come in-and-out of the data coverage a high-amplitude reflection located above the spatially extensive
area, hindering a comprehensive observation. high-amplitude irregular surface appears to terminated against
The northern section of SB1 is observed in the high-resolution the projected trace of Fault SB1 (Figure 6). However, it is unclear
Chirp data to extend southward and connect to a previously if this truncated reflector is due to faulting, or the result of data
mapped fault segment, which extends beyond our data coverage resolution loss from fluid flow which is seen in the water column
Frontiers in Earth Science | www.frontiersin.org 9 June 2021 | Volume 9 | Article 641346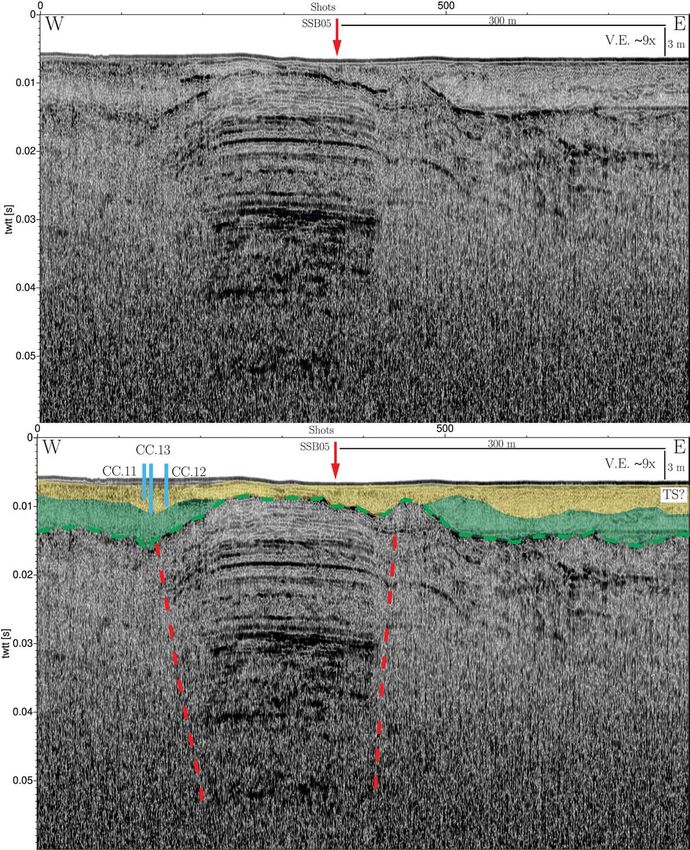
Singleton et al. San Diego Bay Pull-Apart Basin
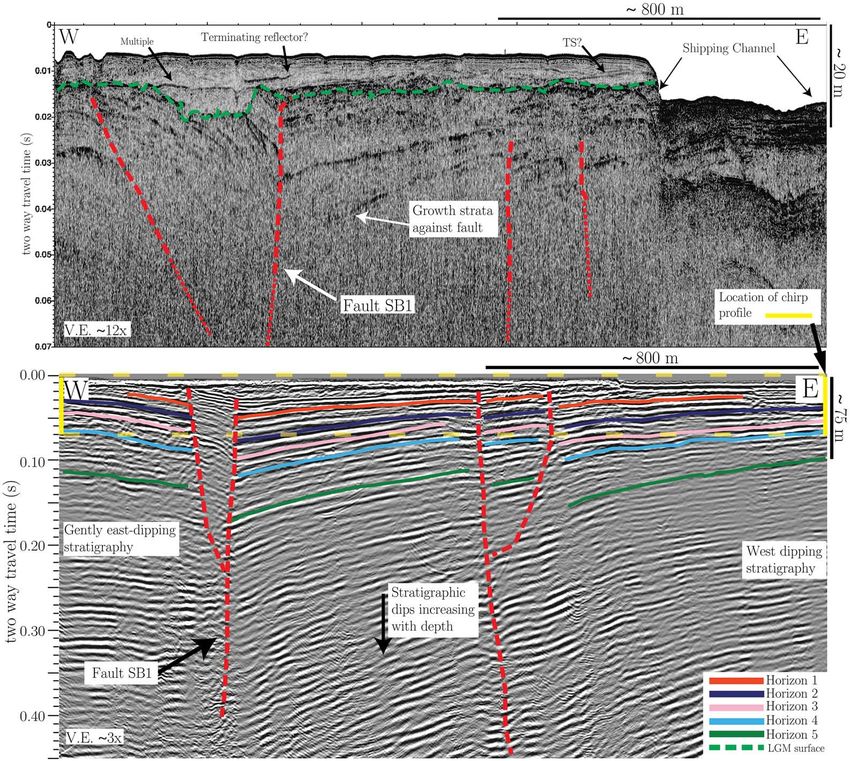
FIGURE 6 | Nested Chirp profile SSB03 (top profile) and MCS profile T196-a792 (bottom profile). Effect of Fault SB1 is seen as increasing dips with depth in the
MCS profile, and growth strata terminating against the fault in the Chirp profile. Green dashed horizon in Chirp profile is the interpreted subaerially exposed surface
from the Last Glacial Maximum sea level low-stand. Location shown in Figure 2. See Supplementary Figure 4 for unannotated profiles.
and has indented the seafloor above SB1. Therefore, although SB1 south-central portion of San Diego Bay, a smaller, more westerly
appears to exert some control on the geometry of the shallow oriented area of subsidence is located between the overlapping
(∼8 ms twtt) high-amplitude, irregular reflection, no definitive tips of Fault D1 and Fault SB1 (Figure 5). This localized area
evidence of Holocene movement is observed (Figure 6). of subsidence (WSZ in Figure 5) appears to correspond with
a decrease in subsidence associated with Fault SB1 moving
northward, and Fault D1 moving southward.
Subsurface Architecture From Gridded Stratigraphic dips are variable across the three main faults in
Horizon Surface south San Diego Bay. In the vicinity of the Coronado Bridge,
The gridded horizon 5 surface shows that the stratigraphy the Silver Strand fault separates moderate to steeply westward-
of southern San Diego Bay generally dips towards the west dipping stratigraphy in the east, from gently flat-lying to gently
with several depositional basins formed by down-to-the-east westward dipping stratigraphy to the west (Figure 3). Moving
movement along the Silver Strand, D1, and SB1 faults (Figure 5). southward the stratigraphy of the eastern portion of the bay
Along Fault D1, subsidence reaches its greatest depth just south continues to dip west, but Fault D1 begins to accommodate
of the intersection with the Silver Strand fault and faults of more of the subsidence, and strata are observed to dip more
the downtown graben, a pattern similar to that observed along steeply into D1 than in the north (Figures 3, 4, Supplementary
the Silver Strand fault (Figure 5). Amino acid stratigraphy Figure 1). Similar to the Silver Strand fault, the stratigraphy
and paleontological analysis of material collected adjacent to west of Fault D1 continues to dip gently westward. South of the
the Coronado Bridge suggests the presence of mid-Pleistocene localized area of more westerly oriented subsidence between D1
deposits at a depth of at least ∼140 m, a depth similar to and SB1, in the south-central portion of the bay, this pattern of
the interpreted depth of horizon 5 in that area (assuming a westward dips across faults shifts (Figure 5). The stratigraphy
1500 m/s velocity) (Figure 5; Kennedy and Clarke, 1999). In the in the eastern portion of the bay continues to dip westward
Frontiers in Earth Science | www.frontiersin.org 10 June 2021 | Volume 9 | Article 641346Singleton et al. San Diego Bay Pull-Apart Basin
are within 10-50 m of the shore and offer an opportunity
for low-cost, shore-based coring to ground truth the Chirp
data. Three cores were collected on a sand spit that has
built out ∼80 m since dredging of the area in 1945
(Figures 10, 12, Supplementary Figure 5). Based on a
1941 aerial photograph (Supplementary Figure 5d) and 1927
Nautical Chart (Supplementary Figure 5e), this location was
the pre-development shoreline on a subaerially exposed salt
marsh or tidal flat.
The lithology of the cores consists of three main units
(Figure 12). The upper ∼3 m of the cores (unit one) is composed
of medium- to fine-grained clastic sands with abundant broken
shell fragments. The lower portions of this upper unit varies
between cores, with CC11 and CC13 exhibiting peaty-sand
deposits overlying a silty-sand section and core CC12 exhibiting
cross-bedding of medium- to fine-sands. The cross-bedding is
interrupted at ∼140 cm depth by a ∼1 m thick section of chaotic
sands that lack internal bedding and appear to deflect individual
foreset beds vertically towards the top of the core (Figure 12).
At a depth of ∼285 cm in CC13 and ∼308 cm in CC12, a sharp
FIGURE 7 | Gridded surface showing base of paleochannel horizon observed
contact separates the coarser sands above from clayey-silts below,
in combined MCS and Chirp dataset (e.g., Figures 4, 9, Supplementary
Figures 2, 3). Previously mapped faults are shown in black (USGS, 2019), forming the second unit. The clayey-silts are generally dark-grey
newly mapped faults in white. Purple dashed lines are the approximate to very-dark-grey with scattered medium- to fine-sand stringers
locations of paleochannels. Grey lines are locations of Chirp profiles. FC, and shells, both fragmented and whole. The lowest portion of the
Fiddlers Cove; CC, Crown Cove. Background satellite image from Google cores consists of alternating medium-coarse sand and dark-grey
Earth (earth.google.com/web).
silt deposits that give way to oxidized coarse sand as seen in cores
CC13 and CC12, at a depth of 365 cm and 350 cm, respectively
(Figure 12). The contact between the oxidized basal sands and
but becomes more concentrated onto Fault SB1. The steepness marine silts is sharp and forms the beginning of the third unit.
of dips progressively increases from north to south along SB1, Datable material collected throughout the bottom two units gives
with the steepest dips observed along the southernmost profile an approximate age of ∼1.3 ka before present (BP) for the age of
(Figures 4, 6). Interestingly, the stratigraphy on the west side of this lithology change (transition from the second to third unit)
SB1 changes from gently flat lying (Supplementary Figure 3) to (Figure 12, Supplementary Figure 6).
slightly eastward dipping southward (Figure 6). In the Chirp data (Figure 10), a medium- to high-amplitude
The spatial width of faulting is also variable along strike. reflection surface is seen diverging from the pop-up structure
Near the intersection between the Silver Strand, downtown at the depth corresponding to this change in lithology from
graben faults, and Fault D1, faulting is confined to a relatively basal sand to dark-grey clayey-silts (i.e., contact between units
narrow zone (Figures 5, 3). Southward of this intersection, the two and three). This surface is separated from the deeper
spatial width between the main fault strands and the number high-amplitude, irregular reflection that is spatially extensive
of associated strands increases towards the central part of the in the southern bay by a transparent homogenous package
bay (Figure 4). This trend appears to reverse with faulting infilling the accommodation space that was potentially created
becoming more concentrated into a narrower spatial zone by the by movement on the pop-up structure faults. To the east of the
southernmost MCS line (T196-a792; Figure 6), with a majority of cores, the medium- to high-amplitude reflection that corresponds
the displacement observed on Fault SB1 and a couple of adjacent to the lithology change observed in the cores appears to merge
fault strands in the MCS data. with the high-amplitude irregular reflection surface as part
In the southwest corner of the study area (Crown Cove) of the pop-up structure, and may then diverge again to the
(Figure 2), Chirp data image two subparallel northeast-trending east (Figure 10).
auxiliary faults that extend from beneath the Silver Strand Line SSB05 (Figure 11) runs north-south perpendicular
∼500 m into the bay to form a localized pop-up structure to SSB02 (Figure 10) and images the western strand of the
(Figures 10, 11). The western strand appears to displace pop-up structure faults. SSB05 also images a small portion
sediment within ∼2 ms twtt of the bay floor and displaces the of the undredged San Diego Bay and shows a mostly
locally extensive high-amplitude, irregular reflection surface by homogenous sediment package overlying the high-amplitude
approximately 5.7 m (Figure 11). irregular reflection surface. The western strand of the pop-
up structure displaces sediment that may correspond to the
Shallow Subsurface Shoreline Lithology basal lithology changed observed in the Crown Cove cores
In the Crown Cove area (Figure 2 and Supplementary Figure 5), (Figure 12), which would indicate movement in the past
both the Chirp profiles and the northeast trending faults ∼1,300 years.
Frontiers in Earth Science | www.frontiersin.org 11 June 2021 | Volume 9 | Article 641346Singleton et al. San Diego Bay Pull-Apart Basin FIGURE 8 | Fence diagram of southernmost Chirp lines that image Fault SB1. Vertical white dashed line is trace of SB1. Green dashed horizon is the interpreted subaerially exposed surface from the Last Glacial Maximum sea level low-stand. Inset shows look direction and location of Chirp profiles. FIGURE 9 | Chirp profile SSB06 across the Sweetwater paleochannel. Red dashed line is location of Fault SB1. Green dashed horizon is the interpreted subaerially exposed surface from the Last Glacial Maximum sea level low-stand. Purple unit is interpreted channel-fill deposit. Location shown in Figure 7. Structural Analysis Canyon-Descanso fault pull-apart basin model can predict the Traditional conceptual models for pull-apart basins cannot fully orientation of faults in the northwestern portion of the basin explain the deformation patterns and fault geometry we observe (the Spanish Bight, Coronado, and Silver Strand faults; Figure 2), in the San Diego Bay pull-apart basin (Figure 13). A Rose whose strikes are oriented at ∼30–40◦ to the master strike-slip Frontiers in Earth Science | www.frontiersin.org 12 June 2021 | Volume 9 | Article 641346
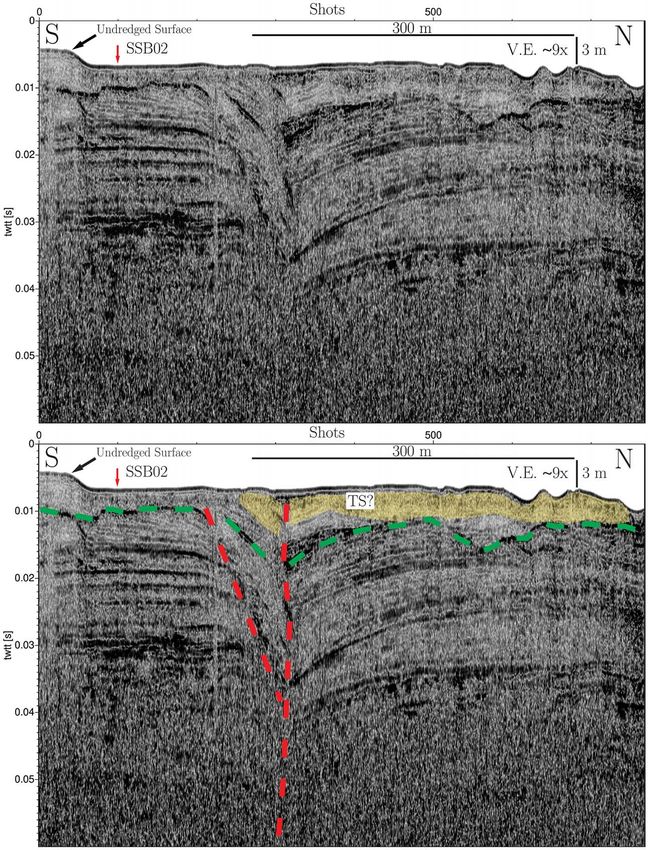
Singleton et al.                                                                                                                         San Diego Bay Pull-Apart Basin

  FIGURE 10 | Chirp profile SSB02 with core correlation in the Crown Cove area. Red dashed lines are faults forming a potential pop-up structure. Green dashed
  horizon is the interpreted subaerially exposed surface from the Last Glacial Maximum sea level low-stand. Green unit represents deposition from the last sea level
  low-stand until inundation (transgressive deposit) and yellow unit represents estuarine/marine deposition following inundation of the bay (high-stand deposit) (TS,
  Transgressive Surface). Boundary between green and yellow units is interpreted as the transgressive / inundation surface. Red arrow marks location of north-south
  oriented SSB05 profile (Figure 11). See Supplementary Figure 5a for location.

faults. However, the northwest trending faults in the southeastern                      Clarke, 1999). Group-1 faults have an average strike of N1.5◦ E
portion of the bay, as well as the La Nacion fault, are oriented                        (Supplementary Table 2). The north-northwesterly trending
at a low angle to the Rose Canyon fault (Supplementary Table 2                          faults in the southeastern part of San Diego Bay (including
and Figure 13), conflicting with a classical pull-apart basin model                     Fault D1 and SB1 and hereafter referred to as Group-2 faults;
and suggesting the possibility for additional influences from other                     Figure 13) have an average strike of N22.7◦ W. Faults in
regional faults. Therefore, toward developing a more accurate                           the La Nacion Fault zone have an average strike of N8.7◦ W
model for the San Diego Bay pull-apart basin, we conduct a                              (Supplementary Table 2).
kinematic analysis using the regional fault orientations and plate                         Supplementary Table 2 provides the average surface trends
boundary conditions to explain the observed faulting in terms of                        represented in Figure 13. We assume that observed surficial
two end member models, simple shear dominated and pure shear                            faulting of the principal displacement zones (i.e., the Rose
dominated transtension.                                                                 Canyon, the Descanso, and the San Miguel-Vallecitos faults)
   The north-northeasterly trending oblique faults in the                               is representative of faulting in the basement. The maximum
northwestern half of the San Diego Bay pull-apart basin (hereafter                      horizontal compressional stress orientation, σc , is assigned N7◦ E
referred to as Group-1 faults; Figure 13) have three primary                            (Hardebeck and Hauksson, 1999, 2001) and the maximum
splays: the Spanish Bight, Coronado, and Silver Strand faults                           horizontal extension direction, σe , is assumed to be 90◦ to
(Figures 1, 2) (Kennedy and Welday, 1980; Kennedy and                                   σc (Figure 13).

Frontiers in Earth Science | www.frontiersin.org                                   13                                             June 2021 | Volume 9 | Article 641346
Singleton et al.                                                                                                                        San Diego Bay Pull-Apart Basin

  FIGURE 11 | Chirp profile SSB05 from the Crown Cove area showing displacement associated with western pop-up structure fault. Red dashed lines are faults.
  Green dashed horizon is the interpreted subaerially exposed surface from the Last Glacial Maximum sea level low-stand. Yellow unit is the interpreted
  estuarine/marine high-stand deposit, with the base representing the transgressive / inundation surface (TS, Transgressive Surface). Red arrow marks the location of
  the east-west oriented SSB02 profile (Figure 10). See Supplementary Figure 5a for location.

   The Group-1 trend is nearly parallel to σc , perpendicular                          These values are in close
                                                                                                               agreement to the predicted value of
to σe , and is oriented ∼40◦ to the average trend of the Rose                          54◦ for θ, using θ = 1 2 (α + 90) (Tikoff and Teyssier, 1994).
Canyon and Descanso faults. This geometry is well described                            Furthermore, these values for α and θ also indicate that the
by both analog and numerical models of pull-apart basins (e.g.,                        proposed Rose Canyon-Descanso basin would be simple shear
Dooley and McClay, 1997; Dooley and Schreurs, 2012; van                                dominated, with ∼80% of the deformation between the Rose
Wijk et al., 2017). Testing our observations with kinematic                            Canyon fault and the Descanso fault being accommodated
models yields a similar result. Following the method of Teyssier                       through normal faulting (from Figure 3 of Teyssier et al.,
et al. (1995), we assign α to be the angle between the plate                           1995). Figure 14B represents our conceptual model to explain
margin and plate motion vector (N43◦ W), and θ to be the angle                         the orientation of Group-1 faults in terms of a Rose Canyon-
between the direction of maximum instantaneous horizontal                              Descanso fault connection.
extension (assumed to be coaxial with σe ) and the plate margin.                          Although no definitive evidence for a connection between
Assuming that the average trend of the Rose Canyon–Descanso                            the Rose Canyon fault and San Miguel-Vallecitos fault has
fault (∼N26◦ W) acts as the plate margin boundary for the San                          been published, it’s possible that based on strike orientations,
Diego Bay pull-apart basin, we find that α = 17◦ and θ = 57◦ .                         that the structure of the Group-2 and La Nacion faults are

Frontiers in Earth Science | www.frontiersin.org                                  14                                             June 2021 | Volume 9 | Article 641346
Singleton et al. San Diego Bay Pull-Apart Basin
partially controlled by the San Miguel-Vallecitos fault, with its
northernmost segment, the Vallecitos fault, mapped ∼30 km
southeast of San Diego Bay. The Group-2 and La Nacion fault
zones are oriented at 27◦ and 41◦ degrees to the San Miguel-
Vallecitos fault, which trends ∼N50◦ W. If we assume dextral
motion along a Rose Canyon–San Miguel-Vallecitos system,
rather than the Rose Canyon–Descanso system, provides plate
boundary conditions for Group-2 faults, we can apply the
same ideas to test for kinematic relationships. This geometry
yields values of α = 5◦ and θ = 45◦ , which are in close
agreement with the predicted value of θ = 50◦ (Tikoff and
Teyssier, 1994). This geometry would imply that the eastern
San Diego pull-apart basin would be strongly simple shear
dominated with 0% strike-slip partitioning (from Figure 3 of
Teyssier et al., 1995).
However, the oblique angle of Group-2 faults and the La
Nacion fault system to the maximum compressional stress σc
(Figure 13) may be an indication that the maximum horizontal
extensional stress direction, σe , is not the best representation of
the minimum instantaneous shortening direction for the eastern
portion of the San Diego Bay pull-apart basin (Figure 13).
Alternatively, if we assume that the minimum instantaneous
shortening direction is oriented perpendicular to the average
trend of Group-2 faults, we determine a value of α = 5◦ and
θ = 75◦ , which would indicate a strongly simple shear dominated
basin but with 90% strike-slip partitioning (from Figure 3 of
Teyssier et al., 1995). Assuming that the minimum instantaneous
shortening direction is perpendicular to the average trend of the
La Nacion fault zone, we find that α = 5◦ and θ = 61◦ , again
indicating a strongly simple-shear component to deformation but
with slightly less strike-slip partitioning at 80% (from Figure 3
of Teyssier et al., 1995). Either way, the observed geometry in
Figure 13 and the kinematic analysis suggests that Group-2
faults are experiencing simple-shear transtension influenced by
the San Miguel-Vallecitos fault system. The difference between
Group-2 and La Nacion trends may be attributed to a mid-
basin transition zone, where the western margin of Group-
2 is influenced by the Rose Canyon-Descanso stepover, but
the La Nacion fault zone is oriented optimally if a stepover
exists between the San Miguel-Vallecitos fault and Rose Canyon
faults (Figure 14C).
DISCUSSION
Subsurface Architecture, Fault Linkage,
and Stratigraphic Controls Beneath San
Diego Bay
FIGURE 12 | Crown Cove cores. Shown is core photographs, a simplified
lithology, and magnetic susceptibility (max value indicated when beyond
To begin a discussion on the subsurface architecture and
scale). Yellow dots are sample locations for radiocarbon dating (yrs BP, years fault structure beneath San Diego Bay we first interpret the
Before Present and is expressed as years before 1950 CE). Transition from mapped horizons presented in the seismic reflection data. Based
post 1940s dredge surface and natural estuarine/marine deposit can be seen on the observation that the high-amplitude reflections in the
in cores CC-13 (∼285 cm) and CC-12 (∼305 cm) and mark the beginning of Chirp data correspond to the depth of a dated marine terrace
unit two. Oxidized sands (unit three) interpreted to represent subaerial
exposure is observed at the bottom of cores CC-12 and CC-13. Location of
(Figure 3; Kennedy and Clarke, 1999), we interpret the five high-
cores is shown in Supplementary Figure 5a. amplitude horizons mapped in the MCS data (Figures 3, 4, 6,
Supplementary Figures 1, 3) to also represent periods of
Frontiers in Earth Science | www.frontiersin.org 15 June 2021 | Volume 9 | Article 641346You can also read