Do pandemics lead to rebellion? Policy responses to COVID-19, inequality, and protests in the USA - WIDER Working Paper 2021/57 - UNU-WIDER
←
→
Page content transcription
If your browser does not render page correctly, please read the page content below
WIDER Working Paper 2021/57

Do pandemics lead to rebellion? Policy
responses to COVID-19, inequality, and protests
in the USA

Francesco Iacoella,1 Patricia Justino,2 and Bruno Martorano3

March 2021
Abstract: This paper analyses how inequality across counties in the United States of America has
shaped the impact of the COVID-19 pandemic on the incidence of protests. The empirical analysis
combines weekly data between January and December 2020 on levels of COVID-19-related policy
stringency and protest incidence at the county level with measures of county-level inequality at the
start of the pandemic. The results show that more stringent measures to contain the pandemic
were instrumental in driving the incidence of protests, but only in counties with high levels of
inequality before the start of the pandemic, where grievances may have been initially stronger.
Further analysis suggests that the impact of government responses to the COVID-19 pandemic is
largely explained by changes in economic conditions (rise in unemployment and changes in
economic activities and spending) in counties with the highest levels of inequality. Unequal
counties with lower trust in political institutions but higher levels of social trust and civic
engagement at the start of the pandemic are also more likely to experience more protests as a
response to more stringent policies.
Key words: I18, D63, D70
JEL classification: COVID-19, lockdown, protests, inequality
Note: figures and tables at the end

This study is published jointly with UNU-MERIT in the respective working paper series.

1UNU-MERIT, Maastricht, The Netherlands; 2 UNU-WIDER, Helsinki, Finland; 3 Maastricht University and UNU-MERIT, The
Netherlands, corresponding author: bruno.martorano@maastrichtuniversity.nl
This study has been prepared within the UNU-WIDER project Institutional legacies of violent conflict.
Copyright © UNU 2021
UNU-WIDER employs a fair use policy for reasonable reproduction of UNU-WIDER copyrighted content—such as the
reproduction of a table or a figure, and/or text not exceeding 400 words—with due acknowledgement of the original source,
without requiring explicit permission from the copyright holder.
Information and requests: publications@wider.unu.edu
ISSN 1798-7237 ISBN 978-92-9256-995-2
https://doi.org/10.35188/UNU-WIDER/2021/995-2
Typescript prepared by Siméon Rapin.
United Nations University World Institute for Development Economics Research provides economic analysis and policy advice
with the aim of promoting sustainable and equitable development. The Institute began operations in 1985 in Helsinki, Finland, as
the first research and training centre of the United Nations University. Today it is a unique blend of think tank, research institute,
and UN agency—providing a range of services from policy advice to governments as well as freely available original research.
The Institute is funded through income from an endowment fund with additional contributions to its work programme from
Finland, Sweden, and the United Kingdom as well as earmarked contributions for specific projects from a variety of donors.
Katajanokanlaituri 6 B, 00160 Helsinki, Finland
The views expressed in this paper are those of the author(s), and do not necessarily reflect the views of the Institute or the United
Nations University, nor the programme/project donors.

1 Introduction

Understanding the causes and consequences of protests and organized collective dissent has been
a longstanding question in political economy. This literature has identified several determinants of
protests, ranging from economic and social exclusion to political ideology, push back against
repression, and the expansion of social media (Tarrow 1998; Chenoweth and Stephan 2008;
Sangnier and Zylberberg 2017; Steinert-Threlkeld 2017; Larson et al. 2019; Rozenas and Zhukov
2019; Enikolopov et al. 2020; Fergusson and Molina 2020; Manacorda and Tesei 2020; Wasow
2020).

One of the earliest and most prominent theories of civil unrest focuses on the role of economic
inequality in motivating deprived groups and individuals to protest (Gurr 1970; Lichbach 1989;
Boix 2008). However, empirical analyses of the direct impact of inequality on protests have
generated ambiguous results (Nollert 1995; Dubrow et al. 2008; Solt 2015), and we have only
limited understanding of what triggers may lead those at the bottom of the income distribution to
protest. We know even less about the causal mechanisms that may explain a possible relationship
between inequality and protests. This paper seeks to address these questions in the context of the
ongoing COVID-19 pandemic.

The global COVID-19 pandemic offers a unique opportunity to study the relationship between
inequality and protests. This pandemic is a global disaster that has taken the world by surprise. At
the time of writing, almost 120 million people worldwide have been diagnosed with the virus and
over 2.5 million have died because of it. First identified in China’s Wuhan region in December
2019, the virus Sars-Cov-2 (the cause of COVID-19) rapidly spread to the rest of the world. By
April 2020, most countries had adopted stringent measures to reduce population movements and
social gatherings to avoid its diffusion. After a brief lull during the summer months, the number
of reported cases started to dramatically increase from September 2020 and intensive care units
filled up again. As a result, governments across the world introduced a new round of lockdown
measures and other public health interventions to reduce the spread of the virus.

As the virus spread, so did social discontent: protests across the world increased by almost 30 per
cent between January 2020 and January 2021. 1 Media accounts describe how restrictive measures
on population mobility have fuelled public demonstrations and sometimes violent protests in
several countries since the start of the pandemic. In Italy, restaurant owners took to the streets in
Cremona and taxi drivers lined up in neat rows in Piazza Castello in Turin to protest against
lockdown measures during the second wave of the pandemic. 2 In Germany and France, protests
against movement restrictions have erupted too, even though generous social policy measures were
introduced to cushion living standards against the negative consequences of the crisis. 3 In the
United States of America (USA), angry protesters have taken to the streets since mid-April 2020
to voice their anger over lockdown restrictions or racial discrimination and to rally against or in
support of Trump. 4

1
 https://acleddata.com/#/dashboard
2
 See https://www.bbc.com/news/world-europe-54701042.
3
 See https://www.theguardian.com/world/2020/nov/02/latest-coronavirus-lockdowns-spark-protests-across-
europe.
4
 See https://www.bbc.com/news/av/world-us-canada-52344540.

 3
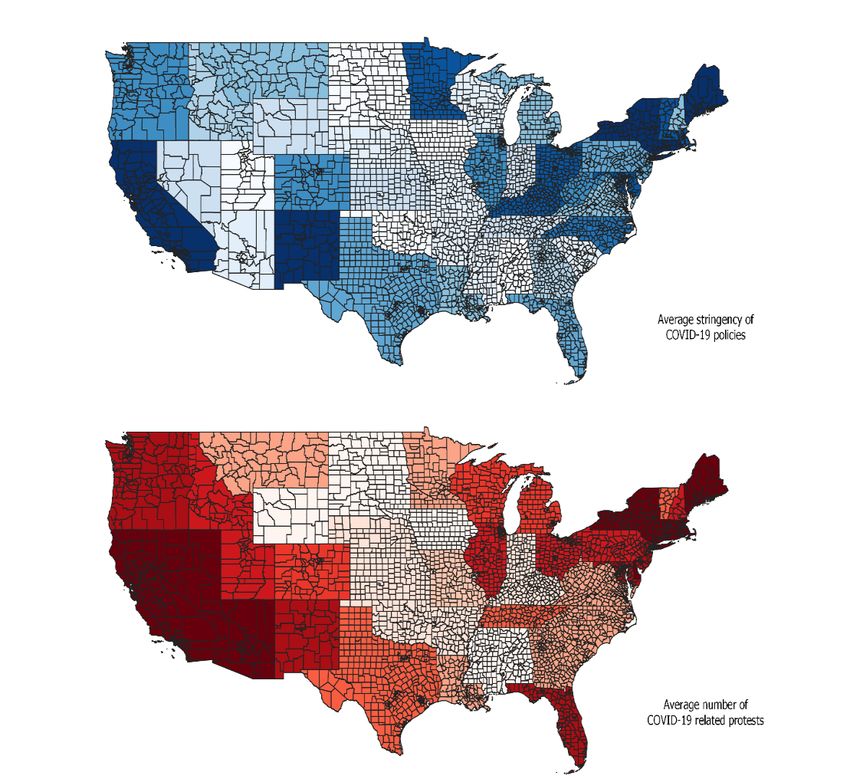
While COVID-related protests in the USA and elsewhere in the world seemed initially to be fuelled
by political polarization and ideological anger at government-imposed restrictions, there is now a
growing understanding that these public demonstrations might reflect ingrained discontent against
persistent inequalities, structural divisions, and discrimination—which have been amplified by the
different impact of the pandemic across different racial, ethnic, and economic groups. Highest risk
areas may have faced a ‘perfect storm’, where public dissent driven by the economic costs
associated to the health crisis may have magnified long-standing social and economic grievances.
Evidence of this vicious cycle of public health crisis, persistent inequalities, and social discontent
is, however, largely anecdotal. The aim of this paper is to empirically disentangle the role of pre-
existing inequality in explaining the relationship between policy restrictions to contain the spread
of COVID-19 and the incidence of protests in the USA and what mechanisms may explain such
a relationship.

While plenty of media accounts have linked the rise of protests in the USA in 2020 to the spread
of the COVID-19 pandemic, the causal relationship between these two phenomena is theoretically
much less clear. Recent evidence on the social, economic, and psychological effects of the
COVID-19 pandemic may explain how government-imposed restrictions may have caused social
discontent, which subsequently led to protests. The length of lockdowns and stay-at-home orders
may have driven people to resent social isolation and social distance measures (Briscese et al. 2020;
Armbruster and Klotzbücher 2020) and to become less willing to accept restrictions to their
freedom and liberties (Alsan et al. 2020), particularly as unemployment and economic insecurity
rose (IMF 2020; Li and Coppo 2020; Sedik and Xu 2020). When perceptions of unfairness and
anger at economic decline and social isolation reach certain thresholds, many react by engaging in
protests and demonstrations (Justino and Martorano 2019).

However, a pandemic caused by a virus like COVID-19, which is easily transmissible via close
social contact, may increase social discontent via the mechanisms outlined above without affecting
the incidence of protests. This is because people try to socially distance from each other to avoid
exposure to the virus and avert infecting others. Compliance with government social distance
policies and fear of falling ill or of spreading the virus to others will increase the individual costs
of participating in protests. The escalation of violence during protests—which became a concern
across US states—may have also constrained protest participation (Dave et al. 2020a, 2020b). In
addition, policing of curfews and social distance guidelines may have increased the social
coordination costs of protests—due to the likelihood of large gatherings being broken up by law
enforcement.

Overall, there was an increase in protests in the USA in 2020 in relation to previous years (see
Figure B1 in Appendix B), but with large variation across different counties, as shown in Figure 1.
Why did protests rise when a pandemic was rampant, and what explains variation in protest
incidence during the COVID-19 pandemic across US counties? To answer these questions, we use
a new dataset compiled by the US Crisis Monitor, a collaboration between the Armed Conflict
Location & Event Data Project (ACLED) (Raleigh et al. 2010) and the Bridging Divides Initiative
at Princeton University. The US Crisis Monitor collected real-time data on protests across US
counties between January and December 2020. 5 To measure the impact of COVID-related
policies, we exploit the Oxford COVID-19 Government Response Tracker (OxCGRT) (Hale et
al. 2020), which collects systematic information on policy responses to the pandemic taken by
governments in 180 countries. The OxCGRT classifies policies across levels of stringency (from

5
 The analysis in this paper does not include the riot and attacks to the Capitol on 6 January 2021. Van Dijcke and
Wright (2021) document the characteristics of participants in the riot, while Dave et al. (2021) analyse the effect of
the January 6 riot on the spread of COVID-19 in the localities of the rioters.

 4
1 to 100) used to restrict the spread of COVID-19. For each US county, we match weekly-
aggregated figures on COVID-related protest events with weekly changes in the level of stringency
of pandemic-related policies. The detailed level of disaggregation of these datasets across units of
analysis and time allows us to compare weekly variation in protest incidence across US counties
which experienced different degrees of policy restrictions in response to the expansion of COVID-
19. To test the role of inequality, in addition to estimating these average effects, we use data on
inequality at county-level compiled by the United States Census Bureau to estimate the non-linear
effect of policy stringency on protest incidence across county-level inequality quintiles.

In all estimations, we use county fixed effects and state-week fixed effects to generate within-
county estimates of the effect of policy restrictions on protest incidence across county inequality
levels between January and December 2020. This is akin to a difference-in-differences strategy that
compares protest incidence following the implementation and changes in COVID-related
restrictive policies in the US throughout 2020. 6 This strategy reduces potential biases resulting
from policy measures and protests being correlated with county-specific trends or changes in
unobservable variables (such as, for instance, localized economic shocks). However, it is still
possible that policy stringency levels and protests are correlated with each other due to
unobservable time-varying county-level characteristics or reverse causality. To address these
concerns, we use an instrumental variable (IV) strategy using the number of COVID-19 cases in
neighbouring states as a source of exogenous variation. We also exploit levels of policy stringency
in neighbouring states as an additional IV. Both ordinary least squares (OLS) and two-stage least
squares (2SLS) results show that more stringent policies have fuelled protests across the USA, but
only in the most unequal counties. The coefficients indicate that a one standard deviation increase
in the stringency index leads to a six-percentage point increase in the probability of a protest taking
place in the most unequal counties. When analysing the effect of each component of the stringency
index separately, results show that stay-at-home orders, restrictions on domestic travel, and public
transport restrictions have the largest impact on protest incidence in the most unequal counties.
These results are robust to alternative samples, different standard errors clustering methods and
fixed effects, and alternative constructions of the independent and dependent variables.

To investigate the mechanisms through which government policy restrictions may affect the
incidence of protests, we test two main hypotheses. According to the existing literature, shocks
like the COVID-19 pandemic may magnify economic inequalities and lead to protests due to
changes in economic conditions or due to changes in political and social preferences (Enos et al.
2019; Rozenas and Zhukov 2019; Enikolopov et al. 2020). The first mechanism—the deterioration
of economic prospects—has been shown by political scientists, sociologists, and economists to be
central to social mobilization, protests, and civil unrest (Gurr 1970; Boix 2008; Verwimp et al.
2019; Iacoella et al. 2020; Ponticelli and Voth 2020). There is a growing consensus that the
COVID-19 pandemic will lead the global economy into the worst recession since the Great
Depression (IMF 2020). Recent evidence shows also that past health crises have contributed to
increasing social instability—even though they were smaller in scale than the current COVID-19
pandemic—due to their effects on socio-economic outcomes (González-Torres and Esposito
2020; Li and Coppo 2020; Sedik and Xu 2020). Lockdowns and other restrictive measures
implemented to reduce the spread of COVID-19 have adversely affected labour markets and led
to substantial job losses, particularly among those employed in low-skilled jobs (Sedik and Xu
2020). These drastic reductions in living standards in a short period of time may stimulate
grievances and feelings of injustice, motivating people to protest.

6
 California was the first state to issue stay-at-home orders on 19 March: https://www.gov.ca.gov/wp-
content/uploads/2020/03/3.19.20-attested-EO-N-33-20-COVID-19-HEALTH-ORDER.pdf.

 5
Political preferences may have also contributed to explaining people’s reactions to government
responses to the ongoing COVID-19 pandemic. Notably, it appears that the COVID-19 crisis has
led some groups to embrace populist and more extreme political positions, particularly among
those who perceive preventive measures, such as wearing face masks or staying at home, as
unjustified interventions that threaten human rights and individual freedoms. 7 Social psychology
and political science scholars have long highlighted the role of group identity and political
preferences in promoting social mobilization (Tilly 1978; Simon and Klandermans 2001; Dalton
et al. 2010; Tilly and Tarrow 2015; Verba et al. 1995; Wasow 2020). The recent Black Lives Matter
(BLM) movement is an example of how these factors can play an important role in explaining
people engagement in protests. Recent evidence also shows that participation in the Capitol
insurrection on 6 January 2021 was connected to political preferences in previous elections (van
Dijcke and Wright 2021). In addition, factors such as social and political trust and levels of civic
engagement and social cooperation may play key roles in mobilizing individuals to protest,
including during COVID-19 (Tarrow 1998; Justino 2015; Sangnier and Zylberberg 2017;
Acemoglu et al. 2018; Justino and Martorano 2018, 2019; Larson et al. 2019; Aghajanian et al. 2020;
Manacorda and Tesei 2020; Levi and Stoker 2000). 8

The mechanism analysis we conduct in the paper lends stronger support to the economic
downturn hypothesis. Results show that more restrictive measures to curb population movements
and social gatherings during COVID-19 have increased unemployment and reduced economic
activities and spending in US counties with initially higher levels of inequality. We find limited
direct support for the political preferences hypothesis, although further heterogeneity analysis
suggests that policy stringency measures were associated with more protests in the most unequal
counties which voted for the Democratic party in the 2016 elections and exhibited, at the start of
the pandemic, lower levels of trust in the president, lower satisfaction with democracy, and higher
levels of social capital (which may have facilitated protest coordination).

The paper contributes to several literature strands. First, we show strong evidence for a causal
effect of the interaction between inequality and policy stringency on protest incidence during the
ongoing pandemic due to the adverse economic effects of policies to contain the spread of the
virus. A large literature in political science and sociology has long postulated a positive relationship
between economic inequality and protests (Gurr 1970; Lichbach 1989; Boix 2008; Solt 2015; Tilly
and Tarrow 2015). However, the causal identification of such a relationship and of the mechanisms
that may shape it has been more elusive. Our results effectively support an extended version of
Gurr’s original deprivation theory whereby reactions to government policies (like those related to
COVID-19) affect the likelihood of protests taking place in communities where grievances already
exist.

Second, we contribute to a new and growing literature analysing the social and economic
consequences of pandemics, including the ongoing COVID-19 pandemic (Almond 2006;
Voigtländer and Voth 2013; Blair et al. 2017; Atkeson 2020; Barro et al. 2020; Deb et al. 2020;
Eichenbaum et al. 2020; Galletta and Giommoni 2020; González-Torres and Esposito 2020). Less
in known about their political consequences (Aksoy et al. 2020), although some studies have
suggested that the COVID-19 and other pandemics may affect the popularity of incumbent

7
 See https://www.nytimes.com/2020/05/03/us/coronavirus-masks-protests.html and
https://www.bbc.com/news/world-latin-america-52351636.
8
 Civic capital and social preferences have also been shown to be key determinants of adherence to COVID-19
restrictions (Aghajanian et al. 2021; Barrios et al. 2021; Brück et al. 2020; Egger et al. 2020; Barrios and Hochberg
2020; Allcott et al. 2020; Dasgupta et al. 2020; Durante et al. 2021; Bargain and Aminjonov 2020; Borgonovi and
Andrieu 2020; Brodeur et al. 2021).

 6
governments, conditional on their effectiveness in containing the spread to the virus (Flückiger et
al. 2019; Bol et al. 2020; Giommoni and Loumeau 2020; Herrera et al. 2020). We contribute to this
literature by showing how the COVID-19 pandemic has amplified existing economic inequalities
in ways that increased social tensions and protests.

Finally, we add to a body of work on the links between rising inequality and political polarization
in the US (Hacker 2006; Bartels 2008; McCarthy et al. 2006) and the consequences of such
polarization for sustainability of democracy (Bartels 2008; Hacker and Pierson 2010; Gilens 2012).
This literature argues that rising economic inequality in the US since the 1980s has led to increased
political polarization, the capture of the political system by those at the top of the income
distribution, increased disenfranchisement of the economically excluded, and the erosion of
democratic structures. We show that counties with initially high levels of economic (and racial)
inequality were in fact more likely to protest during the COVID-19 pandemic against government
policies that further deteriorated their economic standing—despite those policies curtailing the
spread of the pandemic. These results are of relevance to the USA but also to other countries
where political polarization has been growing alongside economic inequality, and we discuss these
implications further in the conclusion.

The paper proceeds as follows. Section 2 discusses the evolution of the COVID-19 pandemic in
the US, the persistence of inequalities, and the recent rise in protests and presents the datasets we
will use in the analysis. Section 3 discusses the main empirical strategy. Section 4 presents the main
results and robustness analysis. Section 5 analyses the mechanisms that may explain the main
results. Section 6 concludes the paper.

2 Context and data

The paper analyses the relationship between public health policies, inequality, and protests across
US counties (third-level administrative units). The final sample includes 3,142 US counties from
50 states and the District of Columbia. For each county, we compiled time-variant information
on: (i) weekly-aggregated figures on COVID-related protest events, (ii) weekly changes in COVID-
related policies, with a specific focus on movement-restriction policies, and (iii) a measure of
income inequality, expressed as a Gini index, for 2019. The period of analysis runs between January
and December 2020.

2.1 COVID-related protest events

2020 was a year of turmoil all around the world. In the case of the USA, politically motivated
violence and instability characterized the period up to the 2020 general election in November,
fuelled by increased political polarization, violent hate crimes, and large-scale social movements.
Several protests in the USA in 2020 were motivated by social discontent against police brutality,
led by the Black Lives Matter (BLM) movement and sparked by the killing of George Floyd in
Minneapolis in May. 9 Demonstrations were also held in support and against President Trump and,
from November, against the results of the general election—eventually leading to the insurrection
of January 6 and the second impeachment of the former president.

9
 See https://web.archive.org/web/20200602235547/https://www.nytimes.com/article/george-floyd-protests-
timeline.html.

 7
American citizens also took to the streets to protest their discontent towards the government’s
handling of the pandemic. From mid-April 2020, several states witnessed protests against COVID-
19 stay-at-home orders. 10 In Michigan, citizens concerned about the economic fallout of
movement restrictions marched through the streets of Lansing, the capital, armed with assault
rifles, Trump signs, and American flags. In Utah, a state where movement restrictions remained
relatively mild throughout 2020, protesters showed their anger against facial-covering and social-
distancing policies, deeming them unconstitutional and a violation of their rights. Even less-
conservative states like California and Colorado experienced their share of anti-lockdown protests,
mostly motivated by fear of the economic and social consequences of business closures and social
distancing.

All protest events that occurred in the US between 1 January and 31 December 2020 were recorded
by the Armed Conflict Location & Event Data Project (ACLED) and the Bridging Divides
Initiative (BDI) at Princeton University under the US Crisis Monitor initiative. The dataset includes
dates, actors, locations, fatalities, and types of all political violence and demonstration events in
the US. 11 All events are accompanied by a note describing the context of each event. Using these
notes, we are able to code protest events based on their motives and actors. We identify four
distinct types of protests: COVID-related protests, which represent our main outcome interest,
Black Lives Matter-related protests, Trump-related protests, and general election-related protests. 12
Figure 2 illustrates the evolution of these different types of protest in 2020. The incidence of the
four types of protests changed substantially across the year. BLM protests, which peaked at over
30,000 per week, are concentrated around the date of the killing of George Floyd in May. Protests
in support of and against Trump and protests related to the presidential elections and Joe Biden’s
victory increase in the weeks leading to and following the general election. Protests related to
COVID-19 are more evenly distributed but three peaks can be identified, coinciding with the
COVID-19 waves in April, July, and November 2020. We base our main empirical analysis on the
variable measuring protests related to COVID-19 but consider all other protest types later in the
paper.

2.2 COVID-19 and containment policies

In an effort to curb the number of new COVID-19 infections, almost all countries across the
world introduced policy measures to restrict the movement of people and social gatherings, both
within and outside national borders. These policies have dramatically changed the ways in which
billions of citizens conduct their daily lives (Fang et al. 2020). Since 31 December 2019, around
200 governments have implemented external border restrictions and internal movement
restrictions to reduce the spread of COVID-19. In over 180 countries, governments have
implemented nationwide or localized school closures to reduce the transmission of the virus
between children and from children to adults (Azevedo et al. 2020; Cheng et al. 2020; Fang et al.
2020).

The US federal government was reluctant to respond to the COVID-19 pandemic with movement
limitations and lockdown-style measures. Hence, state governors implemented their own

10
 See https://edition.cnn.com/2020/04/16/us/protests-coronavirus-stay-home-orders/index.html.
11
 See https://acleddata.com/special-projects/us-crisis-monitor/.
12
 To code these categories, we identify whether each event’s note contains specific terms and assign the event to the
specific category. All events including the words ‘virus’, ‘COVID’, ‘restriction’, and ‘pandemic’ are coded as COVID-
related protests. All events mentioning the word ‘Trump’ are coded as Trump-related protests. All events mentioning
the words ‘Biden’ or ‘election’ are coded as election-related protests. BLM protests are codified based on the main
actor reported by ACLED for each event.

 8
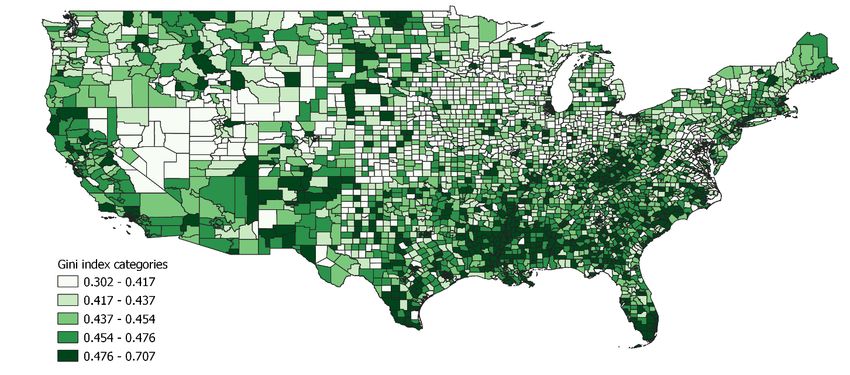
measures, with large policy variation across states. As shown in Figure 1, coastal states consistently
adopted more stringent policies in the period between January and December 2020, reflecting the
faster spread of the virus in these areas (also the most populous in the country). In contrast, mid-
western and southern states adopted much laxer restrictions and returned to them only in the
summer, when holidaymakers and, later, university students acted as super-spreaders. 13

Policy measures enacted in response to the COVID-19 pandemic have been meticulously recorded
by the Blavatnik School of Government at the University of Oxford (Hale et al. 2020). The Oxford
COVID-19 Government Response Tracker (OxCGRT) collects systematic information on
enacted ‘lockdown’-style measures and scores the stringency of such measures. A total of 19
indicators are currently being monitored across 180 countries. Some of these indicators,
particularly those related to movement and gathering restrictions, are aggregated into a Stringency
Index ranging between 1 and 100, with 100 representing complete lockdown. We rescaled the
Stringency Index into a continuous variable ranging between 0 and 1, with higher values
representing more restrictive conditions.

Data show that stringency measures peaked in the USA in April, when the index reached an
average of 0.60 (Figure 3). Differences in stringency measures across states are substantial even at
this peak stage, with Arkansas, North and South Dakota, Utah, and Iowa showing the lowest levels
of restrictions, and Maryland, Maine Kentucky, and Idaho showing the highest levels (index above
0.85). From April onwards, restrictions were relaxed in almost every state (except for New
Mexico), although again with large variation across states. Some states, such as Iowa and
Oklahoma, experienced a large drop in restrictions in May–June and remained stable afterwards.
Most of the country, however, slowly and gradually lowered restrictions until October, when they
reached the lowest point in the index (0.35). After October, most states increased restrictions to
social movement in response to the surge in cases. 14

2.3 Inequality across US counties

Inequality in the USA is higher than in almost any other developed country (Piketty 2014).
Disparities, particularly with respect to economic status and race, started to increase in every state
since the late 1970s and were exacerbated after the Great Recession of 2007–08 (Boushey 2020).
In 2019, the USA had a Gini coefficient of 0.46, far above the average Gini coefficient in other
OECD countries. 15

In this study, we use information on Gini index calculated using the United States Census Bureau
data. The Gini index is calculated at county-level by the Census Bureau using household income
data from 2019 American Community Survey. Estimates are available for 3,103 of the 3,142
counties in the USA. 16 The Gini index ranges between 0 (perfect equality) and 1 (perfect inequality).
The minimum value observed in our sample is 0.30 and the maximum is 0.71—indicating large
variation in income inequality across US counties (Figure 4). The most unequal counties are located

13
 See https://www.reuters.com/article/uk-health-coronavirus-usa-idUKKCN24V2G5?edition-redirect=uk.
14
 Hawaii is an exception: restrictions in the state were tightened from August to curb the spread of the virus caused
by increased tourism. South Dakota, in contrast, has been consistently reducing its restriction policies.
15
 See https://www.pewresearch.org/fact-tank/2020/02/07/6-facts-about-economic-inequality-in-the-u-s/.
16
 Missing counties are due to inconsistency in identification codes, which did not allow us to match the inequality
data and our main dataset for all US counties.

 9
in the District of Columbia and in the South East—in particular, in the states of Louisiana and
Mississippi. The most equal counties are located in Utah.

3 Empirical strategy

The empirical analysis we conduct in this paper is based on a regression model that expresses
protest incidence as a function of the stringency of anti-COVID-19 policies and its interaction
with the level of inequality in each US county. Formally, we have:

 = 0 + 1 + 2 ∗ + 2 ℎ +
 3 + + + ,
 (1)

where is a binary indicator with value one if a protest related to COVID-19 occurred at the
county level , in state , and in week . Our main independent variables are the index measuring
the stringency of anti-COVID-19 policies in state in the week and the interaction
term, ∗ , which represents the index measuring the stringency of anti-
COVID policies interacted with the Gini index in the same county-state pair. The latter variable
intends to capture the implementation of restrictive policies, conditional on the level of inequality
in each county (measured by the Gini index). Coefficient 2 thus measures how county-level
restrictive policies may translate into variation in protest activity in areas with different levels of
inequality. If, as we hypothesize, inequality magnifies the effect of restrictive policies on protests,
this coefficient will be positive. 1 captures the effect of policy stringency on protests at average
levels of inequality.

Equation (1) implies that the effect of the level of policy stringency on protest incidence varies
linearly with the level of inequality. However, it might be possible that the impact of policy
stringency varies across different levels of inequality in a non-linear manner, as hypothesized in
the introduction to the paper. To capture these non-linearities, we interact levels of policy
stringency with quintiles of the Gini index, as follows:

 = 0 + 1 + 2 ∗ 1 + 3 ∗ 2 +
 4 ∗ 3 + 5 ∗ 4 + 6 ∗ 5 +
 7 ℎ + 8 + + + ,
 (2)

where refers to quintiles of the Gini index, with 1 indicating counties with the lowest levels of
within-county inequality and 5 representing the most unequal counties.

Equations (1) and (2) also include two sets of controls. First, we introduce a vector of health
control variables ( ℎ ) to take into consideration a possible direct effect of the
intensity of the health crisis on protests (Barrios et al. 2021). These controls include the (log) total
number of COVID-19 cases and the (log) total number of COVID-19 deaths in each
county/week. Data are obtained from the Opportunity Insights Economic Tracker, a project
compiling private-sector sourced data about the COVID-19 pandemic and several economic
outcomes since January 2020. 17 In the case of COVID-19 cases and deaths, the tracker relies on

17
 See https://tracktherecovery.org.

 10
the New York Times county-level daily data, which we aggregate for each calendar week. The
definition and sources for all variables used in the paper are provided in Table A1 in Appendix A.
Other controls are based on a longstanding literature showing a close association between the
incidence of protests and several social and economic variables (Almond and Verba 1963; Dahl
1971; Dalton et al. 2010; McCarthy and Zald 1977; Verba and Nie 1972): percentage of non-white
population, percentage of people employed in services, percentage of people aged 25 years or older
with a university degree, and (log) per capita income. These data were obtained from US Census
Bureau data for 2019 and measured at county level. Since the data refer to fairly stable cross-
sectional county characteristics that change only very slowly across time, we interact these
indicators with a linear time trend (see, for instance, Manacorda and Tesei 2020). Madestam et al.
(2013) show, in addition, that political protests can be affected by local weather conditions. We
control for weather conditions using the (log) average rainfall for each county-month. Monthly
rainfall data for 2020 was obtained from the Climate Hazards Group InfraRed Precipitation with
Station (CHIRPS) data archive. 18

To capture unobserved heterogeneity at the national and the local level, we also include in the
regressions above week varying state ( ) and county ( ) fixed effects. The baseline estimation
uses weights based on the size of the population at the county level. Standard errors are clustered
at the state level to allow for unrestricted correlation in the error term across observations in the
same state; other clustering methods are explored later in the paper.

4 Empirical results

4.1 Main results

Table 1 presents the results from our main model specifications (1) and (2) above. Column 1 shows
that our coefficient of interest—the interaction term between stringency and inequality—has a
positive and statistically significant impact on the number of protests. Moving to equation (2),
column 2 shows that protests respond more to the interaction between restrictive policies and
inequality in less equal counties. The interaction terms between the index of stringency of policy
responses and all inequality quintiles are always positive but the interaction term is statistically
significant only for the most unequal counties (in quantiles 4 and 5 of the Gini coefficient). In
columns 4, 5, and 6, we add population weights, fixed effects, and additional controls in sequence.
The coefficients of interest remain largely unchanged across all specifications. Our preferred
specification in column 6 includes population weights, county fixed effects, state-week fixed
effects, and all controls discussed above. The results in this column indicate that a one standard
deviation increase in the stringency index leads to an increase of six percentage points (i.e. 0.221 x
0.289) in the probability that a protest occurs in the most unequal counties.

Figure 5 visually depicts the effect of policy stringency on protests at different levels of inequality.
In Panel A of Figure 5, we constrain the effect of stringency to vary linearly with the level of
inequality. Results confirm that the impact of stringency is magnified by the level of inequality: the
effect is negative at very low levels of inequality and progressively becomes more strongly positive
as inequality rises. Panel B of Figure 5 shows that the impact is not linear, justifying the decision
of allowing the effect of stringency to vary across different quintiles of inequality. As discussed,

18
 CHIRPS (v2.0) is a quasi-global, 5-degree gridded map of terrestrial precipitation estimates stretching from 1981 to
2020.

 11
statistically significant effects are only found at the top of the inequality distribution, while the
effects at the bottom of the distribution are close to zero.

The results are robust to changes in the baseline specification, different standard error clustering
methods, and using different sets of fixed effects. Results are shown in Table B1 in Appendix B.
In column 2, we exclude from the main regression all time-invariant controls, which were included
in the model interacted with a linear time trend. In column 3, we re-estimate the baseline regression
by using wild cluster bootstrap standard errors, to account for the number of clusters we have.
The next two columns use standard errors clustered at the county and state-week levels,
respectively. We also re-estimated equation (2) by replacing county with state fixed effects (column
6), and by adding state fixed effects to the main estimation (column 7). Results remain unchanged
across all different specifications.

4.2 Endogeneity

The estimations above rely on the use of the interaction between the Gini index for county
before the outbreak of COVID-19 and the policy stringency indicator in state implemented after
the outbreak of the pandemic as a source of exogenous variation to explain changes in the level of
protests for county after the outbreak of COVID-19. One concern with this empirical strategy
is that we may violate the exclusion restriction. This could happen if, for instance, the time
invariant component (the Gini index) is endogenously determined. The structure of the data
ensures that the incidence of protests during week is unlikely to affect levels of inequality—which
were recorded in the same county during the previous year. Controlling for county fixed effects
and state-week fixed effects further lessens concerns about omitted variable biases and effectively
reduces our identification strategy to a difference-in-differences setting, whereby we compare the
impact of policy stringency on protests before and after the introduction of policies to restrain the
spread of COVID-19.

Endogeneity may, however, persist if policy stringency levels and protests are correlated for other
reasons. For instance, the level of policy stringency might be shaped by previous protests when
they acted as super spreaders (see Dave et al. 2020a, 2020b, 2020c, 2021). To further address these
concerns, we test if trends in the outcome variable (probability of protests) before the outbreak of
the COVID-19 pandemic are parallel across different levels of exposure to the treatment (different
levels of policy stringency and different levels of inequality). In this exercise, we follow Christian
and Barrett (2017) and plot the observed number of protests over time separately for counties with
levels of policy stringency above and below the median. We also run an additional test that
considers the observed number of protests over time separately for low-middle unequal counties
(those in the first three quintiles) and highly unequal counties (those in the two highest quintiles).
To conduct this test, we need information on protest events prior to the beginning of the
pandemic. Since the US Crisis Monitor data is only available from 1 January 2020, we test for
parallel trends using the alternative Google’s Global Database for Events, Language and Tone
(GDELT). 19 Results in Figure 6 show that trends in the probability of protest are parallel in areas
with different levels of stringency (Panel A), as well as in those with different levels inequality
(Panel B).

19
 The GDELT Project processes and organizes information on events worldwide from digitalized newspapers and
news agencies, as well as from web-based news aggregators. Events are coded following the Conflict and Mediation
Event Observations (CAMEO) coding, which provides a list of approximately 15,000 events and 60,000 political
actors.

 12
Despite these reassuring tests, our results could still be biased if protests influence the policy
measures introduced by governments to contain the spread of COVID-19. To further address
these endogeneity concerns, we take inspiration from the recent contribution of Dietrich et al.
(2021), who instrument policy stringency in one country using the average number of new
COVID-19 cases in the region as a source of exogenous variation that affects the design of national
policies. Given the federal organization of the USA, we instrument each state level of policy
stringency using the average number of new COVID-19 cases in the neighbouring states. The
choice of the instrument is justified by the fact that the evolution of the number of cases of
COVID-19 in one state may affect the design of policy against COVID-19 in the neighbouring
states. For example, a rapid increase in COVID-19 cases in one state might convince neighbouring
states to introduce travel restrictions. At the same time, we assume that the number of new cases
of COVID-19 in neighbouring counties affects protests in one state only through state policies.
This is a reasonable assumption given that, in the case of the USA, failures to systematically address
the COVID-19 pandemic at the federal level meant that each state was responsible for defining its
own policies to contain the spread of the virus.

As an alternative instrument, we proxy also state-level stringency measures with the average level
of policy stringency in the neighbouring states. It is plausible to assume the existence of spill-over
effects in policy design across states sharing the same borders. Due to the absence of federal
coordination and the lack of recent pandemic experience, states may have decided to impose
certain restriction policies when they observed their neighbouring states doing so. It is likely that
specific states introduce stringent measures to contain the rapid increase in COVID-19 cases if
similar policies were effective in containing the virus in neighbouring states. Similarly, states might
be more willing to relax policy restrictions against COVID-19 if they observe the same actions
leading to positive outcomes in neighbouring states. In both cases, it is reasonable to assume that
changes in policy against COVID-19 in neighbouring states affect protests in one state only
through state policies.

Table 2 reports the IV estimates. Column 2 of Panel B shows that the stringency index is positively
correlated with the number of COVID-19 cases in the neighbouring states. Column 3 of Panel B
shows that the stringency index is positively correlated with the stringency index computed in the
neighbouring states. In both cases, the strong first stage F-statistic attests for the relevance of our
instrument, while the Anderson-Rubin Wald tests further confirm the validity of the estimates
(Table 2). Panel A shows that the estimates obtained from the second stages of the 2SLS regression
replicate the previous OLS results, showing a positive effect of policy stringency on protests in the
most unequal counties. 20

4.3 Disaggregating policy responses

In this section, we extend the main results by investigating the impact of specific policy
interventions. To do that, we replace the stringency index with each of its components. As
discussed before, the stringency index is built using eight of the 19 policy indicators recorded by
OxCGRT. These eight indicators record specific information about containment and closure
policies enacted in each US state with respect to school closures, workplace closures, public events
cancellation, gatherings restrictions, public transportations restrictions, stay-at-home orders, and
domestic and international travel restrictions. We test the separate effect of these eight
components. Components are coded with values that range between 0 and 3 (or 4 for some

20
 Conceivably, policies implemented in neighbouring states and their COVID-19 cases might have a lagged effect on
the policies implemented in that state. For this reason, we replicate our 2SLS analysis lagging the IV by one week.
Results remain comparable with main findings and are available upon request.

 13
indicators). 21 Results in Table 3 show that coefficients representing these measures remain
statistically significant when used individually. Stay-at-home orders, restrictions on domestic travel,
and public transport restrictions have the largest impact on protest incidence in the most unequal
counties.

4.4 Other protest types

An important question is whether the results we have discussed in the paper so far indicate a
specific effect of the stringency of policy responses on protests related to COVID-19 or reflect a
broader relationship between policy stringency, inequality, and any type of protest that occurred
in 2020. As discussed above, the US Crisis Monitor provides weekly updates on protests alongside
notes on each recorded protest event. These notes have allowed us to differentiate between
protests related to COVID-19, protests related to the Black Lives Matter (BLM) movement,
protests in support of and against Trump, and protests related to the presidential election results
and Biden’s victory.

To isolate the effect of the stringency of policy responses on different types of protest, we have
re-estimated the baseline regressions by substituting our main dependent variable with dummies
for alternative protest events and for all protests (Table 4). The results show that the interaction
between policy stringency and inequality reduces the probability of protests related to BLM, Trump,
and the presidential election in counties in the top inequality quintiles. These results indicate that
the interaction between inequality and policy stringency does not explain the rise in protests in the
USA during the COVID-19 pandemic in 2020, except for protests related to COVID-19 policy
restrictions.

This is an important result. Several studies have long pointed out that, with few exceptions, the
very poor (those at the bottom of the distribution) rarely protest or engage in other forms of
collective mobilization or political participation (see review in: Dalton 2017). This is largely because
the opportunity cost of engagement in collective mobilization is higher for those at the bottom of
the distribution than for those at the top due to the risk of losing income/wages, lack of time, and
coordination challenges (La Ferrara 2002; Bardhan 2005; Dalton 2017). The results in Table 4 are
in line with these analyses. This stands in contrast with our main result. Taken together, these two
results suggest that counties with the highest levels of inequality were more likely to experience
protests only when these protests were directly motivated by the negative economic effects of the
pandemic. We discuss in more detail in the concluding section of the paper the implications of
these results.

4.5 Additional robustness tests

This section implements a series of additional robustness tests to assess further the validity of the
result above when we consider different samples and use alternative definitions for the
independent variable and dependent variable.

Different samples. We test here if specific states may drive the main results by running a series of
regressions which exclude each US state at a time from the sample. We present the estimated
coefficients graphically in Figure B2 in Appendix B. Results remain constant throughout the

21
 As an example, a school closure indicator with value 0 indicates that no measure has been taken to reduce access to
schools. A value of 1 indicates that the government has recommend partial school closings, while a value of 3 (the
highest possible) indicates full closing of schools in the county.

 14
sample. Even when the coefficient estimates drop the most (when Indiana and Massachusetts,
respectively, are removed from the sample), values remain close to our main estimation coefficient.

Alternative definitions of inequality. We replicate the main estimates by using alternative measures of
inequality. In column (2) of Table B2 in Appendix B, we replace the 2019 Gini with the Gini index
calculated in 2018. The source, as before, is the US Census Bureau’s American Community Survey.
In column 3 we replace the Gini coefficient with the income share held by households in the top
five per cent of income earners. Data on income shares were compiled from the Geography of
Social Capital in America project, collected across US counties by the US Congress Joint Economic
Committee. In column 4, we use a measure of racial inequality as reported by the Black-White
neighbourhood segregation level. This indicator measures spatial separation between black and
white citizens within each county, with higher values indicating higher segregation. Data are
compiled by the Geography of Social Capital in America project. Results remain unchanged when
we use these alternative definitions of inequality.

Alternative definitions of protests. We test the robustness of our baseline estimation by replacing the
dummy variable on whether a given county experienced protest events in a specific week with the
log-transformation of the actual number of protests that took place in the same county (column 2
of Table B3 in Appendix B). This new variable captures the intensity of protests that occurred in
each week across different states, allowing us to recalculate the main results at the extensive margin.
The coefficient of interest remains positive and statistically significant for counties in the most
unequal income quintiles. The result shows that a one standard deviation increase in the stringency
index leads to an increase of 11 percentage points (i.e., 0.221 x 0.520) in the probability that a
protest occurs in the most unequal counties.

5 Mechanisms and contextual factors

What mechanisms explain why policy stringency measures may have caused an increase in protests
in the most unequal US counties in 2020? To answer this question, we first consider the two
mechanisms discussed in the introduction: changes in economic conditions and changes in social
and political preferences. Additionally, we test if the incidence of protests varies with important
contextual factors, namely political preferences, political and social trust, and civic engagement.

5.1 Changes in economic conditions

Policy measures to contain the COVID-19 pandemic, especially lockdowns and stay-at-home
orders, have caused severe economic damage, including the closure of many small businesses,
reduction in consumer expenditure, and unemployment. To measure this mechanism, we use data
from different sources. First, we accessed information on the number of small business opened
(defined by having had at least one transaction in the previous three days) and on small business
transactions and revenue data aggregated from several credit card processors. Data were obtained
from the Opportunity Insights Economic Tracker. Second, we obtained information on consumer
expenditure from credit and debit card spending, again from the Economic Tracker, which
provides aggregated, anonymized, and seasonally adjusted figures across US counties from January
2020. These data are available for 1,685 of the original 3,142 US counties. Finally, we use data on
unemployment levels from two distinct sources. First, we make use of weekly information
compiled by the Economic Tracker from private workforce management platforms. Data on
unemployment from these sources is available for 770 counties and allow us to calculate
unemployment levels for low-, middle-, and high-income groups. Second, we accessed data on
county-level unemployment from the Bureau of Labor Statistics (BLS). These data are available

 15
for 3,141 counties, although they are collected monthly (not weekly). All indicators from the
Economic Tracker are originally calculated as differences from January 2020 baseline values, 22 and
data from BLS is modified to take the same form. Using these baseline values, we calculate as our
outcome of interest differences in each variable in relation to the previous week/month.

Results for this analysis are reported in Table 5. Although some of the results need to be
interpreted with care due to drops in sample size for some variables, we find, as expected, a
negative and significant impact of the interaction between inequality and policy stringency on the
number of opened small business, total revenue, and consumer expenditure in the most unequal
counties. Policy stringency also appears to have reduced employment levels in the most unequal
counties, and more so for low-paid employees. The findings are consistent whether the Economic
Tracker or BLS data are used.

5.2 Changes in political preferences

As discussed in the introduction to the paper, the effects we observe may also be due to changes
in political preferences. We proxy political preferences by state-level pre-electoral polls on
preferences for the 2020 presidential candidates. Information is compiled daily from different
sources by the FiveThirtyEight project from ABC News and averaged at week-level by the authors
(although data is missing for several states/weeks). Results in Table 6, which must be interpreted
with caution given the small sample size, indicate that the interaction between policy stringency
and income inequality did not have a significant impact on political preferences before the election.
Changes in political preferences post-COVID-19 are, however, very difficult to capture given the
ongoing pandemic. To supplement the analysis above, we ask in the next section whether initial
political preferences may have shaped our main results.

5.3 Social and political context: heterogeneity analysis

In this section, we add to the narrative above by examining heterogenous effects of the estimates
across the distribution of initial political preferences at the start of the pandemic at the county
level. We do this in several ways in Table 7. First, we split the sample across electoral results for
the 2016 presidential elections along counties won by the Republican party and counties won by
the Democratic party. Data are compiled by the Geography of Social Capital in America project.
Results (columns 1 and 2) show that policy stringency is more likely to result in protests in the
more unequal counties that also voted for the Democratic party in the 2016 elections.

Second, political preferences can be expressed in terms of voting preferences but also in how
citizens trust their state institutions and democratic processes. Levels of political trust have been
repeatedly shown to be negatively associated with social mobilization (Justino 2015; Sangnier and
Zylberberg 2017; Justino and Martorano 2018, 2019; Levi and Stoker 2000). To capture these
effects, we split the sample into counties showing trust levels in the president above and below the
mean, respectively (Table 7, columns 3 and 4). These variables are measures on a scale of 1 to 7 in
a Likert-scale. 23 In columns 5 and 6, we include the percentage of individuals (above and below
the mean) who are satisfied with democracy. Information on these variables was obtained from

22
 Baseline values are calculated as the average of small business revenue, small business openness, and employment
between 1 January and 31 January 2020. More details on the methodology used to build the variables is available here:
https://raw.githubusercontent.com/OpportunityInsights/EconomicTracker/main/docs/oi_tracker_data_documen
tation.pdf.
23
 Likert scaling is a bipolar scaling method measuring either positive or negative responses to a statement. Lower
values indicate disagreement with the statement, while higher values indicate agreement.

 16
the Latin America Public Opinion Project (LAPOP). 24 Data for the US in 2019 are based on
information for approximately 1,200 individuals which we averaged at state level (the lowest
possible disaggregation level), covering all 50 US states. Results show that protests are more likely
to take place in the most unequal counties where trust in the president is below the median and
citizens are less satisfied with democracy.

Finally, social factors may also matter in explaining protests since the ability to draw on networks
and organizations may facilitate social coordination and help social movements overcome
asymmetric information challenges (Tarrow 1998, Acemoglu et al. 2018; Larson et al. 2019;
Aghajanian et al. 2020; Manacorda and Tesei 2020). To capture these social characteristics at the
start of the pandemic, we have split the sample across values above or below the average for two
types of variables (Table 8). The first is the percentage of individuals who trust other people. These
data are collected as above from LAPOP. Second, we split the sample into counties showing values
above or below the median value for the following civic engagement variables: number of religious
organizations; number of civic organizations; number of political organizations; and number of
labour organizations. These data are compiled by the Geography of Social Capital in America
project and obtained from multiple sources, including the US Census Bureau, County Business
Patterns, and the American Community Survey. Results show that the interaction between policy
stringency and inequality is a significant determinant of protests in the most unequal counties
which also have higher levels of social trust and civic engagement. This finding is in line with
previous evidence on the relevance of social trust and cooperation in protest participation and in
the coordination of social movements and collective action.

6 Conclusion

This paper attempted to identify how inequality across US counties has shaped the impact of the
COVID-19 pandemic on the incidence of protests. This empirical analysis made use of weekly
data compiled between January and December 2020 on levels of COVID-19-related policy
stringency, weekly data on protest incidence, and measures of county-level inequality at the start
of the pandemic. The main results show that the implementation of policy restrictions to contain
the virus led to increases in the incidence of protests in US counties with high levels of inequality
before the start of the pandemic: a one standard deviation increase in the stringency index leads
to a six percentage points increase in the probability of a protest taking place in the most unequal
US counties. Stay-at-home orders, restrictions on domestic travel, and public transport restrictions
have the largest impact on protest incidence in these counties. These results are robust to the use
of different samples, how standard errors are clustered, to the use of different fixed effects, and to
alternative definitions of the independent and dependent variables.

This result validates a long-standing theory of civil unrest, which emphasises the role of economic
inequality in motivating deprived groups and individuals to protest (Gurr 1970). To date, empirical
analyses of the direct impact of inequality on protests have, however, generated ambiguous results
and provided evidence to only statistical associations. This paper made use of the unique context
afforded by the ongoing global COVID-19 pandemic to study the relationship between inequality
and protests and the mechanisms shaping this relationship. The main results effectively support
an extended version of Ted Gurr’s original deprivation theory, whereby reactions to government

24
 LAPOP is an academic institution devoted to the collection of data on public opinion across the Americas. Despite
the name of the project only mentioning Latin America, their main survey, the AmericasBarometer, is a rigorous
comparative survey on public opinion covering most of North, Central, and South America and the Caribbean.

 17
You can also read