Regional Economic Prospects in the EBRD Regions May 2019
←
→
Page content transcription
If your browser does not render page correctly, please read the page content below
Regional Economic Prospects
                        in the EBRD Regions
                                       May 2019

   Facing global slowdown: More exposed, better prepared?
                       Growth to pick up in 2020 after a weaker 2019

Growth in the EBRD regions averaged 3.4 per cent in 2018, down from 3.8 per cent in 2017.
This deceleration was driven by a very sharp slowdown in Turkey and weaker export growth
across the regions’ economies, mirroring the global trade slowdown.

Having tightened throughout 2018, financing conditions faced by the EBRD regions’
economies started easing from January 2019, with interest rates remaining low in historical
perspective. The oil price dropped sharply at the end of 2018 but has since rebounded
significantly, supporting growth in oil exporters and in countries that receive large flows of
remittances from Russia and the Gulf Cooperation Council economies.

Turkey’s economy entered recession in the second half of 2018 on the back of tighter
monetary policy and deteriorating consumer and investor sentiment. Elsewhere in the EBRD
regions deceleration in the second half of 2018 has been modest. Robust domestic demand
continued to support growth in central Europe and the Baltic states. South-eastern Europe
and eastern Europe and the Caucasus also experienced robust growth, though with some
growth moderation in countries with previously high growth rates. Rising oil prices supported
economic growth in Kazakhstan and Russia as well as higher remittances from Russia to
Central Asia, the Caucasus and Moldova. Growth in the southern and eastern Mediterranean
picked up owing to a combination of higher tourist arrivals, improved competitiveness and
reforms in some countries, partially offset by the impact of political instability in parts of the
region.

Average growth in the EBRD regions is expected to moderate to 2.3 per cent in 2019 before
picking up to 2.6 per cent in 2020. In line with slowing global growth, moderations are
expected almost across the board, with the exception of the southern and eastern
Mediterranean. Following the output drop in 2019, growth in Turkey is expected to return to
positive territory in 2020. Growth pick-ups in Russia and Ukraine and a further acceleration
of already-high growth in the southern and eastern Mediterranean are also expected to
contribute to higher overall growth in 2020.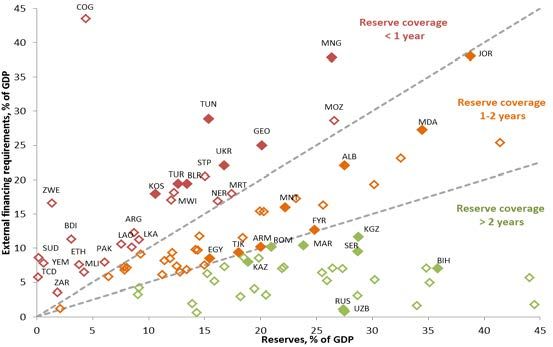
OVERVIEW

                 In recent years growth in the EBRD regions has become more dependent on global economic
                 conditions than it was prior to 2008. This reflects the region’s deep integration in the global
                 value chains as well as the fact that economies of emerging Europe and Central Asia can no
                 longer rely on transition-related productivity catch-up as a major source of growth. In this
                 regard, the sensitivity of EBRD regions’ growth to changes in external conditions is now
                 similar to that observed for other emerging markets.

                 This highlights the significant risks to the outlook for growth in the EBRD regions stemming
                 from trade tensions between the United States and its major trading partners. A widespread
                 escalation of global protectionism remains a major concern. The modalities of Brexit are still
                 unclear, and global uncertainty remains high. The security situation in the Middle East and
                 geopolitical tensions are also key sources of risk for the regions’ economies.

                 On the other hand, many economies in the EBRD regions have strong macroeconomic
                 frameworks and some fiscal space that could facilitate an appropriate policy response to
                 external shocks. In fact, economies in the EBRD regions have been increasingly making good
                 use of flexible exchange rates and inflation targeting to respond to external and domestic
                 shocks. Fiscal policy has also been used as a counter-cyclical tool: on average countries built
                 fiscal buffers during the periods of stronger economic growth and used them at times of
                 adverse economic shocks. Similar trends have been observed among emerging market
                 economies globally.

 Average growth in EBRD regions will slow to 2.3 per cent               Deceleration reflects a marked slowdown in Turkey
         Chart 1. Average real GDP growth rates, %                           Chart 2. Average real GDP growth rates, %

Sources: IMF WEO, EBRD forecasts and authors’ calculations.        Sources: IMF WEO , EBRD forecasts and authors’ calculations.

                                                               2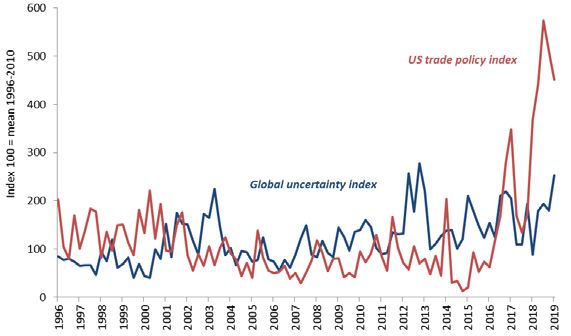
OVERVIEW

                                       Table 1. Real GDP growth
                                                                       Forecast     Change from
                                                   Actual
                                                                     (May 2019)     Nov 2018 REP
                                            2017            2018   2019      2020      2019

EBRD Region                                  3.8            3.4    2.3        2.6       -0.3
Central Europe and the Baltic States         4.4            4.7    3.8        3.2        0.3
Croatia                                      2.9            2.6    2.5        2.5       0.0
Estonia                                      4.9            3.9    3.2        2.6       0.2
Hungary                                      4.1            4.9    3.7        2.9       0.4
Latvia                                       4.6            4.8    3.3        2.7       -0.2
Lithuania                                    4.1            3.4    3.1        2.5       0.3
Poland                                       4.8            5.1    4.1        3.5       0.5
Slovak Republic                              3.2            4.1    3.6        3.3       -0.4
Slovenia                                     4.9            4.5    3.3        2.8       0.0
South-eastern Europe                         4.3            3.4    3.0        3.0       -0.2
Albania                                      3.8            4.1    3.9        3.9        0.0
Bosnia and Herzegovina                       3.2            3.1    3.0        3.0       -0.5
Bulgaria                                     3.8            3.1    3.4        3.0       0.0
Cyprus                                       4.5            3.9    3.4        3.0       -0.1
Greece                                       1.5            1.9    2.2        2.2       -0.1
Kosovo                                       3.7            3.9    4.0        4.0       0.0
Montenegro                                   4.7            4.9    2.8        2.6       -0.2
North Macedonia                              0.2            2.7    3.0        3.0       0.0
Romania                                      7.0            4.1    3.2        3.2       -0.4
Serbia                                       2.0            4.3    3.5        3.8       0.0
Eastern Europe and the Caucasus              2.4            3.0    2.8        3.0       -0.4
Armenia                                      7.5            5.2    4.5        4.5       -0.5
Azerbaijan                                   0.2            1.4    3.5        3.3       0.0
Belarus                                      2.5            3.0    2.0        1.8       -0.5
Georgia                                      4.8            4.7    4.5        4.5       0.0
Moldova                                      4.7            4.0    3.5        3.8       -0.5
Ukraine                                      2.5            3.3    2.5        3.0       -0.5
Turkey                                       7.4            2.6    -1.0       2.5       -2.0
Russia                                       1.5            2.3    1.5        1.8       0.0
Central Asia                                 4.7            4.8    4.4        4.2       0.2
Kazakhstan                                   4.1            4.1    3.5        3.2       0.0
Kyrgyz Republic                              4.7            3.5    3.6        3.6       0.4
Mongolia                                     5.3            6.9    6.2        5.0       0.2
Tajikistan                                   7.1            7.3    5.0        4.5       0.0
Turkmenistan                                 6.5            6.2    6.3        6.0       0.7
Uzbekistan                                   4.5            5.1    5.0        5.2       0.5
Southern and Eastern Mediterranean           3.8            4.4    4.6        5.1       -0.1
Egypt                                        4.2            5.3    5.5        5.9        0.0
Jordan                                       2.1            1.9    2.2        2.4       -0.2
Lebanon                                      0.6            0.2    1.3        2.0       -0.2
Morocco                                      4.1            3.1    3.2        3.8       -0.3
Tunisia                                      1.9            2.5    2.7        4.1       -0.3
EBRD Excl. Turkey                            3.1            3.5    3.0        3.1       0.0

                                                    3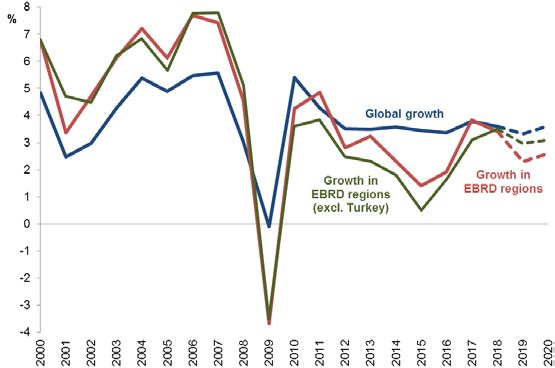
OVERVIEW

     Growth is projected to bottom out in mid-2019                    Export growth slowed in most economies of EBRD regions
 Chart 3. Average real GDP growth rates, 12-month rolling, %          Chart 4. Exports (goods and services), % change in Euro terms

Sources: CEIC, EBRD model forecasts and authors’ calculations.       Sources: National authorities via CEIC and authors’ calculations.
  Financial tightening episode of 2018 ended in Jan-2019             Less variation in spread increases than in earlier episodes
                      Chart 5. Yields, %                              Chart 6. Changes in sovereign bond spreads in 5 hike episodes

Sources: Bloomberg.                                                  Sources: Bloomberg. 24 other emerging markets.

   Volatility of capital flows has also declined since 2005          Higher oil prices supported partial recovery in remittances
  Chart 7. S.d. of net mutual fund flows, 12-month, % of AUM                   Chart 8. Remittances from Russia, % of GDP

Sources: EPFR Global. EM based on 9 selected EM countries.           Sources: Central Bank of Russia and authors’ calculations. The peak in
                                                                     quarterly remittances was within two quarters of 2014 Q1 in all countries.

                                                                 4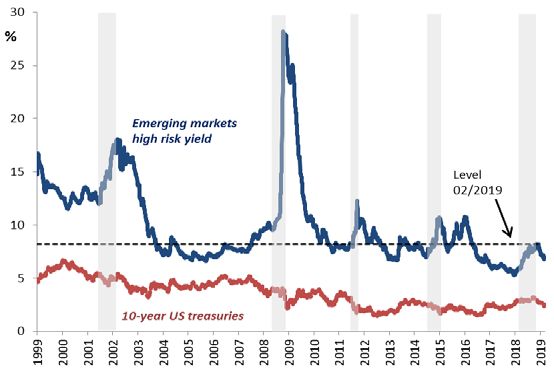
OVERVIEW
Greater use of flexible exchange rates as shock absorbers In most countries in the region, inflation is close to targets
Chart 9. Exchange rate volatility rel. to advanced economies Chart 10. Inflation targets and latest inflation rates
Sources: Thomson Reuters. 3-month moving average of the standard
deviation of nominal effective exchange rates.
Sources: Thomson Reuters and author’s calculation.
Most countries have adequate levels of int. reserves Most countries have some fiscal policy space
Chart 11. External financing needs and reserves, % of GDP Chart 12. Stock burdens and flow burdens
Sources: World Bank and author’s calculation. External financing needs
are the sum of current account deficits and short-term external debt Sources: Bloomberg, CEIC and author’s calculation.
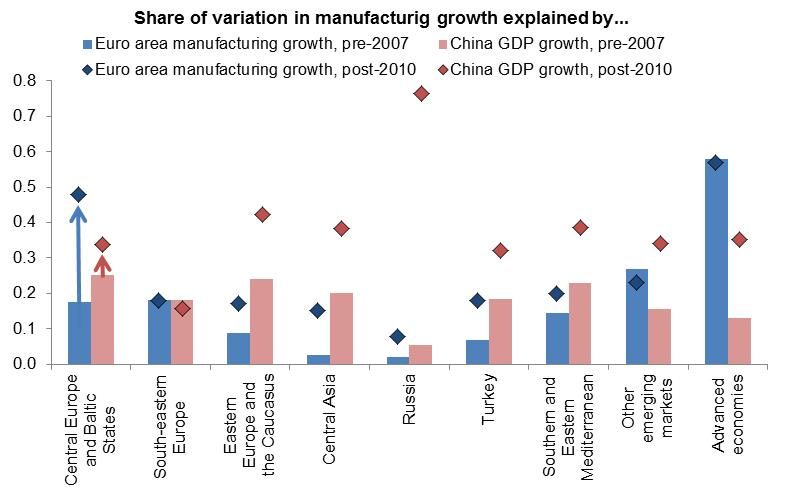
External conditions matter more for growth than before Risks: Global uncertainty high and rising
Chart 13. Share of variation in manufacturing growth Chart 14. World Uncertainty Index and US Trade Policy
explained by external conditions, % Uncertainty, 1996-2010 mean = 100
Sources: World Bank, IMF WEO, based on 14 other EMs. Sources: Baker, Bloom and Davis (2016) and World Uncertainty Index.
5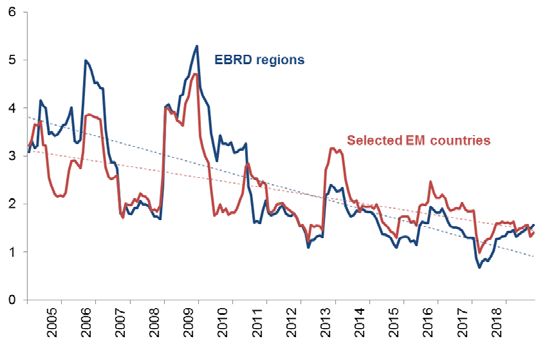
OVERVIEW

Average growth in the EBRD regions fell to 3.4 per cent in 2018, weighed down by
Turkey

Growth in the EBRD regions slowed in the second half of 2018 and averaged 3.4 per cent in
the year as a whole, down from 3.8 per cent in 2017 (see Table 1 and Chart 1; averages are
weighted using the values of countries’ gross domestic product [GDP] at purchasing power
parity [PPP]). The averages largely reflect a very sharp slowdown in Turkey, from 7.4 per cent
growth in 2017 to 2.6 per cent in 2018 (see Chart 2), but they also mirror broader global
trends.

Following almost two years of strong and broad-based growth, the global economy slowed
from 3.8 per cent in 2017 to 3.6 per cent in 2018, with a pronounced deceleration in the
second half of the year. Activity softened amid an increase in trade tensions between the
United States and China, higher policy uncertainty across many economies, a tightening in
financial conditions, slower growth of global trade and a resulting decline in business
confidence.

Mirroring global trends, growth slowed in about 70 per cent of countries in the EBRD regions
in the second half of 2018, relative to the first half of the year. The latest economic
indicators such as retail sales, exports and imports point towards a further moderation of
growth in the first half of 2019, based on estimates derived using a principal-component-
based model that takes into account more than 150 global indicators as well as estimates of
economies’ medium-term potential growth (see Chart 3). 1 For the EBRD regions excluding
Turkey, this moderation is estimated to be relatively muted.

Weaker external demand and slowing trade growth weigh on the region

Global trade growth slowed considerably towards the end of 2018, from the high rates seen
in late 2017. Increased trade tensions between the United States and China contributed to
the slowdown. Industrial production also decelerated across advanced economies, except in
the United States. This deceleration was driven by a combination of waning cyclical factors,
high policy uncertainty and worsening market sentiment.

Slower growth of global trade weighed on export demand in the EBRD regions. Export
growth slowed in almost all countries, to an average of 10 per cent year-on-year in euro
terms in the latest 6 months compared with 24 per cent in the same period a year earlier
(see Chart 4).

In contrast, domestic demand held up in most economies. A notable exception is Turkey,
where domestic demand collapsed in the second half of 2018 amid tighter monetary policy,
private sector deleveraging and deteriorating consumer and investor sentiment.

1
    See the November 2017 edition of the Regional Economic Prospects for a discussion of the model.

                                                   6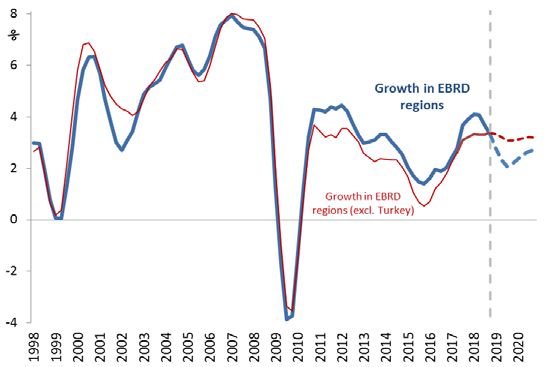
OVERVIEW

Over the past decade and a half, growth in many economies of the EBRD regions has been
mostly driven by capital formation and automation, reflecting the increasing scarcity of
labour (see Box 1). The contribution from total factor productivity has been small since the
Global Financial Crisis. While this is captured here simply as a residual, this finding is
consistent with the low level of innovation in these economies, as documented in the 2017-
18 EBRD Transition Report and November 2018 Regional Economic Prospects. On average
over the period 2003-2015 falling employment weighed on growth. The negative effects of
shrinking working-age populations due to migration and aging were just about offset by
rising employment rates (especially among older workers). However, shifts in the skill-
composition of employment, in particular falling demand for middle-skilled labour, also
constituted a drag on growth during most of this period, though these effects are small
compared to the large positive contribution of capital formation.

Episode of tightening of financing conditions ended in January 2019

Financing conditions for emerging markets tightened in 2018, following several quarters of
an exceptionally favourable environment. The average yield on high-risk emerging market
bonds edged up from a low of 5.8 per cent in April 2018 to 8.2 per cent at the end of the
year. This was the fifth largest increase in average interest rates faced by emerging markets
in the last 20 years - the others being an episode in 2001, the immediate aftermath of the
2008 Global Financial Crisis, the Eurozone debt crisis of 2011 and an episode in 2015 (see
Chart 5).

The tightening ended in January 2019, with financing conditions easing since. Interest rates
remain at the lowest levels seen in the last 20 years, comparable to the rates prevailing
during 2003-07 and 2013-15 (see Chart 5). The tightening primarily affected capital flows to
economies with underlying weaknesses, notably Argentina and Turkey.

Lower differentiation among emerging markets benefited higher-risk economies

The latest tightening episode saw less variance in terms of spread increases than earlier
episodes, as measured by the difference between the increases in the cost of debt faced by
borrowers at the 10th and 90th percentiles of distribution of cost increases (see Chart 6). The
lower extent of differentiation among different markets could be explained by investors
anticipating a normalisation of conditions and engaging earlier in the opposite trades, buying
assets, including government bonds, as they become cheaper. This trend benefited most
those countries where risks are perceived to be higher, such as Ukraine; in these economies
increases in interest rates were more modest than during previous episodes. Broad trends
have been similar in emerging markets at large, although the reduction in differentiation
among emerging markets in general occurred somewhat earlier, and notable outliers
(outside the 90th percentile) remain.

                                              7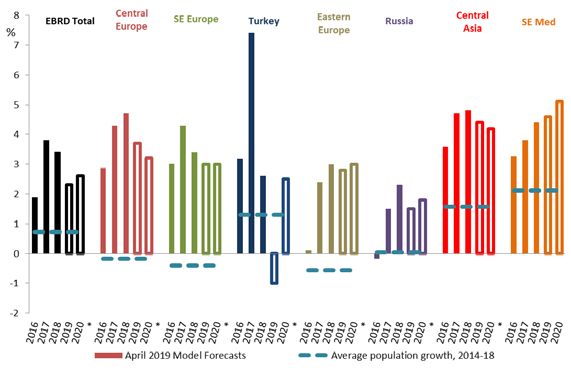
OVERVIEW

The volatility of capital flows has also declined over time, consistent with investors’
increased confidence in the countries’ macroeconomic policy frameworks (see Chart 7).2 As
in other emerging markets, capital flows to the EBRD regions have been recovering in recent
months.

Markets now expect looser financial conditions in 2019. The US Fed has signalled a more
accommodative monetary policy stance in light of slowing economic activity. Interest rates
are also expected to remain on hold for longer in the euro zone, while fiscal policy is easing
there for the first time in a decade.

Recovering stock market valuations and exchange rates

Emerging market currencies in general, as well as those in the EBRD regions, have been
broadly stable or strengthened slightly against the US dollar in January-April 2019, having
weakened over the course of 2018. The Turkish lira, which depreciated by 29 per cent
against the dollar in 2018, has recovered some of its losses in the first months of 2019,
though it remains highly vulnerable to changing investor sentiment. Tighter monetary policy
and an increase in the price of oil have helped bolster the Russian rouble in the first part of
2019.

Stock market valuations in emerging Europe have also been recovering in the first months of
2019 after a weaker 2018. These trends mirror broader developments in emerging markets
where a downward correction in 2018 reflected escalating trade wars, a weaker global
outlook and ongoing concerns about tightening financing conditions.

Oil prices are rising again following a sharp drop

The Brent oil price dropped to lows of US$ 50 per barrel in December 2018, having averaged
over US$ 70 in January-September 2018. The drop reflected both supply factors – a
temporary waiver in US sanctions on Iranian oil exports to some countries and record-high
US crude oil production – and weakening global growth towards the end of 2018.

The oil price has rebounded somewhat since the beginning of 2019. It exceeded US$ 70 by
April, driven by production cuts in oil exporting countries. This price recovery
notwithstanding, the average price of Brent in January-April 2019 was 5 per cent lower than
in the same period of 2018.

Stronger recovery in remittances to EAEU member countries

The higher oil price has supported growth momentum in commodity exporters and a
continued recovery in remittances from Russia to eastern Europe, the Caucasus and Central
Asia. The recovery in remittances has, however, been uneven across countries (see Chart 8).

2
 The measure of capital flow volatility is based on monthly net mutual fund flows to a given country,
expressed in per cent of assets under management. The standard deviation of flows to all countries
over a 12-month window is used to gauge volatility.

                                                 8
OVERVIEW

In particular, remittances are on average 1.4 percentage points of GDP below their peak in
members of the Eurasian Economic Union, but remain at 4.6 percentage points of GDP
below their peak level in other countries in Eastern Europe, the Caucasus and Central Asia.
This could reflect differences in access to the Russian labour market, including differences in
the quality of jobs available to migrants once there.

At over 7 per cent of GDP on average, remittances in the EBRD regions remain about 3.3
percentage points higher than in other countries at a similar level of development. 3 Looking
at the cost of remitting through formal channels it is also cheaper to send money from
Russia than to make remittances along most other major remittance corridors (for instance
from Germany to south-eastern Europe, from Saudi Arabia to South Asia and from the
United States to Central America). The cost of sending remittances from Russia has further
halved since 2011, according to World Bank data.

Better prepared: Flexible exchange rates and counter-cyclical fiscal policy
increasingly acting as shock absorbers

Over the last two decades, emerging market economies globally as well as in the EBRD
regions have been making greater use of flexible exchange rates and inflation targeting to
respond to external and domestic shocks. Correspondingly, their exchange rates have
become more volatile relative to those of advanced economies. In such relative terms,
emerging market exchange rate volatility is at its highest level since 2001 (see Chart 9). This,
of course, reflects the combination of emerging markets’ choice of policy tool as well as the
frequency and intensity of external shocks affecting them. By now 70 per cent of economies
in the EBRD regions are inflation targeters and, with the exception of Egypt, Ukraine and
Turkey, inflation does not exceed the target by more than 2 percentage points (see Chart
10).

Most countries in the EBRD regions have comfortable levels of international reserves in
relation to their short-term external financing needs as discussed in the previous issues of
Regional Economic Prospects. In only seven countries in the region do reserves cover less
than a year of external financing requirements (the sum of current account deficit and short-
term external debt), and only two of these maintain currency pegs (see Chart 11).

At the same time, high levels of debt denominated in foreign currency limit the effectiveness
of flexible exchange rates as shock absorbers. As documented in the November 2018
Regional Economic Prospects, much of corporate debt in the EBRD regions is in foreign
currency or external. In these cases, a weaker currency still supports exports, makes imports
more expensive and renders local assets more attractive to foreign investors, but it also
makes debt of corporates, households and the government more expensive to service.

Fiscal policy has also been used as a counter-cyclical tool, mitigating the impact of economic
shocks (see Box 2 for a detailed analysis). On average, countries in the region built fiscal

3
    The numbers refer to unweighted averages among recipient countries.

                                                  9
OVERVIEW
buffers during times of stronger economic growth and increased government spending at
times of adverse shocks. Similar to advanced economies, countries in central Europe and the
Baltic States, south-eastern Europe and Turkey implemented fiscal stimulus packages in
response to the Global Financial Crisis. Other economies in the region used fiscal policy to
respond to the drops in commodity prices in the mid-2010s (and the consequent drops in
remittances from commodity exporters) – a pattern also seen in many emerging markets.
Such counter-cyclical fiscal policies, however, appear to complement the use of flexible
exchange rates rather than be used as an alternative policy response to external shocks, as
discussed in Box 2, possibly reflecting the strength of countries’ macroeconomic
frameworks.
Owing to a relatively low cost of servicing government debt in recent years, most countries
in the regions have some available fiscal space that can facilitate a fiscal response to an
adverse economic shock. Like in advanced economies, in many economies in the EBRD
regions debt levels are moderate-to-high but interest rates on government debt are below
the growth rate of nominal GDP (the sum of real economic growth and inflation). In these
economies, located in the bottom right quadrant of Chart 12, debt can be expected to
decline as a percentage of GDP over time provided government revenues cover non-interest
spending. In contrast, in Turkey and Ukraine (and, to a lesser extent, Azerbaijan), debt levels
are moderate but the current financing terms are relatively unfavourable, requiring
governments to run sizable primary fiscal surpluses to keep debt-to-GDP ratios stable (top
left quadrant of the chart). Lebanon and Jordan, as well as Tunisia, face both high levels of
debt and a relatively high cost of debt service.
Broadly sustained growth momentum, with the exception of Turkey
Growth in 2018 was faster than in 2017 in most economies in the EBRD regions, with the
notable exception of Turkey and south-eastern Europe.
Growth in central Europe and the Baltic states exceeded expectations and reached 4.7 per
cent in 2018, up from 4.4 per cent in 2017 (see Chart 2), owing to strong domestic demand
on the back of rising wages, favourable financing conditions and improved absorption of
European Union (EU) structural funds.
Growth in south-eastern Europe moderated from 4.3 per cent in 2017 to 3.4 per cent in
2018, with significant variation across countries. At 1.9 per cent, growth in Greece was
slightly below expectations, but confidence, investment and employment have been picking
up. Growth in Bulgaria and Romania remained relatively strong, though signs of a slowdown
are apparent in the latter. Growth picked up in the Western Balkans, primarily as a result of
faster growth in Serbia, the region’s largest economy, and recovery in North Macedonia. The
composition of growth shifted to private consumption, with a larger drag from net exports
than in 2017.
Growth in eastern Europe and the Caucasus picked up from 2.4 per cent in 2017 to 3.0 per
cent in 2018, though with some growth moderation from the previously-high growth rates in
10OVERVIEW
Armenia, Georgia and Moldova. Recovery took hold in Ukraine, with growth accelerating to
3.3 per cent in 2018 on the back of robust consumption, recovery in investment and rising
remittances from Poland.
In Turkey, growth slowed sharply from 7.4 per cent in 2017 to 2.6 per cent in 2018. The
economy entered a recession in the second half of 2018 amid tighter monetary policy and
private sector deleveraging. As the lira depreciated, net exports have made a stronger
contribution to growth. After a sharp slowdown in the last months of 2018, credit growth
picked up in the first quarter of 2019 as lending by state banks increased.
Russia’s economy expanded at the rate of 2.3 per cent in 2018, up from 1.5 per cent in 2017.
Rising oil prices and oil production boosted government revenues and export receipts. The
central bank hiked its policy rate to contain inflation and the currency depreciation resulting
from the new round of sanctions.
Growth in Central Asia accelerated slightly from 4.7 per cent in 2017 to 4.8 per cent in 2018.
On balance the external economic environment remained conducive to growth, with strong
export receipts and higher remittance inflows. Mongolia, Uzbekistan and Tajikistan also
benefitted from a significant expansion of fixed investment, primarily public and foreign.
Growth in the southern and eastern Mediterranean picked up from 3.8 per cent in 2017 to
4.4 per cent in 2018, corresponding to around 2 per cent in per capita terms. Social unrest
and political instability delayed the implementation of reforms in Jordan and Lebanon.
Receipts from tourism, however, were higher in most countries, competitiveness in Tunisia
improved as a result of currency depreciation and reforms helped Egypt achieve the highest
growth rate in a decade.
Growth is projected to moderate, in line with global trends
Average growth in the EBRD regions is expected to moderate from 3.8 per cent in 2017 and
3.4 per cent in 2018 to 2.3 per cent in 2019 (see Table 1). This mirrors a slowdown in global
growth, projected at 3.3 per cent in 2019 (in PPP-weighted terms), according to the latest
World Economic Outlook of the International Monetary Fund (IMF). The new projections for
the EBRD regions represent a downward revision of 0.3 percentage points compared with
the November 2018 Regional Economic Prospects forecast, primarily on account of slower
expected growth in Turkey. Excluding Turkey, growth in the EBRD regions is expected to
moderate to 3.0 per cent in 2019, a forecast unchanged from November 2018 (see Table 1).
Growth in central Europe and the Baltic States is projected to slow from 4.7 per cent in
2018 to 3.8 per cent in 2019 and 3.2 per cent in 2020, with key risks tilted to the downside in
the light of the slowing growth in advanced Europe.
Growth momentum is also expected to moderate in south-eastern Europe, to around 3.0
per cent in both 2019 and 2020. Growth in Romania is expected to moderate from close to 7
per cent in 2017 and 4.1 per cent in 2018 to 3.2 per cent in 2019 and 2020 on account of
increased perceived investment risk, tighter monetary policy and growing external
11OVERVIEW
imbalances. Recovery in Greece, on the other hand, is expected to continue, with growth
projected to rise to 2.2 per cent in both 2019 and 2020.
A slowdown is also projected in most of eastern Europe and the Caucasus, with average
growth falling from 3.0 per cent in 2018 to 2.8 per cent in 2019. In Ukraine a deceleration of
growth in the main trading partners and domestic political uncertainties due to the twin
elections are expected to cause a temporary slowdown in growth to 2.5 per cent in 2019.
Reforms and monetary policy easing are expected to support growth increasing to 3.0 per
cent in 2020.
Russia’s growth is projected at 1.5 per cent in 2019, as higher interest rates, the increase in
the rate of the value added tax (VAT) and rising inflation hold down household consumption
growth, while a stricter sanctions regime constrains private investment. In addition, an
agreement with OPEC foresees reduced oil exports. Growth is expected to start picking up in
2020, driven partly by an ambitious investment plan announced for the period 2019-2024.
Growth in Central Asia is also forecast to slow, from 4.8 per cent in 2018 to 4.4 per cent in
2019 and 4.2 per cent in 2020 due to smaller gains in oil and gas production, but is expected
to stay above 4 per cent contingent on continued supportive external conditions,
advancement in regional integration and barring increases in political uncertainty.
In contrast, growth in the southern and eastern Mediterranean region is projected to pick
up from 4.4 per cent in 2018 to 4.6 per cent in 2019, supported by the implementation of
reforms aimed at improving the business environment and boosting domestic and foreign
investment. Robust economic growth in Egypt is expected to continue, supported by the
sustained recovery in tourist arrivals and exports, large public construction projects, higher
natural gas production and various reforms.
Spillovers from Turkey are likely to be limited
Recovery from the ongoing slowdown in Turkey is likely to be gradual. High interest rates
will continue to dampen consumption and investment, although higher net exports on the
back of the weaker lira are expected to continue to contribute to growth. A contraction of
around 1.0 per cent in expected in 2019, with a gradual recovery of growth to around 2.5
per cent in 2020. Box 3 examines post-recession recoveries in the EBRD regions over the last
two decades.
Spillovers from the sharp deceleration of growth in Turkey to the economies in the EBRD
regions are expected to be limited. As documented in the 2018 November Regional
Economic Prospects, economic linkages via trade, cross-border investment and remittances
are relatively modest. Goods exports to Turkey do not exceed 2 per cent of the exporter’s
GDP anywhere in the EBRD regions. Exposures are highest in Bulgaria (mostly consumer
goods) and Hungary (mostly capital goods). In addition, exports of intermediate goods are
less likely to be impacted by the domestic slowdown in Turkey to the extent that they serve
as inputs into the production of goods exported by Turkey.
12OVERVIEW
Turkey accounts for only 0.5 per cent of total FDI inflows into the EBRD regions, although its
share of Azerbaijan’s FDI is 9 per cent. And with its young population and rapidly growing
labour force, Turkey is not a significant source of migrant remittances (as documented in the
EBRD Transition Report 2018-19). Remittances from Turkey account for at most 1.9 per cent
of recipient countries’ GDP (in the case of Bulgaria).
More exposed: increased vulnerability to external shocks
The EBRD regions are deeply integrated in regional value chains. As documented in the
November 2018 Regional Economic Prospects, the import content of exports in emerging
Europe (a proxy for integration in value chains), at 43 per cent, is high by the standards of
advanced economies and emerging economies. While deepening economic integration has
benefited the EBRD regions, providing access to capital, generating employment, facilitating
knowledge spillovers and boosting productivity growth, it has also increased economies’
sensitivities to changes in external demand conditions. This was exemplified by spillovers to
the EBRD regions from the recent slowdown in manufacturing growth (especially in the
automotive sector) in Germany.
The importance of external conditions for the regions’ growth rates has increased
significantly, converging to the levels commonly observed in emerging markets (see Chart
13). Before 2008, growth in the EBRD regions was to a greater extent driven by sources
specific to the region, namely transition catch-up in the levels of total factor productivity
facilitated by gradual integration into European and global value chains. In 2000-2007,
variation in manufacturing growth in the euro area accounted for about 14 per cent of the
variation in manufacturing growth in central Europe. After 2010, this ratio increased to
around 50 per cent. Spillovers from China’s growth have also increased sharply and now
explain around a third of the variation in manufacturing growth across EBRD regions. In
some cases, these linkages can be indirect. A strong association between Russia’s growth
and China’s, for instance, is likely driven by the impact of China’s demand on prices of
Russia’s commodity exports.
In sum, a slowdown in global growth presents significant risks to the outlook for growth in
the EBRD regions. In light of the trade tensions between the United States and its major
trading partners, a widespread escalation of protectionism remains a major concern.
Notwithstanding recent moderation, US trade policy uncertainty remains at historically high
levels (see Chart 14), with the cost of the ongoing trade tensions estimated at 0.2
percentage points of global GDP, according to the IMF. The security situation in the Middle
East and geopolitical tensions remain key sources of risk for the region’s economies.
Furthermore, the modalities of the UK’s exit from the EU (“Brexit”) remain unclear. After the
Draft Withdrawal Agreement was repeatedly rejected by the UK House of Commons, the
date of the UK’s departure from the EU has been moved forward to 31 October 2019, with
the option to leave earlier if the UK Parliament passes the withdrawal agreement. In a no-
deal-Brexit scenario or other scenarios where the UK does not remain in a customs union
with the EU, cross-border supply chains involving the UK may be severely disrupted. Lower
exports from Europe’s advanced economies to the UK will affect demand for imports of
13OVERVIEW
intermediate goods from the EBRD regions. When such value-added-chain effects are taken
into account, up to 7 per cent of exports from the region (by their domestic value) are at
risk.
14OVERVIEW
Box 1. The impact of structural shifts in the labour market on growth
Countries in emerging Europe are faced with shrinking labour forces. Scarcity of labour led to
rising employment rates and rapid automation of production, and with it, a change in the
skill composition of employment. How have these changes affected growth so far? Consistent
with rapid automation, growth has been overwhelmingly driven by capital formation, with a
modest contribution from improvements in total factor productivity (TFP). Shrinking working-
age populations exerted a drag on growth that could not be fully offset by rising employment
rates. Shifts in the skill-composition of employment also weighed on growth, though these
effects are relatively modest compared to the positive contribution of capital formation.
The 2018-19 Transition
Report and previous
Regional Economic
Prospects pointed to ways in
which shrinking labour
forces in emerging Europe
have been reshaping labour
markets. Population aging,
compounded by out-
migration (primarily to the
EU-15), has led to greater
use of automation and rising
employment rates,
especially among older
workers. Rapid technological
change has been
transforming the nature of
jobs and demand for skills.
As routine cognitive tasks
(such as processing invoices
or insurance claims) tend to
be easier to automate than
manual work (such as
cleaning) or creative work
(such as software
development), the share of
middle-skilled occupations
has been declining in most
economies while the shares
of low- and high-skilled
15OVERVIEW
occupations have been on the rise. 4
How have these changes affected growth so far? To examine this question we first rely on a
simple production function decomposition of growth, which examines how much changes in
each of the factors of production (capital, labour and total factor productivity) contributed
to growth in Croatia, Hungary, Latvia, Lithuania and Poland, which averaged 2.8 per cent per
annum over the period 2003-14 (see Chart 1.1 panel 1). 5
Consistent with fast automation, growth has been overwhelmingly driven by capital
formation. The 44 per cent increase in capital stocks over 2003-2015 contributed 2.4
percentage points to annual growth. The relatively large estimated coefficient on capital (of
around 0.6) could also be a reflection of technological change making production more
capital-intensive. In contrast, TFP growth contributed about 0.5 percentage points per
annum, consistent with limited innovation in these economies, as documented in the 2017-
18 Transition Report.
The overall change in employment constituted a -0.06 per cent drag on growth. To look at
the impact of various forces behind the overall change in employment, we rely on an
augmented production function, which now assumes that low-skilled, middle-skilled and
high-skilled labour are all complementary inputs needed to produce the economy’s final
output. One can be substituted for the other, albeit imperfectly. We use this assumption to
estimate the impact of changes in the employment shares of low-, middle- and high-skilled
occupations. We also separate out changes in the working-age population due to aging and
migration, and changes in the employment rate (the share of employed in the working-age
population; see Chart 1.1 panel 2).
The drag from shrinking working-age populations was just about offset by rising employment
rates. A decline in working-age populations (on average by 3.6 per cent) due to aging and
outmigration resulted in a -0.44 percentage point drag on growth, while employment rates
increased by 4 percentage points and contributed 0.48 percentage points to growth. 6
Shifts in the skill-composition of employment also weighed on growth, though these effects
are small compared to the large positive contribution of capital formation. Changes in the
skill composition of employment resulted in a -0.09 percentage point drag on growth, likely
4
On skill-biased technological progress see, for instance, Karabarbounis and Neiman (2014). On wage
and employment polarization see, for instance, Autor and Dorn (2013) and Goos, Manning and
Salomons (2014).
5
Due to data limitations on employment by educational attainment and occupations examined
below, the focus throughout is on five countries in emerging Europe.
6
In the Baltic states, outmigration of those of working-age accounted for most of this drag, while in
Croatia, Hungary and Poland it was a combination of aging and outmigration.
16OVERVIEW
reflecting a combination of falling demand for middle-skilled labour and selective
outmigration. 7 8
Changing demand for different skill levels could, however, affect social cohesion, inequality
and levels of life satisfaction (insofar as more workers feel overqualified for the jobs they
hold). While the growth effect of the changing skill composition of employment so far
appears to be relatively small, these shifts impose disproportionate costs on some
occupations, sectors, and regions, while benefiting others, calling for policies to mitigate the
impact of technological change on social cohesion and equality of opportunity.
References
Autor, David H. and David Dorn (2013). “The Growth of Low-Skill Service Jobs and the
Polarization of the US Labor Market.” American Economic Review, Vol. 103, No. 5, pp. 1553–
1597.
Eurostat (2017). “EU Citizens Living in Another Member State – Statistical Overview”
Available at: https://ec.europa.eu/eurostat/statistics-
explained/index.php?title=EU_citizens_living_in_another_Member_State_-
_statistical_overview#Who_are_the_most_mobile_EU_citizens.3F.
Goos, Maarten, Alan Manning and Anna Salomons (2014). “Explaining Job Polarization:
Routine-Biased Technological Change and Offshoring.” American Economic Review, Vol. 104,
No. 8, pp. 2509–2526.
Karabarbounis, Loukas and Brent Neiman (2014). “The Global Decline of the Labor Share.”
Quarterly Journal of Economics, Vol. 129, No. 1, pp. 61–103.
7
Migrants from most emerging European countries are more likely to have completed tertiary
education than their home populations (with the notable exception of the Baltic states; Eurostat
2017).
8
Results are qualitatively similar when defining skills by educational attainment rather than
occupation, with an even smaller -0.04 percentage point drag on growth from changing skill
composition.
17OVERVIEW
Box 2. The use of counter-cyclical fiscal policy in the EBRD regions
Countries in the EBRD regions have been making greater use of flexible exchange rates and
monetary policy to respond to economic shocks. What about fiscal policy? Fiscal policy has
also been used as a counter-cyclical policy tool, with economies on average building fiscal
buffers during good times and using them at times of adverse shocks. Similar to advanced
economies, countries in central Europe and the Baltic states, south-eastern Europe and
Turkey implemented fiscal stimulus packages in response to the Global Financial Crisis of
2008-09. Other economies in the region used expansionary fiscal policy to respond to the
drops in commodity prices (and the consequent drop in remittances from commodity
exporters) – a pattern akin to the average profile of fiscal policy in other emerging markets.
In theory, countries with non-flexible exchange rates regimes may be more dependent on the
use of fiscal policy to respond to changes in economic conditions. However, the analysis
reveals that countries with flexible exchange rates have made greater use of counter-cyclical
fiscal policy than those with fixed exchange rates. This suggests that both counter-cyclicality
of fiscal policy and the use of flexible exchange rates and inflation targeting may reflect the
overall strength of macroeconomic frameworks rather than a choice of one policy instrument
over the other.
This box looks at the use of fiscal policy to manage business cycles in the EBRD regions, with
particular reference to the countries’ choice of exchange rate regimes. The main text
showed that emerging market economies globally, as well as economies in the EBRD regions,
have been making greater use of flexible exchange rates and monetary policy to respond to
economic shocks. What about fiscal policy? This box first provides an overview of the
evolution of revenues, expenditures, government balances and gross debt as a share of GDP
since 2000. It then examines whether the observed patterns correspond to counter-cyclical
fiscal policies, namely, economies building buffers during good times and using them at
times of adverse shocks. Finally, the analysis looks at whether countries with fixed exchange
rate regimes are more dependent on fiscal policy to mitigate adverse changes in economic
conditions.
The evolution of fiscal policies in the regions mirrors the timing of key shocks hitting the
economies. Broadly speaking, government deficits in central and south-eastern Europe (CEB
and SEE) as well as Turkey became smaller, as a percentage of GDP, in the boom years of the
2000s before deteriorating sharply in 2008-2009 as countries implemented fiscal impulses in
response to the Global Financial Crisis of 2008-09. The large deficits of the crisis years have
been reined in since then, through fiscal consolidation relying primarily on expenditure
restraint (with government spending declining as a percentage of GDP). Spending has,
however, drifted back up more recently, resulting in some deterioration of fiscal balances
(see Chart 2.1, panels 1 and 3). This pattern broadly mirrors fiscal trends in advanced
economies.
In contrast, fiscal policies in the rest of the EBRD regions - Central Asia (CA), eastern Europe
and the Caucasus (EEC), the southern and eastern Mediterranean (SEMED) and Russia -
followed trajectories similar to those observed on average in other emerging markets. As in
the former group, fiscal balances improved in the boom years in the early 2000s and
18OVERVIEW
worsened as a result of the Global Financial Crisis, though to a lesser extent than in
advanced economies or CEB and SEE. Having subsequently improved, fiscal balances in this
group worsened again after 2013 as countries used fiscal policy to respond to the drops in
commodity prices or remittances from commodity exporters. Balances have, however,
improved somewhat since 2016, driven by the pick-up in government revenues as a share of
GDP (see Chart 2.1, panels 2 and 4).
Chart 2.1 Revenues, expenditures and overall balances (Percent of GDP)
1. Baltics, Central and South-eastern 2. Caucasus, Central Asia, Eastern Europe,
Europe and Turkey Southern and Eastern Mediterranean and
Revenue Expenditure Balance (right scale) Russia
50 7 50 7
40 6 40 6
5 5
30 4 30 4
20 3 20 3
2 2
10 1 10 1
0 0 0 0
-10 -1 -10 -1
-2 -2
-20 -3 -20 -3
-30 -4 -30 -4
-5 -5
-40 -6 -40 -6
-50 -7 -50 -7
2000
2001
2002
2003
2004
2005
2006
2007
2008
2009
2010
2011
2012
2013
2014
2015
2016
2017
2018
2000
2001
2002
2003
2004
2005
2006
2007
2008
2009
2010
2011
2012
2013
2014
2015
2016
2017
2018
3. Advanced economies 4. Other emerging markets
50 7 50 7
6 40 6
40
5 5
30 4 30 4
20 3 20 3
2 2
10 10 1
1
0 0 0 0
-1 -10 -1
-10
-2 -2
-20 -3 -20 -3
-30 -4 -30 -4
-5 -5
-40 -40 -6
-6
-50 -7 -50 -7
2000
2001
2002
2003
2004
2005
2006
2007
2008
2009
2010
2011
2012
2013
2014
2015
2016
2017
2018
2000
2001
2002
2003
2004
2005
2006
2007
2008
2009
2010
2011
2012
2013
2014
2015
2016
2017
2018
Sources: IMF World Economic Outlook database and authors' calculations.
Note: Simple averages across countries; balanced samples over time. Kosovo excluded due to the short time series.
Debt increased as a share of GDP in both groups of economies. The increase occurred earlier
in CEB and SEE and later in Central Asia, EEC and SEMED - in line with the different timing of
major episodes of fiscal stimulus deployed in response to different shocks hitting these
economies (see Chart 2.2). Russia
and Turkey stand out as
economies where public debt as a
percentage of GDP declined
sharply over the period. In Russia,
the rapid decline in the debt-to-
GDP ratio until 2007 reflected
rapidly growing revenues on the
back of increasing oil prices; the
level of debt has increased
somewhat post-crisis. In Turkey,
high rates of nominal GDP growth
helped to reduce public debt as a
share of GDP, though here, too,
19OVERVIEW
debt has resumed growing recently.
At first sight, these patterns broadly correspond to counter-cyclical fiscal policies, where
fiscal buffers are built in good times (as spending falls as a share of GDP or tax revenues as a
share of GDP increase) to be used at times of adverse shocks (as spending is increased and
taxes are cut). In order to examine the cyclicality of fiscal policy in a more systematic way,
we estimate the elasticity of government expenditures with respect to changes in real GDP.
This measure captures the responsiveness of spending to economic conditions: counter-
cyclical fiscal policy leans against changes in real income and thus tends to be characterised
by low or negative elasticity of government spending with respect to real GDP. We estimate
elasticities separately for positive and negative shocks to economic growth, to account for
the possibility that
governments may provide
fiscal stimulus during bad
times but fail to generate
savings during good times,
or (less likely) vice versa.
Our estimates suggest that
fiscal policy was counter-
cyclical in the EBRD
regions as a whole. We
find that on average the
elasticity of spending to
growth was smaller than
one (estimates larger than
one would correspond to
pro-cyclical fiscal policy).
Expenditures increased
more slowly than GDP in
good years, and kept up
better than GDP in bad
years, thus mitigating
some of the effects of
adverse economic shocks
(see Chart 2.3, panel 1).
Do countries with non-
flexible exchange rates
make more use of counter-
cyclical fiscal policy since
their ability to use flexible
exchange rates and
monetary policy in
response to adverse
20OVERVIEW
economic shocks is severely restricted? In contrast, countries with flexible exchange rates
can rely on exchange rate movements and inflation targeting frameworks as the primary
shock absorbers and may choose to run a less active fiscal policy. In order to examine
whether this has been the case, we estimate elasticities of government spending separately
for countries with flexible exchange rate regimes and those with fixed or heavily-managed
exchange rate regimes.
On average, fiscal policy is estimated to have been more counter-cyclical in countries with
flexible exchange rates, both in the EBRD regions and among emerging markets elsewhere.
In particular, countries with fixed exchange rates tend to spend more in good years than
those with flexible exchange rates (see Chart 2.3, panel 2). This difference between the two
groups is statistically significant in the EBRD regions (albeit not for the other emerging
markets). Overall, fiscal policy in the EBRD regions and in emerging markets has been
somewhat less counter-cyclical than in advanced economies—in particular in terms of
generating savings during the good years. 9
This finding highlights the importance of strong macroeconomic frameworks for managing
economies’ response to adverse shocks. The estimations suggest that both the use of
counter-cyclical fiscal policy and the use of flexible exchange rates appear to reflect the
strength of macroeconomic frameworks and the quality of economic institutions rather than
the choice of one counter-cyclical instrument over the other.
References
Alesina, Alberto, Guido Tabellini and Filipe R. Campante (2008). “Why is Fiscal Policy Often
Procyclical?” Journal of the European Economic Association, Vol. 6, No. 5, pp. 1006-1036.
Ilzetski, Ethan, Carmen M. Reinhart and Kenneth S. Rogoff (2019). “Exchange Arrangements
Entering the 21st Century : Which Anchor Will Hold?” The Quarterly Journal of Economics,
Vol. 134, No. 2, pp. 599-646.
9
Alesina et al. (2008) argued that overspending in good years could be explained by voters being
concerned that budget surpluses may be misappropriated. They would thus push for increased
expenditures during good times, resulting in more pro-cyclical policies when economic institutions are
perceived as weak.
21OVERVIEW
Box 3. Forecasting recoveries from recessions
This box examines recoveries following recessions in economies in the EBRD regions over the
past two decades. We use quarterly data and define recessions as situations when GDP over
a 12-month period was lower than over the preceding 12 months. 10 More conventionally,
recessions are defined as two consecutive quarters of negative growth in seasonally
adjusted quarter-on-quarter terms. Most economies in the EBRD regions, however, do not
publish official estimates of seasonally adjusted quarter-on-quarter growth rates, hence the
use of an alternative approach building on year-on-year quarterly data.
How common are recessions in the EBRD regions? By this metric the median country had two
recession episodes over two decades, though some countries (for instance Poland, Jordan
and Morocco) did not have any, while some countries experienced as many as four. The
incidence of recessions was highest following the Asian and Russian crises of 1997-98, the
Global Financial Crisis of 2008-09 and the subsequent European sovereign debt crisis. There
were very few recessions in the boom years of 2000-2007 as well as in the second half of
2017 and 2018 (see Chart 3.1, panel 1).
Chart 3.1 Frequency and distribution of recessions in the EBRD regions
Sources: CEIC, national authorities and authors’ calculations
How long are typical recessions in the EBRD regions? The median episode over this period
was one year long, though with considerable heterogeneity (see Chart 3.1, panel 2). The
shortest episodes lasted a single quarter; while the longest, in Croatia and Greece, lasted 6
years (see Chart 3.2, panel 1). The median country in the EBRD regions spent 2.5 years out of
20 in recession.
How long does it take to recover to medium-term potential growth? We measure time to
recovery as the number of quarters from the first recession quarter until the quarter where
growth reaches or exceeds the estimated medium-term potential growth. The latter is
estimated based on annual data for more than 120 economies world-wide and takes into
account countries demographic profiles, the quality of economic institutions, the skills base,
the rate of investment and various other economic, social and financial variables.
10
12-month rolling GDP growth and year-on-year changes are used here given uncertainties about
seasonal adjustments in quarterly growth paths.
22OVERVIEW
The median recovery in the EBRD regions took seven quarters, though with significant
heterogeneity (see Chart 3.2, panel 2). Some recessions were followed by rapid (“V-shaped”)
recoveries, with medium-term potential growth reached within half a year, while in other
cases recovery took almost eight years. Furthermore, in 12 recession episodes growth had
not recovered to medium-term potential until the next recession (or to date).
The length of recession does not appear to be a strong predictor of the length of recovery.
Recessions without full recovery were no longer than the rest, with the median duration of
one year.
Chart 3.2 Durations of recessions and recoveries in the EBRD regions
1. Duration of recession episodes by country 2. Duration of recoveries by country
episode 1 episode 2 episode 3 episode 4 episode 1 episode 2 episode 3 episode 4
35
45
30
40
25 35
20 30
25
15 20
10 15
10
5
5
0 0
Belarus
Ukraine
Croatia
Cyprus
Uzbekistan
Tunisia
Azerbaijan
Kyrgyz Republic
Mongolia
Hungary
Lithuania
Morocco
Slovenia
Montenegro
Bosnia and Herzegovina
Tajikistan
Slovak Republic
Romania
Moldova
Georgia
Estonia
Albania
Kosovo
Turkey
Poland
North Macedonia
Latvia
Serbia
Armenia
Kazakhstan
Greece
Russia
Egypt
Turkmenistan
Jordan
Bulgaria
Lebanon
Belarus
Ukraine
Uzbekistan
Croatia
Cyprus
Tunisia
Azerbaijan
Kyrgyz Republic
Mongolia
Hungary
Lithuania
Morocco
Slovenia
Montenegro
Bosnia and Herzegovina
Tajikistan
Slovak Republic
Romania
Moldova
Estonia
Georgia
Albania
Kosovo
Turkey
Poland
North Macedonia
Latvia
Serbia
Armenia
Kazakhstan
Greece
Russia
Egypt
Turkmenistan
Jordan
Bulgaria
Lebanon
Sources: CEIC, national authorities and authors' calculations.
Once recovery is achieved, does growth overshoot the estimated medium-term potential?
We also examine whether growth overshoots the estimated medium-term potential after
recoveries – possibly on account of a widened output gap during recessions. The extent of
such overshooting is the difference between the highest growth (on a 12-month rolling
basis) observed in the year after a recovery has been achieved and the estimated medium-
term potential growth.
In the median economy, growth overshoots by 0.6 percentage points. This suggests that
most recessions reflect prior overheating of the economy, or the output gap (if any) takes a
long time to close once growth returns to its normal levels. The median, again, hides
significant heterogeneity across episodes, ranging from no overshooting to growth
exceeding medium-term potential by as much as 4.7 percentage points following recovery
from a recession. Countries with shorter recessions and recoveries typically overshoot
medium-term potential growth by more (see Chart 3.3), hinting at sharp V-shaped patterns.
On the other hand, countries with long recessions and recoveries overshoot much less or
may not even recover, in line with flat V recoveries or even L-shaped non-recoveries.
Prior to the latest episode (which, using our recession metric, starts in the second quarter of
2019), Turkey experienced three recessions over the last two decades: in 1999-2000, 2001-
2002 and 2009. All of these lasted for one year and recoveries took five quarters. Growth
meaningfully overshot the estimated medium-term potential (by more than two percentage
points) only following the recovery after the 2001-02 episode. These “stylised facts” are
broadly consistent with the forecast for Turkey’s growth in 2019 and 2020.
23OVERVIEW
Sources: CEIC, national authorities and authors’ calculations.
24REGIONAL UPDATES
Regional updates
Central Europe and the Baltic States (CEB)
GDP growth in the CEB region exceeded our expectations and reached 4.7 per cent in 2018.
Similar to in previous years, domestic demand proved to be the core driver of growth.
Increased disposable incomes, mainly thanks to rising wages, boosted household
consumption. At the same time, the persistent low interest rate environment and improved
absorption of EU funds enhanced investment, largely by private corporates, and led to high
levels of capacity utilisation. In addition, companies have started to invest more heavily in
machines as they more often struggle with finding employees for their labour-intensive
production. Key risks to the outlook are tilted to the downside, related to the worsening
environment in western Europe, uncertainties about Brexit and global trade tensions.
Croatia
Economic expansion moderated from the post-recession high of 3.5 per cent in 2016 to 2.6
per cent in 2018, following a 2.9 per cent growth rate in 2017. Private consumption
remained the main driver of growth, fuelled by increased earnings, a higher employment
rate and increasing pace of household lending. The unemployment rate in December 2018
was 8.6 per cent, down from 18.3 per cent in December 2014 (the last year of recession).
However, higher private consumption led to increased imports, and as exports did not
increase by as much, the negative contribution from net exports was higher in 2018
compared to the years before. Fiscal adjustment continued in 2018 albeit at a slower pace.
The 2018 budget surplus is estimated at 0.4 per cent of GDP, following a budget surplus of
0.9 per cent in 2017 (the first surplus since the country’s independence). The strong fiscal
performance and continued economic expansion led to a decreasing public debt ratio, from
a peak of 86 per cent of GDP in 2014 to an estimated 74 per cent in 2018. Investment
continued along its recovery path from 2015, rising about 4-5 per cent per year on average
ever since, and thus contributing almost 1 percentage point to growth per year, as economic
sentiment kept on rising (and is now at its post-crisis maximum). In addition, Croatia is back
to investment grade, thanks to S&P’s upgrade to BBB- in March 2019. We expect growth of
2.5 per cent in 2019 and 2020. Risks to the projection are relatively balanced. On the upside
there is a chance of another improvement of the tourism revenues and faster utilisation of
the EU funds, while the downside relates to the negative spillovers from the country’s ailing
food and retail giant, Agrokor, although risks related to the latter have decreased following
the debt settlement reached in 2018.
Estonia
GDP growth slowed down to 3.9 per cent in Estonia in 2018. Household consumption was
the key contributor to growth, underpinned by rising disposable incomes, to some extent
supported by a substantial rise in the tax-free threshold for personal income tax in 2018.
Investment growth decreased somewhat but remained robust, aided by increasing
construction of residential buildings amid buoyant labour markets and favourable lending
25You can also read