Soap Operas and Fertility: Evidence from Brazil
←
→
Page content transcription
If your browser does not render page correctly, please read the page content below
Soap Operas and Fertility:
                      Evidence from Brazil∗
    Eliana La Ferrara†             Alberto Chong‡              Suzanne Duryea‡

                           This version: October 2008

                                        Abstract
          What are the effects of television, and of role models portrayed in
      TV programs, on individual behavior? We focus on fertility choices in
      Brazil, a country where soap operas (novelas) portray families that are
      much smaller than in reality. We exploit differences in the timing of entry
      into different markets of Rede Globo, the network that has an effective
      monopoly on novelas production in this country. Using Census data for
      the period 1970-1991, we find that women living in areas covered by the
      Globo signal have significantly lower fertility. The effect is strongest for
      women of lower socioeconomic status and for women in the central and
      late phases of their fertility cycle, consistent with stopping behavior. The
      result is robust to placebo treatments and does not appear to be driven
      by selection in Globo entry. Finally, we provide suggestive evidence that
      novelas, and not just television, affected individual choices. First, people
      living in areas covered by the signal were more likely to name their children
      after novela characters. Second, entry of a network that relied on imported
      shows did not have a significant impact on fertility. Third, the impact of
      Globo presence was strongest for women close in age to the main novela
      characters.

   ∗ † Bocconi University and IGIER; ‡ Inter-American Development Bank. We thank Stefano

DellaVigna, Elsa Artadi, Abigail Barr, Francesco Billari, Paula Bustos, Erica Field, Andrea
Ichino, Tommy Murphy, Hugo Nopo, Ben Olken, Ugo Panizza, Michele Pellizzari, Fabrizio
Zilibotti and seminar participants at NYU, Universitat Pompeu Fabra, University of Zurich,
Oxford University, Bocconi University, University of Bologna, CEPR 2007 Development Eco-
nomics Conference in Stockholm, BREAD 2007 workshop in Princeton for helpful comments.
Silvia Redaelli, Enestor Dos Santos Jr, Ted Enamorado, Daniella Kobayashi, Gianmarco Leon,
Vanessa Rios and Victoria Rodriguez provided excellent research assistance.

                                            1
1 Introduction
In the early 1990s, after more than thirty years of expansion of basic schooling,
over 50% of 15 year olds in Brazil scored at the lowest levels of the literacy por-
tion of the Programme for International Student Assessment (PISA), indicating
that they could not perform simple task such as locating basic information
within a text. People with four or fewer years of schooling accounted for 39 per-
cent of the adult population in the urban areas, and nearly 73 percent in rural
areas as measured by the 2000 Census. On the other hand, the share of house-
holds owning a television set had grown from 8 percent in 1970 to 81 percent
in 1991, and remained approximately the same ten years later. The spectacular
growth in television viewership in the face of slow increases in education levels
characterizes Brazil as well as many other developing countries. Most impor-
tantly, it suggests that a wide range of messages and values, including important
ones for development policy, have the potential to reach households through the
screen as well as through the classroom.
This paper examines the effect of three decades of expansion of commercial
television on fertility patterns in Brazil. Fertility is an interesting dimension
of development policy to explore in the context of Brazil. In fact this country
experienced a dramatic drop in fertility in the past forty years. The total fertility
rate was 6.3 in 1960, 5.8 in 1970, 4.4 in 1980, 2.9 in 1991, and 2.3 in 2000 (Lam
and Marteleto, 2003). The only other developing country comparable in size
to have experienced such a sharp and generalized decline is China, where the
decline was the result of deliberate government policy. In Brazil no population
control policy was ever enacted by the government, and for a period of time
advertising of contraceptive methods was even illegal. The change therefore
originated from a combination of supply factors related to the availability of
contraception and lower desired fertility. In this paper we focus on the latter
and investigate one of the channels that may have led Brazilians to desire smaller
family sizes. While there are certainly important changes to the structure of the
Brazilian economy that may be associated with fertility decline, in this paper
we focus on television as a vehicle for shaping individual preferences towards
fewer births.
In particular, we examine the effect of exposure to one of the most pervasive
forms of cultural communication in Brazilian society: soap operas, or novelas.
To this date, the vast majority of the Brazilian population, across all social
classes, watches regularly the 8 pm novela. One group has a virtual monopoly
over the production of Brazilian novelas, Rede Globo. A content analysis of
115 novelas aired by Globo in the two time slots with highest audience between
1965 and 1999 reveals that 72 percent of the main female characters (aged 50
or below) had no children at all, and 21 percent had only one child. This is in
marked contrast with the prevalent fertility rates in Brazilian society over the
same period.
To identify the effects on fertility of exposure to this kind of family values,
we exploit information on the timing of Globo entry into different areas. Our
key independent variable is a dummy that captures whether an area receives
2the Globo signal in a given year, and is constructed from information on the
location and radial reach of Globo broadcasting and retransmitting stations in
every year.
In a first set of results we examine the relationship at the aggregate level, i.e.
over time and across 3,475 Minimally Comparable Areas (AMCs) in Brazil. Us-
ing Census data for the period 1970-1991 we find that, after controlling for time
varying covariates and for time-invariant area characteristics, AMCs reached by
the Globo signal had significantly lower fertility, measured as the number of
children born alive for women aged 15-49. The magnitude of the effect is about
1/4 of the effect of being married, and is comparable to that associated with
an increase of 1 doctor or nurse per 1,000 people.
In a second set of results we use individual level data and estimate the
likelihood that a woman gives birth in any given year between 1980 and 1991,
as a function of individual and household characteristics and of the availability
of Globo signal in the area where the woman lives. Ceteris paribus, Globo
coverage is associated with a decrease in the probability of giving birth of .6
percentage points, which is 6 percent of the mean. The magnitude of this effect is
comparable to that associated with an increase of 2 years in women’s education.
The (negative) effect of Globo exposure is stronger for households with lower
education and wealth, as one would expect given that these households are
relatively less likely to get information from written sources or to interact with
peers that have small family sizes. There is also considerable heterogeneity along
the age dimension. Interestingly, the effect of Globo coverage is insignificant for
women aged 15-24, and is quantitatively larger and significant for women aged
25-34 (a decrease of 8 percent of the mean probability of giving birth for this age
group) and for women aged 35-44 (a decrease of 11 percent of the mean). This
is consistent with the demographic literature on Brazil, which has highlighted
how the decline in fertility was mostly due to stopping and not to delayed first
births.
In the last part of the paper we discuss the extent to which these results
may be interpreted as related to television viewing per se, or also to the type of
programs (novelas) broadcast by Globo. We find evidence consistent with the
idea that novelas did play a role in family decisions, including possibly those on
fertility. Our first piece of evidence comes from naming patterns among school
aged children. Using administrative data on a random sample of AMCs, we
find that the parents living in areas that are reached by Globo are significantly
more likely to name their children after the name of the main characters of
novelas aired in the year in which the children were born. Our second piece
of evidence comes from the entry of the second largest commercial network,
Sistema Brasileiro de Televisao (SBT). Running similar regressions to those that
we run for Globo, we find that exposure to SBT does not significantly affect
fertility patterns. Interestingly, SBT broadcasts programs that are imported
from Mexico and the US and are generally not perceived as realistic portraits
of Brazilian society. Our third piece of evidence exploits variation in novela
content across years, as well as variation in the potential extent of identification
between viewers and novelas’ main characters. We find that decreases in fertility
3were stronger in years immediately following novelas that portrayed messages
of upward social mobility, and for women whose age was closer to that of the
main female characters in those years.
A key challenge for our identification strategy is the possibility that Globo
presence may be correlated with unobserved determinants of fertility. Because
we employ area fixed effects in all regressions, the relevant concern is whether
Globo entry may be correlated with pre-existing fertility trends. We address
this issue in several ways. First, using aggregate data for three Census waves
we show that changes in Globo coverage across waves are not correlated with
changes in the average number of children that women have. Second, we exploit
yearly data on the flow of new births for the period 1958-2000 and we regress
fertility on a set of dummies going from 10 years before Globo entry to 10 years
after. Importantly, we find that there is no decline in fertility before the year in
which Globo enters, but only afterwards (this result is displayed in figure 5 and
discussed in section 5.3). Third, we conduct a series of placebo regressions and
find that (i) future Globo entry in an area does not predict current fertility, and
(ii) Globo presence in neighboring areas does not predict local fertility. Finally,
as we discuss below, our results on content exploit variation within area-year
or across years in a way that is intrinsically non-monotonic, and it would be
difficult to explain those results as originating from trends.
Our paper is related to two strands of literature. The first is the literature on
the determinants of fertility, with particular reference to the role of television
in Latin America. We shall not review this literature here, as we discuss it
in section 2 below in the context of Brazilian novelas. It should be observed
that with respect to these contributions, that are mostly sociological and based
on case studies, our work is the first attempt to identify a causal link with
econometric techniques using a country-wide dataset.
The second strand of literature related to our paper is that on the effects
of the media on social and political outcomes. Contributions in this field fo-
cussed on the role of newspapers and radio as mechanisms of accountability for
politicians (Besley and Burgess, 2002; Stromberg, 2004), and on the effects of
the media on voters’ behavior (Gentzkow, 2006; DellaVigna and Kaplan, 2007).
Other studies investigate the effects of television on social, as opposed to po-
litical, behavior, in particular on children’s school performance (Gentzkow and
Shapiro, 2006) and on adults’ participation in social activities and trust (Olken,
2006).
In a recent contribution, Jensen and Oster (2007) estimate the impact that
the entry of cable TV had on subjective measures of female autonomy, school
enrollment and fertility. They use survey data on a sample of 180 rural villages
in India for the years 2001-2003. Of these villages, 21 introduced cable TV
during the survey period. One difference between our work and Jensen and
Oster’s lies in the breadth of the area covered (using Census data we cover the
universe of Brazilian municipal areas) and time horizon (we explore the effects
of Globo since its entry in the mid-1960s and until the early 1990s). This allows
us to have a considerable degree of variation across areas over time and to look
4at the long run impact of TV viewing on fertility. At the same time, the Census
does not contain information on attitudes.
Another difference with respect to Jensen and Oster (2007) —and to most
of the above cited literature— is that they do not exploit information on the
content of media programs. In our analysis we provide suggestive evidence that
what matters is not only television viewing, but also viewing a set of programs —
novelas— containing certain messages and framed in a way that makes it easy for
the viewers to directly relate to the situations portrayed. Two recent papers have
explored the role of media content. One is the paper by Dahl and DellaVigna
(2008), who focus on the short run effects of movie violence on crime. The second
is the paper by Paluck (2008) who estimates the effects on beliefs and norms of
a radio soap opera featuring messages of intergroup tolerance in Rwanda. Our
work shares a similar motivation as Paluck’s, in that we are also interested in
the possibility that media programs may become vehicles of development policy.
The remainder of the paper is organized as follows. In section 2 we provide
some information on Brazilian novelas and on their main producer, Rede Globo.
Sections 3 and 4 illustrate, respectively, our empirical strategy and the data.
Section 5 contains our econometric results. Section 6 discusses the interpretation
of our results in terms of TV exposure and media content. Finally, section 7
concludes.
2 Background on Brazilian novelas
Television has played a central role for the functioning and reproduction of
contemporary Brazilian society and has played a strategic role in the process
of articulating, diffusing, and institutionalizing new behavioral and attitudinal
patterns in the country (Faria and Potter, 1999). In the span of three decades,
exposure to television messages rose from zero to become universal in urban
areas and to almost half in rural households. One of the crucial reasons for
television’s influence in the country is the strength of its oral tradition.1 In
the early 1990s, after more than thirty years of expansion of basic schooling,
adult literacy had reached only 80 percent. Ten years later, people with four or
fewer years of schooling accounted for 39 percent of the adult population in the
urban areas, and 73 percent in rural areas (Census 2000). Another characteristic
of the country that contributes to the impact of television is the high rate of
geographical, occupational, and social mobility: in this context, television helps
give a sense of belonging (Faria and Potter, 1999). As noted by anthropologists,
in Brazil the effect of television on values and attitudes is by no means confined
to urban areas, but also reaches remote communities in the Amazons, inducing
among other things a reorientation of beliefs on the role of women in society
towards greater autonomy (Kottak, 1990).
1 In 2006, 39% of 15 year students in Brazil reported that they lived in homes with fewer
than 10 books according to the PISA survey. In comparison, fewer than 10% of students from
the OECD countries lived in homes with such few books (OECD, PISA 2006). The OECD
average excludes Mexico. The sample excludes 15 year olds who have left school.
5Rede Globo
Television became a mass medium in Brazil earlier than in most developing
countries. The military government in power in 1964 saw the potential of televi-
sion as a tool for integrating the country, creating a national identity, developing
markets, and controlling political information. The military pushed television
deeper into the population by subsidizing credit for set sales and, in partic-
ular, by promoting the growth of one specific network to encourage national
production. Rede Globo, selected as the privileged partner, began functioning
in 1965 and quickly became the leading national network. Today, Rede Globo
is the fourth biggest commercial network in the world, after ABC, CBS, and
NBC, with a coverage of about 98 percent of the total number of municipalities
in Brazil, which represents about 17.6 millions of households.
For the purpose of our identification strategy, it is important to understand
how the expansion of Rede Globo occurred. During the military regime of gen-
eral Joao Baptista Figueredo (1978-1985), the concessions of television networks
followed clientelistic, political, and ideological criteria. The dictator had the ab-
solute power to give the licenses for radio and television stations. Although this
law was changed to put the congress in charge of approving the licenses, the
clientelistic criterion was not abandoned at all (Lima, 2001). The relevance of
the role of the media for the military regime was central. As several authors
have stated, the military regime had an “obsession” with national integration,
and the media was in charge of the cultural, political and economic integration.
During that period the association between the government and Rede Globo
was clear (Miguel, 2001).
The government of president Jose Sarney (1985-1990), the first elected gov-
ernment after the fall of the military dictatorship, provides a good example
on how the clientelistic provision of licenses kept going. On 1989, there was
a constitutional amendment to enlarge the government term from four to five
years. During the two years before, the government gave a large number of TV
and radio licences to companies associated with congressmen who later voted
in favor of the constitutional amendment (Costa and Brener, 1997). About the
same situation happened again during the first mandate of president Fernando
Henrique Cardoso (1995-1998), when the congress was about to vote another
constitutional amendment which intended to approve reelection. Again a large
number of licenses for retransmission stations were given to firms associated with
congressmen (Lima and Capparelli, 2004). Indeed, to date there is a highly con-
centrated ownership of the media in Brazil: TV concessions, in particular, are
controlled by eight families or groups.
An important reason why Rede Globo was the chosen partner of the govern-
ment has to do with the fact that the network had a long standing cooperation
agreement with Time-Life during the sixties. This included assistance with
marketing strategies which at the time were unheard of in Brazil. The mili-
tary government apparently assessed that Rede Globo matched best with their
integration objectives especially given the fact that by the early seventies the
marketing know-how had already been assimilated (dos Santos and Capparelli,
2005).
6The instrumental use of licenses for clientelistic and political goals helps our
identification strategy in that it mitigates concerns that Globo entry in differ-
ent municipal areas may be driven by pre-existing (declining) fertility trends.
Indeed, we empirically test for this possibility below and find that it is not
supported in the data.
Obviously, political clientelism and a solid marketing strategy had to be
complemented with a viable, quality product. Such product was the novelas. In
fact, to this day a typical novela is watched by anything between 60 to 80 million
viewers. The reason for the enormous success of this television format from Rede
Globo during the last three decades can be traced to three aspects. First, they
are all set up in easily recognizable locations so that viewers can better relate
with the story. The context and the issues novelas deal with always relate to
the daily life of the Brazilian population. Second, the network reaches viewers
by making sure that its novelas use a colloquial language, a typical middle class
setup, as most of the viewers identify, regardless of their own socioeconomic
background, most telenovelas have an element of social mobility, and the novelas
mix each other with real, everyday life, as its characters celebrate the same
festivities, and national occurrences in “real time”. Third, the network spare
no expenses in order to produce novelas of the highest technical and artistic
quality. In fact, to this day, each episode of an average novela costs around
125,000 dollars, which is about fifteen times more than the production costs of
the other Latin American novela powerhouse, the Mexican Televisa (Marques
de Melo, 1988).
Fertility decline in Brazil
As mentioned in the Introduction, in a few decades fertility fell rapidly in
Brazil, with the total fertility rate (TFR) declining by over 50% from 1970 to
1990. With the military government far more interested in populating remote
areas to protect borders than in organizing and promoting family planning pro-
grams, Brazil has often been described as an ideal environment for exploring
specific determinants of fertility decline.
A large demographic literature has examined the proximate determinants of
fertility. High rates of female sterilization have played a role as a main prox-
imate determinant, along with increased use of the birth control pill (Merrick
and Berquó 1983, Rutenberg et. al 1987). The rank of sterilization as a pre-
ferred method of contraception is related to institutional policies encouraging
the delivery of births by cesarean section as well as government propaganda in
the late 1960s which warned of the dangers of the birth control pill. The role of
abortion, illegal in Brazil, is less clear.
The timing of births over the life cycle has also been explored in detail.
Changes in the starting age of fertility have been negligible, related both to
relatively stable marital patterns as well as persistently high rates of adolescent
fertility. An increased spacing of births has contributed to the overall decline,
although the stopping of childbirth at younger ages has been found to be more
important (Martine (1996), Flores and Nuñez (2003)). While the increase in
education explored by Lam and Duryea (1999) can explain a large share of the
7overall decline, none of the aforementioned factors replicate the intertemporal
and interspatial pace of the decline satisfactorily. Additionally, these studies
typically do not address the underlying forces driving the higher demand for
contraceptives or education.
Novelas and fertility
One of the ideas advanced in sociological and communication studies is that
there may be a link between the diffusion of television, and specifically of novelas,
and fertility decline (e.g., Vink, 1988).
Brazilian novelas are rather different from Mexican ones, and in general
from stereotypical Latin American telenovelas, because of the high quality of
their plots and of their making. Since military-imposed censorship was in effect
during most of the developmental period of the novela, a number of important
writers started to write screen plots for Rede Globo. Several of them were
having political problems with the military government.2 These authors saw the
opportunity of employment in the cultural industry as a way to fight dictatorship
through the reinforcement of new values and ideas in their plots. In addition to
freedom, recurrent themes include: criticism to religious and traditional values,
consumption of luxurious goods, the portrayal of wealthy families, the display
of new lifestyles, the circulation of modern ideas such as female emancipation
in the work sphere, the female pursuit of pleasure and love even if through
adultery, display of homosexuality, criticisms to machismo, and emphasis on
individualism (Rios-Neto, 2001; Fadul, 1999). In section 4.2 below, we try
to quantify the extent to which some of these values (specifically, on fertility,
marriage and divorce) are contained in the novelas produced by Rede Globo.
Interestingly, family planning and population control were not explicitly ad-
dressed by Brazilian television or by novelas. Moreover, until the late seventies
the government was reluctant to adopt population control policies: even adver-
tising of contraception methods was considered illegal (McDonough and Souza,
1994). Still, novelas in Brazil were, and still are, loaded with material directly
or indirectly relevant to family size preferences. Television reiterates the disclo-
sure of a very specific model of family: small, beautiful, white, healthy, urban,
middle and upper middle class consumerist family. Novelas have been a pow-
erful medium through which the small family has been idealized. On the one
hand, in many instances, the content of the story is related to the urban middle
class of Rio de Janeiro and Sao Paulo, and the novela material, a fortiori, deals
with the family type, spreading its values, attitudes and behavioral patterns.
On the other hand, the small family may result from the constraints imposed
by the plot. In Brazilian novelas the drama typically revolves around four or
five families. In order to keep the number of characters manageable, no family
2 The extreme example is the case of Roque Santeiro, the most popular Brazilian novela
ever, which was initially censored by the military government and later, when it was broadcast
once democracy was brought back, it was viewed by nearly 100 million people, achieving a
rating that fluctuated between 90 and one hundred percent. The reason for the censorship of
the novela had little to do with the topic itself, but rather with the fact that the author was
a communist.
8can be very large. Sometimes this constraint leads to highly unrealistic family
profiles.
The findings of an experimental focus group discussion illustrate this point.
Herzog (1994) asked the group subjects, adult women of middle and lower-
class backgrounds, to portray the families that are more frequently displayed on
television by using available photographs, drawings, and printed material. They
asked the same subjects to portray the family of common people using the same
material. The results were clear: television families are small, rich and happy;
the families portrayed as common people are poor, contain more children and
the faces reveal unhappiness.
To sum up, constant exposure to smaller, less burdened television families,
may have created a preference for fewer children and greater sensitivity to the
opportunity costs of raising children (Faria and Potter, 1999).
3 Empirical strategy
In this paper we try to provide empirical evidence for the above conjecture, as
advanced by the sociological literature. We shall do so by combining information
on fertility with information on the timing of Rede Globo penetration in different
areas of Brazil. We shall conduct our analysis at different levels of aggregation.
The first set of results uses aggregate data at the Minimal Comparable Area
(AMC) level -defined below- over three time periods covering Census years 1970,
1980 and 1991. We estimate:
yjt = Xjt β + γGjt + μj + λt + εjt (1)
where yjt is the outcome of interest (average fertility in area j at time t, as
defined below), Gjt is a dummy equal to 1 if area j received the signal of Rede
Globo in year t, Xjt is a set of time-varying controls at the area level, μj
and λt are, respectively, area and year fixed effects, and εj is the error term.
Time-varying controls Xjt include the share of married women in the area, the
share of catholic households, the average years of education of the household
head, an index of household wealth, and the number of doctors and nurses
per 1,000 people in the area. Note that by adding area fixed effects (μj ) we
control for time-invariant unobserved characteristics that affect fertility and may
also be correlated with the timing of Globo entry. The time dummies capture
instead the secular (declining) trend in fertility that is common to all areas.
Our identifying assumption is that, conditional on area and time fixed effects
and on the time-varying controls Xjt , the year of Globo entry is orthogonal to
the error term. We shall test the plausibility of this assumption in section 4.2
below. In all regressions our standard errors are clustered by AMC.
There are two potential sources of endogeneity in the timing of Globo entry
to different locations. The first is that the Ministry of Telecommunications may
have used selective criteria in awarding licenses. As we explained in section 2, the
considerations underlying the Ministry’s choices were mostly linked to patronage
vis-a-vis influential Brazilian families, and with no obvious link to local fertility
9patterns. A second concern is that, because Globo is a commercial television,
it may have chosen to enter wealthier locations first, as the latter would yield
higher profits from advertising. For these reasons, we control for area fixed
effects and for time-varying characteristics including a proxy for wealth in our
regressions. We also explicitly assess the potential selection on our variables of
interest.
In a second set of results we exploit individual level data to estimate the
probability that a woman gives birth in a given year as a function of individual
controls and Globo presence. As we explain below, in these regression we employ
the 1991 Census wave and build a retrospective history of a woman’s fertility
for the previous 12 years. We thus have 13 observations (years) for each woman
in childbearing age. We estimate the following linear probability model:
yijt = Xijt β + γGjt + μj + λt + εijt (2)
where yijt is equal to 1 if a woman i living in area j gives birth to a child in
year t; Gjt is a dummy equal to 1 if area j received the signal of Rede Globo at
least 9 months prior to year t; μj are AMC fixed effects and λt are year fixed
effects. The variables in Xijt include the woman’s age, the stock of children
she had up to year t, and a dummy for whether she gave birth in t − 1, plus
her marital status, religion, the education of the household head and an index
of household wealth. We shall estimate (2) both for the full sample of women
aged 15-49, and for different age brackets, to assess what are the age categories
on which Globo viewing has a relatively larger impact. We cluster our standard
errors by AMC in all regressions.
We shall also consider if exposure to television during different periods of
a woman’s life leads different outcomes in terms of fertility behavior. For this
purpose, we shall modify our estimating equation as follows:
10−19 40−49
yijt = Xijt β + γ 1 Nijt + ... + γ 4 Nijt + μj + λt + εijt , (3)
10−19
where Nijt is the number of years woman i living in area j at time t has
been exposed to Globo programs during age 10-19, 20-29, and so on in 10-year
40−49
brackets until Nijt , which is the number of years of exposure to Globo during
age 40-49.
Using individual level data we shall also test for the presence of heteroge-
neous effects in the impact of Globo according to socioeconomic status, and
estimate the interacted specification:
yijt = Xijt β + γGjt + δ(Gjt ∗ xijt ) + μj + λt + εijt , (4)
where xijt will be, alternatively, education and wealth.
Finally, in a last set of results we shall explore the extent to which our results
can be linked to novela viewing rather than simply television viewing, and rely
on ancillary regressions as well an on estimates of (1) and (2) where instead of
a dummy for the presence of the Globo signal, we introduce a dummy for the
presence of another TV network with different programming characteristics.
104 Data
4.1 Fertility
For the first set of regressions (1), our dependent variable is constructed aggre-
gating individual level data from three rounds of the Brazilian Census: 1970,
1980 and 1991. We restrict the sample to women aged 15 to 49. Each woman
has a geographic identifier that allows us to attribute her to the municipio where
she lives. We do not actually use municipios but rather Minimally Comparable
Areas (AMCs) as our spatial unit of analysis because this is the smallest con-
sistently defined geographic area provided by the Brazilian Statistical Institute.
The geographic borders of Brazil’s approximately 5000 municipalities changed
over time, while there are 3,659 consistently defined AMCs for each round of
the Census.
We define fertility as the number of live births that a woman declares to have
had. This variable, which we denote as ‘LIVEBIRTHS’, is recorded directly as
a specific question in each round of the Census and includes children born alive
to a woman, regardless of whether the child is currently living in the household
or not. Our dependent variable yjt is the average value of ‘LIVEBIRTHS’ for all
women aged 15-49 in AMC j and Census year t. Note that this variable moves
rather slowly over time: in our sample the average number of live births across
AMCs decreases from 3.0 in 1970 to 2.4 in 1991.
From the Census we also construct the following independent variables at the
AMC level: average age of women aged 15-49; average years of education of the
household head3 ; a proxy for average wealth that is constructed through prin-
cipal component analysis from durables ownership and access to basic services
(electricity, sanitation, etc.)4 ; share of women aged 15-49 who are married; share
of catholic households; and the number of doctors and nurses with a diploma per
1000 people. The latter variable is meant to control for supply side factors that
may have driven the reduction in fertility contemporaneously with the entry of
Globo into different areas, notably health facilities and medical staff.
For the individual level regressions (2) we shall employ as dependent variable
a “flow” variable, that is, a dummy BIRTH ijt equal to 1 if woman i living in
area j gave birth in year t. This variable is not explicitly incorporated in the
Census questionnaire. We therefore impute it using the following procedure. For
3 We chose the education of the household head, rather than that of the woman, to mitigate
potential endogeneity problems. For younger women, the decision to acquire more education
may be a response to novela viewing; also, for these women the causality may run from
fertility to education as they may stop studying once they have a child. If we include among
the controls the number of years of education of the woman (as opposed to those of the head),
our estimates of the Globo effect remain virtually unchanged. We show this for the individual
level regressions in table 5.
4 The variable denoted as "wealth" in the regressions is the first principal component ex-
tracted from the following set of variables: share of households with access to piped water from
the public system, share of households with sanitation, share of households with electricity,
share of households owning a radio, share of households owning a refrigerator, share of house-
holds owning a car. We do not consider ownership of a TV set, as this is likely endogenous
to the availability of the Globo signal.
11each woman in the age range 15-49, we know from the household roster which
children of hers are living in the household. We retain only children younger
than 12, as this increases our confidence that we measure all the births occurred
in that time period. In fact in the Brazilian context it is extremely unlikely that
a child leaves the household before the age of 12. Given that the Census reports
the age of all household members, we compute the year of birth of a child as
the difference between the year of the Census interview and the age of the child.
We thus recover every year in which a woman gave birth over the 12-year period
before the Census. Consider for example a woman interviewed in 1991 who has
two children living with her. One is 2 years old and the other is 7 years old.
Then we know that this woman gave birth in 1984 and 1989 and, according to
our procedure, in no other year during the period 1979-91. We thus construct
a dummy taking value 1 in years 1984 and 1989, and 0 in the remaining years
during the period 1979-1991.
Due to the size of the original data, for the individual level regressions we
extract a 5% random sample from the 1991 Census. We chose this Census wave
because the 12 years before are the period where the bulk of Globo expansion
occurred, as we document in the next section (figure 1).
The construction of the variable BIRT Hijt rests on the assumption that a
woman’s children do not leave the household before the age of 12. While we
cannot rule out that this may occur in a small number of cases -which would lead
us to underestimate fertility- we have checked the consistency of our method by
comparing our imputed figures with the answer to the Census question about
the number of children currently alive for women younger than 25. In fact, given
their age, these are women whose children should all be in the household if our
conjecture is correct . Our results indicate that our method is quite reliable: in
96 percent of the cases our imputed number of children exactly coincides with
the number of births these women declare; in a remaining 3.5 percent of the
cases we underestimate the number of children born by 1 unit.
From the Census we also take the following independent variables: age of the
woman; years of education of the household head; a proxy for wealth constructed
from durable goods ownership and access to basic services5 ; a dummy equal to
one if the woman is married, a dummy for catholic religion, and the number of
doctors and nurses with a diploma per 1000 people.
Summary statistics of all variables are reported in Appendix Table A1.
4.2 Rede Globo and novelas
Our second data source is information provided by Rede Globo on the year
in which different areas got access to their programs. For each broadcasting or
retransmitting station, we know the year and the location where it was installed
(latitude and longitude), as well as its radial reach in kilometers. This allows us
5 The variable denoted as "wealth" in the regressions is the first principal component ex-
tracted from the following set of dummies for each household: access to piped water from
the public system; sanitation; electricity in the house; ownership of a radio; ownership of a
refrigerator; ownership of a car.
12to know which municipios where reached by the signal of any particular antenna
and in which year they first started receiving the signal. We then match this
information with the AMC corresponding to each municipio, and construct a
variable Globo coveragejt equal to 1 if AMC j is within the signal radius of a
Globo broadcasting or retransmitting station in year t, and 0 otherwise.6
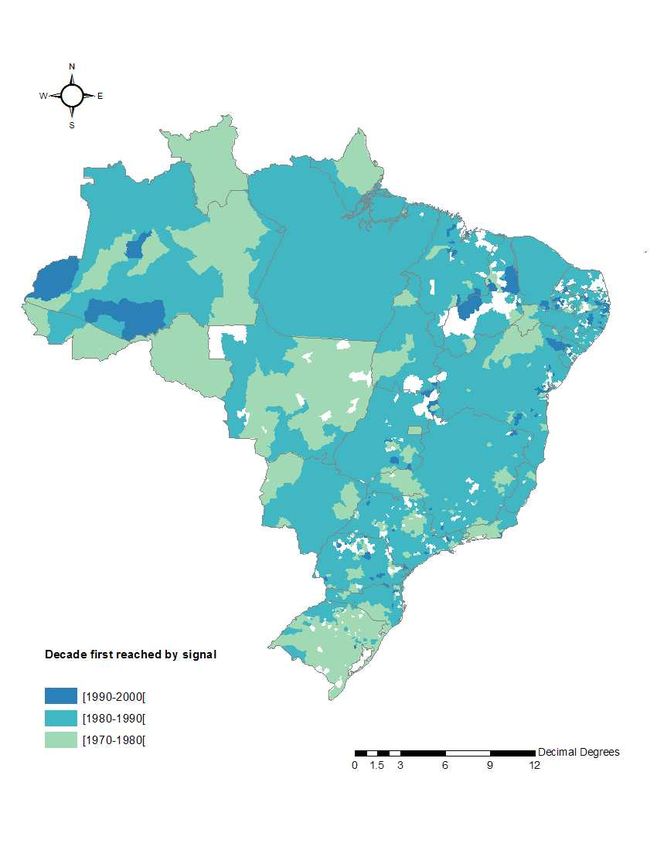
[Insert Figures 1, 2]
Figure 1 shows the increase over time in the number of AMCs reached by the
Globo signal. In 1970, only 4 AMCs out of 3,659 were receiving the Globo signal;
in 1980 the number had increased to 1, 300 and in 1991 to 3, 147. Figure 2 shows
the geographic expansion of the network between 1970 and 2000. Lighter colors
correspond to an earlier exposure to the signal (with the exception of white,
which stands for ‘no signal’). This figure suggests that the entry of Globo into
different areas may not have been random. Globo reached the most developed
parts of Brazil first, which is potentially a concern for our identification strategy
because these areas are also those with lower fertility. However, we show below
that after controlling for our time-varying controls and for AMC fixed effects
there seems to be no evidence of selection on unobservables correlated with
fertility trends.
To motivate our analysis and help us interpret the results, we have collected
a large amount of data on the content of individual novelas broadcast by Rede
Globo since the start of its operations. Rede Globo traditionally airs three sets
of novelas:
• novela das seis, at 6 pm, which are typically historical stories about slavery
and colonial time and have romantic content. These are the novelas with
the lowest audience.
• novela das sete, at 7 pm, which are mostly contemporary comedies and
often include elements of envy and conspiracy;
• novela das oito, at 8 pm (or 9 pm), which are heavily focussed on social
issues and have by far the highest audience throughout the country.
We have coded a number of variables for all the 7 pm and 8 pm novelas from
1965 to 1999. Appendix Table A2 reports the full list of titles with beginning and
ending date. For the purpose of the present analysis, the most relevant variables
coded are: age of first female character; number of children of first female
character; marital status of first female character; and whether the first female
character is unfaithful to her partner (in the case of a married woman, whether
she has an extra-marital relationship). The distribution of these variables is
shown in table 1.
6 In order to minimize the error due to the fact that we attribute coverage to the entire mu-
nicipal area, we exclude from the sample the top 5% AMCs in size, and use for our regressions
3, 485 AMCs. The results are very similar when using the full sample.
13[Insert Table 1]
Over the full sample of 7 and 8 pm novelas aired between 1965 and 1999, in
62.2 percent of the novelas the main female character does not have any children,
in 20.7 percent she has one child, 9 percent two children, 4.5 percent three
children, and in the remaining cases has four or more children. It is interesting
to also consider a restricted sample of novelas where the main female character
is below 50 years of age (which anyway comprises 97 out of 115 novelas), as
these may be the characters with whom women in childbearing age most easily
identify. In this smaller sample, the percentage of childless women increases to
71.6, 21.1 percent of the women have one child, and only 7.4 percent have two
or three children (no woman has four or more). Finally, if we look at married
women only, 41.2 percent of them has no children, 33.3 percent has one child and
20.1 has two. These figures are quite astonishing if we compare them to actual
fertility patterns in the Brazilian population over this period. Furthermore, the
low fertility among novela heroines is not driven by the more recent novelas: if
anything, quite the opposite.
[Insert Figure 3]
Figure 3 shows the average number of children of the main female character
of all 7 pm and 8 pm novelas aired in a given year. The numbers corresponding
to each observation represent the sample size (number of novelas) from which
the average is computed. As a general observation, with the exception of year
1996, the average female main character has no more than one child in each
and every year between 1965 and 1999. Most strikingly, in the first decade of
operation of Rede Globo, every 7 pm and 8 pm novela with the exception of
two were about a woman who had no children at all. Similar observations apply
to variables like marriage, divorce and extra-marital relationships. Only 29
percent of the main female characters in novelas are married (27 in the sample
younger than 50); 12 percent are divorced or separated (10 percent in the sample
younger than 50). In the full sample, 26 percent of the main female characters
are unfaithful to their partner (29 percent in the sample younger than 50 and
42.3 in the married sample younger than 50). While for the latter variable it
is not possible to find a counterpart in Census data, in the fiction marriage
rates are markedly lower and divorce rates markedly higher than in Brazilian
contemporaneous society. In fact, in related work we analyze at the aggregate
level the relationship between Globo presence and divorce rates (Chong and
La Ferrara, 2008). These observations make us confident that the role models
portrayed in the programs of the television channels we shall analyze were clearly
consistent with a radical re-orientation of society’s attitudes towards women’s
roles in the family, including fertility.
5 Econometric results
In this section we take advantage of variation in the timing of Globo entry into
different areas to formally test the hypothesis that exposure to the programs
14of this television network was associated with a reduction in fertility rates. We
start by presenting evidence at the aggregate level, and then move to individual
level regressions.
5.1 Aggregate regressions
Table 2 contains our first set of results, obtained using aggregate data at the
Minimal Comparable Area (AMC) level for the Census years 1970-1991.
[Insert Table 2]
The dependent variable in this table is LIV EBIRT HSjt , i.e. the average
number of live births for women aged 15-49 in the AMC in any given Census
year. Our key variable of interest (Globo coverage) is a dummy equal to one
if the AMC receives the Globo signal in that year. The table reports OLS
coefficients and standard errors clustered by AMC. In column 1 we run a simple
regression on the full sample controlling only for time dummies. On average,
after accounting for the secular declining trend in fertility, areas reached by
Globo have an average number of live births that is lower by 0.3. Of course,
this coefficient cannot be interpreted due to the fact that Globo presence in an
area may be correlated with unobserved characteristics that are associated with
lower fertility. In columns 2 and 3 we thus introduce different area fixed effects
to control for differences in time-invariant unobservables across locations. We
start with State (Unidade Federacao, UF) fixed effects in column 2, and move to
AMC fixed effects in column 3, which gives a full panel fixed effects regression.
In this last regression the coefficient of the Globo variable is −.027.
In columns 4 to 6 we include a number of controls to account for time-varying
differences across AMCs. These variables are: the average age of women in the
AMC, as well as the share of women ages 15 to 24 and the share of women
aged 25 to 34; the average years of education of the household head; an index
of wealth built from information on durable goods ownership and quality of
the house; the share of married women in the AMC; the share of Catholic
households in the AMC; and the number of doctors and nurses with a diploma
per 1000 people in the AMC. We do not include the share of households owning
a TV set as this is likely an endogenous variable, but we show this control in
a sensitivity table below. After we include these time-varying controls and we
control for AMC fixed effects, the coefficient on the Globo variable is −.03, and
is significant at the 5 percent level (column 6). Surprisingly, once we control for
AMC fixed effects, the education of the head has a very small effect on fertility.
Age, wealth, marriage rates and health supply factors play a significant role in
explaining fertility. The coefficient on the share of catholic households is not
statistically significant.
Prima facie, the effect we find on Globo coverage may seem small. The mean
of our dependent variable across AMCs is 2.67 and the standard deviation is
.55. However, it should be noted that the average number of live births changes
very little over time. In fact the mean value of LIV EBIRT HS is 2.98 in 1970,
152.66 in 1980 and 2.36 in 1991. If we compare the effect of Globo exposure
with that of one more year of education of the household head, the effect of
Globo is substantially larger. This is remarkable in a country where the average
education of household heads over this period is 2.72 years (and the standard
deviation is 2.37). Also, from column (6) of table 2 we see that the effect of
Globo exposure is comparable in size to that of having one more doctor or nurse
per 1000 people, which is also remarkable given that the mean of this variable
is .2 (standard deviation .75).
Finally, to quantify the magnitude of the effect it can be useful to combine
the estimated coefficient of Globo coverage with the rate of TV ownership in
the population, which is .41 on average over this period. If all and only women
living in households that owned a TV watched Rede Globo, the effect of Globo
on women effectively watching TV would be a decrease in LIV EBIRT HS of
.073. This rough estimate may still be downward biased if the audience of Rede
Globo were below 100 percent. On the other hand, it may be biased upwards if
people watched TV in their neighbors’ house or in public places.
[Insert Table 3]
In table 3 we perform some sensitivity analysis adding to the specification
of column 6 of table 2 a number of variables that we prefer not to include in
our baseline specification as they may be endogenous, but that may have been
relevant in shaping Globo’s entry decisions. The first is the ownership rate of
television sets among households in the AMC. As we see in column 1 of table
2B, this variable is positively correlated with fertility, and its inclusion does not
substantially affect the coefficient of Globo coverage. In column 2 we control for
female employment, and again find no effect on our Globo variable, despite the
fact that higher female employment is associated with lower fertility. A similar
consideration applies to population density. Finally, in column 4 we include
the "Index of Potential Consumption" (IPC) estimated by the Instituto Target
Pesquisas e Servicos de Marketing, an index use by Globo in order to measure
the acquisitive power of the different areas.7 This variable is not significantly
correlated with fertility and its inclusion does not affect the coefficient on Globo
coverage.
[Insert Table 4]
In table 4 we estimate a similar set of regressions, but we focus on the length
of exposure to Globo programs, rather than simply on whether an area was
reached by the signal. Our variable of interest is the number of years for which
an AMC was covered by the Globo signal. The results we obtain are very similar
to those of table 2. In the specification with all controls and AMC fixed effects
(column 6), ceteris paribus one more year of Globo coverage is associated with
a reduction in LIV EBIRT HS of .01.
7 We were not able to receive the index directly from the Instituto Target, but we con-
structed it from raw data using the methodology described by Target in its supporting docu-
mentation.
165.2 Individual level regressions
We next move to a second set of results which employs yearly data at the
individual level. The sample includes women aged 15 to 49 in the years 1979-
1991. We estimate model (2) as a linear probability model and cluster the
standard errors by AMC. We have also tried clustering by individual, to allow
for arbitrary autocorrelation within a woman over time, and we found that our
standard errors were actually smaller. In what follows we therefore chose to
report the more conservative standard errors, i.e. those clustered by AMC.
The dependent variable BIRT Hijt is a dummy equal to 1 if woman i living
in area j gave birth in year t, and 0 otherwise. Our variable of interest is a
dummy capturing whether the area where the woman lived received the Globo
signal in that year.8 Other controls include the age of the woman and its
squared, the stock of children the woman already has (excluding the newborn)
and the square of this variable, a dummy for whether the woman gave birth in
the previous year, marital status of the woman, the average years of education
of the household head (or of the woman, depending on the specification), and an
index of wealth built from information on durable goods ownership and quality
of the house.9 The results are reported in table 5.
[Insert table 5]
Column 1 displays our baseline estimates for the full sample of women aged
15 to 49. The coefficient of Globo coverage is negative and significant at the 1
percent level. Ceteris paribus, a woman living in an area that receives Globo
is .6 percentage points less likely to give birth in any given year (the mean of
the dependent variable is .09). In column 2 we control for the number of years
of education of the woman, rather than of the household head. The estimated
coefficient of the Globo variable is unchanged. The magnitude of the coefficients
indicates that, ceteris paribus, being exposed to Globo programs leads to the
same decrease in the probability of giving birth as an increase of 2 years in the
woman’s education. This is quite relevant, given that the average education of
women in our sample is 5.7 years.
In columns 3 to 5 we test for the presence of heterogeneous effects along
the dimensions of education and wealth. We introduce among the regressors an
interaction term between Globo coverage and (i) the years of education of the
household head (column 3); (ii) the years of education of the woman (column
4); and (iv) the wealth index of the household (column 5). In all cases we find
that the negative effect of Globo exposure on fertility is strongest for women
living in poorer households and households with lower levels of education, and
8 To take into account the length of the pregnancy period, at any point in tome we consider
the AMC as covered if it was reached by the signal at least the year before.
9 Age and the stock of children vary across women and are time-varying for each woman;
marital status, education and wealth vary across women but are time invariant. We do not
control for Doctors and nurses per 1000 people in these regressions because this variable
only varies across AMCs and is absorbed by the AMC fixed effect. Our results are virtually
unchanged if we include a dummy for whether the woman gave birth in the previous year.
17is attenuated for richer and more educated households. This is quite impor-
tant from a policy point of view, because it is exactly for the poorer and less
educated individuals that we should expect a medium like television to have
the most potential in terms of communication. Rich and educated households
may already be exposed to different life-styles and role models through written
media or social interactions.
[Insert table 6]
In table 6 we explore another dimension of heterogeneity in impact, that
is, age. In columns 1 to 3 we split the sample into three age groups: 15-24,
25-34, 35-44. The results in the table suggest interesting differences among age
groups. For the youngest age bracket, i.e. women aged 15-24, Globo coverage
decreases the probability of giving birth by .2 percentage points, but the effect
is not statistically significant (the mean of BIRT H for this group is .10). For
the age group 25-34, which on average has a probability of giving birth in any
given year of .135, Globo presence is associated with a reduction of 1 percentage
point in the likelihood of giving birth. The effect is also very strong for the next
age group, i.e. women aged 35 to 44. The average probability of giving birth for
this group is .057 and exposure to Globo leads to a reduction of .7 percentage
points, that is quite sizeable in relation to the mean.
In columns 4 and 5 of table 6 we estimate the effect of length of exposure
to Globo, allowing for a differential effect of exposure at different ages.10 We
find that among women aged 30 to 49, one more year of exposure as a teenager
(i.e., during age 10-19) decreases the likelihood of giving birth by .003, and has
a similar impact in terms of magnitude as one more year of exposure during
age 20 to 29. On the other hand, years of exposure during age 30 to 39 have
the strongest effect on fertility, with an estimated coefficient of −.006. Among
women aged 40 to 49 (column 5) we find that one more year of exposure during
age 20 to 29 decreases the likelihood of giving birth by .008, a similar effect
as one more year of exposure during age 30 to 39 (the estimate being −.009).
Exposure during the age 40-49 leads to a reduction of .2 percentage points in
the probability of giving birth.
It is worth discussing the above findings in relation to the demographic
literature on Brazil. An apparently puzzling result in table 6 is the absence
of significance of Globo exposure for the youngest age group, women aged 15
to 24. However, this is very consistent with what is known about the nature
of changing fertility patterns in Brazil. Martine (1996) and Flores and Nuñez
(2003) find that changes in the starting age of fertility have been negligible in this
country, related both to relatively stable marital patterns as well as persistently
1 0 Thevariables “Years exposed during 10-19”, ... “Years exposed during 40-49” are defined
only for women who have reached the relevant age bracket. Therefore the sample in column
5 includes women aged 40 to 49 because these are the only ones for which “Years exposed
during 40-49” is non-missing. On the other hand in this column “Years exposed during 10-19”
is not included among the regressors because it is identically zero for the 40-49 age group.
Column 4 enlarges the sample to women aged 30 to 49, and for this group the coefficient on
“Years exposed during 10-19” can be estimated.
18high rates of adolescent fertility. On the other hand, increased spacing of births
and -especially- stopping of childbirth have been found to be more important
(Moreno, 1991). These findings are confirmed in our data, as illustrated in figure
4.
[Insert figure 4]
The histograms in figure 4 represent the average number of live births for
women aged 15-19, 20-24, and so on until 40-44, for the three Census years in
our sample. Interestingly, over the period 1970-1991 there has been absolutely
no decrease in the average number of live births for women younger than 25. By
the age of 24, the average woman in our sample had one child both in 1970 and
in 1991. What happens between the age of 25 and that of 35, on the other hand,
is very different over this period. In 1970, a woman aged 30 to 34 would have
had on average 4.4 live births in her life; in 1991 this number had decreased to
3.2. A similar decline occurred between 35 and 45 years of age. In 1970, a woman
aged 40-45 would have had on average 6.4 live births in her life; in 1991 this
number had decreased to 4.9. This data suggests that it is in the intermediate
and late stages of their reproductive life that Brazilian women chose to have
fewer children, which is consistent with our estimates in table 6.
5.3 Identification
The key identification assumption underlying our approach is that Globo entry
in a market, though not random, was uncorrelated with pre-existing differences
in fertility trends across areas, after controlling for time varying controls and
time invariant area characteristics. To assess the plausibility of this assumption
we proceed in several ways.
First of all we rely on the individual level data to exploit yearly variation
in birth flows and test whether the decline in fertility occurs in correspondence
with the introduction of Rede Globo in an area, or precedes it. For this purpose,
we use four Census waves (1970, 1980, 1991, and 2000) in order to be able to
include a full set of dummies going from 10 years before the introduction of
Globo to 10 years after. For each AMC and each year we then construct the
Age Specific Fertility Rate (ASFR) of women aged 15 to 49 in each given year
as the number of births occurred for women in that age range over the number
of women. We then estimate the following regression:
ASF Rjt = α−10 D−10 +α−9 D−9 +...+α0 D0 +...+α+9 D+9 +α+10 D+10 +δ t +εjt
where D0 is a dummy for the year of Globo entry, D−t is a dummy for t
years before Globo entry, D+t is a dummy for t years after Globo entry, and δ t
is a set of year dummies for the period 1958-2000. The estimated coefficients
{b b +10 } are reported in figure 5, together with 95% confidence bands.
α−10 , ..., α
[Insert figure 5]
19You can also read