Projections for distributed energy resources - solar PV and stationary energy battery systems - AEMO
←
→
Page content transcription
If your browser does not render page correctly, please read the page content below
Projections for distributed
       energy resources – solar
       PV and stationary energy
       battery systems
       Report for AEMO
       June 2020

Enlightening environmental markets

                                     Green Energy Markets Pty Ltd
                                     ABN 92 127 062 864
                                     G.02 109 Burwood Rd
                                     Hawthorn VIC 3122 Australia
                                     T +61 3 9805 0777
                                     F +61 3 9815 1066
                                     insight@greenmarkets.com.au
                                     greenmarkets.com.au
                                     Part of the Green Energy Group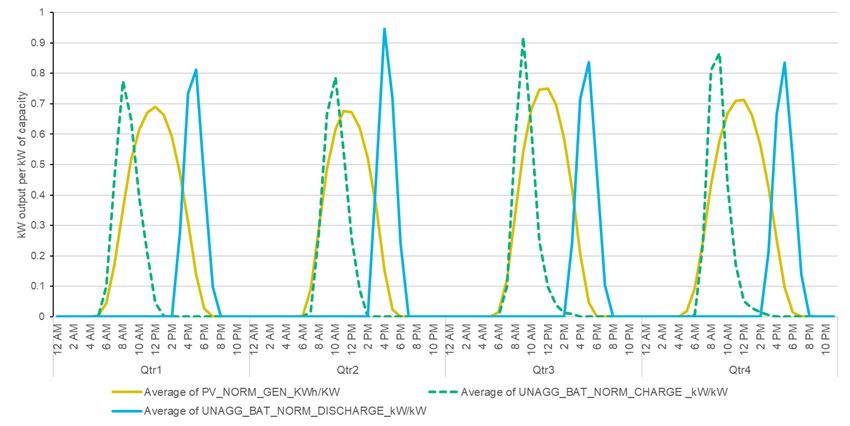
Projections of distributed solar PV and battery uptake to 2050

     Green Energy Markets                                        1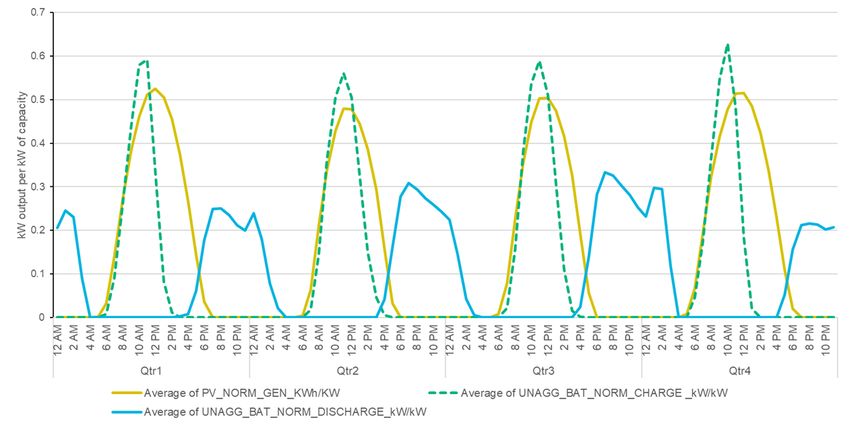
Projections of distributed solar PV and battery uptake to 2050

Contents
1 Executive Summary ...........................................................................................................5
   1.1 Results .......................................................................................................................................... 6
2 Introduction ......................................................................................................................10
3 Methodology and Approach ...........................................................................................11
   3.1 Overview ..................................................................................................................................... 11
   3.2 The payback model .................................................................................................................... 12
   3.3 Residential demand .................................................................................................................... 15
   3.4 Commercial demand up to 100kW systems ............................................................................... 16
   3.5 Modelling upgrades and replacements of residential and commercial systems up to
       100kW ........................................................................................................................................ 16
   3.6 Large commercial behind the meter systems (above 100kW) .................................................... 17
   3.7 Power stations 1MW - 30MW ..................................................................................................... 19
   3.8 Adjusting for the short-term impact of COVID-19........................................................................ 20
4 Scenarios and associated assumptions .......................................................................22
   4.1 About the scenarios .................................................................................................................... 22
   4.2 Capital cost - PV ......................................................................................................................... 25
   4.3 Capital cost - Batteries ................................................................................................................ 33
   4.4 Electricity prices .......................................................................................................................... 37
   4.5 Technical characteristics of solar and battery systems ............................................................... 46
5 Results ..............................................................................................................................47
   5.1 Overview ..................................................................................................................................... 47
   5.2 Residential solar and battery systems ........................................................................................ 54
   5.3 Commercial solar systems up to 100kW and associated batteries ............................................. 63
   5.4 Large commercial behind the meter systems (above 100kW) .................................................... 67
   5.5 Power stations 1MW - 30MW ..................................................................................................... 71
   5.6 Battery system charge and discharge profiles ............................................................................ 72

       Disclaimer: The data, analysis and assessments included in this report are based
       on the best information available at the date of publication and the information is
       believed to be accurate at the time of writing. Green Energy Markets does not in any
       way guarantee the accuracy of any information or data contained in this report and
       accepts no responsibility for any loss, injury or inconvenience sustained by any users
       of this report or in relation to any information or data contained in this report.

       Green Energy Markets                                                                                                                              2
Projections of distributed solar PV and battery uptake to 2050

Figures
Figure 1-1 National cumulative degraded megawatts of solar PV by scenario ....................................... 6
Figure 1-2 National cumulative number of PV systems by scenario ....................................................... 7
Figure 1-3 National cumulative degraded megawatt-hours of battery capacity by scenario ................... 7
Figure 1-4 National cumulative megawatts of battery capacity by scenario ............................................ 8
Figure 1-5 National cumulative number of battery systems by scenario ................................................. 9
Figure 3-1 Number of solar systems -behind-the-meter large commercial solar .................................. 17
Figure 3-2 Capacity of behind the meter large commercial solar PV .................................................... 18
Figure 3-3 Downward adjustment in solar system projections to account for COVID-19 impact .......... 21
Figure 4-1 Installed system Costs (after STCs) for 5kW system ($/Watt) ............................................. 25
Figure 4-2 Proportion of solar systems within different capacity bands - National ................................ 26
Figure 4-3 Fully installed residential solar system price per kW by scenario ........................................ 27
Figure 4-4 Fully installed commercial solar system price per kW by scenario ...................................... 28
Figure 4-5 Upfront discount to a solar system from LGCs .................................................................... 29
Figure 4-6 Upfront discount to a solar system from state efficiency schemes ...................................... 31
Figure 4-7 Upfront discount to a solar system from ACCUs ................................................................. 32
Figure 4-8 Installed cost quotes per kWh for battery systems under SA rebate program ..................... 33
Figure 4-9 Assumed capital cost per kWh for residential battery system by scenario .......................... 34
Figure 4-10 Assumed changes in NSW residential power price by time interval .................................. 39
Figure 4-11 Average wholesale electricity prices by hour of day in QLD .............................................. 42
Figure 4-12 Assumed wholesale energy costs by time interval for NSW (and NEM from 2030) .......... 43
Figure 4-13 Assumed wholesale energy costs by time interval for WA ................................................ 43
Figure 4-14 Assumed wholesale energy costs by time interval for NT ................................................. 44
Figure 4-15 Environmental charges by state and scenario for residential consumers .......................... 45
Figure 5-1 National cumulative degraded megawatts of solar PV by scenario ..................................... 47
Figure 5-2 National cumulative number of solar PV systems by scenario ............................................ 48
Figure 5-3 SA & QLD postcodes’ solar penetration relative to population ............................................ 49
Figure 5-4 Cumulative degraded megawatts of national solar PV capacity by sector........................... 49
Figure 5-5 Cumulative degraded megawatts of solar PV capacity by state .......................................... 50
Figure 5-6 National cumulative degraded megawatt-hours of battery capacity by scenario ................. 51
Figure 5-7 National cumulative megawatts of battery capacity by scenario .......................................... 52
Figure 5-8 National cumulative number of battery systems by scenario ............................................... 52
Figure 5-9 Cumulative degraded megawatt-hours of battery capacity by sector .................................. 53
Figure 5-10 Cumulative degraded megawatt-hours of battery capacity by state .................................. 54
Figure 5-11 Number of solar systems installed per annum ................................................................... 54
Figure 5-12 Annual revenue generated by a residential solar system (6.6kW) 2019 to 2051 ............... 56
Figure 5-13 Underlying cost of a 6.6kW solar system and out of pocket cost to householders after STC
discount ................................................................................................................................................ 57
Figure 5-14 Megawatts of residential PV capacity added each year to the installed stock after
deducting retirements ........................................................................................................................... 58
Figure 5-15 Proportion of solar systems within different capacity bands .............................................. 59
Figure 5-16 Revenue vs cost per kWh for household batteries ............................................................ 60
Figure 5-17 Number of additional residential battery systems relative to solar system additions and
sales ..................................................................................................................................................... 62
Figure 5-18 Megawatt-hours of residential batteries added to stock by year ........................................ 62
Figure 5-19 Number of commercial sub 100kW solar systems installed per annum ............................. 63
Figure 5-20 Capacity of commercial sub-100kW solar systems added to stock per annum ................. 64
Figure 5-21 Annual revenue generated by a commercial solar system (per kW) 2019 to 2051 ............ 65
Figure 5-22 Number of additional commercial battery systems relative to solar system additions and
sales ..................................................................................................................................................... 66
Figure 5-23 Megawatt-hours of commercial batteries added to stock by year ...................................... 66
Figure 5-24 Capacity of large commercial solar systems added to stock per annum ........................... 67
Figure 5-25 Cited installed cost of mid-scale systems per kilowatt by year .......................................... 68
Figure 5-26 Average time-weighted wholesale electricity spot price by NEM state .............................. 68
Figure 5-27 Annual revenue for NSW large commercial solar relative to capital cost (per kW) ............ 70
Figure 5-28 Megawatt-hours of commercial batteries added to stock by year ...................................... 71
Figure 5-29 Capacity of sub-30MW power station capacity added to stock per annum ........................ 72
Figure 5-32 Quarterly averaged charge-discharge profile NSW residential example ........................... 73
Figure 5-33 Quarterly averaged charge-discharge profile NSW small commercial example ................ 74
Figure 5-34 Quarterly averaged charge-discharge profile NSW large commercial example ................ 74

        Green Energy Markets                                                                                                                                3
Projections of distributed solar PV and battery uptake to 2050

Tables

Table 4-1 Overview of modelling assumptions for each scenario ......................................................... 23

      Green Energy Markets                                                                                              4
Projections of distributed solar PV and battery uptake to 2050
1 Executive Summary
The Australian Energy Market Operator (AEMO) has engaged Green Energy Markets Pty
Ltd (GEM) to provide several scenario-based projections to 2050 of solar and stationary
battery uptake for a sub-segment of this market that does not participate in AEMO’s
scheduled dispatch system.
Our results are divided into several system size brackets:
• Residential which are assumed to cover solar systems up to 15kW in size and
their associated battery systems, which for modelling purposes were assumed to
average 10kWh in size.
• Small commercial which are assumed to be between 15kW and 100kW in scale
and their associated battery systems, which for modelling purposes were
assumed to also average 10kWh in size.
• Large commercial which are assumed to be above 100kW and up to 1 megawatt
and their associated batteries, which for modelling purposes were assumed to be
sized between 90kWh to 150kWh depending upon the state.
• Small power stations which are assumed to be between 1MW and 30MW in
scale.
Green Energy Market’s projections of non-scheduled sub-30MW solar systems and
stationary battery energy storage systems are driven primarily by changes in their
financial attractiveness based on the combination of the revenue they earn (which
includes the electricity grid purchases they avoid) versus the cost involved in installing
them. This provides us with a payback period - the years it takes for revenue to exceed
the installation cost - which we can then compare against payback periods in the past. At
a simplified level our approach is based on an assumption that installation levels in the
past and associated paybacks provide a guide for likely levels of installs in the future. If
paybacks deteriorate (get longer) then installations will decline and if paybacks improve
(get shorter) then installations rise. This is then moderated by:
• the expected impact of market saturation in each state;
• the rate of new dwelling construction; and
• expected replacement cycles for systems.
In addition, we also account for the influence of non-financial factors such as changes in
customer awareness and solar industry competitiveness and marketing which are
informed by industry interviews.
In trying to evaluate financial attractiveness of project installations Green Energy Markets
has segmented this into two core segments for the purposes of our analysis:
1. What are commonly referred to as “behind-the-meter” installations which are
embedded within an end-consumer’s premises;
2. In front of the meter installations which are entirely focussed on exporting
electricity to the grid and do not offset customer consumption from the grid.
Green Energy Markets 5Projections of distributed solar PV and battery uptake to 2050
For systems within segment 1 (behind-the meter) we specifically analyse financial
attractiveness and then subsequent uptake based upon Green Energy Market’s solar and
battery system payback model.
For systems within segment 2 (small power stations) we take a different approach where
we tie installation levels back to the level of scheduled large solar power station capacity
installs projected within the draft Integrated System Plan.
1.1 Results
1.1.1 Solar PV
Figure 1-1 details the cumulative installed solar PV capacity (DC basis) projected for each
scenario on a national basis, taking into account the degradation of solar panel output
over time. At the beginning of the projection (the conclusion of the 2018-19 financial year)
cumulative installed degraded capacity is expected to stand at almost 9,400MW. Under
Central the cumulative degraded capacity reaches just over 44,000MW by the end of the
projection in 2050-51 financial year. The upper bound represented by the Step Change
scenario reaches 75,000MW, while the lower bound represented by Slow Change is close
to 33,000MW.
Figure 1-1 National cumulative degraded megawatts of solar PV by scenario
Figure 1-2 details projections for the cumulative number of solar PV systems by scenario
on a national basis. At the beginning of the projection (the conclusion of the 2018-19
financial year) the cumulative number of systems stands at 2.08 million. Under Central
the cumulative number of systems grows to 5.2 million by the end of the 2050-51 financial
year. The upper bound represented by the Step Change scenario reaches 7.6 million,
while the lower bound represented by Slow Change is 4.5 million systems at the end of
the 2050-51 financial year.
Green Energy Markets 6Projections of distributed solar PV and battery uptake to 2050
Figure 1-2 National cumulative number of PV systems by scenario
To put these system numbers in context the total number of residential electricity
connections is expected to grow to just under 15m by 2050. The number of systems under
Central equates to around 35% of all residential connections and Step Change is slightly
more than 50%.
1.1.2 Battery energy storage
In terms of behind the meter stationary battery systems Figure 1-3 details the cumulative
installed megawatt-hours of battery capacity projected for each scenario on a national
basis, taking into account the degradation of battery storage capacity over time. At the
beginning of the projection (end of 2018-19 financial year) cumulative degraded battery
capacity is estimated to stand at 482MWh. Under Central the cumulative degraded
capacity reaches almost 26,000MWh by the end of the projection in 2050-51 financial
year. The upper bound represented by the Step Change scenario reaches almost
48,500MWh, while the lower bound represented by Slow Change is just above
17,200MWh by the end of the projection in 2050-51 financial year.
Figure 1-3 National cumulative degraded megawatt-hours of battery capacity by scenario
Green Energy Markets 7Projections of distributed solar PV and battery uptake to 2050
The reason that battery capacity under the High DER and Step Change scenario begins
slowly declining from 2047 is because the degradation of the existing installed stock of
batteries begins exceeding additions of new stock. This is because the model assumes
rapid uptake of batteries up until a large proportion of the pre-existing stock of solar
systems are augmented with a battery. Once most of these systems have a battery in
place, additions of new batteries capacity abruptly fall to a much lower level in line with
additions of solar systems to the stock on premises that did not previously have a solar
system. After a lag the degradation of the existing battery stock builds up to a point where
it exceeds the new additions to the battery stock from 2047 onwards.
Figure 1-4 illustrates the maximum instantaneous megawatt output available from the
from the projected stock of battery systems. The projection begins with an installed stock
of 209MW at the end of 2018-19 financial year. Under Central this grows to 14,500MW
by the end of the projection in 2050-51 financial year. The upper bound represented by
the Step Change scenario reaches almost 30,000MW, while the lower bound represented
by Slow Change is just under 10,000MW by the end of the projection in 2050-51 financial
year. The projections are based on an assumption that the instantaneous output that can
be extracted from a battery is not subject to degradation and that the average system
when first installed will have maximum output equal to 40% of its original megawatt-hours
of storage.
Figure 1-4 National cumulative megawatts of battery capacity by scenario
Figure 1-5 details projections for the cumulative number of battery systems by scenario
on a national basis. At the beginning of the projection (the end of the 2018-19 financial
year) the cumulative number of grid-connected battery systems stands at 52,420. Under
Central the cumulative number of systems grows to 3.4 million by the end of the projection
in 2050-51 financial year. The upper bound represented by the Step Change scenario
reaches 7.1 million, while the lower bound represented by Slow Change is 2.3 million
systems by the end of the projection in 2050-51 financial year.
Green Energy Markets 8Projections of distributed solar PV and battery uptake to 2050
Figure 1-5 National cumulative number of battery systems by scenario
Green Energy Markets 9Projections of distributed solar PV and battery uptake to 2050
2 Introduction
The Australian Energy Market Operator (AEMO) has engaged Green Energy Markets Pty
Ltd (GEM) to provide several scenario-based projections to 2050 of solar and battery
uptake for a sub-segment of this market that does not participate in AEMO’s scheduled
dispatch system. It is optional for systems below 30MW in capacity to be scheduled1 and
so this report only considers systems below this size.
Our results are divided into several system size brackets:
• Residential which are assumed to cover solar systems up to 15kW in size and
their associated battery systems which for modelling purposes were assumed to
average 10kWh in size.
• Small commercial which are assumed to be between 15kW and 100kW in scale
and their associated battery systems which for modelling purposes were
assumed to also average 10kWh in size.
• Large commercial which are assumed to be above 100kW and up to 1 megawatt
and their associated batteries which for modelling purposes were assumed to be
sized between 90kWh to 150kWh depending upon the state.
• Small power stations which are assumed to be between 1MW and 30MW in
scale.
Section 3 of this report explains our approach for how we estimated solar and battery
uptake.
Section 4 explains the scenarios we used for determining the potential range of solar and
battery uptake and the underpinning assumptions of those scenarios.
Section 5 provides the results of our projections and seeks to explain with reference to
the Central Scenario what are the underlying drivers or causes behind our results.
1 Note that in the Western Australian Market the threshold is lower at 10MW.
Green Energy Markets 10Projections of distributed solar PV and battery uptake to 2050
3 Methodology and Approach
3.1 Overview
This report seeks to project uptake for sub-segment of the total solar market which
excludes AEMO-scheduled solar systems controlled by their dispatch system. In the NEM
it is optional for systems below 30MW in capacity to be scheduled and so this report only
considers systems below this size2. In addition, we also project uptake of stationary (non-
transport) battery energy storage systems used by end-consumers of electricity.
Our results are divided into several system size brackets:
• Residential which are assumed to cover solar systems up to 15kW in size and
their associated battery systems which for modelling purposes were assumed to
average 10kWh in size.
• Small commercial which are assumed to be between 15kW and 100kW in scale
and their associated battery systems which for modelling purposes were
assumed to also average 10kWh in size.
• Large commercial which are assumed to be above 100kW and up to 1 megawatt
and their associated batteries which for modelling purposes were assumed to be
sized between 90kWh to 150kWh depending upon the state.
• Small power stations which are assumed to be between 1MW and 30MW in
scale.
Green Energy Market’s projections of non-scheduled sub-30MW solar systems and
stationary battery energy storage systems are driven primarily by changes in their
financial attractiveness based on the combination of the revenue they earn (which
includes the electricity grid purchases they avoid) versus the cost involved in installing
them. This provides us with a payback period (the years it takes for revenue to exceed
the installation cost) which we can then compare against the payback periods in the past.
At a simplified level our approach is based on an assumption that installation levels in the
past and associated paybacks provide a guide for likely levels of installs in the future. If
paybacks deteriorate (get longer) then installations will decline and if paybacks improve
(get shorter) then installations rise. This is then moderated by:
• the expected impact of market saturation in each state;
• the rate of new dwelling construction; and
• expected replacement cycles for systems.
In addition, we also account for the influence of non-financial factors such as changes in
customer awareness and solar industry competitiveness and marketing which are
informed by industry interviews.
In trying to evaluate financial attractiveness of project installations Green Energy Markets
has segmented this into two core segments for the purposes of our analysis:
1. What are commonly referred to as “behind-the-meter” installations which are
embedded within an end-consumer’s premises and can be used to avoid the
need to purchase power from the grid at retail electricity rates; as well as
potentially exporting electricity to the grid for other customers to consume;
2 In the Western Australian Market the threshold is 10MW.
Green Energy Markets 11Projections of distributed solar PV and battery uptake to 2050
2. In front of the meter installations which are entirely focussed on exporting
electricity to the grid and do not offset customer consumption from the grid and
so their predominant revenue is set by wholesale electricity market rates, not
retail rates.
For systems within segment 1 (behind-the meter) we specifically analyse financial
attractiveness and then subsequent uptake based upon Green Energy Market’s solar and
battery system payback model.
For systems within segment 2 (small power stations) we take a different approach where
we tie installation levels back to the level of scheduled large solar power station capacity
installs projected within the draft Integrated System Plan. Small solar power stations
below 30MW are likely to experience very similar cost and revenue drivers as solar power
stations above 30MW. So if market conditions within the ISP are conducive to building
large solar farm capacity then these will also be favourable conditions for smaller, non-
scheduled in-front-of-the meter systems.
For solar and battery systems within segment 1, for the purposes of modelling
convenience the solar systems are assumed to be no more than 1 megawatt in size.
Meanwhile in front of the meter systems are assumed to be larger than 1 megawatt. In
practice there are circumstances where a small number of behind the meter systems are
larger than a megawatt and those in front of the meter are sometimes smaller than a
megawatt. However better precision is not realistically achievable given the large
uncertainties involved in forecasting this area. Given the vast majority of capacity installed
below 1 megawatt is behind the meter installations (and the size of most facilities
constrains potential for systems much larger than this) while the vast majority of capacity
installed above 1 megawatt is in front of the meter installations, this generalisation is likely
to provide a reasonably good guide to capacity installed within the different system size
brackets.
A further element in this modelling exercise was an adjustment to the first 3 years of the
projection to account for the potential impact of the COVID-19-induced economic slow-
down.
Further explanation of the components of the model are detailed in the headings below.
3.2 The payback model
The payback model evaluates the revenues and costs associated with a solar system
and a coupled battery system based on three different customer types:
1. Residential – which cover solar systems up to 15kW in capacity and associated
battery systems and which generally face electricity charges recovered on the
basis of the amount of kilowatt-hours of electricity consumed plus a fixed daily
charge;
2. Small commercial – which cover solar systems up to 100kW in capacity and who
are assumed to face similar electricity tariff structures as residential consumers;
3. Large commercial – which cover solar systems above 100kW up to 1 MW and
are assumed to face large consumer electricity tariffs. These typically involve
network charges which involve some kind of demand-based tariff where costs
are recovered based on a short 30 minute peak in demand over a month or year
as well as the amount of overall kilowatt-hours of consumption.
Green Energy Markets 12Projections of distributed solar PV and battery uptake to 2050
3.2.1 Costs
Costs for solar systems and any discounts or other financial benefits associated with
government policy support are detailed section 4.2 while those for batteries are in section
4.3.
As explained in further detail in section 4.2.1 the financial benefit flowing from government
support policies is taken into account in the model as an upfront deduction on the
purchase price of the solar or battery system rather than as revenue to simplify calculation
processes.
3.2.2 Revenue estimations
In terms of revenues the model examines the degree to which generation from a solar
system would:
• Reduce the need for electricity that would otherwise be imported from the grid to
meet the customers’ demand. This is then multiplied by the electricity price
associated with those displaced imports;
• Be exported to the grid which is then multiplied by the expected feed-in tariff.
It then also calculates the degree to which a battery system could provide additional
benefit to a consumer through:
• Taking electricity from the solar system that would otherwise be exported to the
grid at the feed-in tariff rate and using it at a later period to displace electricity
imported from the grid at a higher retail rate;
• On days where exported electricity is insufficient to charge the battery to full
capacity, charge from the grid during a time when retail electricity prices were
lower in order to avoid electricity imported from the grid when retail electricity
prices were higher.
The formula that governs the charging of the battery operates in a manner that is able to
perfectly predict the amount of solar exports in a day. If this is insufficient to charge the
battery to its full capacity then it charges from the grid for the difference over 8am until
11am. While historically this has not been been thought of as an off-peak period, with
the increasingly high prevalence of solar in the generation mix this is likely to change.
The model does these calculations via an hour by hour breakdown across a 12 month
period for:
• an archetype customer’s load for the three customer types (residential/small
commercial/large commercial);
• solar generation based on each state/territory’s capital city generation profile;
and
• different tariffs applying to each hour including whether the day is a weekday or
a weekend with these being adjusted depending upon the state/territory and the
customer type.
This 12 month period is then replicated out to 2050 but with changes across each year
reflective of each year’s assumptions for electricity prices.
This hourly breakdown allows for an estimate of how much of the solar generation is
absorbed by the customer’s load versus being exported and the degree to which the
battery can be charged by the grid versus solar generation that would otherwise be
exported, and also how much of the customer’s imports from the grid can be offset by the
Green Energy Markets 13Projections of distributed solar PV and battery uptake to 2050
battery. It also estimates the extent to which the customer’s peak demand (which affects
the network demand charge) is reduced by the solar and battery system.
Load profile
For residential consumers the load profile is derived from the smart meter consumption
data made available from Ausgrid’s Smart Grid, Smart City trial3. This provides
consumption data for 300 residential sites which were separately metered from their solar
generation allowing the impact of a solar system to be analysed independently. The
model uses an averaged load profile of these 300 sites.
For both small and large commercial customers the load profile is based on the load for
a substation that predominantly services non-residential customers – United Energy’s
Dandenong Substation4. The use of a single sub-station was in order to simplify and
speed-up the calculation process. To ensure that this was a reasonable representation of
commercial loads in other states it was cross checked against load data for substations
serving mainly commercial customers in other states to ensure reasonable similarity in
time profile of consumption across hours of the day, weekends versus weekdays and
seasons.
The substation load profile was then scaled down to be representative of:
• a small commercial customer likely to use the average-sized commercial solar
system claiming STCs, which is close to 20kW; and
• a large commercial customer using a 300kW solar system which is representative
of a behind the meter solar system claiming LGCs.
This was guided by feedback from interviews with solar industry participants that they
typically apply a rule of thumb in sizing solar systems that aims to keep exported
generation (or spilled generation where the system is prevented from exporting) to around
20% or less of total annual solar generation. Industry feedback is that the financial
attractiveness of a system to customers usually significantly deteriorates once exports
exceed 20% of total annual generation.
3.2.3 Payback outputs
For each year of the projection period the model estimates a payback for a solar system
alone and a solar system combined with a battery system. This uses the capital cost of
the system for the year in question after deducting the value of government policy support
mechanisms and then divides this by the estimated average annual revenue the system
will deliver for the next three years.
The consideration of only the next three years’ revenue rather than a longer period is
based on information gathered from interviews from solar industry participants about
customer purchasing behaviour. This suggests that customers do not typically use long-
term forecasts about future electricity prices in evaluating the financial attractiveness of a
solar or battery system. Instead they will tend to use their current electricity prices with
potentially an adjustment to account for where electricity prices will go over the remaining
duration of their electricity contract (in the case of large commercial customers); or some
3
This dataset is available from Ausgrid’s website here: https://www.ausgrid.com.au/Industry/Our-
Research/Data-to-share/Solar-home-electricity-data
4
This data is available from the website of Australia's National Energy Analytics Research Program
here: https://near.csiro.au/assets/003fe785-401d-4871-a26d-742cb1776a2f
Green Energy Markets 14Projections of distributed solar PV and battery uptake to 2050
rule of thumb adjustment based on their expectation of electricity prices a small number
of years into the future (e.g. inflation rate plus 3%).
3.3 Residential demand
We have used detailed historical data for solar PV installations provided by the Clean
Energy Regulator (CER). Residential and commercial installations have been segmented
based on the “property installation type” classification in the registry data provided by the
CER. We have used the CER’s delineation from 2015 when a full years data was
available. For systems installed prior to 2015 we have assumed that systems greater than
10 kW were commercial and those less than 10kW were residential.
We forecast the level of new residential demand for each state with reference to the
following four factors:
• Relative financial attractiveness - as represented by simple payback index for
each year with 2015 as the base;
• Relative level of saturation – represented by scaling factor that reduces as the
proportion of owner-occupied detached and semi-detached dwellings with solar
within a state increases. We have calibrated this as being 1.0 (no discount) where
20% or less of owner-occupied detached/semi-detached dwellings have solarand
this then reduces to 0.5 (50% discount) at saturation levels of 80%. The discount
is lower at 0.37 for NSW and Victoria to reflect higher urban density and
significant amounts of older established homes with shading. This is then also
converted into an index with 2015 as the base;
• Relative customer awareness – heightened media concerns over high power
prices has been demonstrated (through market interviews) to be a major
contributing factor to customer preparedness to consider solar. We have
developed a scaling factor that considers the impact in each year and then
convert this into an index with 2015 as the base; and
• Relative solar industry competitiveness and marketing – the level of new market
entrants (and exit), general industry competitive environment together with the
level of marketing and promotion will also have an impact on solar PV uptake.
We have developed a scaling factor that considers the impact in each year and
then convert this into an index with 2015 as the base.
The last two factors (customer awareness and industry competitiveness and marketing)
are extremely subjective but have clearly impacted on the level of demand particularly
since 2017.
The five years from 2015 to 2019 provide a reasonable timeframe and cover new
residential installations rising from 124,000 systems in 2015 to 245,000 systems in 2019.
This now represents 5 years of reasonable data that is not complicated by solar credits
multipliers or extremely attractive feed-in tariffs. The residential market sector can be
seen to be mature and enables us to have confidence in this approach, albeit with some
subjective factors. Interviews with industry participants have been a key component in
gauging factors and issues that are actually working on the ground influencing customer
purchasing decisions, beyond just financial attractiveness.
We have used systems installed in 2015 as the base level of demand for 2015 which is
our base year. We have used 2016 level installations as base data in the case of WA, SA
and NT as this was seen to be more representative.
Our approach can be represented by the following formula:
Green Energy Markets 15Projections of distributed solar PV and battery uptake to 2050
Demand (year) = Base year installations x Relative Financial Attractiveness Index
(year) x Relative Level of Saturation (year) x Relative Customer Awareness Index
(year) x Relative Solar Industry Competitive Index (year)
Average system size has increased dramatically over the last 5 years increasing from 4.1
kW per system in 2015 to 6.7 kW per system in 2020. We expect continued modest
increases in system size rising to 7.3 kW per system by 2030 and 8.1 kW per system by
2050. We expect the benefit of the continued increase in the performance and efficiency
of panels to be countered by electricity network constraint whereby it is a much easier
process to connect systems where the inverter export capacity is 5kW or less (with
oversizing of the panel capacity by a third of the inverter capacity). Yet in spite of this
constraint we expect growth in system size will continue, albeit much slower than the
past, because module price reductions will mean larger systems make financial sense
even though they will be lose a greater portion of their output due to the inverter export
constraint.
3.4 Commercial demand up to 100kW systems
The commercial or non-residential sector’s demand for solar systems up to 100kW in size
continues to be seen as an attractive market by the solar industry, now representing over
20% of installed capacity.
This market sector is not as mature as the residential market and we use 2019
installations as our base level of demand. Similar to our approach for the residential
market we project the level of installations based on relative financial attractiveness
(relative to the 2019 base year). We also incorporated a scaling factor to reflect the level
of saturation and relative customer awareness and relative industry competitiveness and
attractiveness similar to the process adopted for the residential sector.
Average system size has been reasonably stable over the last 5 years at around 22 kW
per system. We expect modest increases in system size rising to 25 kW per system by
2030 and 29 kW per system by 2050 due to the continued increase in the performance
and efficiency of panels.
3.5 Modelling upgrades and replacements of residential and commercial
systems up to 100kW
This market sector is increasing albeit from a very low base. Many small systems (less
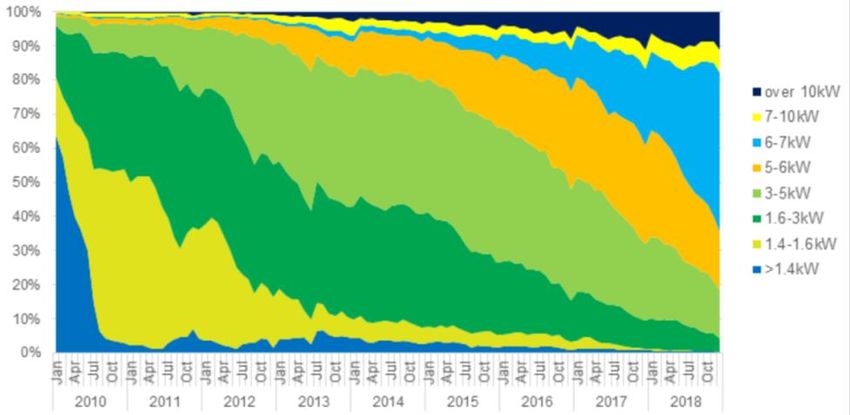
than 1.6 kW) were installed over the 2010 to 2013 period (see Figure 4-2 on page 26)
and a number of the customers are expanding their` systems in response to higher power
prices and lower panel prices. While this market sector is still relatively small, we expect
it to continue to grow and become a much more important feature of the industry in future
years as saturation increases.
The commercial upgrade market at an estimated 48 MW in 2019 is currently not that
material, however we believe it is worth separating as it has scope to grow in future and
it is also important to exclude these systems when considering saturation levels.
We have developed a profile of projected future replacement systems based on (i) relative
financial attractiveness and (ii) observed historical level of replacements. We expect that
the solar industry will increasingly target this sector particularly as installed battery costs
fall and larger new solar and battery packages become more attractive.
Green Energy Markets 16Projections of distributed solar PV and battery uptake to 2050
3.6 Large commercial behind the meter systems (above 100kW)
Projecting uptake within this narrow sub-sector of the solar market is subject to
considerable uncertainty because the market is highly immature, highly complex and still
undergoing rapid development and change.
The market has only really emerged at any noticeable level in the last three years as a
result of significant reductions in system costs, and a dramatic increase in the wholesale
price of electricity in the east-coast National Electricity Market.
Figure 3-1 illustrates that the number of systems being installed nationally per year has
only just broken through 300 last year and as recently as 2017 the annual number of
systems still lay below 100. At state level only Victoria has so far managed to record 100
systems in a year and in 2017 all states recorded less than 30 systems. Note that this
includes systems that are larger than 1MW but which are known to be behind-the-meter
systems.
Figure 3-1 Number of solar systems -behind-the-meter large commercial solar
(by year of accreditation)
The lack of a suitably large and representative sample set of solar system installations,
stretching back over several years and the rapid changes in this market, provide a less
than ideal basis for assessing how uptake might change over time in response to different
environmental variables. Nonetheless changes in payback periods provide a useful
benchmark or guidepost to inform how future mid-scale solar uptake might unfold. The
rapid rise in uptake that began in 2016 and has continued into 2019 was preceded by
large rises in power prices faced by large commercial customers and rapid reductions in
system costs and so uptake in this market is clearly tied to financial payback just as one
might logically expect businesses to behave.
To guide our projections of uptake we have used 2019 behind the meter capacity installs
(inclusive of systems above 1MW) and likely customer evaluations of payback (which
tend to be heavily biased towards market conditions in the recent past and what is
expected only a year or two into the future) as a baseline to calibrate our model. To
provide a lower bound guidepost as to how much capacity accredited could fall as
paybacks deteriorate, we’ve used 2016 installation levels as a benchmark which we
assume were a product of payback periods based on 2015 market prices. While it varies
Green Energy Markets 17Projections of distributed solar PV and battery uptake to 2050
between states and customer-types, payback periods based on 2015 market conditions
were roughly twice to three times as long as what they were in 2019. Figure 3-2 illustrates
large commercial solar capacity by accreditation year illustrating that 2016 involved
slightly more than 20MW of capacity while 2019 was close to 150MW.
Figure 3-2 Capacity of behind the meter large commercial solar PV
(by year of accreditation)
While these historical benchmarks provide a useful guide for how uptake might change if
payback remains the same as it was around 2018 and 2019 or deteriorates, we lack a
guide for how uptake might increase above 2019 levels if paybacks get shorter than
recent levels. While it seems unlikely that power prices will increase substantially above
the levels experienced in the last 3 years in the NEM (our projections assume they
decline), it is very likely that system costs will decline. Also if governments seek to follow
through on their ambitious long-term emission reduction commitments then policy support
could also increase (see section 4.2.1 and 4.3.1 for assumptions on government policy
support for emission reductions by scenario). We have assumed that if paybacks were to
halve from 2018-2019 levels then capacity installs would double but should acknowledge
that this is subject to considerable uncertainty.
Paybacks and uptake are calibrated to installation levels in each state however with some
adjustments to uptake in South Australia and NSW.
Figure 3-2 illustrates that in 2019 South Australia’s share of solar PV installs in this
segment are vastly greater than their share of total electricity consumption, population or
GDP. They installed 10% more than NSW, yet NSW’s business sector consumes over
five times the electricity of South Australia’s business sector. While one would expect that
South Australia would have a higher rate of solar PV installs amongst businesses than
other states given it has higher electricity prices, it seems unlikely such an out of
proportion share would persist due to saturation effects. South Australia also has higher
solar PV installation rates in the residential sector relative to other states but their share
of the national residential market comes nothing close to what is seen for large
commercial (SA represented 9% of Australian residential capacity additions but 20% of
large-commercial behind the meter capacity in the 2019 calendar year). Our view is that
SA’s large commercial solar market is more advanced and mature than the rest of the
country because it has had high electricity prices for longer than other states. But as a
Green Energy Markets 18Projections of distributed solar PV and battery uptake to 2050
consequence, SA will also approach challenges with market saturation sooner than other
states which will slow sales. We therefore scale back SA uptake such that if paybacks
were to replicate conditions in 2019, they would install 40% of the capacity that occurred
in 2019. We also make one further modification to SA uptake in the 2021 and 2022
financial year to add in capacity from SA Water’s roll-out of 154MW of solar. This single
company’s roll-out is equal to more than the entire national 2019 level of installs and so
required a one-off external adjustment.
Another adjustment was deemed necessary to scale-up NSW uptake levels to a level of
capacity greater than what was installed in 2019 and closer to levels that occurred in
2018. Because the market still involves relatively small numbers of systems there is likely
to be some volatility in figures from year to year that it is random rather than a function of
long-term fundamentals. While all other mainland states recorded significant growth in
annual capacity additions between 2018 and 2019, NSW annual capacity additions
declined by 27% even though paybacks had not deteriorated. Also, our estimates are
that paybacks on solar systems in NSW are not much worse than those in Victoria yet
NSW installed less than half the capacity of Victoria.
3.7 Power stations 1MW - 30MW
As mentioned earlier for solar systems larger than a megawatt in scale, these are
assumed to be in front of the meter power station installations. This means their revenue
is derived solely from wholesale electricity markets. They are not embedded within an
electricity consumer’s site and offsetting electricity that would otherwise need to be
purchased from the grid at retail rates.
For power stations rather than driving uptake via a specific financial evaluation of this
category of systems we instead tie installation levels back to the level of scheduled large
solar power station capacity installs projected within the draft Integrated System Plan.
Small solar power stations below 30MW are likely to experience very similar cost and
revenue drivers as solar power stations above 30MW. So if market conditions at a time
within the ISP scenarios are conducive to building large solar farm capacity then these
will also be favourable conditions for smaller, non-scheduled in-front-of-the meter
systems. Likewise, if market conditions within the ISP are not conducive to building new
large-scale solar capacity, they are also unlikely to support additions of non-scheduled,
small solar power stations.
For 2020-21 we use our own estimates of installations based on bottom-up information
gathering from a range of solar developers and equipment providers. Then from 2021-22
the model installs above 1MW solar when the draft ISP also envisages large scheduled
solar capacity to be installed.
Under Central, Fast Change and Slow Change the amount of 1MW+ capacity installed is
6% of the scheduled solar installed in each year as estimated in the draft ISP. This is in
line with the proportion of sub-30MW power station capacity accredited in 2019 relative
to those 30MW or greater.
For High DER and Step Change it is increased to 10% of the scheduled solar installed in
each year as estimated in the draft ISP. The higher proportion of sub-30MW capacity is
to reflect the following guiding themes for these scenarios:
• The Step Change scenario involves a very rapid replacement of fossil fuel
generators with zero emission renewables. Given the scale and speed of the
build-out of renewables it is likely that developers will be pushed via higher
demand towards a broader scope of supply options than needed under other
scenarios. While sub-30MW projects are generally less financially attractive to
Green Energy Markets 19Projections of distributed solar PV and battery uptake to 2050
developers than larger projects under a rapid build out of renewables, constraints
and in particular transmission capacity, would likely push developers to pursue a
greater proportion of sub-30MW projects than they would under a slower build-
out.
• The High DER scenario is intended to represent a future where energy resources
are biased towards smaller, distributed supply options. One possible event that
might encourage this to occur could be that challenges are encountered in
expanding transmission capacity such as local community opposition. This would
then force developers to pursue a greater proportion of capacity from smaller
projects that can be more readily incorporated within the existing transmission
capacity.
3.8 Adjusting for the short-term impact of COVID-19
Part way through this modelling project Australian State and Federal Governments as
well as governments overseas introduced a range of measures to prevent the spread of
the COVID-19 virus. These have had rapid and significant impact in reducing economic
activity and incomes including a significant increase in unemployment.
As a result of the significant change in economic circumstances AEMO requested us to
make adjustments to projections to try to account for the potential impact of this economic
downturn on solar PV and battery uptake.
Given solar and battery systems represent a reasonably significant capital purchase for
both households and businesses, one would expect that they would experience a
reduction in demand during an economic downturn just like we typically see with other
major consumer durable equipment and business capital equipment. However, because
solar PV systems have only relatively recently become a mass-market product, while
battery energy storage systems are still to achieve mass-market scale, past history does
not provide a useful guide of what we might expect. The last significant economic
downturn occurred in 2008-09 at a time when solar PV systems experienced a dramatic
reduction in purchase price and entered a dramatic growth phase. In addition solar PV
has experienced record sales over the last 12 months prior to COVID-19 restrictions,
when the Australian economy was experiencing slow or negative per capita GDP growth.
To try to assess the impact of the economic downturn we undertook a survey over the
first week of April in conjunction with PV Magazine of solar industry businesses5. This
survey asked them the extent to which customer inquiries had either increased or
decreased since the COVID 19 social distancing restrictions were introduced - relative to
the prior 6-12 months. This was complemented by direct discussions with a small number
of industry participants that had access to customer solar system inquiry information
across a significant proportion of the Australian market.
This market research suggested that customer inquiries for solar systems had dropped
significantly, with a decline of inquiries in realm of 25% to 50% being most common but
some experiencing a complete collapse. On the other hand battery inquiries had
noticeably increased and only a small number of confirmed solar or battery orders were
being cancelled. In addition, interviews indicated that preceding the COVID-19
restrictions the solar market was extremely buoyant. A large proportion of suppliers had
an installation backlog of around 6 weeks with some extending to as long as 3 months.
5
Article documenting findings and observations of survey is available here: https://www.pv-magazine-
australia.com/2020/04/09/survey-covid-19-to-cause-50-decline-in-rooftop-solar-segment/
Green Energy Markets 20Projections of distributed solar PV and battery uptake to 2050
This information was then used to develop a pessimistic, optimistic and most probable
impact on solar installation levels relative to our initial projections. These were finalised
in the second week of April.
Figure 3-3 illustrates the reductions we have made to solar PV installations on a monthly
basis relative to our model’s original projections based on the input assumptions. Please
note that the High DER and Fast Change scenarios are adjusted by the same percentage
amounts as Central. Consistent with feedback from interviews about most solar
businesses having a 6 week backlog, there is little adjustment downward in installations
relative to original projections for the months of March to May. Under Slow Change
installations drop to zero in June and July. This was to cater for the possibility that
governments moved to completely ban solar installations. With the benefit of hindsight
this now looks excessively pessimistic but when the COVID-19 adjustments were being
developed in late March and early April such a ban could not be ruled out and was in
place in New Zealand.
Figure 3-3 Downward adjustment in solar system projections to account for COVID-19
impact
Green Energy Markets 21Projections of distributed solar PV and battery uptake to 2050
4 Scenarios and associated assumptions
4.1 About the scenarios
Projections for solar and battery uptake have been developed for five different scenarios
that are intended to be consistent with AEMO’s planning and assumptions for its overall
electricity system planning process.
Table 4-1 provides a summary of the approach we have taken with the main modelling
input assumptions or factors across each scenario. To assist with consistency we have
used the CSIRO’s Draft 2019-20 GenCost analysis6 for guidance on the capital cost and
LCOE of various power generation and storage technologies. However, in the case of
distributed solar and batteries we have applied our own judgement about what cost
reductions are likely to be achieved based on our own analysis of market data and
interviews with solar industry participants.
6Graham, Hayward, Foster, Havas (2019) GenCost 2019-20: preliminary results for stakeholder review
– December 2019
Green Energy Markets 22Projections of distributed solar PV and battery uptake to 2050
Table 4-1 Overview of modelling assumptions for each scenario
Modelling factor SCENARIO
Central Slow change Step Change High DER Fast Change
DER technologies continue to
achieve strong technological
Continuation of existing Significant slowing in renewable progress and enthusiastic
Rapid technological progress. Rapid technological progress.
technology trends. No new energy technological progress. adoption. Slower progress with
Governments globally make Further action taken to contain
Guiding themes climate policies introduced even Regression in policy concern for centralised generation
concerted effort to contain global carbon emissions but falls short
though Paris and State's 2050 emission reductions. Low fossil technologies. Minimal nationally
warming below 2 degrees. of 2 degree goal.
targets will not be met. fuel prices. co-ordinated action on emissions
but some state government
efforts.
Continuation of existing trends.
Residential follows GEM Residential based on CSIRO Residential based on CSIRO
Very Rapid. Residential &
Distributed solar & battery developed pathway slower than Slow - nominal price constant, GenCost Central. Commercial GenCost Central. Commercial
Commercial based on CSIRO
technology cost reductions CSIRO GenCost Central. real price declines at 2% based on CSIRO GenCost low based on CSIRO GenCost low
GenCost Low Cost
Commercial aligned with CSIRO cost. cost
GenCost Central
Cost reductions for new
Continuation of existing trends. technologies are slow, but Costs are higher in short-term Costs are higher in short-term
Centralised wholesale generation Ongoing improvement in solar wholesale energy costs kept than Central, but fall below than Central, but fall below
Costs are similar to Central.
costs technology drives down lower than Central due to lower Central over time due to faster Central over time due to faster
wholesale costs in middle of day fossil fuel costs and extension of technological improvement. technological improvement.
coal plant life.
Green Energy Markets 23You can also read