Li-ion batteries for mobility and stationary storage applications - Scenarios for costs and market growth
←
→
Page content transcription
If your browser does not render page correctly, please read the page content below
Li-ion batteries for mobility and
stationary storage applications
                     Scenarios for costs and
                     market growth

                     Tsiropoulos I., Tarvydas. D.,
                     Lebedeva N.

                       2018

                                                     EUR 29440 EN
This publication is a Science for Policy report by the Joint Research Centre (JRC), the European Commission’s
science and knowledge service. It aims to provide evidence-based scientific support to the European
policymaking process. The scientific output expressed does not imply a policy position of the European
Commission. Neither the European Commission nor any person acting on behalf of the Commission is
responsible for the use that might be made of this publication.

Contact information
Name:     Ioannis Tsiropoulos
Address: European Commission, Joint Research Centre, P.O. Box 2, NL-1755 ZG Petten, The Netherlands
Email:    ioannis.tsiropoulos@ec.europa.eu
Tel.:     +31 224 56 51 26

EU Science Hub
https://ec.europa.eu/jrc

JRC113360

EUR 29440 EN

 PDF        ISBN 978-92-79-97254-6         ISSN 1831-9424       doi:10.2760/87175

Luxembourg: Publications Office of the European Union, 2018

© European Union, 2018

The reuse policy of the European Commission is implemented by Commission Decision 2011/833/EU of 12
December 2011 on the reuse of Commission documents (OJ L 330, 14.12.2011, p. 39). Reuse is authorised,
provided the source of the document is acknowledged and its original meaning or message is not distorted. The
European Commission shall not be liable for any consequence stemming from the reuse. For any use or
reproduction of photos or other material that is not owned by the EU, permission must be sought directly from
the copyright holders.

All content © European Union 2018, except: cover page, © Stillfix. Source: AdobeStock

How to cite this report: Tsiropoulos, I., Tarvydas, D., Lebedeva, N., Li-ion batteries for mobility and stationary
storage applications – Scenarios for costs and market growth, EUR 29440 EN, Publications Office of the
European Union, Luxembourg, 2018, ISBN 978-92-79-97254-6, doi:10.2760/87175, JRC113360
Contents
Abstract ............................................................................................................... 1
Acknowledgements ................................................................................................ 2
Executive summary ............................................................................................... 3
1 Introduction ...................................................................................................... 6
2 Current situation of Li-ion battery markets and costs ............................................. 9
   2.1 Li-ion battery markets .................................................................................. 9
       2.1.1 Electric vehicles ................................................................................... 9
       2.1.2 Stationary storage ............................................................................. 12
   2.2 Li-ion battery costs and cost structure .......................................................... 13
       2.2.1 EV battery pack costs ......................................................................... 13
       2.2.2 Stationary battery system storage costs ............................................... 17
       2.2.3 Cost reduction drivers ........................................................................ 22
3 Future growth and costs of Li-ion batteries ......................................................... 24
   3.1 Market growth of Li-ion batteries ................................................................. 24
       3.1.1 Near-term manufacturing capacity growth globally and in the EU ............. 24
       3.1.2 Global long-term manufacturing capacity growth ................................... 26
       3.1.3 Global market growth of electric vehicles .............................................. 27
       3.1.4 Global market growth of stationary storage ........................................... 28
   3.2 Future costs of Li-ion batteries for EVs and stationary storage ......................... 29
4 Scenario-based cost trajectories of Li-ion batteries .............................................. 33
   4.1 Method ..................................................................................................... 33
       4.1.1 Learning rates ................................................................................... 33
       4.1.2 Selected global growth scenarios ......................................................... 33
       4.1.3 Implicit assumptions .......................................................................... 35
   4.2 Cost trajectories ........................................................................................ 36
   4.3 Sensitivity scenarios .................................................................................. 41
5 Conclusions .................................................................................................... 45
References ......................................................................................................... 49
List of abbreviations and definitions ....................................................................... 57
List of boxes ....................................................................................................... 58
List of figures ...................................................................................................... 59
List of tables ....................................................................................................... 61
Annexes ............................................................................................................. 62
   Annex 1. Cost components and cost boundaries of Li-ion batteries......................... 62
   Annex 2. Cost components and cost boundaries of Li-ion batteries......................... 63
   Annex 3. Parameters and detailed input assumptions ........................................... 64
   Annex 4. Results ............................................................................................. 67

                                                            i
Abstract
Li-ion battery costs could decrease rapidly, by at least 50 % in 2030 and up to 75 % in
2040, due to learning from mass production driven by electric vehicles. Stationary
storage systems may benefit from somewhat slower yet substantial cost reduction of
65 %. Market barriers or inaction on climate goals can affect these trajectories.

                                          1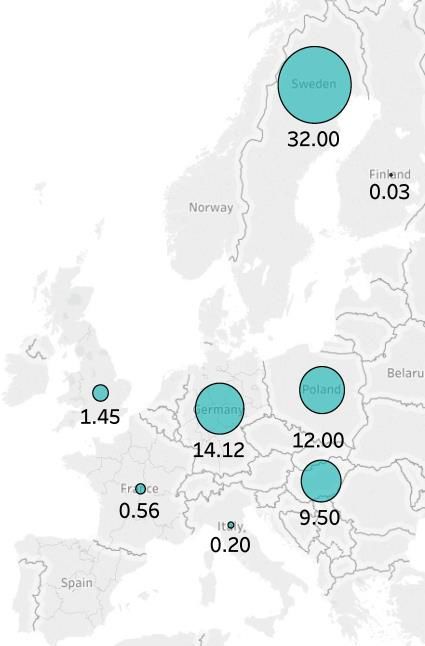
Acknowledgements
The authors would like to acknowledge the support of Andreas ZUCKER (DG ENER) at
early stages of this work.
The authors would also like to express their gratitude to JRC colleagues for reviewing the
report and offering their feedback: Ignacio HIDALGO GONZALEZ, Konstantinos
KAVVADIAS, Darina BLAGOEVA, Leonidas MANTZOS, Evangelos TZIMAS, Efstathios
PETEVES and Fulvio ARDENTE.
This acknowledgment extends to Brittney ELZAREI and Jean-Michel DURAND of the
European Association for Storage of Energy (EASE) for providing constructive comments.

Authors
TSIROPOULOS, Ioannis
TARVYDAS, Dalius
LEBEDEVA, Natalia

                                            2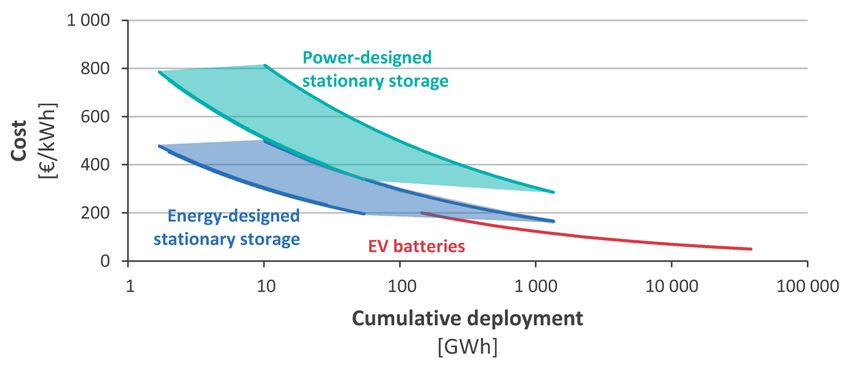
Executive summary
Recent cost reduction of Li-ion batteries raise the expectations that electric vehicles and
energy storage at grid and/or household level will become cost-competitive and will
penetrate the respective markets in great numbers. Based on announcements, the global
Li-ion cell manufacturing capacity is expected to quadruple or even increase six times by
2021 – 2022 compared with 2017 levels. By 2040, 150 to 900 million electric vehicles
are projected to be on the road, which is two to three orders of magnitude higher than
today. Over the same period, stationary storage may reach up to 1 300 GWh, compared
with about 3 – 4 GWh installed front-of-the-meter today. These projections point towards
a potentially significant market growth of Li-ion batteries, but also towards a range of
views on the magnitude of these developments. While in the near-term the global
manufacturing capacity is set to increase, in the longer-term the range of projections is
wide. The projections depend on the direction the world will take, for example, in view of
action against climate change by decarbonising road transport. As such, cost trajectories
of Li-ion batteries may be influenced by the total deployment levels of electric vehicles
and stationary storage due to economies of scale, and by the cumulative manufacturing
experience gained globally.
Focusing on Li-ion batteries as the family of batteries for mobility and stationary storage
applications of today and the near future, this report contextualises their potential cost
trajectories in line with global production scale, based on three different scenarios for the
global energy system up to 2040 (high, moderate and low).

EU policy context
The EU is transitioning to a secure, sustainable and competitive energy system as laid
out in the European Commission's Energy Union strategy. Li-ion batteries are often seen
as the technology that can help decarbonise transport, lift the penetration levels of
intermittent renewable energy (wind and solar) and offer a competitive edge to the EU
industry in the Li-ion battery value chain. Batteries, including Li-ion, are recognised as a
key enabling technology for the energy transition of the EU under the Energy Union and
as such, they are specifically mentioned in several policy initiatives that address
transport, raw materials and energy economic sectors, EU industrial policy and EU
Research and Innovation. The strategic importance of batteries for the EU is further
demonstrated by the formation of the European Battery Alliance and the adoption of the
Strategic Action Plan for batteries as an integral part of the third 'Europe on the Move'
package. Li-ion batteries also link with the European Commission's actions on raw
materials, namely the Raw Materials Initiative, the European Innovation Partnership on
Raw Materials and the assessments on Critical Raw Materials.

Main findings and conclusions
By 2040, according to key projections, the global annual sales of Li-ion batteries increase
to around 4 TWh in the high, 2 TWh in the moderate and 0.6 TWh in the low scenario.
This corresponds to about 110, 55 and 15 operational gigafactories in each scenario,
respectively, assuming 35 GWh annual production capacity for each gigafactory. For
comparison, the sales volume in 2017 was about 60 GWh.
These projections entail that by 2030, Li-ion electric vehicle battery packs could come at
least at half the cost of today's production (100 €/kWh instead of about 200 €/kWh
today) due to mass production. By 2040, the cost could drop an additional 50 %,
ultimately reaching 50 €/kWh. Such trajectories are feasible based on costs of new Li-ion
cathode chemistries and other battery pack materials that are estimated at around
30 €/kWh (other additional costs are estimated at around at 10 – 20 €/kWh). Meeting
policy goals such as the Strategic Energy Technology Plan (SET Plan) cost target of
75 €/kWh is feasible in both high and moderate scenarios (which entail fast ramp-up of
Li-ion manufacturing capacity, of about 2 gigafactories globally per year until 2030).

                                             3
Cost reduction of Li-ion battery packs for electric vehicles spills over to stationary storage
systems, but cost reduction in this sector occurs somewhat slower due to the
contribution of other major cost components (e.g. inverters, balance of system hardware,
soft costs such as engineering, procurement and construction). The benchmark costs
of Li-ion stationary storage systems in 2017 were about 500 €/kWh for energy-designed
systems, about 800 €/kWh for power-designed systems, and 750 €/kWh for residential
batteries (1). Ultimately, by 2040, stationary storage system costs will range between
165 and 240 €/kWh for energy-designed utility-scale systems, between 280 and
410 €/kWh for power-designed utility-scale systems and between 250 and 365 €/kWh for
households. Lowering of balance of system and other soft costs can potentially help
further cost reduction of stationary energy storage systems, lifting barriers for their
widespread deployment. The SET Plan target on investment costs for stationary storage
at a system level at 150 €/kWh (2) could be attainable at high global deployment of EVs
and more than 1 TWh of stationary storage. These findings are influenced by the
assumed learning rates, the assumption that cost reduction from Li-ion battery packs for
EVs spills over to stationary storage systems, and on whether aged batteries from
transport are repurposed to storage at a portion of the price of a new battery pack. Other
assumptions, such as the evolution of the battery size or the battery lifetime were not
found to influence significantly the cost projections based on learning.
The main messages to take away from this analysis are the following:
Wide-spread deployment of electric vehicles will lead to a rapid decrease of Li-ion
battery costs in the near term.
Investment costs of Li-ion battery stationary storage systems will decrease, yet
improvements should focus also on non-battery pack system components.
European manufacturing of Li-ion battery cells will increase its share in global
production, provided that announced plans materialise. Supplying domestic
demand may prove challenging if capacity does not ramp up after 2025.
Re-using and repurposing of Li-ion batteries to energy storage applications after
their end of life in electric vehicles contributes to further cost reduction.
Related and future JRC work
This report complements a series of other JRC publications on key issues related to Li-ion
batteries, namely the competitiveness of the EU in the Li-ion battery sector and
opportunities for Europe in the Li-ion value chain. Future work could relate with economic
assessments to complement modelling activities on the feasibility of energy storage or
other economic metrics such as levelised costs, lifecycle costs and so forth.
Quick guide
This report is structured as follows: Chapter 1 introduces the policy context around Li-ion
batteries, their relevance in the energy transition and the knowledge gaps on deployment
and costs. Chapter 2 continues with an overview of historical developments of Li-ion
batteries markets and costs, focusing on EVs and storage. Chapter 3 presents near-term
expectations and long-term projections for growth and costs of Li-ion batteries based on
(1) Batteries for stationary storage are used for a range of applications with some being more suited to store
energy and others to supply power. In the present report, batteries that can provide energy for more than
1 hour are called energy-designed and batteries that can provide energy for less than 1 hour are called
power-designed. Smaller scale residential batteries provide energy for more than 1 hour and do not require
system integration components. The cost structure of these batteries is different both per kW and kWh.
(2) The SET Plan target for stationary energy storage reads: "For stationary energy storage the SET‐Plan R&I
will aim at developing and demonstrating technology, manufacturing processes, standards and systems,
which have the potential of driving high‐efficiency (>90%) battery based energy storage system cost below
€150/kWh (for a 100kW reference system) and a lifetime of thousands of cycles by 2030 to enable them to
play an important role in smart grids" [23]. Although only the investment cost is cited here and hereafter,
it is imperative to consider it in conjunction with the requirements on efficiency, power rating and lifetime.
4literature. Chapter 4 provides estimates on scenario-based cost trajectories for Li-ion
batteries for mobility and stationary storage applications based on the learning curve
method. Chapter 5 draws the final conclusions of the analysis.
51 Introduction
The EU is transitioning to a secure, sustainable and competitive energy system as laid
out in the European Commission's Energy Union strategy [1]. Energy storage, and in
particular batteries, is frequently addressed as the technology that may unlock the
transition to a decarbonised and clean energy system due to their potentially broad
application in the power sector and in transport [2–4].
In the proposed "Clean Energy for all Europeans" legislative package, the EC sets global
leadership in Renewable Energy Sources (RES) as a priority for the EU (COM(2016) 860
final; [5]). To achieve this goal and deliver on international climate change mitigation
commitments [6], at least 32 % of energy supply must be sourced by renewables as
agreed by the European Parliament and Council [7]. The power sector, however, could
be technically challenged by high supply of electricity from intermittent RES, even more
so as costs of wind and solar decrease, making them more appealing to the market [8–
11]. Wind turbines and photovoltaics generate electricity when the resource is available,
but not necessarily when electricity is needed. At the grid level, batteries offer an
electricity storage option that can moderate the variability of intermittent RES and
increase their share. They do so by providing reliable grid services (e.g. peaking
capacity, frequency and voltage control, peak shaving, congestion management, black
start), which become increasingly important in the face of baseload fossil fuel-based
assets phasing out. In behind-the-meter applications, batteries improve power quality,
reduce demand charge, and increase the reliance on self-generation. In integrated
systems supported by smart market designs, batteries may contribute to decentralisation
and the shift of consumers to prosumers, thereby empowering the participation of the EU
citizens in the energy market as envisaged in "Clean Energy for all Europeans" legislative
package [5].
Transport is a highly contributing sector in the EU that has been witnessing growth in
greenhouse gas emissions [12]. Road transport accounts for about 73 % of all
greenhouse gas emissions in transport [12]. Together with low-carbon options such as
hydrogen or advanced biofuels, the deployment of Electric Vehicles (EVs) at large scale
seems to be a prerequisite in order to transform the sector to a low-emission activity. For
a safe, clean and connected mobility, the EC promotes electro-mobility and
communicates the significance of batteries in the sector's clean energy transformation
and in the competitiveness of the EU's automotive industry with the "Europe on the
Move" and "Delivering on low-emission mobility" packages (COM (2018) 293 final, COM
(2017) 283 final, COM (2017) 675 final); [13–15]). The important role that batteries will
have in a modern and competitive automotive EU industry is acknowledged in the 2017
"A renewed EU Industrial Policy Strategy" communication (COM (2017) 479 final; [16]).
Batteries also stand at the interface of power and transport supporting their sectoral
integration. In the longer term, coupling these sectors may introduce cost efficiencies in
the system and help bring their emissions closer to zero [17,18].
For anticipated boosted future demand for Li-ion batteries the sustainable and secure
supply of raw materials (e.g. lithium, cobalt) is of strategic importance for the EU.
Scenarios on market growth of Li-ion batteries therefore also link with the European
Commission's actions on raw materials, namely the Raw Materials Initiative [19], the
European Innovation Partnership on Raw Materials [20] and the assessments on Critical
Raw Materials [21].
The EU's Research and Innovation agenda on batteries is set in the frame of a dedicated
Key Action of the Integrated SET Plan (C(2015) 6317 final; [22]), where the Declaration
of Intent defines targets for performance, cost, recycling and manufacturing of batteries
and the Implementation Plan outlines the research actions and priorities to meet the
agreed targets [23,24]. The strategic importance of batteries for the EU is further
demonstrated by the formation of the multi-stakeholder group "European Battery
Alliance" [25] and the adoption of the Strategic Action Plan for batteries as an integral
part of the third 'Europe on the Move' package.
6One of the barriers that delay the large scale deployment of batteries, and especially of
lithium ion (Li-ion) batteries, is their high capital investment costs. Even though Li-ion
battery prices fell almost 80 % since 2010 [26] they remain substantial. In the power
sector investment costs of stationary storage systems are still too high to justify a
business case, partly owing to the market design [27,28]. Similarly, although the uptake
of photovoltaics in households has been increasing, their integration with home battery
systems is limited and so far driven by preference for self-sufficiency rather than
decisions on return on investment [29,30]. In transport, upfront and total costs of
ownership of EVs are still high; more than 50 % of EV costs are attributed to battery
packs [31]. However, with strong government support in some countries, the total cost
of ownership of EVs is already in parity or even lower, compared to internal combustion
engine vehicles [32,33]. Depending on oil prices, taxation policy and use profiles, studies
expect that EVs will reach cost parity with internal combustion engines in most regions
by mid-2020 towards 2030, should battery costs decrease [26,31].
Targeted EC policies recognise that costs need to decline for mass adoption of batteries
in mobility and stationary storage applications. For example, the development of
affordable and integrated energy storage solutions is a priority area stated in the
"Accelerating Clean Energy Innovation" communication [34], and cost reduction has been
the subject of several EU-funded projects [35]. Moreover, the "Declaration of Intent of
SET Plan Key Action 7" sets a target of 75 €/kWh for a battery pack for automotive
applications and 150 €/kWh for stationary storage applications at a system level by 2030
[23] (3). The aim of these policies is straightforward: to help the EU become the global
leader in sustainable battery production and use.
Dynamics of the Li-ion battery sector –currently the fastest growing battery type–
outside the EU, however, exerts a significant influence on technological progress,
innovation and costs. While the EU has strong presence in downstream segments of the
value chain (e.g. battery pack assembly, recycling and re-purposing) [36], slightly less
than half of the battery pack costs lie in cell manufacturing [26,37], where the position of
the EU needs to be strengthened. The existing and announced manufacturing capacity of
Li-ion cells is mainly in Asia (China, Japan and South Korea) [26,36]. Besides
manufacturing capacity, Asian countries now also have the lion's share in EV sales,
reaching about 55 % of global sales in 2017 [38]. Under existing or near-term market
conditions this trend could continue, as more than one-third of the global EV fleet is
projected to be deployed in China and about one-fifth in Europe by 2040 [26]. Moreover,
the size of the EV market strongly depends on the global action required to meet agreed
climate goals. Based on existing policies, the global EV stock could reach 60 million cars
in 2030, yet this projection could more than triple should climate goals below the 2 oC
target be attained [31]. Differences in market share are even more pronounced on
batteries for stationary storage. By 2040, about 30 % of the global capacity may be
installed in China while slightly more than 10 % in Europe [39].
With these possible developments ahead, future costs of batteries may ultimately depend
on the scale and the cumulative manufacturing experience gained globally, a relationship
that has been empirically observed for several other technologies [40,41]. Despite the
plethora of assessments on how Li-ion battery costs may develop, they do not always
capture one or more of the following aspects: a) due to synergies or competition, the
market and production rate for batteries also depend on deployment of other
technologies in the energy system (e.g. residential photovoltaics), RES or climate change
mitigation goals, b) system costs of batteries for stationary storage may benefit from
innovations and production scales of battery packs for EVs, as they use similar or the
same electrochemistry, materials and manufacturing process, c) recent cost reductions in
(3) Taking into account the cost of electrochemical modules, the cost of the inverters and power electronics
and the installation and integration costs. This target refers to high efficiency (>90 %) battery-based
energy storage system (100 kW reference system) and a lifetime of thousands of cycles by 2030. SET Plan
Key Action 7 has a separate cost target for stationary applications per cycle. This target is not assessed in
the present report.
7batteries have not been included in frequently cited price forecasts, and as shown in the
case of RES technologies, effects could be substantial [42]. Energy system models that
are used for assessments of policies and technologies ( 4) so far rely on cost trajectories
that have paid limited attention to these aspects. As such, their results and the
information provided to policy makers may be influenced to the extent they relate with
battery costs. These are caveats that need to be addressed to inform the EC policy
process.
Focusing on Li-ion batteries as the family of batteries for mobility and stationary storage
applications of today and the near future, this report contextualises their potential cost
trajectories in line with the global production scale based on different technology
developments in the energy system and scenarios up to 2040. This report complements a
series of other JRC publications on key issues related to Li-ion batteries, namely the
competitiveness of the EU in the sector [43] and opportunities for Europe in the Li-ion
value chain [36].
(4) Examples of such models are PRIMES [124], POTEnCIA [125] and JRC-EU-TIMES [126].
82 Current situation of Li-ion battery markets and costs
2.1 Li-ion battery markets
Since their introduction into the mass market in 1990, Li-ion batteries have been used in
applications such as electronics, medical devices and power tools. By 2010, their total
market volume increased one order of magnitude (from about 2 to 20 GWh), reaching a
total annual market value of about 6.5 bn € largely owing to portable electronics [44].
From 2010 onwards Li-ion batteries have been growing annually at 26 % in terms of
production output and 20 % in terms of value (5). In 2017, the total market size of Li-ion
batteries was about 120 GWh (24 bn €).
The electronics market gradually slowed down, as indicated by the observed 6 % annual
growth in 2010 – 2017 (Figure 1) and is expected to saturate further as shown by near
term forecasts (section 3). Despite the saturation of the electronics market, the sales of
Li-ion batteries continued to grow primarily due to the staggering demand from EVs, the
niche yet fast growing industrial and stationary storage applications, and the slower but
substantial growth and size of other markets such as electric bikes (Figure 1). Within four
years since their introduction, annual sales of Li-ion batteries for EVs surpassed those for
electronics. They have been witnessing an average year-over-year growth of 67 % and
these trends are expected to continue (section 3). Li-ion batteries for stationary storage
begun to emerge in large market volumes around 2011 and since then their total
installed capacity increased rapidly to reach about 2 GWh in 2017 [26]. With the
penetration of renewable energy increasing, Li-ion battery sales for stationary storage
may grow even faster (section 3). Overall, the market share of Li-ion batteries for EVs
and stationary storage increased from about 5 % early this decade to more than 60 % in
2017.
Figure 1 Global historical annual growth Li-ion batteries in main market segments
140
Other
120 Energy storage & industry
EV
Li-ion battery sales
100 Electronics
[GWh/yr]
80
60
40
20
0
2010 2011 2012 2013 2014 2015 2016 2017
Source: JRC based on Avicenne Energy [44]. Note: Data include sales and stock. Electronics includes mainly
portable electronics, EV include BEV, PHEV and electric buses, Energy storage & industry includes stationary
storage, UPS, telecom, and applications in industry, Other includes medical devices, power tools, electric bikes
and gardening tools.
2.1.1 Electric vehicles
More than 3 million passenger light duty EVs were on the road in 2017 (Figure 2), which
represent about 0.2 % of the total global passenger car fleet [26,45]. Cumulative sales,
of EVs including electric buses surpassed 4 million in mid-2018 [46]. Since their
(5) Compound annual growth rate.
9introduction to the mass market in 2010, the annual sales of EVs exceeded 1 million cars
for the first time in 2017 (excluding non-plug in hybrid electric vehicles; Figure 3).
Battery Electric Vehicles (BEV) represent two-thirds of total EV sales globally (Figure 3).
In specific markets, however, such as in Japan, Plug-in Hybrid EVs (PHEV) have the lion's
share (two-thirds of new sales). In the EU, BEVs and PHEVs are currently sold annually in
roughly equal amounts [38,47,48]. The EU represents a sizeable market (15 % of new
EV sales in 2017), but more than 50 % of new EVs are nowadays sold in China.
Figure 2 Total global EV fleet (excluding electric buses) in different regions in 2010 – 2017
3 500
Norway
3 000 Other
EV total car fleet
[1 000 vehicles]
2 500 Japan
EU 28
2 000
USA
1 500 China
1 000
500
2010 2011 2012 2013 2014 2015 2016 2017
Source: JRC based on IEA [45]. Note: EU 28 represents the markets of Finland, France, Germany, the
Netherlands, Portugal, Sweden and the UK.
Figure 3 Annual new EV sales per EV type (BEV or PHEV)
1 400
PHEV
Annual new EV sales
1 200
BEV
[1 000 vehicles]
1 000
800
600
400
200
IEA BNEF IEA BNEF IEA BNEF IEA BNEF IEA BNEF IEA BNEF IEA BNEF
2011 2012 2013 2014 2015 2016 2017
Source: JRC based on IEA [45] and BNEF [38].
Electric buses are a market segment of EVs that is quickly gaining market share,
especially in China [26]. A fleet of about 386 000 electric buses in 2017 is reported,
which is roughly 10 % of the global EV fleet [26]. In mid-2018 the cumulative sales of
electric buses reached 421 000 [46]. About 97 % of electric buses and 75 % of their
batteries are currently produced in China [49]. Electric buses have large battery capacity
(60 to 550 kWh [50]), and their demand for Li-ion batteries is sizeable and comparable
with that of passenger light duty EVs (Figure 4).
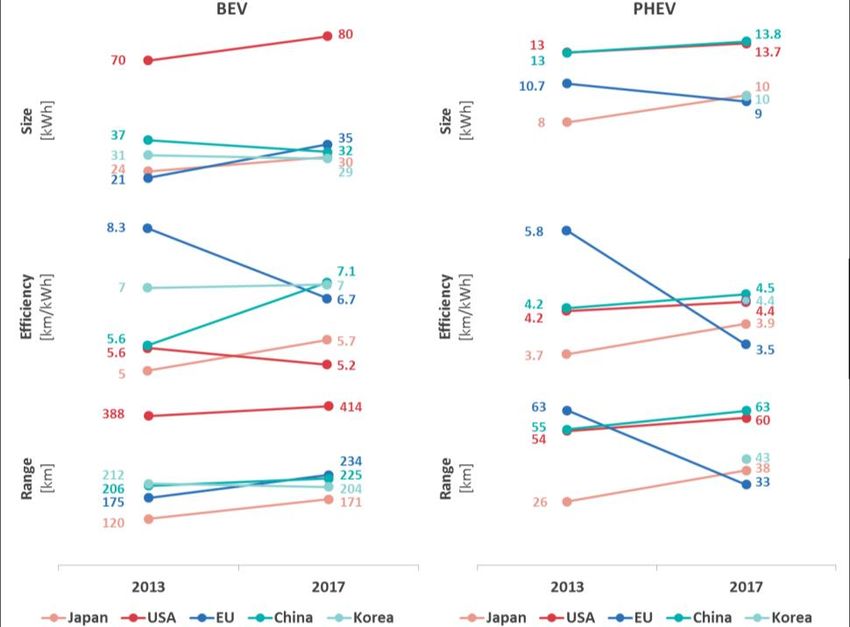
Based on annual sales, the weighted average battery capacity of BEV is around 39 kWh
and of PHEVs around 11 kWh. The EV performance characteristics vary depending on the
10producer (Figure 5). On BEV, US producers clearly stand out due Tesla vehicles, which
have large-sized batteries (75 to 100 kWh depending on the model) and consequently
long range. In terms of efficiency (6), however, Chinese and Korean manufacturers are
leading as they focus on producing lighter vehicles. PHEV manufacturers focus on
different properties as shown, for example, by the low range and efficiency of vehicles
produced by EU companies which are more power-oriented (e.g. acceleration of
roadsters, load of sport utility vehicles (7)) compared with Chinese PHEVs.
Figure 4 Li-ion battery demand for electric buses in 2017/2018
50
40
Electric buses
[GWh]
30
20
10
0
BNEF Avicenne IDTechEx
Source: JRC based on different literature sources [47,51,52]. Note: Avicenne Energy data include sales and
stock in 2017 [47]. IDTechEx data represent their forecast for 2018 [52].
Figure 5 Weighted average performance of BEV and PHEV based on sales in 2013 and 2017 per
producer
(6) Defined as km/kWh.
(7) Notably, the efficiency drop of EVs between 2013 and 2017 made by EU producers, is attributed to the
increase in the share of sales of BMW i3 in 2017, which has larger battery capacity but lower range
compared to Renault Zoe ZE sold in 2013. Similarly, the efficiency drop of PHEVs is due to the shift of sales
concentrated to Volvo V60 and Opel Ampera in 2013 to a diverse set of PHEV models in 2017 such as
BMW 330e, xDrive40e, Volkswagen Passat GTW, Audi A3 e-tron, etc.
11Source: sales data from BNEF [38] and technical specifications from WattEV2Buy [53], High Edge [54] and ITRI
[55]. Note: country grouping based on headquarter location of the producer (see Annex 1 for classification of
producers per country). Sales data include models that sold more than 8 100 since 2011 (i.e. 93 % of total light
duty EV sales).
2.1.2 Stationary storage
In 2017, global capacity of stationary storage exceeded 1.5 TWh (160 GW) [56]. The
vast majority of installed capacity is pumped hydropower (more than 98 %).
Electrochemical system storage is about 1.6 GW (2.8 bn €) and Li-ion batteries are the
main type used (8), accounting for about 1.3 GW (0.85 bn €) or 81 % (in terms of power
capacity) of all electrochemical system storage in 2017 (Figure 6). The total battery
energy storage market value is roughly equally divided between lead-acid, li-ion and
other battery technologies. Since their large-scale introduction in 2011, the sales of Li-
ion batteries for stationary storage have witnessed an overall growth, although sales
have not been following a constant increase, as shown by the drop between 2016 and
2017 (Figure 7). Nonetheless, Li-ion batteries for stationary storage applications are by
far the technology with the strongest growth and market share compared with other
electrochemical energy storage options.
Figure 6 Global cumulative installed capacity of electrochemical system storage
2 000
Other
Total installed capacity
1 600 Capacitor
Sodium
1 200 Flow
[MW]
Nickel
800 Lead acid
Li-ion
400
0
2010 2011 2012 2013 2014 2015 2016 2017
4.0
Other
Total installed capacity
3.5 Capacitor
3.0 Sodium
[GWh]
2.5 Flow
Nickel
2.0
Lead acid
1.5
Li-ion
1.0
0.5
0.0
2010 2011 2012 2013 2014 2015 2016 2017
(8) A third of rated power capacity of sodium-sulphur batteries is built in Japan, including a large-scale facility
of 50 MW/300 MWh built for arbitrage, in 2016. Sodium-sulphur batteries are characterised by high
energy-to-power ratio, thus capacity expressed in energy terms (Figure 6 lower figure) is shown to
represent more than one-third of global electrochemical capacity in 2017.
12Source: JRC based on US DOE [56]. Note: including only grid-connected energy storage; the reported power
(kW) and storage duration were used to calculate the total installed capacity of the projects in GWh.
Deployment of residential Li-ion batteries behind-the-meter, was estimated at around
600 – 650 MWh (or about 200 MW) in 2016 [57,58], which is not negligible considering
that it represents almost 20 % of the total Li-ion battery capacity installed for system
storage. BNEF reports additional behind-the-meter storage capacity of 650 MWh in
commercial and industrial sectors [58]. Other sources estimate that global installed
capacity of behind-the-meter storage was 2 300 MWh, without, however, specifying the
battery type or the sectoral application [59] (Figure 8).
Figure 7 Global annual sales of electrochemical storage
500
Other
400 Capacitator
Annual sales [MW]
Sodium
300 Flow
Nickel
200 Lead acid
Li-ion
100
0
2010 2011 2012 2013 2014 2015 2016 2017
Source: JRC based on US DOE [56].
Figure 8 Global installed capacity of energy storage installed behind-the-meter in 2016
2 500
Behind-the-meter storage
Unspecified
2 000 Industrial
Commercial
1 500
[MWh]
Residential
1 000
500
Schmidt et al. 2017 BNEF IEA
Source: JRC based on different literature sources [57–59].
2.2 Li-ion battery costs and cost structure
2.2.1 EV battery pack costs
One of the most widely cited overviews of EV battery pack costs is provided by Nykvist
and Nilsson [60], which is summarised and complemented with recent data in Figure 9.
The figure reveals a wide variation of reported historical costs, which on average range
13about ± 60 % from observed values reported by market analysts (9). Observed costs of
EV battery packs based on BNEF have decreased from about 870 €/kWh in 2010 to 170 –
215 €/kWh in 2017 (Figure 9) [26]. The range or reported values from the observed
values of BNEF (190 €/kWh in 2017) is about ± 15 % in 2017. The lower end of the cost
range of 2017 coincides with announcements of market leaders, like Tesla, at about
170 €/kWh [61].
Figure 9 Reported Li-ion battery pack costs for EVs
1 600
Reported values
Observed average (BNEF)
EV battery pack costs
1 200 Average of reported values
[€/kWh]
800
400
0
2010 2011 2012 2013 2014 2015 2016 2017
Source: JRC based on Nykvist and Nilsson [60], IEA's World Energy Outlook [62,63], IEA's Global EV Outlook
[45], SET Plan [23], Boston Consulting Group [64], IDTechEx [52], Deutsche Bank [65] and Avicenne Energy
[66]. Note: Observed average prices are based on BNEF's industry survey and are a volume-weighted average
of Li-ion battery pack prices for EVs [26,67]. Reported average is the simple average of the data included in the
graph.
One reason for the spread is that announcements made by market leaders were typically
lower than what the industry reported [60]. Reported metrics are not always consistent
across the different sources, as these may represent either production costs or market
prices of battery packs. For example, the difference between these two metrics was
found to be about 15 % in 2015 [68]. Data published by Avicenne Energy shows low
profitability or operation at loss of Li-ion cell manufacturing business with Earnings
Before Interest & Tax (EBIT) in 2016 of market leaders such as Panasonic, LG Chem and
Samsung SDI being 0 %, -1 % and -13 % [47]. Large size and multi-sectoral business
structures may enable some battery manufacturers to offer their products at a very
competitive price and to absorb large financial losses caused, for example, by product
recall (e.g. the recall of Galaxy Note 7 due to the safety issues with its battery costed
Samsung 5.3 bn $ [69]). A factor that works in the opposite direction, i.e. towards price
increase, is illegal price fixing. Several Li-ion cell manufacturers, including Samsung,
LG Chem, Sony, Sanyo, Panasonic, NEC, Toshiba and Hitachi, have been accused of a
long-term antitrust violating price-fixing conspiracy that kept prices for cylindrical Li-ion
batteries artificially high from 2000 to 2011 [70]. While settlements have been reached
with Sony, LG Chem, NEC and Hitachi, the case is continuing against the remaining Non-
Settling Defendants. The above reported factors and practices underline the important
difference between the terms “price” and “cost” in the context of the global Li-ion sector
and offer additional insights into the reasons behind widely varying numbers reported.
(9) Compared with the volume weighted average of BNEF's price survey [26].
14Different battery sizes could offer another explanation, as large batteries tend to have
lower specific costs [45] (10). Battery chemistries (11) (Table 1, Figure 10), cell quality, or
cell size and format also affect the cost of a battery pack, with a 18650 cylindrical cell
being about 30 % cheaper than a large prismatic EV cell [45,47]. The material
requirement of different cathode chemistries is shown in Figure 11 (12). Nickel-
Manganese-Cobalt oxide (NMC-111) cathodes are one of the main types used in EV
batteries (e.g. by Nissan Leaf, BMW i3, GM Chevrolet Bolt [71]). Besides the EV market,
behind-the-meter storage applications, such as Tesla's Powerwall, also use cells with
NMC cathodes [72,73]. NMC and Lithium-Iron-Phosphate (LFP) batteries seem to be the
mainstream choice for storage applications from 2017 onward [74]. The industry aims at
reducing cobalt demand in cathodes by developing and bringing into the market nickel-
rich NMC-811 cathodes (e.g. LG Chem, BYD, SK innovation [74–76]). This may reduce
supply risks on critical materials and improve battery pack costs and performance (e.g.
capacity, energy density) [71,77–79]. Some experts and analysts see a wide adoption of
NMC-811 cathodes in the EV market after 2025 [66,77], while others expect it to become
the primary choice by the early 2020s [26] (Figure 12). The second type of cathodes with
widespread commercial use is Nickel-Cobalt-Aluminum oxide (NCA) mainly produced by
Panasonic for Tesla EVs [80]. These cathodes use about 65 % less cobalt than NMC-111,
which could at least partially explain the difference between Tesla's announcements and
other manufacturers on reported costs [72].
Table 1 Main cathode chemistries used in Li-ion battery packs and their application
Main cathode chemistries Main application
Nickel Manganese Cobalt oxide (NMC) EVs, storage, other (e-bikes, medical devises,
industrial)
Nickel Cobalt Aluminum oxide (NCA) EVs, storage, other (medical devices,
industrial)
Lithium Cobalt Oxide (LCO) Portable electronics
Lithium Manganese Oxide (LMO) Power tools, medical devices
Lithium Iron Phosphate (LFP) EVs, electric buses, storage
Based on the weighted average of the global EV car fleet on the road between 2011 and
2017, NMC batteries represent 53 % of the market, NCA batteries 46 % and the
remainder are LFP or other chemistries ( 13). The predominant battery chemistry for
electric buses is LFP and their main market is in China (and to a lesser extent NMC
cathodes) [49]. In 2018, 88 % of the battery chemistries used in electric buses were LFP
[49]. By 2028, it is expected that NMC batteries will gain market share in this segment
(42 % NMC and 58 % LFP chemistries [49]).
(10) IEA mentions that a 70 kWh battery is expected to have a 25 % lower cost per unit of energy stored than a
30 kWh battery, due to the higher cell-to-pack ratio of the former [45].
(11) Based on IEA, the cost of a NMC-111 battery is about 5 % higher than the cost of an NCA battery [45].
(12) When taking into account the process yield of the battery (by cell format and application), the actual
material consumption is higher than the element composition shown in Figure 11. Based on Avicenne
Energy, the cobalt needs for NMC-111 were 0.49 kg/kWh in 2015 decreasing to 0.41 kg/kWh by 2025, and
for NCA from 0.22 kg/kWh to 0.18 kg/kWh over the same period [66]. Back of the envelope estimates
from other sources and for unspecified cathode chemistry, indicate much higher range for cobalt use from
0.36 up to 1.44 kg/kWh [78].
(13) This estimate excludes China, which historically has been relying mainly on LFP batteries and is now
gradually shifting to NMC batteries [127,128].
15Figure 10 Breakdown of the total cost of Li-ion EV battery in key components (upper figure) and
between cell components and other costs across different chemistries (lower figure)
100%
EV battery pack cost
75%
breakdown
50%
25%
0%
BNEF IDTechEx
Materials Capital Operating Labour
100%
EV battery pack cost
75%
breakdown
50%
25%
0%
NMC-111 LFP NMC-111 NCA NMC-622 NMC-811 NMC
BNEF IEA Avicenne
Energy
Cathode Anode Separator Electrolyte Other costs
Source: JRC based on BNEF, IDTechEx (upper figure; [26,52]) and BNEF, IEA and Avicenne Energy (lower
figure; [26,45,66]).
Based on the average of raw material prices over the last 8 years, the majority of the
materials for the cell and pack of NMC-111 batteries cost about 37 €/kWh, with cobalt
and copper representing about two-thirds of that cost. The majority of the materials in
NMC-811 batteries cost about 30 €/kWh, with copper and nickel covering almost 70 % of
the cost. In the case of NMC-811, lithium and cobalt each represent about 10 % of the
total material costs (see assumptions in Annex 2) (14).
(14) Based on historically high prices of raw materials of the last 8 years, NMC-111 material costs are estimated
at about 80 €/kWh and NMC-811 are estimated at 50 €/kWh.
16Figure 11 Element requirement for Li-ion battery cathodes
NMC-811
NMC-622
NMC-111
NCA
LCO
0 0.5 1 1.5
kg/kWh
Lithium Cobalt Nickel Manganese Aluminum
Source: JRC based on Olivetti et al. [77].
Figure 12 Future NMC chemistry mix in cathodes
3%
12% 17%
19%
23%
36%
35%
88%
56%
37%
43%
9% 10% 12%
Avicenne Energy BNEF Avicenne Energy BNEF
2020 2030
NMC-111 NMC-532 NMC-622 NMC-811
Source: JRC based on different experts and analysts [26,81].
2.2.2 Stationary battery system storage costs
Li-ion battery system costs for stationary storage have been witnessing a downward
trend, from 1 800 – 1 900 €/kWh in 2010 to 1 100 – 1 700 €/kWh in 2015 [57,65]. In
2017, the reported figures average at much lower costs at around 570 €/kWh, due to the
dive of battery pack prices and balance of system costs (BOS) [82]. Factors such as
boundaries (e.g. grid connection; see Figure 13), application (e.g. utility, behind-the-
meter), type of service (e.g. peak replacement, frequency control), size (e.g. kW, MW),
chemistry (e.g. NMC, LFP) characterise the technology and its costs. These vary across
the different studies and are not always reported, which could explain the wide spread,
shown in Figure 14. For example, IRENA mentions that already in 2016, under optimal
conditions, energy installation costs of Li-ion batteries for stationary storage may be as
low as 220 €/kWh, comparable with EV battery packs (section 2.2.1), possibly because
they include only electrochemical and power electronic components in the technology
boundaries. This estimate is almost a factor 10 lower than the approximately
1 400 €/kWh required for a behind-the-meter system based on Schmidt et al. [57]. As
17such, a direct comparison of Li-ion battery stationary storage system based on multiple
sources on system costs or more detailed cost structures is not always feasible.
Costs of other battery types suitable for stationary storage systems range between 100
and 400 €/kWh for lead acid technologies at utility scale [4,83] and 1 250 €/kWh at
residential scale [57], between 220 and 640 €/kWh for sodium-sulphur batteries [4,83],
and from 450 to 1 450 €/kWh for zinc-bromide flow batteries [83].
Figure 13 Illustrative system cost and price structure of stationary battery storage
Source: JRC based on Lazard and BNEF [84,85].
18Figure 14 Li-ion battery stationary system costs in 2016 and 2017
1 600
1 400
Stationary battery storage
1 200
1 000
[€/kWh]
costs
800
600 Behind-the-meter
400 Utility
200 Reported average
0
2016 2017
Source: JRC based on Schmidt et al. [57], BNEF [85], IRENA [83], IEA [63], Deutsche Bank [65], Lazard [84]
McKinsey [86] and Navigant [87].
Another aspect to consider is that Li-ion batteries may be used to cover a range of
services in the power sector. The battery configuration (power output and energy
capacity ratio) depends on the system requirements and the desired service. Specific
costs expressed per unit of power range from being similar to a factor 8 higher when
compared with specific costs expressed per unit of energy (Figure 15). Moreover, the
spread of reported costs widens when expressed per unit of power compared with costs
expressed per unit of energy (Figure 15).
Figure 15 Specific costs of Li-ion battery for stationary system storage expressed per kW and kWh
6 000
2015
Stationary battery storage
5 000 2016
2017
4 000
costs
3 000
2 000
1 000
0
€/kWh €/kW
Source: JRC based on Schmidt et al. [57], BNEF [85] and Lazard [84].
Batteries for stationary storage are used for a range of applications with some being
more suited to store energy and others to supply power. It is observed that with
increasing power-to-energy ratio the specific costs tend to decline when expressed per
unit of energy and tend to increase when expressed per unit of power (Figure 16).
Generally, it is preferable to express specific costs of battery systems tailored to deliver
energy for a long period of time (energy-designed system) per kWh and for a system
tailored to deliver more power but for a less amount of time (power-designed system)
19per kW [85]. In the present report, batteries that can provide energy for more than
1 hour are called energy-designed and batteries that can provide energy for less than
1 hour are called power-designed. Smaller scale residential batteries provide energy for
more than 1 hour and do not require system integration components.
Figure 16 Specific system costs of Li-ion battery for stationary storage expressed per kWh (upper
figure) and kW (lower figure) and power-to-energy ratio
2000
Lazard
1600 Schmidt et al. 2017
BNEF
€/kWh
1200
800
400
0
0 1 2 3 4 5 6 7 8 9
Power-to-Energy ratio
6000
Lazard
5000
Schmidt et al. 2017
4000
BNEF
€/kW
3000
2000
1000
0
0 1 2 3 4 5 6 7 8 9
Power-to-Energy ratio
Source: JRC based on Schmidt et al. [57], BNEF [88] and Lazard [84].
The distribution of power-to-energy ratios of projects with similar size is comparable
across different databases (Figure 17). Utility-scale projects tend to be more energy-
designed (power-to-energy ratio lower than 1), whilst commercial- or residential-scale
projects tend to be power-designed (power-to-energy ratio > 1). The spread of values in
Figure 17 indicates that the design of the system is project specific.
The cost structure of battery storage systems in 2017 is shown in Figure 18. Regardless
of the system service, the battery pack is a key cost component that represents 42 to
50 % of the total cost (15). The Power Conversion System (PCS), comprised mainly by
the inverter, is a major cost component in power-designed storage systems, while in
energy-designed storage systems the Energy Management System (EMS) becomes more
important (a description of the cost components of stationary battery storage systems is
presented in Figure 13).
(15) The cost of battery packs for EV and stationary storage applications are similar. However, different
requirements between applications (e.g. technical, long term functionality and external constraints [119])
could partially explain differences at a pack or at a systems level.
20Figure 17 Distribution of power-to-energy ratio based on project size
Utility scale (≥ 1 MWh)
50 %
BNEF
40 % US DOE
30 %
20 %
10 %
0%
C-rate ≥ 2 1 ≥ C-rate < 2 0.5 ≥ C-rate < 1 0.25 ≥ C-rate < 0.1 ≥ C-rate < C-rate < 0.1
0.5 0.25
Commercial or residential scale (≤ 100 kWh)
60 %
BNEF
50 %
US DOE
40 %
30 %
20 %
10 %
0%
C-rate ≥ 2 1 ≥ C-rate < 2 0.5 ≥ C-rate < 1 0.25 ≥ C-rate < 0.1 ≥ C-rate < C-rate < 0.1
0.5 0.25
Source: JRC based on BNEF [88] (214 projects > 1 MWh, 19 projects < 100 kWh) and US DOE [56]
(136 projects > 1 MWh, 119 projects < 100 kWh). Residential applications are not included in the datasets.
Note: Lazard's industry survey data [84], indicate for utility-scale projects (4 to 400 MWh) a ratio between 0.15
and 0.25 (energy-designed systems). For commercial or residential applications (10 to 250 kWh), Lazard's
reported ratio is 0.5 (energy-designed). Note: The discharge rate of a battery is expressed by its C-rate. The
capacity of a battery rated at 1C means that a fully charged battery will be completely discharged in 1 hour. 2C
rate means that the battery can be fully discharged in half an hour. ½C rate means that the battery can be fully
discharged in 2 hours.
According to most studies, the division of Li-ion battery storage systems into components
(Figure 19) shows that materials contribute 65 to 80 % (similar with the contribution of
materials in EV battery packs; section 2.2.1) and the remainder is mainly labour,
overhead, margins and other non-material costs. IRENA estimates the cost contribution
of materials to be less, at 30 % of which two-thirds are cell costs, and attributes the
remainder to other system costs [83]. The disparity in the cost-structure between the
sources is possibly due to different system boundaries (IRENA assesses stationary
system storage, while the other sources assess battery packs).
21Figure 18 Cost breakdown of power-designed (C-rate 2) and energy-designed (C-rate 0.25) grid-
scale stationary storage system
820 €/kWh or 410 €/kW 500 €/kWh or 2 000 €/kW
100%
75%
50%
25%
0%
Power-designed Energy-designed
Battery pack BOS PCS EMS EPC Grid connection
Source: JRC based on average costs in BNEF's survey [85]. Note: Balance of System (BOS), Power Conversion
System (PCS), Energy Management System (EMS), Engineering, Procurement and Construction (EPC).
Figure 19 Cost breakdown of Li-ion battery storage system between cell components and other
costs
100 %
Other costs
80 %
Rest materials
60 % Separator
Electrolyte
40 %
Cathode
20 % Anode
0%
IRENA 2017 Pillot 2015 Sakti et al. Roland Berger Lowe et al.
2015 2012 2010
Source: IRENA and sources therein [83]. Note: sources in IRENA [83] represent cost breakdown of Li-ion
battery packs.
2.2.3 Cost reduction drivers
The fast growing pace of EV sales over the last years and the slower growth of other Li-
ion battery markets (Figure 1) have led to volume-driven cost reduction, owing to
technical progress (e.g. battery chemistries), improvements in manufacturing and
economies of scale. The growing research and innovation activity as measured by patent
statistics (Figure 20) may have also been contributing at an accelerating rate. Kittner et
al. [89] estimate a reduction in the order of 2 % per 100 patents (Patent Cooperation
Treaty; PCT), while the rest may be attributed to increasing production scale. Beyond
technical factors, the U.S. Department of Energy identifies three reasons that can explain
the price drop, based on market conditions and business strategy [68]. These are:
production overcapacity that may lead to supply-demand imbalances, competitive long-
term supply contract offerings that are based on anticipated cost reduction and finally,
strategic corporate behaviour.
22Figure 20 Annual patent activity on batteries filed globally and by the EU
1 600
Global
Number of patent families
on batteries annually
1 200 EU
800
400
0
2008 2009 2010 2011 2012 2013 2014
Source: JRC method [90] based on PatStat data (Autumn 2017 edition). Note: Global numbers include the EU.
The expected market surge, primarily of EVs [91], entails growth in production and
manufacturing scales, in view of the announced megafactory and gigafactory capacities
around the world (section 3.1). This may act as a driver for further cost reduction due to
economies in production scale. Accumulated experience may also lead to improved and
optimised manufacturing processes, bringing the costs of Li-ion further down. Moreover,
by means of vertical integration of production steps across the value chain (e.g. cell and
pack production), transportation expenses and turnaround time could decrease leading to
lower costs [43].
In addition, whilst several chemistries of Li-ion batteries already exist in the market (e.g.
NMC, NCA, LFP, LCO [92]), there are continuous efforts on improving Li-ion battery
cathode chemistry and material composition aiming to deliver better performance (e.g.
higher energy density), lower specific costs and removing other bottlenecks such as the
dependence on cobalt. It is not known which the dominating cathode chemistry will be or
when it will emerge at commercial scale as different expectations are expressed by
analysts (Figure 12).
Ongoing research on further improving Li-ion battery chemistries (e.g. high-voltage
electrolytes, durable lithium manganese oxide cells), combining conversion cathodes with
silicon-containing anodes, or moving beyond Li-ion (e.g. lithium-metal, solid state,
lithium-sulphur, lithium-air) signals to greater cost reduction potential [36,78,83].
Forecasted battery technology evolution, originally presented by the German National
Platform for Electromobility [93] and adopted in the preceding JRC publications on key
issues related to Li-ion batteries [36,43], gives an indication of the timeline for the
commercialisation of future battery technologies for mobility applications. The situation is
less clear with technologies for energy storage because of the large diversity of services.
Finally, the multiple applications in which Li-ion batteries are used, may offer additional
synergies for learning. Stationary storage system costs may benefit from large
photovoltaic inverter manufacturers entering the market thus reducing PCS costs. Scale
effects based on project size could affect other components such as BOS and
Engineering, Procurement and Construction (EPC), as well as standardisation of system
design, design improvements, engineering and competitive markets [82,86].
23You can also read