Toronto Islands Flood Characterization and Risk Assessment Project - Flood Risk Assessment Report - TRCA
←
→
Page content transcription
If your browser does not render page correctly, please read the page content below

Toronto Islands Flood Characterization and Risk
Assessment Project
Flood Risk Assessment Report

30 April 2019 | 13017.101.R2.Rev0_FloodRisk
Toronto Islands Flood Characterization and Risk
      Assessment Project
      Flood Risk Assessment Report

      Prepared for:                                                               Prepared by:

      Toronto and Region Conservation Authority                              W.F. Baird & Associates Coastal Engineers Ltd.
      101 Exchange Avenue
      Vaughan, Ontario                                                       For further information, please contact
      L4K 5R6                                                                Josh Wiebe at +1 905 845 5385
                                                                             jwiebe@baird.com
                                                                             www.baird.com

13017.101.R2.Rev0_FloodRisk
Z:\Shared With Me\QMS\2019\Reports_2019\13017.101.R2.Rev0_FloodRisk.docx

  Revision        Date                 Status          Comments                              Prepared         Reviewed          Approved

  A               2018/02/12           Draft           Client Review                         DJE              JDW               RBN

  0               2018/04/30           Final           Final Report                          JDW              RBN               RBN

© 2019 W.F. Baird & Associates Coastal Engineers Ltd. (Baird) All Rights Reserved. Copyright in the whole and every part of this document,
including any data sets or outputs that accompany this report, belongs to Baird and may not be used, sold, transferred, copied or
reproduced in whole or in part in any manner or form or in or on any media to any person without the prior written consent of Baird.

This document was prepared by W.F. Baird & Associates Coastal Engineers Ltd. for Toronto and Region Conservation Authority. The
outputs from this document are designated only for application to the intended purpose, as specified in the document, and should not be
used for any other site or project. The material in it reflects the judgment of Baird in light of the information available to them at the time of
preparation. Any use that a Third Party makes of this document, or any reliance on decisions to be made based on it, are the responsibility
of such Third Parties. Baird accepts no responsibility for damages, if any, suffered by any Third Party as a result of decisions made or
actions based on this document.

13017.101.R2.Rev0_FloodRisk                                                                                                               Page i
Executive Summary
Baird & Associates (Baird) was retained by Toronto and Region Conservation Authority (TRCA) to undertake a
flood characterization and risk assessment for the Toronto Islands. The first report updated the return period
water levels at Toronto. This report quantifies the financial costs and other impacts to Toronto Island residents,
businesses, and the City of Toronto for the different return period flood events under existing conditions. The
study is intended to assist TRCA and the City of Toronto in identifying and understanding risk to infrastructure
on the islands.

Residential and business surveys were administered to island residents and businesses to understand the
impact of the 2017 flood. Residents generally reported low depths of flooding and low financial damages (less
than $3,000). The largest impact on residents was anxiety of not knowing how high the lake would get.
Residents reported a high level of support from neighbours, City of Toronto, TRCA, and friends and family. A
limited number of responses were received from the business survey. Businesses were most strongly
impacted by the closure of Toronto Island Park between May 4 and July 30 (nearly the entire tourist season).

Tangible (financial) damages for Toronto Island residents and businesses were estimated using the Alberta
Provincial Flood Damages Assessment Study (PFDAS) method. The method relies on depth-damage
relationships that were developed following the Calgary 2013 flood. For a given building classification,
structural and building contents damages can be estimated from the depth of floodwater and the floor area of
the building. Residential indirect damages such as flood mitigation, cleanup, etc. were included as a 15%
markup on the structural and contents damages. Non-residential indirect damages were estimated using a
method of business disruption and productivity rates outlined in the Canadian Floodplain Mapping Guidelines
Series by Natural Resources Canada. All damages were adjusted to Ontario 2017 dollars using indexing
methods.

Estimated total tangible damages to residents and businesses range from $0.5M to $6.5M for the 2-year and
500-year flood event, respectively. The average annual tangible damages are estimated to be $387,000 per
year. City of Toronto damages were not included in the damage estimates due to the nature of the buildings
(no appropriate PFDAS category), and the fact that indirect damages such as flood mitigation, cleanup, lost
ferry revenues, lost rents, etc. would not be captured in the damage estimates. Telephone and e-mail
communications with City of Toronto staff confirmed that indirect damages will be difficult to quantify for
different flood levels. The estimated City of Toronto damages from the 2017 flood are in the neighbourhood of
$8M.

Intangible damages are non-financial damages such as impacts to health, society, and the environment. The
more severe impacts include respiratory conditions that could develop due to mould, change in the social fabric
of the island community, and loss of mature trees.

The tangible damage estimates in this study could be improved by better understanding the indirect damages
incurred by the City of Toronto and the impacts on island businesses.

Toronto Islands Flood Characterization and Risk Assessment Project
Flood Risk Assessment Report

13017.101.R2.Rev0_FloodRisk                                                                               Page ii

Table of Contents
1.    Introduction and Study Objectives.......................................................................................1

      1.1       Summary of Return Period Water Levels                                                                                1

      1.2       Note on Elevations and Datums                                                                                        1

2.    Types of Flood Damages .......................................................................................................3

      2.1       Tangible Damages                                                                                                     3

               2.1.1 Direct Damages                                                                                                  3

               2.1.2 Indirect Damages                                                                                                3

      2.2       Intangible Damages                                                                                                   4

      2.3       Factors Affecting Flood Damages                                                                                      4

3.    2017 Flood Damages ..............................................................................................................5

      3.1       Residential Survey                                                                                                   7

               3.1.1 Physical Damages                                                                                                9

               3.1.2 Financial Impacts                                                                                              12

               3.1.3 Health Impacts                                                                                                 13

      3.2       Business Survey Results                                                                                             15

      3.3       City of Toronto Impacts                                                                                             16

4.    Flood Damage Calculation Procedures ............................................................................ 22

      4.1       Overview of Alberta PFDAS Method                                                                                    22

      4.2       Regional Price Adjustment for Toronto                                                                               23

      4.3       Building Classification Scheme                                                                                      24

      4.4       Tangible Residential Damages                                                                                        30

               4.4.1 Direct Damages                                                                                                 30

               4.4.2 Indirect Damages                                                                                               31

               4.4.3 Modifications for Toronto Islands                                                                              31

               4.4.4 Generalized Calculation Procedure Flowchart                                                                    31
Toronto Islands Flood Characterization and Risk Assessment Project
Flood Risk Assessment Report

13017.101.R2.Rev0_FloodRisk                                                                                                       Page iii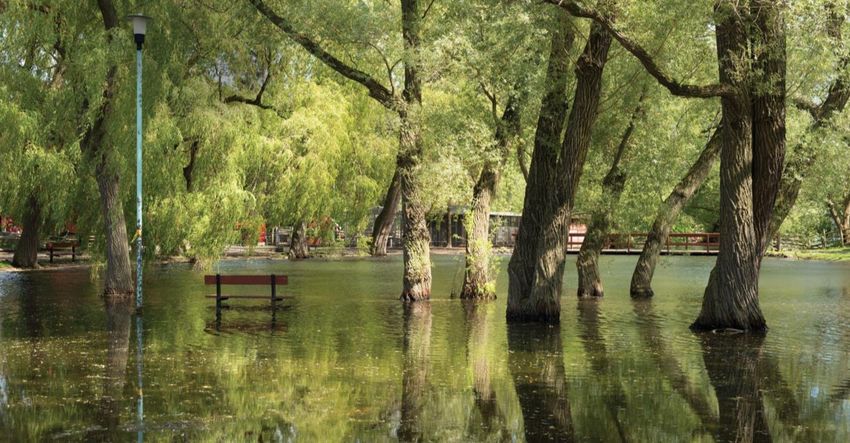
4.5       Tangible Non-Residential Damages                                                                                       33

                4.5.1 Direct Damages                                                                                                   33

                4.5.2 Indirect Damages                                                                                                 34

                4.5.3 Modifications for Toronto Islands                                                                                34

                4.5.4 Generalized Calculation Procedure Flowchart                                                                      34

5.    Building Inventory ............................................................................................................... 36

      5.1       Field Survey                                                                                                           36

                5.1.1 Residential Buildings                                                                                            36

                5.1.2 Non-Residential Buildings                                                                                        39

                5.1.3 City of Toronto Buildings                                                                                        42

      5.2       Input for Estimate of Flood Damages                                                                                    45

6.    Estimation of Tangible Damages....................................................................................... 47

      6.1       Residential Buildings                                                                                                  47

                6.1.1 Calculation Results                                                                                              47

                6.1.2 Comparison of 2017 Flood Calculations to Survey Data                                                             48

                6.1.3 Assumptions and Limitations                                                                                      50

      6.2       Non-Residential Buildings                                                                                              51

                6.2.1 Calculation Results                                                                                              51

                6.2.2 Comparison of 2017 Flood Calculations to Survey Data                                                             51

                6.2.3 Assumptions and Limitations                                                                                      52

                6.2.4 Non-Residential Indirect Damages as a Function of Toronto Island Park
                Closure                                                                     53

      6.3       City of Toronto                                                                                                        53

                6.3.1 Temporary Flood Mitigation                                                                                       54

                6.3.2 Ferry Services                                                                                                   55

                6.3.3 Roads and Pathways                                                                                               55

                6.3.4 Public Amenities                                                                                                 57
Toronto Islands Flood Characterization and Risk Assessment Project
Flood Risk Assessment Report

13017.101.R2.Rev0_FloodRisk                                                                                                          Page iv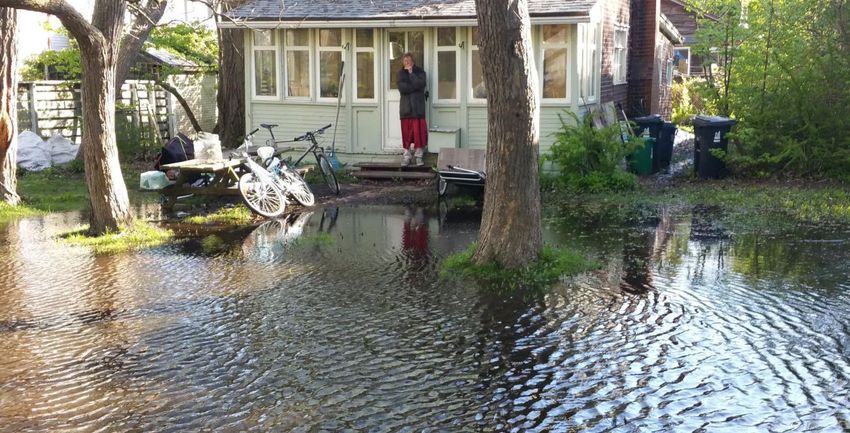
6.3.5 Permits, Licences and Tenants                                                                                        57

                 6.3.6 Institutional Buildings                                                                                              57

                 6.3.7 Utility Infrastructure                                                                                               58

       6.4        Total Tangible Damages                                                                                                    59

       6.5        Average Annual Tangible Damages                                                                                           60

7.     Estimation of Intangible Damages .................................................................................... 61

       7.1        Health Impacts                                                                                                            61

       7.2        Social Impacts                                                                                                            62

       7.3        Environmental Impacts                                                                                                     64

8.     Conclusions and Recommendations................................................................................ 66

References.................................................................................................................................... 67

                           2017 Flood Impact Resident Survey

                           2017 Flood Impact Business Survey

                           Selected Alberta PFDAS Depth-Damage Curves

Tables
Table 1.1: Estimated Toronto Harbour Return Period Stillwater Levels Under 2014 Regulation Plan .......... 1
Table 3.1: Summary of Residential Damages from 2017 Flood ....................................................................... 8
Table 3.2: List of Businesses and Organizations Operating on Toronto Islands ........................................... 16
Table 3.3: Budgeted 2017 Revenue from Rents and Licence Fees .............................................................. 21
Table 4.1: Residential Contents Damages Indexing Factor – AB 2014 to ON 2017 ..................................... 23
Table 4.2: Structural Damages Indexing Factors – AB 2014 to ON 2017 ...................................................... 24
Table 4.3: PFDAS Residential Classification Scheme ..................................................................................... 25
Table 4.4: PFDAS Non-Residential Contents Classification Scheme............................................................. 28
Table 4.5: PFDAS Non-residential Structural Classification Scheme ............................................................. 29
Table 6.1: Estimated Number of Residential Buildings Flooded at Different Flood Levels ........................... 47
Table 7.1: Subjective Rating of Severity of Flood Impact on Households ..................................................... 61

Toronto Islands Flood Characterization and Risk Assessment Project
Flood Risk Assessment Report

13017.101.R2.Rev0_FloodRisk                                                                                                                Page v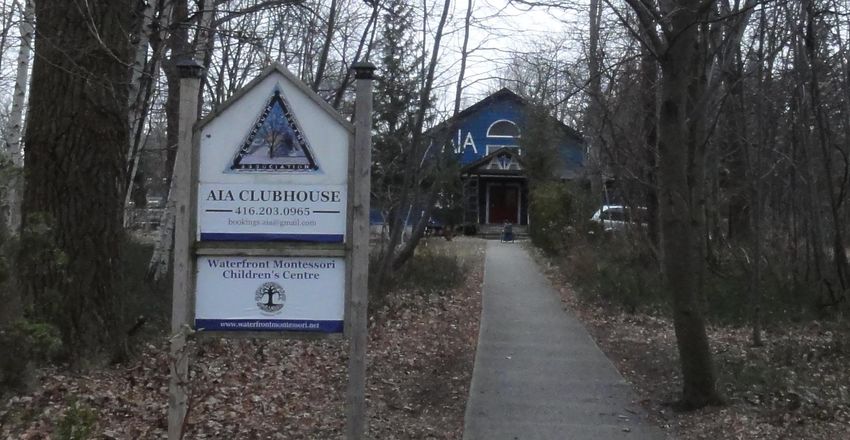
Table 7.2: Estimated Number of Residents Impacted at Different Flood Levels............................................ 63
Table C.1: Residential Contents Damages Values in $/m2 .............................................................................C3
Table C.2: Residential Structural Damages Values in $/m2.............................................................................C4
Table C.3: Non-residential Contents Damages Values in $/m2 .......................................................................C6
Table C.4: Non-residential Structural Damages Values in $/m2 ......................................................................C6
Table C.5: Non-Residential Days of Business Disruption ................................................................................C8
Table C.6: Non-Residential Days of Productivity Loss .....................................................................................C8
Table C.7: Non-Residential Loss of Productivity in $/m2 ..................................................................................C9

Figures
Figure 1.1: Elevation of the Toronto Harbour Gaugehouse Benchmark .......................................................... 2
Figure 2.1: Classification of Flood Damages ...................................................................................................... 3
Figure 3.1: Photograph of Wave Overtopping of Algonquin Island Seawall in 2017 ....................................... 5
Figure 3.2: Map of Sandbag Locations during 2017 Flood ................................................................................ 6
Figure 3.3: Photograph of Sandbags and High-Discharge Pump on Algonquin Island................................... 6
Figure 3.4: Photographs of Flooded Yards in 2017 ............................................................................................ 7
Figure 3.5: Summary of Flood Exposure of Residential Survey Respondents ................................................ 9
Figure 3.6: Summary of Flood Depths in Yard for Residential Survey Respondents .................................... 10
Figure 3.7: Summary of Flood Durations for Residential Survey Respondents ............................................. 10
Figure 3.8: Summary of Flood Damages of Residential Survey Respondents .............................................. 11
Figure 3.9: Summary of Mitigation Actions by Residential Survey Respondents .......................................... 12
Figure 3.10: Summary of Financial Damages Incurred by Residential Survey Respondents ...................... 13
Figure 3.11: Summary of Health Impacts Reported by Residential Survey Respondents ............................ 14
Figure 3.12: Summary of Causes of Anxiety Reported by Residential Survey Respondents ...................... 14
Figure 3.13: Summary of Sources of Support Reported by Residential Survey Respondents..................... 15
Figure 3.14: Photograph of Toronto Island Water Treatment Plant ................................................................ 17
Figure 3.15: Photograph of Damage to Centre Island Washroom & Bathing Station.................................... 18
Figure 3.16: Photograph of Damage to Centre Island Grandstand ................................................................ 19
Figure 4.1: PFDAS Residential Building Classifications (AA-C) – Typical Examples .................................... 26
Figure 4.2: PFDAS Residential Building Classifications (D-MW) – Typical Examples .................................. 27
Figure 4.3: Generalized Procedure for Calculation of Residential Total Tangible Damages ........................ 32
Figure 4.4: Generalized Procedure for Calculation of Non-residential Total Tangible Damages ................. 35
Figure 5.1: Example of C-1 Residential Building on Algonquin Island ............................................................ 37
Toronto Islands Flood Characterization and Risk Assessment Project
Flood Risk Assessment Report

13017.101.R2.Rev0_FloodRisk                                                                                                                   Page vi
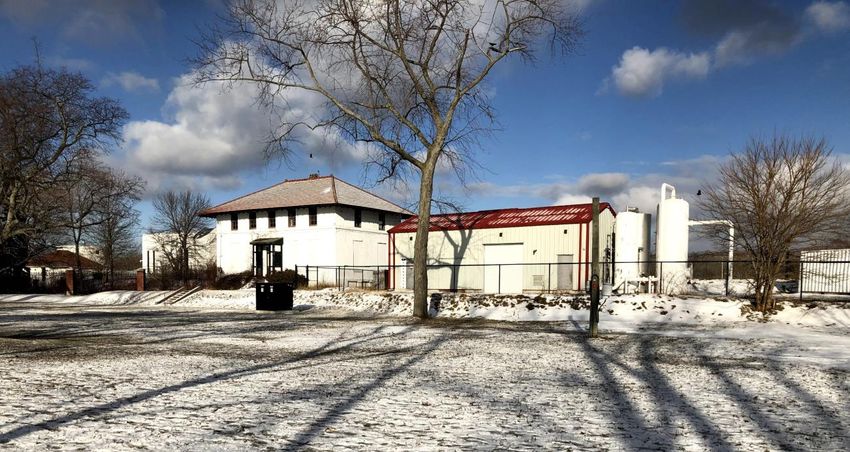
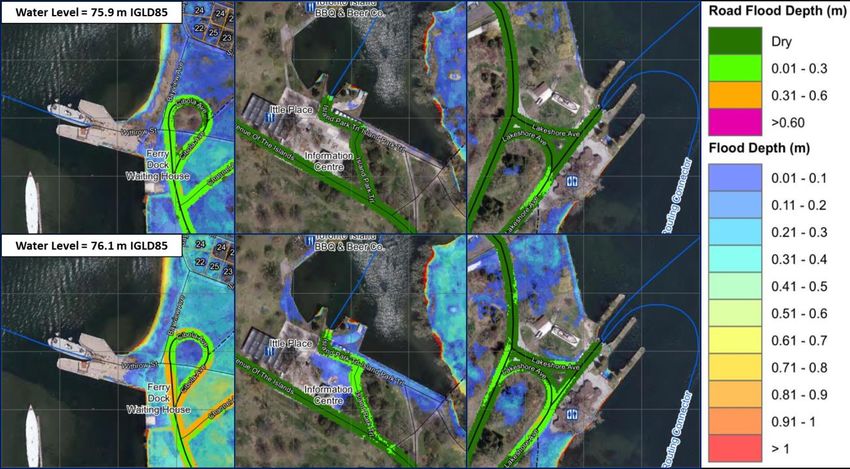
Figure 5.2: Example of C-2 Residential Building on Algonquin Island ............................................................ 37
Figure 5.3: Example of B-2 Residential Building on Algonquin Island ............................................................ 38
Figure 5.4: Example of A-2 Residential Building on Ward’s Island ................................................................. 38
Figure 5.5: Example of Centreville Buildings on Centre Island........................................................................ 39
Figure 5.6: Island Café on Ward’s Island .......................................................................................................... 40
Figure 5.7: The Shaw House Event Venue on Ward’s Island ......................................................................... 40
Figure 5.8: Bicycle Rental and Snack Bar on Centre Island ............................................................................ 41
Figure 5.9: Algonquin Island Association Clubhouse and Montessori School on Algonquin Island ............. 41
Figure 5.10: Queen City Yacht Club on Algonquin Island................................................................................ 42
Figure 5.11: City of Toronto Fire Station #335 and EMS Station #48 on Ward’s Island................................ 43
Figure 5.12: Public Washrooms and Storage Building on Ward’s island ....................................................... 43
Figure 5.13: Island Water Treatment Plant ....................................................................................................... 44
Figure 5.14: Public Changerooms on Centre Island ........................................................................................ 44
Figure 5.15: Estimated First Floor Elevation and Ground Elevation at Front Entrance on Algonquin and Ward’s
Island .................................................................................................................................................................... 46
Figure 6.1: Calculated Direct, Indirect and Total Tangible Damages for Different Flood Return Periods .... 48
Figure 6.2: Percentage of Homes with Crawlspace, Basement, or First Floor Flooding in 2017 ................. 49
Figure 6.3: Percentage of Flooded Homes by Total Depth of Flooding .......................................................... 49
Figure 6.4: Comparison of Total Tangible Damages from Calculations vs. Resident Survey ...................... 50
Figure 6.5: Calculated Non-residential Direct, Indirect and Total Tangible Damages ................................... 51
Figure 6.6: Estimated Non-Residential Indirect Damages Resulting from Closure of Toronto Island Park . 53
Figure 6.7: Floodwater Depths in Residential Areas at 75.9 m and 76.1 m ................................................... 54
Figure 6.8: Floodwater Depths at Ward’s Island Ferry Dock, Centre Island Ferry Dock and Hanlan’s Point Ferry
Dock at 75.9 m and 76.1 m ................................................................................................................................ 55
Figure 6.9: Photograph of Cibola Ave. During 2017 Flood .............................................................................. 56
Figure 6.10: Floodwater Depths at Gibraltar Point at 75.9 m and 76.1 m ..................................................... 56
Figure 6.11: Flooding in Central Area of Toronto Islands at 75.9 m and 76.1 m .......................................... 57
Figure 6.12: Examples of a Sewage Pump Station and an Electrical Transformer on Ward’s Island .......... 59
Figure 6.13: Total Tangible Damages for Different Flood Return Periods...................................................... 59
Figure 6.14: Total Tangible Damages vs. Probability Curve for Different Return Periods ............................ 60
Figure 7.1: Photograph of City Crew Filling Sandbags During 2017 Flood .................................................... 62
Figure 7.2: Photograph of a Resident’s Front Yard in 2017............................................................................. 63
Figure 7.3: Photograph of Loss of Use of Public Amenities in 2017 ............................................................... 64
Figure 7.4: Photograph of Flooded Parkland and Trees in 2017 .................................................................... 65

Toronto Islands Flood Characterization and Risk Assessment Project
Flood Risk Assessment Report

13017.101.R2.Rev0_FloodRisk                                                                                                                                      Page vii
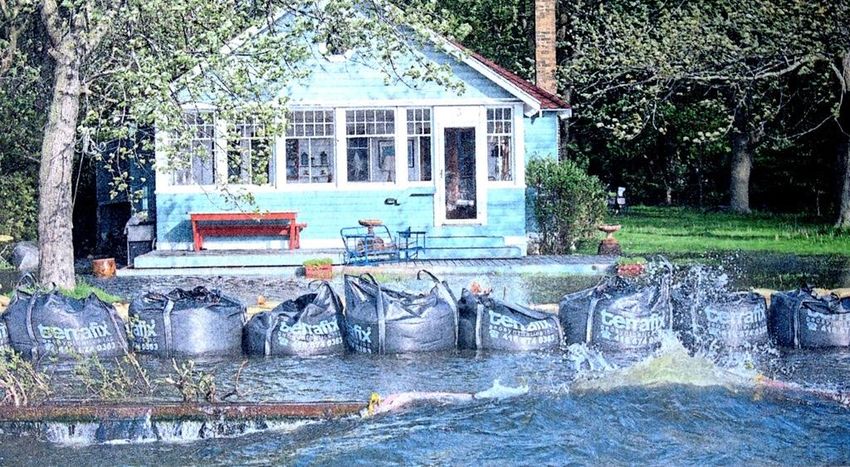
Figure 7.5: Forested Areas that are Vulnerable to Flood Damage include: Ward’s Island, Snake Island, North &
South Chippewa Islands, Centre Island between the Fire Hall and St. Andrew’s Church, Olympic Island, and
Gibraltar Point ...................................................................................................................................................... 65
Figure C.1: Residential Contents Depth-Damages Curves .............................................................................C2
Figure C.2: Residential Structural Depth-Damages Curves ............................................................................C2
Figure C.3: Non-residential Contents Depth-Damages Curve ........................................................................C5
Figure C.4: Non-residential Structural Depth-Damages Curves .....................................................................C5
Figure C.5: Non-Residential Days of Business Disruption and Productivity Loss..........................................C7
Figure C.6: Non-Residential Productivity Loss Depth-Damages Curves .......................................................C7

Toronto Islands Flood Characterization and Risk Assessment Project
Flood Risk Assessment Report

13017.101.R2.Rev0_FloodRisk                                                                                                                                Page viii
1.           Introduction and Study Objectives
Baird & Associates (Baird) was retained by Toronto and Region Conservation Authority (TRCA) to undertake a
flood characterization and risk assessment for the Toronto Islands. The overall project objective is to develop
conceptual designs, costs, and estimates of annualized reductions in flood damages for various flood
mitigation alternatives. The project deliverables will include three reports and one set of emergency response
maps. The assessment will consist of the following four main parts:
•      Flood Risk Characterization: review the conditions that led to the 2017 flooding and re-evaluate return-
       period extreme lake levels in light of recent data and climate change science.
•      Flood Risk Assessment: quantify tangible and intangible damages resulting from the return-period flood
       risk events.
•      Flood Response Plan: develop emergency mapping based on input from the City of Toronto and TRCA.
•      Flood Mitigation Alternatives: develop conceptual designs to mitigate the flood risk and quantify
       annualized expenditures or savings resulting from mitigation works.

This second report evaluates the damages that could be incurred by island residents, businesses, and the City
of Toronto for different return-period flood levels. The study is intended to assist TRCA and the City of Toronto
in identifying and understanding risk to the community and infrastructure on the islands.

1.1          Summary of Return Period Water Levels

Return period water levels for Ontario locations on the Great Lakes were developed by the Ontario Ministry of
Natural Resources (OMNR, 1989). Baird updated the return period water levels at Toronto for the Flood
Characterization Report (Baird, 2019). The update made use of the additional 31 years of measured data and
included an adjustment to account for the change in Lake Ontario regulation plans.

Climate change research was also reviewed to understand how water levels may change in the future. Current
research suggests that water levels in the Great Lakes will remain similar or decline slightly due to increased
evapotranspiration (see e.g. Baird, 2019; McDermid et al., 2015). At this time, Baird does not recommend any
increase or decrease in the return period water levels due to climate change. The estimated return period
stillwater levels (static lake level plus storm surge) for Toronto are summarized in Table 1.1.

Table 1.1: Estimated Toronto Harbour Return Period Stillwater Levels Under 2014 Regulation Plan
(Baird, 2019)

    Return Period      2 year     5 year       10 year      25 year   50 year   100 year   200 year   500 year

    Stillwater level
     (m IGLD85)        75.38       75.65        75.80        75.94    76.01      76.05      76.14       76.25

1.2          Note on Elevations and Datums

Unless otherwise noted, all water levels are reported in International Great Lakes Datum 1985 (IGLD85).
IGLD85 is 8.4 cm below Canadian Geodetic Vertical Datum 1928-1978 Ontario Adjusted Version (CGVD
1928:1978), and 49.6 cm below Canadian Geodetic Vertical Datum 2013 (CGVD 2013) at the Canadian
Hydrographic Service benchmark 0011959U9526 (also known as 00159U9526, 59U9526, and TORO 1-
1959). The benchmark is located at the Toronto Harbour Gaugehouse at the south side of Queen’s Quay. The
elevation of the benchmark relative to the different datums is shown in Figure 1.1.
Toronto Islands Flood Characterization and Risk Assessment Project
Flood Risk Assessment Report

13017.101.R2.Rev0_FloodRisk                                                                                Page 1
Figure 1.1: Elevation of the Toronto Harbour Gaugehouse Benchmark Toronto Islands Flood Characterization and Risk Assessment Project Flood Risk Assessment Report 13017.101.R2.Rev0_FloodRisk Page 2
2.         Types of Flood Damages
The types of damages resulting from a flood can be categorized as either tangible or intangible. Tangible
damages are financial damages that result from damages to property and other costs that were incurred
because of the flood. Intangible damages are non-financial damages and include social, environmental and
health impacts. The different types of flood damages, and terminology used in this report, are outlined in Figure
2.1.

Figure 2.1: Classification of Flood Damages (from NRCAN, 2017)

2.1        Tangible Damages

2.1.1      Direct Damages

Direct damages are damages to property caused by floodwater. Direct damages include structural damages to
a building and the internal and external building contents. Examples of direct damages include damaged:
walls, flooring, appliances, insulation, household items, etc.

2.1.2      Indirect Damages
Indirect damages are financial costs that were incurred because of a flood. Indirect damages include flood
mitigation actions, post-flood cleanup, evacuation, temporary housing, loss of opportunity, employment losses,

Toronto Islands Flood Characterization and Risk Assessment Project
Flood Risk Assessment Report

13017.101.R2.Rev0_FloodRisk                                                                              Page 3
business disruption, etc. Some indirect damages are difficult to quantify, and total indirect damages are often
estimated as a percentage of direct damages.
2.2 Intangible Damages
Intangible damages represent the social, health and environmental impacts associated with a flood. These
types of damages can be significant and have long lasting impacts on the social fabric of a community, human
health, and the environment. Examples of social impacts include separation from loved ones, disputes
between neighbours, residents choosing to relocate after a flood, and general inconvenience. Stressful
situations, such as a flood, can also bring communities together and strengthen the social fabric. Examples of
health impacts include new or aggravated physical injuries, exposure to mould, stress, anxiety, and sleeping
difficulties. Examples of environmental impacts include sewage overflows, loss of habitat, loss of mature trees,
shoreline erosion, etc.
2.3 Factors Affecting Flood Damages
The depth and extent of flooding are the most important factors for estimating flood damages. However, other
factors, such as warning time and flood duration, can affect the severity of flood damages. These factors may
be accounted for by applying a mark up to the primary estimates. Factors or considerations relevant to the
Toronto Islands include:
• Warning Time: adequate warning time can allow residents, businesses and municipalities to prepare
for a flood event and potentially mitigate a portion of the expected damages
• Flood Duration: floods lasting extended periods of time can induce significantly higher damages.
• Ice: impacts from moving ice can damage buildings and contents. Indirect damages may be higher
when ice is present.
• Sediment: sediment laden floodwater can result in higher damages (e.g. cleanup costs).
• Groundwater Seepage: porous soils can result in seepage of water into basements outside the
floodplain extents.
Toronto Islands Flood Characterization and Risk Assessment Project
Flood Risk Assessment Report
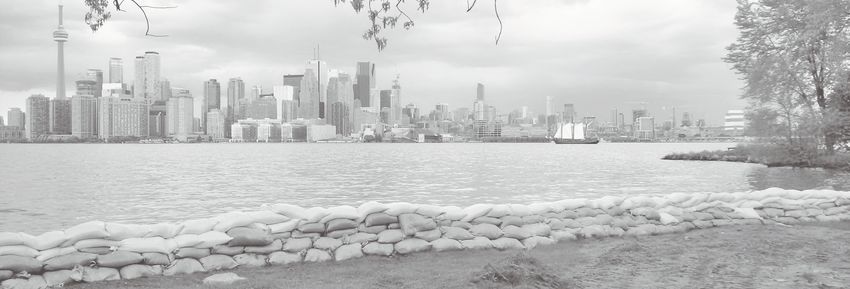
13017.101.R2.Rev0_FloodRisk Page 43. 2017 Flood Damages Toronto Island Park was closed between May 4 and July 30, 2017 as a result of the high water levels in Lake Ontario (City of Toronto, 2018a). Flooding on Toronto Islands was due to a high water table, which resulted in flooding of crawlspaces and basements in many homes. Wave overtopping at Algonquin Island and heavy rainfall contributed to localized flooding and ponding of water (see Figure 3.1). Figure 3.1: Photograph of Wave Overtopping of Algonquin Island Seawall in 2017 The Toronto Islands ferry service was restricted to residents and authorized personnel during the park closure. Many public facilities and access roads were flooded, resulting in the temporary closure of the Island Public/Natural Science School (and relocation of students to the mainland) and cancellation of events. Life was considerably altered for residents on the islands and many businesses temporarily closed or operated at a reduced capacity. Actions were taken by the City of Toronto, residents, and businesses owners to mitigate the flood impacts. The City provided a stockpile of sand and sandbags near the Ward’s Island ferry dock and crews and volunteers filled and placed the bags around low-lying residential areas. It soon became apparent that the small sandbags would be insufficient and metre sandbags were installed at key locations across the islands. By the end of the mitigation effort, over 40,000 small sandbags, and over 1,000 metre sandbags were placed across the islands. The City also deployed over 15 high-discharge trash pumps at key locations on the islands (mostly on Algonquin and Ward’s Islands) to lower surface water levels from high precipitation and saturated ground conditions. Municipal assets such as sewage pumping stations and electrical transformers were also sandbagged for protection and were under constant surveillance by City personnel. A map showing the locations of sandbags across Toronto Islands and a photograph showing typical conditions are provided in Figure 3.2 and Figure 3.3. Toronto Islands Flood Characterization and Risk Assessment Project Flood Risk Assessment Report 13017.101.R2.Rev0_FloodRisk Page 5
Figure 3.2: Map of Sandbag Locations during 2017 Flood

Figure 3.3: Photograph of Sandbags and High-Discharge Pump on Algonquin Island

Residents and business owners also took actions to mitigate the flooding effects on their properties and
businesses. Many installed sandbags around their properties or along the streets. Many people purchased
small pumps to drain their yards and crawlspaces or basements. Some dug trenches or swales on their
property to direct surface water to smaller pumps, or along streets to municipal pumps. Many homes and
businesses had saturated or flooded yards and placed wood planks, soil, or wood chips to raise the local grade
and to maintain access to their homes. These conditions and mitigation efforts are shown in Figure 3.4.

Toronto Islands Flood Characterization and Risk Assessment Project
Flood Risk Assessment Report

13017.101.R2.Rev0_FloodRisk                                                                           Page 6
Figure 3.4: Photographs of Flooded Yards in 2017 (from Toronto Star, 2017; and French, 2017)

The impacts of the flood were widespread and significant. Residential properties on Algonquin and Ward’s
Island were saturated for up to 4 months, causing flooding of crawlspaces, basements, and yards. The
damages reported by residents on the island included the appearance of mould in houses and crawlspaces,
damage to contents, damage to landscaping and structural damage to houses. For businesses on the islands,
damages were primarily due to disruption of business operations. Most of the island businesses rely heavily on
summer tourism and were strongly affected by the closure of ferry services. The following sections summarize
the impacts from information collected from public sources, and from survey questionnaires conducted by
Baird.

3.1        Residential Survey

Two previous surveys of the impacts of the 2017 flood on island residents were conducted in 2017 and late
2018. The first survey was completed by a group of island residents known as the Toronto Islands Emergency
Preparedness Committee. The results of the survey are available in the report prepared by the committee
(French, 2017). The second survey was administered by Dr. Greg Oulahen, an assistant professor in the
Department of Geography and Environmental Studies at Ryerson University. Dr. Oulahen provided a copy of
the questionnaire but results were not available to TRCA at the time of the current study.

Baird used the previous survey questions and results as a starting point to understand the challenges, impacts,
costs, and actions taken by the residents and the City in 2017. Thereafter, Baird and TRCA developed a
targeted questionnaire of the physical, financial, and health impacts on island residents in 2017.

A summary of the impacts and damages from the Toronto Islands Emergency Preparedness Committee report
is provided in Table 3.1. Although many homes experienced flooding of their yards and crawlspaces, the direct
damages were relatively low due to the shallow depth of flooding and experience gained from previous floods
(i.e. items not stored in crawlspaces). Conversely, the indirect damages were relatively high due to the long
duration of flooding and efforts to install and maintain barrier and pump systems. Intangible impacts included
health impacts (anxiety, physical injury), inconvenience, loss of use, and damage to trees and landscaping.

Toronto Islands Flood Characterization and Risk Assessment Project
Flood Risk Assessment Report

13017.101.R2.Rev0_FloodRisk                                                                            Page 7
Table 3.1: Summary of Residential Damages from 2017 Flood (adapted from French, 2017)

       Type of
                                                                 Summary
      Damages

                           •   Many homes experienced flooding in crawlspaces
                           •   Contents in homes that were stored in crawlspaces were damaged
                           •   Many homes had furnaces, ducts, HRV systems, hot water tanks, and other
                               essential building equipment damaged or destroyed
                Direct     •   Slow rise and fall of water table provided prolonged high humidity conditions in
                               crawlspaces; promoted mould growth
                           •   Vapour barrier and insulation in many crawlspaces destroyed
                           •   Some homes experienced damage to exterior finishes
                           •   Yard flooding restricted access and necessitated landscaping repairs
   Tangible

                           •   Many residents purchased and installed pumps in their crawlspaces and yards
                           •   Some residents purchased electric heaters because their furnaces were
                               damaged
                           •   Additional electricity costs due to pumps, heaters, fans, dehumidifiers, etc.
                           •   Additional costs due to health problems (medication, prescriptions, etc.)
                Indirect
                           •   Some residents dug swales or trenches to redirect surface water
                           •   Some residents purchased wood chips or soil to fill low areas and maintain
                               access to their homes
                           •   Costs were incurred for temporary housing on the mainland
                           •   Time off work

                           •   Restricted ferry services
                           •   Poor communication from authorities caused higher stress for residents
                           •   Limited access to amenities such as parks, associations, etc.
   Intangible

                           •   Minor injuries due to poor ground visibility, hoses criss-crossing properties
                           •   Elevated sense of helplessness, anxiety, stress, isolation
                           •   Trees and island aesthetics suffered
                           •   Limited access and usage of yards for weeks to months
                           •   Constant noise pollution due to high-discharge City pumps operating

The residential survey developed in this study was used to compare the impacts of the 2017 flood with the
estimated damages using the calculation procedures described in Chapter 4. The residents survey was divided
into three sections: physical impacts, financial impacts, and health impacts of the flood. The physical impacts
questions referred to the depth and duration of flooding the residents observed in their home and yard, and the
actions that were taken to mitigate flooding and flood damage. The financial impacts section included
questions concerning the monetary costs associated with mitigation measures, clean up, repairs, content
replacement, additional flood related expenses, and days off work due to flooding. The health impacts section
addressed the physical and mental health impacts experienced by residents during and after the flood.

Toronto Islands Flood Characterization and Risk Assessment Project
Flood Risk Assessment Report

13017.101.R2.Rev0_FloodRisk                                                                                    Page 8
The survey was distributed to each of the residents on December 6th, 2018. Ninety responses were received, corresponding to a response rate of approximately 35%. The survey results are presented in the following sections, and a copy of the survey is included in Appendix A. 3.1.1 Physical Damages The survey included questions about depth of water, duration of flooding, mitigation actions, physical damages, and time to return to normal. The number of respondents that reported first floor, basement/crawlspace, and yard flooding is shown in Figure 3.5. Thirty-three respondents experienced no flooding (empty circles), 7 respondents experienced only yard flooding, 18 respondents experienced only basement/crawlspace flooding, and 30 respondents experienced flooding in more than one area. Seven of the survey respondents experienced damage to their first floor such as floor warping. Figure 3.5: Summary of Flood Exposure of Residential Survey Respondents The depth of flooding from the 37 respondents that reported yard flooding is shown in Figure 3.6. The figure indicates that yard flooding was generally shallow, with only 3 respondents reporting a water depth greater than 0.3 m. The survey responses for crawlspace and basement flooding cannot be readily summarized as the responses were mixed (some surveys reported water depth and others reported the clearance below the floor joists). In general, water depths were less than 0.3 m and clearance below the floor joists was greater than 0.15 m. None of the respondents that identified damage to the first floor (such as floor warping), reported a depth of standing water. This suggests that damage was caused by moisture or capillary rise through the flooring. Toronto Islands Flood Characterization and Risk Assessment Project Flood Risk Assessment Report 13017.101.R2.Rev0_FloodRisk Page 9
Figure 3.6: Summary of Flood Depths in Yard for Residential Survey Respondents

The reported duration of flooding for the affected households is shown in Figure 3.7. The duration of yard
flooding was undefined or less than one month in 70% of responses. The duration of crawlspace or basement
flooding was longer, with about 25% of respondents reporting 1 to 2 months. One of the respondents indicated
a duration of 3 months for flood impacts to the first floor.

Figure 3.7: Summary of Flood Durations for Residential Survey Respondents

Residents were asked to identify damages to their home, contents, and yards. The responses are summarized
in Figure 3.8. A low percentage of respondents reported structural damages to the walls and floors of their

Toronto Islands Flood Characterization and Risk Assessment Project
Flood Risk Assessment Report

13017.101.R2.Rev0_FloodRisk                                                                        Page 10
homes. The most common damages were to landscaping/vegetation, contents in a crawlspace, and concerns
with mould.

Figure 3.8: Summary of Flood Damages of Residential Survey Respondents

Residents were asked to identify what they did to reduce the impact of flooding on their house and property.
The responses to this question are summarized in Figure 3.9. The most common mitigation actions included
using fans to dry out their home after the flood, moving items, and using pumps and sandbags.

Toronto Islands Flood Characterization and Risk Assessment Project
Flood Risk Assessment Report

13017.101.R2.Rev0_FloodRisk                                                                          Page 11
Figure 3.9: Summary of Mitigation Actions by Residential Survey Respondents

Lastly, residents were asked about recovery after the flood. Had their lives returned to normal, how long did it
take, and any outstanding items. All but two respondents indicated that their lives had returned to normal, with
time frames varying from weeks to one year. Several respondents indicated that they were concerned about
mould, and two respondents were undertaking repairs to their homes.

3.1.2      Financial Impacts

The financial impacts section of the survey was directed towards understanding the total costs incurred due to
the 2017 flood. Residents were asked to identify dollar and labour amounts spent on mitigation measures,
cleanup, repairs, content replacement, additional flood related expenses, and days off work due to flooding.

Mitigation and cleanup costs were difficult for many residents to quantify and total costs were typically between
$500 and $1,000. For homes that sustained structural damages, repair costs were between $1,000 and
$10,000, which reflected the costs to replace flooring, drywall, furnaces, etc. Interior contents damages were
zero for all but one response. Exterior contents damages were low, generally zero or a few hundred dollars.
Three respondents had exterior contents damage around $1,000 to $3,000 dollars (estimated) which involved
tree removal and landscaping. Few residents identified additional expenses such as hotels, meals, medication,
etc. Generally, the additional expenses were low (less than $300), with one respondent reporting medication
costs due to mould at $2,600 and another respondent renting an apartment in Toronto for 5 months.

The financial impacts were categorized into direct and indirect tangible damages and grouped by the
floodwater depth (relative to basement/crawlspace) reported by the respondents. This information is shown as
a box plot in Figure 3.10. Individual survey responses are shown as circles and the three horizontal lines in the
coloured columns denote the 25th, 50th (median), and 75th percentiles. The ‘x’ markers denote the average
damages for each category and the “whiskers” denote the range of expected data.

Toronto Islands Flood Characterization and Risk Assessment Project
Flood Risk Assessment Report

13017.101.R2.Rev0_FloodRisk                                                                             Page 12
Figure 3.10: Summary of Financial Damages Incurred by Residential Survey Respondents

The figure indicates that the average total damages were $900 for homes experiencing up to 0.1 m of flooding
(n=16); $2,100 for homes experiencing 0.1 m to 0.3 m of flooding (n=15); $3,200 for homes experiencing 0.3 m
to 0.6 m of flooding (n=13); and $500 for homes which had greater than 0.6 m of flooding (n=2). Indirect
damages were approximately 80% of the total damages for all flooding depths other than the 0.1 m to 0.3 m
category. The financial damages incurred by homes in this category were approximately 60% direct, 40%
indirect.

3.1.3      Health Impacts

Dealing with the mental and physical stresses during and after a flood can have lasting health impacts.
Residents reported minor to severe injuries and health impacts due to the flood including body aches and
strains, broken bones due to falls, and physical stress resulting from inability to use mobility aids due to road
flooding. More severe health impacts reported by respondents include pneumonia and breathing problems or
worsening allergies due to mould. Figure 3.11 summarizes the health impacts reported by respondents as a
result of the flooding. Anxiety and stress beyond normal were the most commonly identified health impacts,
followed by sore back or body, and sleeping difficulties. Residents were also asked if they have any ongoing
health issues that were caused by the flood. Six respondents identified allergies (mould or other), pneumonia,
and increased anxiety.

Toronto Islands Flood Characterization and Risk Assessment Project
Flood Risk Assessment Report

13017.101.R2.Rev0_FloodRisk                                                                              Page 13
Figure 3.11: Summary of Health Impacts Reported by Residential Survey Respondents

The third question asked residents to identify the causes of their anxiety. The most common responses were
not knowing how high the water was going to get, concern for others, and damage to their house and contents
(see Figure 3.12).

Figure 3.12: Summary of Causes of Anxiety Reported by Residential Survey Respondents

Toronto Islands Flood Characterization and Risk Assessment Project
Flood Risk Assessment Report

13017.101.R2.Rev0_FloodRisk                                                                        Page 14
The final two questions asked residents to identify the sources of the physical and social support they received.
The leading sources of physical support were City of Toronto PF&R, neighbours, TRCA, and friends/family.
The same sources were identified as providing high levels of social support, but in a different order with
neighbours and friends/family providing a higher level of social support than physical support (see Figure 3.13).

Figure 3.13: Summary of Sources of Support Reported by Residential Survey Respondents

3.2        Business Survey Results

A survey was distributed to the 22 businesses, clubs, and organizations operating on the islands on January
18th, 2019. The survey included questions about the business operating season, number of employees,
building information, and building contents. Questions pertaining to the 2017 flood impacts included floodwater
depths and physical impacts, business disruption, and expenditures. A copy of the survey is included in
Appendix B.

Baird called each of the businesses to confirm that they received the survey, answer questions, and listen to
concerns. About half of the businesses indicated that they will reply, one business was not interested, and
voicemail messages were left with the remaining businesses. The response rate from businesses has been
low, with only 3 businesses returning a survey (Island Café, Smiley’s B&B, and Toronto Island SUP).

The responses that were received, phone calls with the businesses, and other information indicate that the
primary impacts to the businesses were due to the closure of Toronto Island Park and restricted ferry services.
The uncertainty surrounding the length of the closure affected many businesses, as they did not know whether
they should keep or layoff staff. Some businesses expressed concerns that they may have lost some clients
permanently, as clients found new services and venues on the mainland. There was also confusion and
misinformation about visitor access to the islands, and clients of some businesses were turned away by ferry
staff. A list of the businesses and organization operating on Toronto Islands is provided in Table 3.2.

Toronto Islands Flood Characterization and Risk Assessment Project
Flood Risk Assessment Report

13017.101.R2.Rev0_FloodRisk                                                                             Page 15
Table 3.2: List of Businesses and Organizations Operating on Toronto Islands

             Type                                             Business or Organization

                                   Centreville Amusement Park, Electric Island, GWN Dragon Boat, Toronto
   Activities & Attractions
                                  Island Bicycle Rental, Toronto Island SUP, Toronto Longboat Roadrunners

                                  Algonquin Island Association, Artscape Gibraltar Point, Sunshine Centre for
         Community
                                       Seniors, Toronto Island Canoe Club, Ward’s Island Association

           Lodging                                Bay Window B&B, Nottawa B&B, Smiley's B&B

      Restaurants/Venues                            Island Café, Rectory Café, The Shaw House

                                    Island Yacht Club, Queen City Yacht Club, Royal Canadian Yacht Club,
         Yacht Clubs
                                              Toronto Island Marina, Toronto Island Sailing Club

3.3        City of Toronto Impacts

The 2017 flood caused considerable disruption to City activities and damages to City-owned assets and
infrastructure. The impacts were felt across different City departments and recovery efforts are ongoing. Baird
reviewed publicly available reports from the Department of Parks, Forestry and Recreation that estimated the
financial impacts and recommended actions to address the 2017 flood damages. Assessments of the
damages and repair costs are ongoing, and it is expected that the financial impacts will be refined in future
reports. Baird reached out to a number of key municipal contacts to develop a better understanding of the
impacts from the 2017 flood. These impacts are discussed below.

Toronto Parks, Forestry & Recreation

Baird discussed the impacts of the 2017 flood with Richard Ubbens (Director of Parks, Forestry & Recreation).
Mr. Ubbens provided the initial reports and estimated impacts that are discussed above.

Ferry Services

The Toronto Island ferry service carries over one million passengers and generates approximately $8M to
$10M in annual revenue for the City of Toronto. As previously mentioned, the ferry services to the island were
suspended from May 4th to July 30th. These services only remained available to residents of the islands and
authorized personnel. The City of Toronto (2017a) estimated that ridership dropped 90% over this 3-month
period compared to 2016. This resulted in an estimated revenue loss of approximately $4.5M from ticket sales
(City of Toronto, 2018a). The significant decrease in the number of visitors to the islands affected all of the
businesses on the islands.

Island Water Treatment Plant

Baird discussed the impacts of the flooding with Niall Robertson (Manager of the Island Water Treatment
Plant). When the flooding occurred, the access road was scheduled to be resurfaced and the works were
delayed until water levels subsided. The water treatment plant buildings suffered no damage, however staff
where not able to access the facility by road due to flooding. This required the treatment plant to hire a water
taxi to transport staff (and other persons) between the facility and Ward’s Island Ferry dock. The costs for the
water taxi were approximately $10,000. A photo of the loading dock at the Island Water Treatment Plant taken
on May 19, 2017 is shown in Figure 3.14.

Toronto Islands Flood Characterization and Risk Assessment Project
Flood Risk Assessment Report

13017.101.R2.Rev0_FloodRisk                                                                             Page 16
Figure 3.14: Photograph of Toronto Island Water Treatment Plant (May 19, 2017 by Niall Robertson) Toronto Fire Station #335 and EMS Station #48 Baird reached out to the Captain and Commander of the Island Fire Hall to obtain any information about their experiences during the 2017 flood. Baird did not received a response from the Island Fire Hall. Toronto Hydro Baird and TRCA discussed the impacts of the 2017 flood with Magda Sulzycki (Supervisor, Grid Emergency Management) and Paul Lopes (Engineer, Grid Emergency Management). The islands are served by two electrical system types. The Toronto Island Airport and Island Water Treatment Plant are serviced by a more modern, 13.8kV system that is comprised of underground equipment only. The remainder of the islands (including residential areas) are serviced by an older, 4.16kV system that is comprised of underground and overhead (pole-top) equipment. Both systems consist of submersible grade and non-submersible grade equipment. The main risk to the electrical infrastructure is to the underground, non-submersible equipment (e.g. pad- mounted equipment). This equipment is designed to be in areas that are not prone to flooding and is mounted above ground on cement pads. If flooding were to occur, water could come into contact with electrical components housed within the unit. This would cause a short circuit resulting in either a breaker or fuse operating to protect the equipment and/or damage the equipment. Toronto Hydro actively monitored the low-voltage system in 2017. If a similar flood situation were to arise in the future, Toronto Hydro could proactively de-energize the circuit to avoid equipment damage and potential public safety issues (e.g. fire or electrical tracking on the water). This measure would result in a loss of electricity to Toronto Islands Flood Characterization and Risk Assessment Project Flood Risk Assessment Report 13017.101.R2.Rev0_FloodRisk Page 17
everything downstream of the de-energized equipment. Further, restoring electricity could only occur after the
flooding has subsided, the equipment has been inspected for damage, and Toronto Hydro personnel have
determined it is safe to do so.

Toronto Water

Baird reached out to Maurice Balaski (Manager of Wastewater & Stormwater Pumping at the City of Toronto),
to inquire about any issues they faced during the 2017 flood. Baird did not receive a response regarding issues
encountered during the 2017 flood. However, geospatial data for the sanitary sewer network was provided and
has been included in the flood depth maps.

Emergency Response and Short-term Repairs

An extensive emergency response was undertaken by the City including deploying crews to install and
maintain mitigation measures (sandbags, high-discharge pumps, etc.), inspecting critical infrastructure,
communicating with residents, and monitoring public health impacts. Other expenditures resulting from the
flood included: staffing, supplies, contracted services, shoreline protection, and installation of ramps and
fenders at the Jack Layton Ferry Terminal to maintain ferry service during the high water period. The
emergency operations had an estimated cost of $2.45M, with an additional $1.3M extending into early 2018 to
address urgent health and safety issues (City of Toronto, 2018a).

The City and TRCA assessed the damages caused by the flood. The review identified 74 instances of damage
across the Toronto waterfront (e.g. structural damage, flooding, and erosion). Examples of the damages at
Toronto Islands include damage to the Centre Island Washroom & Bathing Station and Grandstand (see
Figure 3.15 and Figure 3.16). The City projected that $7.4M will be required to repair and protect damaged
infrastructure across the Toronto waterfront (e.g. install permanent pumping facilities on the islands, install
beach curbs at select locations to prevent shoreline degradation, etc.)

Figure 3.15: Photograph of Damage to Centre Island Washroom & Bathing Station (from City of
Toronto, 2018a)

Toronto Islands Flood Characterization and Risk Assessment Project
Flood Risk Assessment Report

13017.101.R2.Rev0_FloodRisk                                                                           Page 18
Figure 3.16: Photograph of Damage to Centre Island Grandstand (from City of Toronto, 2018a)

Long-term Repair & Resilience Measures
A significant amount of repairs and long-term resilience measures have yet to be implemented since the 2017
flood. Long term planning and coordination has occurred between the TRCA and the Chief Resilience Officer
to determine long-term repair and resilience strategies that will ensure Toronto Islands, and the waterfront as a
whole, are stewarded for future generations. These strategies have been prioritized to address health and
safety issues, protect City assets, stabilize shorelines, and ensure safe access to beaches across the islands
and entire waterfront. In order to address these issues, repair project estimates have been developed (City of
Toronto, 2018b) for consideration in the 2019 Capital Budget. These projects have been broadly grouped into
the following four categories:
•   Erosion control: required where the wind and wave action has resulted in the loss of land along the
    shoreline. In some instances, this type of loss of land also undermined trails, embankments and has
    created beach scours.
•   Shoreline Infrastructure: damaged infrastructure such as beach curbs and berms require restoration and
    repair to avoid future shoreline erosion.
•   Trails, Pathways and Boardwalks: compromised by high water levels and storm related wave action.
    Considerable repairs are required and in some cases, complete lengths of pathways, trails or boardwalks
    need to be replaced. In other places, the repairs consist of asphalt or concrete segment work
•   Asset Infrastructure: damage to waterfront buildings, bridges, and other structures occurred
    and have caused structural concerns which are in need of repair. This includes damage
    to footings, floors and concrete slabs and boat launches

Toronto Islands Flood Characterization and Risk Assessment Project
Flood Risk Assessment Report

13017.101.R2.Rev0_FloodRisk                                                                             Page 19
Of the comprehensive breakdown of capital costs associated with this repair program (provided in City of Toronto, 2018b), the following expenditures were proposed that are directly attributable to Toronto Islands: Immediate Projects (2019): • Toronto Island Flood Study ($0.15M) • Toronto Island Park and Centre Island Asset Infrastructure (portion of estimated $0.76M) • Ward’s Island Shoreline Infrastructure (portion of estimated $2.13M) • Toronto Island Park Trails, Pathways and Boardwalks (portion of estimated $2.64M) Short Term Projects (2020): • Centreville Erosion Control (portion of estimated $3.95M) • Toronto Island Park Asset Infrastructure (portion of estimated $2.55M) Medium Term Projects (2021-2022): • Toronto Island Park Asset Infrastructure ($1.5M) Permits, Tenants and Licences The City issues permits for a number of events and activities that take place on the islands each year. Nearly half of the permits were cancelled in the summer of 2017, with the remainder of the events relocated to the mainland or postponed (City of Toronto,2018b). Recreation programs that normally take place on the islands were also cancelled; this affected over 400 registrants in camps and speciality programs. The revenue loss related to the cancellation of these recreational programs, closure of the boathouse and tram is estimated to be $0.33M (City of Toronto, 2018a). The estimated total value of lost permitting revenue during the closure of Toronto Island Park was $0.11M. The City also leases buildings and property to 11 businesses and organizations on the islands. Considering that business operations were considerably affected by the closure of Toronto Island Park, a significant portion of the rental fees will likely be abated to these leaseholders and licencees. At the time of reporting, the portion of the abatement was still under discussion. Budgeted revenue from rents and licence fees for 2017 are approximately $1.4M (see Table 3.3). Toronto Islands Flood Characterization and Risk Assessment Project Flood Risk Assessment Report 13017.101.R2.Rev0_FloodRisk Page 20
You can also read