FACTORING CLIMATE RISK INTO FINANCIAL VALUATION - CLIMATE RISK MATRIX - Intact Centre ...
←
→
Page content transcription
If your browser does not render page correctly, please read the page content below

CLIMATE RISK MATRIX

FACTORING
CLIMATE
RISK
INTO
FINANCIAL
VALUATION

GENEROUSLY SUPPORTED BY:

                                       Dr. Blair Feltmate
                                       Natalia Moudrak
                                         Kathryn Bakos
                                         Brian Schofield

                                              March 2020
ABOUT THE INTACT CENTRE ON CLIMATE ADAPTATION                  annual premiums. The Company has approximately
The Intact Centre on Climate Adaptation (Intact Centre)        16,000 employees who serve more than five million
is an applied research centre at the University                personal, business and public sector clients through offices
of Waterloo. The Intact Centre was founded in 2015             in Canada and the U.S. In Canada, Intact distributes
with a gift from Intact Financial Corporation, Canada’s        insurance under the Intact Insurance brand through a
largest property and casualty insurer. The Intact Centre       wide network of brokers, including its wholly-owned
helps homeowners, communities and businesses to
                                                               subsidiary BrokerLink, and directly to consumers through
reduce risks associated with climate change and extreme
                                                               belairdirect. Frank Cowan brings a leading MGA platform
weather events. For additional information, visit:
                                                               to manufacture and distribute public entity insurance
www.intactcentreclimateadaptation.ca
                                                               products in Canada. In the U.S., OneBeacon Insurance
                                                               Group, a wholly-owned subsidiary, provides specialty
ABOUT THE UNIVERSITY OF WATERLOO
                                                               insurance products through independent agencies, brokers,
The University of Waterloo is Canada’s top innovation
university. With more than 41,000 full and part-time           wholesalers and managing general agencies.
students (Fall 2019), the university is home to the world’s
largest co-operative education system of its kind.             ACKNOWLEDGMENTS
The university’s unmatched entrepreneurial culture,            The Intact Centre thanks GRI, Scotiabank and IFC for
combined with an intensive focus on research, powers           their support of the report. We are grateful to Ernest
one of the top innovation hubs in the world. For               Wiebe who offered substantial insight into producing the
additional information, visit: www.uwaterloo.ca                list of key T&D climate risk and mitigation measures,
                                                               and to stakeholders across Canada who provided expert
ABOUT THE GLOBAL RISK INSTITUTE                                input to development of the T&D and CRE matrices.
The Global Risk Institute is the premier organization
that defines thought leadership in risk management for         CITATION
the financial industry globally. It brings together leaders    Feltmate, B., Moudrak, N., Bakos, K. and B. Schofield. 2020.
from industry, academia, and government to draw                Factoring Climate Risk into Financial Valuation. Prepared
actionable insights on emerging risks globally. For more
                                                               for the Global Risk Institute and Scotiabank. Intact Centre
information, visit: https://globalriskinstitute.org/
                                                               on Climate Adaptation, University of Waterloo.

ABOUT SCOTIABANK
Scotiabank is a leading bank in Canada and a leading
financial services provider in the Americas. We are            For information about this report, contact
here for every future. We help our customers, their families
and their communities achieve success through a broad          Kathryn Bakos: kathryn.bakos@uwaterloo.ca
range of advice, products and services, including personal
and commercial banking, wealth management and private
banking, corporate and investment banking, and capital
                                                               DISCLAIMER
markets. With a team of more than 100,000 employees
and assets of over $1 trillion (as at October 31, 2019),       The information stated in this report has, to the best of our
Scotiabank trades on the Toronto Stock Exchange (TSX:          knowledge, been collected and verified as much as possible. The
                                                               Intact Centre cannot make any guarantees of any kind, as to the
BNS) and New York Stock Exchange (NYSE: BNS). For
                                                               completeness, accuracy, suitability or reliability of the data provided
more information, please visit www.scotiabank.com and          in the report. This report has been prepared for general guidance on
follow us on Twitter @ScotiabankViews.                         matters of interest only and does not constitute professional advice.
                                                               You should not act upon the information contained in this publication
                                                               without obtaining specific professional advice. No representation
                                                               or warranty (express or implied) is given as to the accuracy or
ABOUT INTACT FINANCIAL CORPORATION
                                                               completeness of the information contained in this publication, and
Intact Financial Corporation (TSX:IFC) is the largest          Intact Centre employees and affiliates do not accept or assume any
provider of property and casualty (P&C) insurance in           liability, responsibility or duty of care for any consequences to you or
Canada and a leading provider of specialty insurance           anyone else acting, or refraining to act, in reliance on the information
in North America, with over $11 billion in total               contained in this report or for any decision based upon it.
TABLE OF
CONTENTS

                                              Executive Summary                                               p. 3

                                              Introduction                                                    p. 4

                                              Growing Cost of Climate Change                                  p. 6

                                              Method: Developing Climate Risk Matrices                        p. 8

                                              Results                                                         p. 9

                                              Climate Change, Extreme Weather Risk and Financial Valuation   p. 11

                                              CASE STUDY:                                                    p. 14
                                              Extreme Weather Impacts Applied To Financial Valuation

                                              Role of Subject Matter Experts                                 p. 18

                                              Beneficiaries of Climate Risk Matrices                         p. 19

                                                  • Securities Commissions                                   p. 19

                                                  • Credit Rating Agencies                                   p. 19

                                                  • Boards of Directors                                      p. 19

                                              Next Steps                                                     p. 20

                                              References                                                     p. 21

                                              Appendix                                                       p. 23

Factoring Climate Risk into Financial Valuation                                                                  1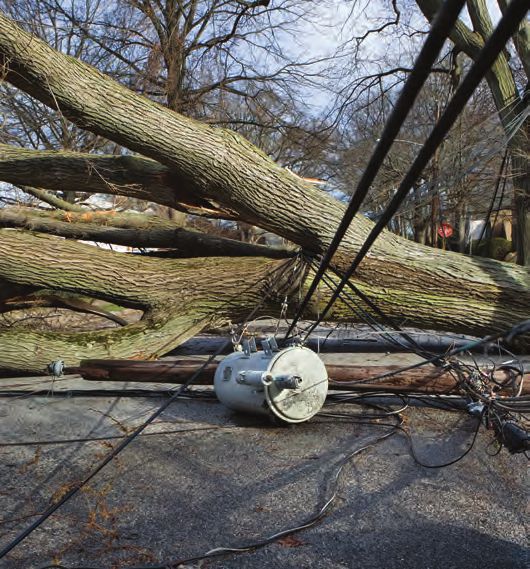
2 Factoring Climate Risk into Financial Valuation

“ The framework presented in this report provides a solid
                                  and practical way to assess and value physical climate
                                  risks, supporting improved disclosure and better pricing
                                                                                                    EXECUTIVE
                                  of climate risks.”

                                  Tiff Macklem
                                                                                                     SUMMARY
                                  Chair, Expert Panel on Sustainable Finance

The Task Force on Climate-Related Financial Disclosures (TCFD), and the Expert Panel
on Sustainable Finance (EPSF), both advised that climate change and extreme weather
risk should factor into institutional portfolio management. This paper offers a practical means to
execute on that advice, that conforms well with the risk management protocols that have become convention
since the financial crisis (2008).

Climate Risk Matrices, presented herein for two industry                        (4) Economic Value Added (EVA®), and (5) Option
sectors, identify the top 1-2 physical climate risk impacts                     Pricing Models. Utilizing these methods, a quantitative
that portfolio managers should prioritize as most                               case study is presented whereby climate risk impact on
material to affect performance of companies within                              share price is presented for a publicly traded issuer, thus
a given sector. These 1-2 impacts reflect the expert                            illustrating that so-called “non-financial” measures of
advice of operations officers or similarly experienced                          performance are predisposed to valuation.
subject matter experts within industry sectors – based
on their collective experience, these practitioners are                         Relative to next steps, all major industry sectors were
best positioned to identify a short list of material means                      reviewed (utilizing publicly available climate risk/
by which flood, drought, fire, wind, etc., may convey                           ESG reports) to determine which offer the greatest
risk to companies within a specific sector. Within this                         predisposition to develop additional industry-specific
paper, climate risk reflects the magnitude of an impact,                        Climate Risk Matrices going forward. Those sectors
juxtaposed to its probability of occurrence (which                              were determined to include (1) Materials, (2) Energy,
includes tail risk). Prioritized impacts presented within                       (3) Utilities, (4) Industrials, and (5) Real Estate (See
Climate Risk Matrices provide standardized guidance to                          Appendix 1).
portfolio managers, in user-friendly language, which can
                                                                                Although the utility of Climate Risk Matrices
be used to determine if, and how, issuers are mitigating
                                                                                discussed herein focuses on institutional investors, the
climate change and extreme weather risk satisfactorily.
                                                                                matrices offer value to securities commissions (to guide
Two Climate Risk Matrices – Electricity Transmission &                          expectations on climate risk related disclosure), credit
Distribution (T&D), and Commercial Real Estate (CRE)                            rating agencies (to identify a borrower’s key climate risk
– presented in this paper, illustrate the user-friendly and                     liabilities) and Boards of Directors (to set a framework
interpretable information that a portfolio manager would                        for Board members to ask appropriate climate risk
receive. The protocols used to develop both the T&D                             related questions of management).
and CRE Climate Risk Matrices are transferable to any
                                                                                Time is not a luxury in reference to applying climate risk
industry sector.
                                                                                to portfolio management. The development of industry-
Guidance is presented to help ensure that issuers profile                       specific Climate Risk Matrices offers an immediately
climate risk data, relative to each industry sector, in                         executable and practical means to incorporate climate
a manner that is readily predisposed to five common                             risk into portfolio management now, which in turn will
financial valuation methods: (1) Ratio Analysis, (2)                            drive GLOBAL preparedness to arrest the future impact
Discounted Cash Flow, (3) Rules of Thumb Valuation,                             of irreversible and largely debilitating climate change.

Factoring Climate Risk into Financial Valuation                                                                                               3
“ Climate change and extreme weather risks can represent
INTRODUCTION                        challenges for capital markets. This report provides practical
                                    guidance that will help the financial sector to better incorporate
                                    climate risk into financial valuation.”

                                    Brian Porter
                                    President and Chief Executive Officer, Scotiabank

                               >

 A warming climate (IPCC 2019) and                       and that the main cause of this warming is
 associated extreme weather risks (e.g., flood,          human influence. The observed warming
 drought, fire, hail, wind, extreme heat, storm          and other climate changes cannot be
 surge/sea level rise, permafrost loss) will             explained by natural factors, either internal
 be more challenging across Canada, and                  variations within the climate system or
 globally, as described in Canada’s Changing             natural external factors such as changes in
                                                         the sun’s brightness or volcanic eruptions.
 Climate report (ECCC 2019):
                                                         Only when human influences on climate are
 “There is overwhelming evidence that the                accounted for… can these observed changes
 Earth has warmed during the Industrial Era              in climate be explained.

  This warming is effectively
         irreversible.”                                                                                                               >

 4                                                                                         Factoring Climate Risk into Financial Valuation
In response to irreversible climate change, global industry sectors, will alleviate the dissatisfaction felt by
warming, and exacerbated extreme weather events, institutional investors regarding reporting relative to
many companies spanning most (if not all) industry climate risks. The framework prioritizes the top 1-2 means
sectors will suffer disruptions to the continuity of their by which each category of extreme weather (e.g., flood,
operations due to physical climate change induced fire, wind, etc.) may negatively impact each industry sector,
impacts (Krueger et al. 2019, Roman 2019, Macklem while simultaneously identifying the action that an investor
et al. 2019, TCFD 2018). When these disruptions are could expect a company to take to mitigate prioritized
material – for example, if an extreme weather event risks (including probable risk and tail risk). The framework
resulted in flooding that truncated supply chain, which of risk prioritization is profiled in an easily interpretable
subsequently impacted a company’s long-term cash flow industry-specific Climate Risk Matrix. Furthermore, by way
– fiduciary duty would require that this information be of a case study, the translation of extreme weather risk into
disclosed, as it could affect the decision of an investor to impact on share price is calculated using standard financial
buy/hold/sell stock in the company (Bank of Canada valuation methods.
2019, Giuzio et al. 2019, Tooze 2019).
Although the target audience for the Climate Risk
The fiduciary logic of the above scenario is straightforward Matrix is institutional investors, the matrix will also be
– however, there are practical limitations that prohibit
of value to securities commissions calling for material
corporations, spanning virtually all industry sectors, from
climate risk disclosure by issuers (e.g., CSA Staff Notice
disclosing climate-related risk that may be material to
51-358 2019). In Canada, it is within the mandate of
an investor. As articulated by Macklem et al. (2019) and
corporations to disclose climate risk, as directed by the
CSA (2019), the challenge is this:
Canadian Securities Administrators, beginning with
CSA Staff Notice 51-333, Environmental Reporting
“ Institutional investors are dissatisfied
Guidance (2010). Until the release of the Phase I
with the state of corporate climate-related Report of the Task Force on Climate-Related Financial
reporting in Canada, noting a general Disclosures (TCFD 2016), this notice did not draw
appropriate attention by issuers across Canada.
inability to determine whether non-
disclosure reflects legitimate immateriality The Climate Risk Matrix also offers utility to credit
rating agencies, under circumstances where extreme
or a lack of internal focus. Investors are
weather events might impact the capacity of a borrower
turning to third-party providers that face to repay a loan. As suggested by Tigue (2019):
the same information barriers, making
“Credit ratings, much like individual credit scores, assess
assurance difficult.” how likely it is that a borrower will repay debt. Those
Building on this observation, Krueger et al. (2019) ratings can affect how much governments and companies
highlight that despite growing empirical evidence that are able to borrow and how much it will cost them. Just
investors should consider climate stress, integrating the threat of a lower credit rating can pressure cities
climate risk into investment management can prove to and companies to be more proactive in taking steps to
be challenging, as investment tools and best practices mitigate risks, and now those risks are starting to include
are not yet well established. However, a few studies climate change.”
are beginning to record the direct financial impacts of
In sum, a concise encapsulation of industry-specific
extreme weather on valuation – for example, Addoum
climate change and extreme weather risks, presented in
et al. (2019) have shown that extreme temperatures can
standardized user-friendly form, would be of primary
adversely affect corporate earnings, and Kruttli et al.
benefit to aforementioned institutional investors,
(2019) document that extreme weather can be reflected
secondarily to securities commissions and credit rating
in stock and option market prices.
agencies, and to a growing extent Boards of Directors
The primary purpose of this paper is to present that need concise guidance on the physical manifestation
a protocol and framework that, if applied across of climate change risk.
Factoring Climate Risk into Financial Valuation 5In this study, two industry sectors – Electricity Transmission
& Distribution (“T&D”) and Commercial Real Estate > GROWING COST OF
(“CRE”) – are profiled to illustrate how climate change and
extreme weather risk can be incorporated into portfolio
CLIMATE CHANGE
management by institutional investors. T&D and CRE
were appropriate to serve as “model sectors”, based on The term “new normal” is often used to describe
three requisite criteria (TCFD 2019): weather that today is more extreme than was
commonplace prior to 2010 (Moore 2019) – however,
• Operational Impacts: T&D and CRE are experiencing caution should be exercised relative to this terminology,
substantial impacts due to climate change and extreme as it can instill a sense of complacency with institutional
weather events (e.g., Bienert 2016, Burillo 2018); investors that could unintentionally add risk to their
• Mitigation Actions: relative to T&D and CRE, investment decisions. Extreme weather, driven in concert
means to mitigate climate change and extreme weather with a changing climate, will continue to evolve and
risks are reasonably well understood (e.g., CSA 2019, become increasingly severe over time, thus generally
BOMA 2019); and rendering greater costs across industry sectors. Otherwise
stated, there will be nothing normal about the weather
• Geographical Range: climate change and extreme of the future (GCA 2019). Investors must, therefore, be
weather risks (e.g., flood, fire and wind) can impact T&D vigilant and cognizant of the increasing potential for
and CRE in virtually any populated region of Canada. severe weather to impact investments over time.
Before describing the framework to establish the Climate There is no better witness to the financial costs associated
Risk Matrix, it is necessary to first describe how climate with extreme weather than the Property and Casualty
risk will continue to become more severe, and thus of (“P&C”) insurance sector, where the impacts of a flood,
greater relevance to institutional investors and more fire, wind, etc., can be tallied almost instantly (Moudrak
broadly the capital markets. et al. 2017). Recognizing that the impact of extreme
6 Factoring Climate Risk into Financial Valuationweather would not be restricted to one area of business million or more in insurable losses), there is a discernable
(Bloomberg 2014), the P&C sector should be viewed upward trend in losses since 1983. Note that the losses
as a proxy for the growing cost of climate change that presented in the figure are normalized for inflation to
will impact, to varying degrees, most if not all industry $2018, and for per capita wealth accumulation – thus
sectors going forward. the horizontal axis presents a comparison of “apples to
apples”. The trend of increasing costs associated with
In Figure 1, which profiles annual catastrophic insurable extreme weather events should concern any investor
loss claims for Canada (i.e., a “cat loss” is any event as a predictor of growth in climate change risk that is
such as a flood, fire, hail storm, etc., that triggers $25 pervasive across industry sectors.
Figure 1: Catastrophic Insured Losses in Canada (1983 – 2018)
5.5
Loss & Loss Adjustment Expenses Fort McMurray Fire
5.0
Estimated Trend
4.5
4.0 Alberta & Toronto
Floods
3.5
Eastern
$CAD Billions
3.0 Ice Storm
2.5 Slave Lake
2.0 Ontario Fire
Quebec Wind & Rain
1.5 Floods
1.0
0.5
0.0
1983
1984
1985
1986
1987
1988
1989
1990
1991
1992
1993
1994
1995
1996
1997
1998
1999
2000
2001
2002
2003
2004
2005
2006
2007
2008
2009
2010
2011
2012
2013
2014
2015
2016
2017
2018
Source: IBC Facts Book, PCS, CatIQ , Swiss Re, Munich Re & Deloitte. Values in $2018 CAN; total losses are normalized by
inflation and per-capita wealth accumulation
As a cautionary note, the upward claims trend in Figure Financial Assistance Arrangements (DFAA) payments
1 is not solely due to escalations in extreme weather made by the Federal Government of Canada – these are
events. For example, compounding factors that can funds that are transferred from the federal to provincial
affect flood claims include loss of permeable areas and or territorial governments, principally to provide relief
natural habitats due to development (i.e., the loss of the when the costs associated with natural catastrophes
natural “sponge” capacity of wetlands and green spaces are exceptional. According to Public Safety Canada,
to absorb water/reduce flooding), aging municipal the number of natural disasters for which provinces
infrastructure and housing construction practices that
and territories were granted assistance under DFAA
did not incorporate flood-resilience considerations
increased nearly tenfold from 2005 – 2014 as compared
adequately in the past (Moudrak and Feltmate 2019).
to the previous decade. Going forward, the annual costs
Further evidence of the growing costs associated borne by DFAA will average $902 million, with $673
with extreme weather is evident in escalating Disaster million attributable to flood relief. The $902 million
Factoring Climate Risk into Financial Valuation 7projection is substantially in excess of the nominal DFAA western and northern regions of Canada, were engaged
program budget of $100 million (PBOC 2016). in the following generalized protocol to help create a
Climate Risk Matrix for each of T&D and CRE:
Escalating insurance claims, combined with substantial
increases in DFAA transfer payments, presage the 1) each expert was asked to identify physical climate
growing risk that climate change and extreme weather change risks/hazards they deemed to be most
will present to institutional investors. The discussion material to their business operation (e.g., flood, fire,
now turns to a practical means to prioritize risks in wind, etc.);
user-friendly format that managers may factor into
portfolio management. 2) each expert was asked to describe up to 5 ways in
which their operations could be impacted by each of
the identified hazards (e.g., service disruption, power
outage, equipment damage, etc.); and
3) experts were brought together for an in-person
> METHOD: DEVELOPING meeting to determine the most material hazards and
associated operational challenges impacting industry
CLIMATE RISK as a whole (accomplished vis-à-vis a voting exercise,
where only 2-3 operational challenges were allowed to
MATRICES be kept per hazard).
Once the climate change and extreme weather concerns
were established, subject matter experts performed three
The method to construct Climate Risk Matrices, for both additional tasks:
electricity T&D and CRE, is described below. Where the
1) identify what action, if any, could be reasonably taken
protocol applied to T&D vs. CRE varies, such differences
to limit the identified risk/hazard;
are described. The protocol applied to establish climate
risk for T&D and CRE would be applicable to virtually 2) provide a question the portfolio manager could
all industry sectors. present to a company or issuer to determine if the
issuer was aware of the risk; and
The method to establish a Climate Risk Matrix was
based on two axioms. First, that insight to identify and 3) provide direction as to what would constitute an
prioritize climate change and extreme weather risk “excellent response” or “good response” by the issuer
resides within the collective intelligence and consensus in reference to risk mitigation.
of operating officers, or similarly experienced senior
persons, who have worked in specific industry sectors Following the generalized protocol profiled above,
for an extended period of time (i.e., which in this study Climate Risk Matrices were completed for the T&D and
was deemed to be > 20 years of service). Second, that CRE sectors.
six-to-eight “subject matter experts”, each with at least In addition to subject matter input received from
20 years of experience, thus representing total “person experts in T&D, information was also drawn from
years of experience” of 120 - 160 years, would have NRC – CSA Group Canadian Electrical Code (CE Code),
collective insight to identify and prioritize physical Climate Change Adaptation Project (CSA Group 2019),
climate change risks, if any, relative to their respective and additional insight was received from Ernest Wiebe
industry sectors. (Innovative Solutions Engineering Inc., personal communication,
In this paper, there is also an assumption that the 2019). Similarly, input into CRE drew upon expert
manifestation of extreme weather would be in the advice from members of the Building Owners
direction of risk to an issuer, more so than benefit. Management Association (BOMA Canada), Real
Property Association of Canada (REALPAC), and
Based on the above criteria, subject matter experts, with Moudrak and Feltmate (2019).
at least one representative drawn from eastern, central,
8 Factoring Climate Risk into Financial Valuation> RESULTS
Material presented below has not been field tested
for ease of use/user-friendliness by multiple portfolio
managers – accordingly, direction in the tables is not
final, but rather penultimate (practitioner feedback
would fine tune future versions).
Table 1 considers climate risk from the perspective of
electricity T&D.
Table 1: Climate Risk Matrix - Electricity Transmission and Distribution (material highlighted in red reflects
prioritized areas of focus applied to portfolio management)
Flood Fire Wind Storm Ice and Snow Thawing Permafrost
Loading
Key Climate Flood-induced high Fire along Vegetation/tree T&D lines and Thawing/
Risk water levels result in transmission corridors branches can fall onto structures can discontinuous
Impacts inadequate electrical can cause outages T&D lines causing collapse under permafrost can
clearances below lines if corridors are not outages heavy ice loading displace transmission
that are hazardous to adequately clear of tower foundations,
the public brush T&D lines can be causing structural
brought down by wind collapses and outages
Vegetation/tree forces
contacts with
transmission lines
can cause arcing,
fires and outages
Mitigation Ensure structures Conduct patrols Clear vegetation along Install visual Modify structure/
Measures are tall enough for (visual inspection of transmission corridors monitors to detect designs to readily
safe clearance under utility equipment ice loading. Before permit adjustment
foreseeable flood and structures) in fire Install anti-galloping ice loads build, of towers when
levels, or lines are prone areas devices on conductors boost current to line patrols identify
installed underground and ensure structures melt ice (i.e., short permafrost thaw
Clear vegetation are designed to the line) displacement
along transmission withstand winds
corridors
Key What percentage of What percentage What percentage of Are overhead lines Are your transmission
Questions to T&D lines in flood- of total length total length overhead that are susceptible structures, in
Determine prone areas have of overhead Transmission lines to icing monitored discontinuous
Readiness sufficient clearance to transmission lines in treed areas are by cameras that permafrost areas, of
to Mitigate safely accommodate in wildfire-possible closer than 10 metres observe icing on a design where the
Climate Risk a 1:200 year flood areas are closer horizontally to tree the conductors? structured footings can
without de-energizing than 10 metres branches that are be adjusted without de-
the line? horizontally to tree higher than the energizing the line?
branches? conductors?
Excellent > 75% None < 5% Yes Yes
Answer
Good Answer 50% or higher < 10% < 25% Yes, the most recent
ones
Factoring Climate Risk into Financial Valuation 9Table 2 considers climate risk from the perspective of CRE.
Table 2: Climate Risk Matrix – Commercial Real Estate (material highlighted in red reflects prioritized areas of focus
applied to portfolio management)
Flood Fire Wind Storm Ice and Snow Thawing Permafrost
Loading
Key Climate Flooding can lead Wildfire can lead to High winds Snow and ice can Thawing permafrost
Risk to property damage, property damage, can loosen the accumulate on flat can lead to structural
Impacts potential for life potential for life perimeter flashing roofs, increasing building collapses
loss and business loss and business of the roof leading the risk of roof
disruption disruption to roof detachment collapses
or “peel off”
Property damage Smoke from wildfires As snow and ice melt
and business contains fine Windborne debris can on the roof, leaks can
continuity particulate matter and shatter windows cause water damage
disruptions gases such as carbon and mould
increase if critical monoxide and carbon Outdoor pipes and
equipment dioxide, which when pipes in unheated areas
is damaged concentrated impact such as basements,
or rendered respiratory health and garages and crawl
unworkable may aggravate pre- spaces can burst under
existing heart and lung extreme cold
conditions
Mitigation Emergency “Fire-resistant zone” Roof is reinforced Snow and ice is Building foundations
Measures Management Plan, is established within and additional proactively removed are strengthened with
including flood 10 metre perimeter of fasteners are applied from roofs piles, backfilled with
procedures, is tested property at the perimeter and Snow removal items coarse-grained soil
annually with operations corners are available (e.g., under the foundation
Roofs and gutters kept
staff and tenants free of combustible Impact-resistant glass heating cables and
Elevators are equipped materials, and is installed to prevent chemical deicers) and
with water sensors to openings and vents are shattering from debris snow/ice removal
automatically return to equipped with non- contractors are
higher floors if water is combustible screen secured
in the basement or the mesh Thermal imaging
underground parking HEPA/Activated cameras are installed
Critical equipment Carbon filters are to detect leaks and
such as HVAC, installed on HVAC prevent mould
electrical and system to cleanse air Outdoor pipes and
communication from wildfire smoke pipes in unheated
systems and server areas are insulated
rooms are elevated
above expected
flood levels. If not
feasible to elevate,
these systems are
wet flood-proofed
Key Are HVAC, Does HVAC system Is roof reinforced Is snow and ice Are measures present
Questions to electrical, have capacity to cleanse for severe wind proactively removed to limit damage
Determine communication air from smoke? around upper from roofs? where permafrost loss
Readiness systems and server perimeter and may affect structural
to Mitigate rooms elevated or corners? integrity?
Climate Risk otherwise flood
protected?
Excellent Yes Yes Yes Yes Yes
Answer
Good Answer > 50% of facilities > 50% of facilities in
high snowfall regions
10 Factoring Climate Risk into Financial ValuationAs is evident based on a review of Tables 1 and 2, that such data will be of value to financial analysts going
interpretation of climate change and extreme weather forward (Economist 2015). There is an important lesson
risks does not require depth of technical expertise. of admonishment in this regard, drawn from the area
Almost any large cap portfolio manager – with or of ESG and sustainability reporting which began in
without expertise in T&D and CRE – could utilize earnest starting about 2000, but that nonetheless remains
the information presented in both tables. problematic for financial analysts today (Paisley and
Nelson 2019).
In addition to the non-technical nature of information
in Tables 1 and 2, the short time-frame within which Amongst the first reports to document limitations in
a portfolio manager could review the table would be sustainability reporting was the sdEffect™ (NRTEE
advantageous. Under conditions whereby many portfolio 2006), which focused on calculating sustainability
managers are addressing climate risk analytics for the valuation utilizing such tools as Ratio Analysis,
first time, a readily accessible review would engage them Discounted Cash Flow (DCF), “Rules of Thumb”
more than a dense/time consuming process. valuations, Economic Value Added (EVA®) (Ehrbar
1998), and Option Pricing Models (OPM). The problem
Once portfolio managers and analysts appreciate in applying these various analyses was lack of data –
the risks associated with climate change and extreme reporting on sustainability practices by issuers tended
weather risks, the next point for consideration is how to be anecdotal and non-quantitative. When data was
that risk translates to impact financial valuation and available, it frequently lacked key information related to
share price performance – key considerations in this such simple measures as the timeframe over which data
regard follow below. applied, or the geographic range of operations under
consideration (WBCSD 2018).
To help ensure that climate change and extreme weather
data appear in industry specific reports in a form readily
predisposed to financial valuation, Table 3 provides high-
> CLIMATE CHANGE, level guidance to issuers.
EXTREME WEATHER
RISK AND FINANCIAL
VALUATION
Once climate change and extreme weather risks have
been identified, the question to consider from the
perspective of financial valuation is this – can these
non-financial measures be translated into impact on
share price? The short answer is yes, as illustrated in
this section and the next. However, there are some
precautionary steps to be taken to maximize translation
of risk into valuation.
More specifically, recognizing that Climate Risk Matrix
data will increasingly become available to investors by
corporations, either within Annual Reports, Annual
Information Form (AIF) filings, and/or voluntary
Environmental, Social and Corporate Governance (ESG)
Reports, it is critical to establish guidance now to ensure
Factoring Climate Risk into Financial Valuation 11Table 3: Guidance to Issuers, to Optimize the Utility of Climate Risk Reporting Relative to Five Financial Valuation Methods
Description of Financial Valuation Method For Consideration by Issuers - Key Climate Specific
Information Applicable to Valuation Method
Ratio Valuation of a company’s common equity price or the entire • Have earnings/cash flow been impacted by a climate
Analysis enterprise value is established as a ratio of measurable event – e.g., flood, fire, shoreline impact?
factors in a company’s operations such as:
• What was the financial impact on earnings/cash flow that
• Price/Earnings year/quarter?
• Price/Cash Flow • What is the probability of repeat impact (low, medium,
high) over the next 5 years?
• Price/Book Value of Equity
Sectors Predisposed to Ratio Analysis
Ratios are compared to peers to determine relative valuation
and likelihood that the company is over or undervalued. • Mining, Forestry, Petroleum, Utilities,
Telecommunications, Auto
These techniques are useful to establish relative valuation,
but less so to establish absolute valuation. Sectors Less Predisposed to Ratio Analysis
• Financials, Legal, Life & Health
Discounted Absolute valuation of a company is achieved through a • Have future cash flow projections been impacted
Cash Flow DCF analysis. DCF starts with a forecast of a company’s (negatively or positively), relative to initial value, by a
(DCF) future after-tax cash flows. These are adjusted to reflect climate change/extreme weather event?
capital expenditures necessary to sustain the business. This
stream of cash flows is then discounted back to the present • Is $ spread between current and future values increasing
time using a discount rate which reflects the risk adjusted or decreasing since climate event?
weighted average cost of capital of the company. The result
is an estimate of the total enterprise value of a company. • Have appropriate discount rates been selected –
accounting for risk of return – i.e., what is the likelihood
of repeat impact to risk variables?
Sectors Predisposed to DCF
• Well established companies with steady growth and
consistent levels of capital expenditures
• Defensive Industries: Utilities, Oil, Gas, Banking,
Telecommunications
Sectors Less Predisposed to DCF
• Small/start-up companies exposed to economic cycle
• Cyclical Industries: Raw Materials, Consumer
Discretionary
Rules of Many industries are valued using “rules of thumb” specific • Did business realize climate related impacts more/less
Thumb to their business. For example, in the electricity sector, the than peers?
Valuation frequency and duration of electricity outages is an industry
comparable. • Relative to peer group (industry association) what
precautions will ensure continuity of business operations?
• What aspects of operations are vulnerable to business
disruption relative to peers?
>
12 Factoring Climate Risk into Financial ValuationTable 3 Continued
Description of Financial Valuation Method For Consideration by Issuers - Key Climate Specific
Information Applicable to Valuation Method
Economic EVA® is the difference between a company’s net operating • Were positive returns realized following an extreme
Value Added profits and its total cost of invested capital over a given weather event?
(EVA®) time period. The capital charge is necessary to compensate
providers of debt and equity for use of their capital, at a • Have liabilities increased since the extreme weather event?
rate adequate for the risk incurred. If EVA® is positive, the – higher operating costs, lower profits?
company has created value. The market value of a company
is equivalent to its invested capital plus the sum of all future • Has debt/equity ratio increased/decreased for companies
EVA®. From this relationship, a company’s enterprise value that implemented adaptation measures?
can be determined from a forecast of its EVA®.
• Was average rate of return higher/lower compared to
peers after climate event?
Sectors Predisposed to EVA®
• Applies to asset-intensive companies/ industries that are
generally stable
• Utilities, Mining, Industrials
Sectors Less Predisposed to EVA®
• Applies to those with intangible assets
• Information Technology
Option Certain business activities create value for companies by • Have underlying assets been impacted due to an extreme
Pricing providing alternatives or choices for the future. These weather event?
Models choices or “options” do not necessarily have discrete cash
(OPM) flows but do provide tangible value for a company. Option • Has intrinsic value increased/decreased due to an extreme
pricing methods can be applied to these situations to weather event – i.e., is the strike price “in the money”?
provide a quantitative way to estimate and communicate the
economic value of these choices. The technique is also useful • After an extreme weather event, does extrinsic value
when uncertainty of outcomes exists and more than one (time value) exceed intrinsic value (financial advantage of
result is possible. exercising option)?
Sectors Predisposed to OPM
• High Option Value companies - high time values produce
significant stock price movements – i.e., high volatility
potentially generates higher returns
• Information Technology
Sectors Less Predisposed to OPM
• Low Option Value companies - falling time values
produce less movement in stock price - i.e., low volatility/
beta generate lower premiums
• Utilities, Energy, Banking
From the perspective of portfolio management, there is As climate risks transition from short to longer-term
no doubt that climate change and extreme weather risks adjustments on stock price, presumably the capital
can and should factor into business valuation. The rate markets will continue to pay increasing attention (TCFD
at which these risks are included in financial analyses 2019). The irreversibility of climate change effectively
will be affected by ongoing and more severe weather guarantees this realization (ECCC 2019) – i.e., it is not
impacting businesses spanning multiple industry sectors. a matter of “if ”, but rather “when”.
Factoring Climate Risk into Financial Valuation 13CASE STUDY:
Extreme Weather Impacts Applied
to Financial Valuation
Climate risks can impact revenues, costs and risk profiles of companies, generally
in a negative direction, causing earnings and cash flow to vary from expectations
with growing regularity.
In 2017, just over 15% of S&P 500 companies disclosed In 2018, the Climate Disclosure Program (CDP) – an
an impact on earnings from an unforeseen weather international not-for-profit that documents information
effect, but only 4% quantified the effect – for those that for investors, companies, cities, provinces, states and
did, the impact on earnings averaged 6% (S&P Global regions – completed an in-depth survey of TransAlta’s
2018). As argued by TCFD and the EPSF, the impact operations relative to climate change. In this survey,
of these variances should be identified, quantified and TransAlta disclosed that climate related impacts were
factored into corporate valuation, or simply, stock price. evaluated on a “six-month or more frequent” basis,
future impacts were projected beyond six years, and such
The value of a company is ultimately the present value impacts “are discussed at every quarterly board meeting”.
of the stream of cash flows that can be produced in the For TransAlta, climate related risks are substantive
future. In this regard, the three pertinent factors that financial risks as they have a direct and measurable
are relevant are the size of the cash flows, the timing impact on the expected production and distribution
of the cash flows and the risk associated with achieving of electricity from their various facilities. In particular,
those cash flows. Extreme weather – and preparation to “where we are unable to produce sufficient quantities
limit risk through the operationalization of adaptation – of output in relation to contractually specified volumes,
would have a direct impact on all three factors. we may be required to pay penalties or purchase
As mentioned, the impacts of climate risks are being replacement power in the market (TransAlta 2018).”
recognized by a small but growing number of companies In Example 1 (below), the impact on financial valuation
spanning a range of industry sectors (see Appendix 1), caused by incremental capital costs and expenses to
with disclosure in public documents improving to a level adapt to extreme weather is calculated. TransAlta
that translation of risk to stock valuations is possible. prepared for the likely impact that the increased
To demonstrate how climate risk can be valued as part of severity of weather events would have on their facilities,
overall stock price analysis, reference is made to TransAlta particularly from cyclones and floods, by increasing
Corporation (an electricity power generator and wholesale “sustaining and productivity capital” by $214 million in
marketing company headquartered in Calgary, Alberta, 2017.* These expenditures are required on a sustaining
Canada ) public disclosure material from 2018 and 2019. and routine basis and thus have been assumed to
TransAlta is on the leading edge of disclosure and continue each year for 5 years (although each year’s
provides detailed reviews of its operations and capital budget for this unique category will vary).
exposure to climate/weather risks. It is not surprising
that TransAlta focuses on these risks, as its production of
electricity from coal, gas and wind in Canada, USA and * Note: all TransAlta sustaining capital and productivity capital would not be
Australia is predisposed to extreme weather events. directed towards climate resilience.
14 Factoring Climate Risk into Financial ValuationEXAMPLE 1: VALUE OF SUSTAINING CAPITAL indicate that “a 1% increase or decrease in production
(MWh) has an approximate impact on net earnings
EXPENDITURES FOR EXTREME WEATHER of (+/-) $12 million.” In 2018, total net earnings at
PREPAREDNESS/CLIMATE RESILIENCE TransAlta was negative $90 million, indicating that a 1%
variance in power production would have a 13% impact
Event: Capital expenditures related to ensuring plants on earnings. Although the valuation of specific extreme
and operating facilities are available to meet market weather events will come later, the general impact of any
demand and are prepared for extreme weather elements. event causing a 1% impact on production is calculable.
These expenditures are pro-active and can-be-planned.
Translation: Additional capital investment and
expenses = $214 million per year commencing in 2017 EXAMPLE 2: VALUE OF AN EXTREME WEATHER
Valuation: EVENT THAT IMPACTS PRODUCTION BY 1%
Discounted Cash Flow Event: Any extreme weather event causing a 1% loss in
production
i) Cost of Capital – 7.65% (Jarvi and Primak 2019)
Translation: The impact of a 1% production loss is
ii) Cash Flow to be value = -$214 million/year over 5
+/- $12 million in net earnings
years (forecast)
Valuation:
iii) Present Value = PMT X [(1-(1/(1+r)n))/r]
Price/Cash Flow multiple
Where:
a) Given that TransAlta was not profitable in 2018,
PMT = the annual costs of Climate Resilience
assume that impacts on net earnings are effectively
expenditures
equivalent to a direct cash flow impact.
r = the discount rate
b) Price/Cash Flow (2018) = 6.5 X (Jarvi and Primak
n = the number of periods the costs will be incurred 2019)
(5 years)
c) Convert to Per Share valuation impact
Present Value = $862 million
Price impact = 6.5 X $12 million/shares outstanding
iv) Convert to Per Share Valuation
= $72 million/287 million
Shares outstanding in 2017 = 288 million
= $0.25 per share
Per share valuation impact = $862 million/
Conclusion: A 1% variance in production can impact
288 million
the share price valuation by $0.25 per share. Given that
= $3.00 per share the average price of TransAlta stock in 2018 was $6.98,
(rounded) this translates to a 3.6% impact on stock value.
v) Conclusion: The capital expenditures and costs Extreme weather impacts on TransAlta are acutely
associated with extreme weather preparedness impactful on electricity production and pricing when
has up to a $3.00 per share negative impact on they occur unexpectedly. For example, in 2019,
stock price. Furthermore, even if the expenditures Canadian coal and wind assets “benefited from higher
incurred in 2017 were “one-time” only, the impact power prices…reflecting the impact of extreme cold
would be $0.74 per share. weather during the first quarter of 2019.”
TransAlta has provided guidance regarding the impact
of lost production on net earnings (CDP 2018). They
Factoring Climate Risk into Financial Valuation 15For the first half of 2019, average electricity prices EXAMPLE 3: VALUE OF UNEXPECTED EXTREME
increased to $63 per MWh from $45 per MWh in 2018.*
COLD WEATHER IN THE FIRST HALF OF 2019
The positive impact on earnings before interest, tax,
depreciation and amortization (EBITDA) from this Event: Extreme cold weather in North America in 2019
increased pricing was estimated at approximately $100 Translation: The net effect of positive and negative
million. Using the methodology of Example 2, it can cash flow impacts estimated by the company at -$33
be estimated that the extreme cold of 2019 impacted million.
TransAlta by over $2.00 per share.
Valuation:
The extreme cold of the winter of 2019, however, did
Price/Cash Flow multiple
not just provide an opportunity for elevated electricity
pricing. TransAlta’s US Coal team experienced “a tail a) Price/Cash Flow (2019) = 7.0 X (Jarvi and Primak
event” due to “cold weather and strong demand in 2019)
the Pacific Northwest from extremely high natural gas
b) Convert to Per Share valuation impact
prices” (caused by pipeline constraints in part linked
to extreme weather). “The Company incurred cash Price impact = 7.0 X - $33 million/shares
losses of $25 million on its day ahead hedging position outstanding
(TransAlta 2019).”
= -$231 million/282 million
The “tail event” resulted in EBITDA being down $35
= $0.82 per share
million compared to 2018. Combining all impacts
(positive and negative) of the extreme cold, the first Conclusion: The extreme cold weather of 2019 has
half of 2019 produced free cash flow that was “$33 had an impact on share price valuation of $0.82 per
million lower … for six months ending June 30, share – relative to a share price of TransAlta (November
2019 … compared with the same period in 2018” 2019) of $8.49, this is equivalent to a 10% impact on
(TransAlta 2019). share valuation.
Overall, extreme weather has impacted TransAlta’s share
price through both predictable preparedness costs and
through volatility caused by operational disruptions – as
illustrated, each of these isolated effects can be valued
individually using conventional valuation methods.
In the previous examples, we demonstrated numerically
how investment in extreme weather preparedness, or
response to extreme weather events, has direct and
measurable impact on share valuation. Even more
meaningful is recognizing that not only is climate
change altering the current risk profile of entire business
operations, but it will continue to do so in the future. In
other words, the predictability of future cash flows will
have diminished and increasing volatility that should be
valued into the overall investment merits of companies.
The increase in risk has a large and quantifiable impact
on the value of future cash flows. The Discounted Cash
Flow (“DCF”) method calculates present value of future
cash flows that a business produces. This is based upon a
* Note: higher power prices in 2019 vs. H1 2018 may have been affected by
discount rate determined from cost of capital inputs and
cold weather and additional factors risk profile of the company.
16 Factoring Climate Risk into Financial ValuationPrevious examples demonstrate that individual extreme WACC new = 11.03% X 52% + 5.75% X 38% +
weather events can impact share valuation by 5-10% 5.75% X 10%
on a case-by-case basis. Therefore it is reasonable to
assume that Beta, cash flow volatility compared to the WACC new = 8.50%
overall market or a diversified portfolio, should likely be c) Calculate DCF Valuation for increased WACC
increased by 5-10% to represent a recognition of the
new risk profile. i. PV of 10 Years Cash Flows new = $3,827 million
ii. PV of Terminal Value new
= [FCF 10th year X (1 + g) / (WACC new – g)] /
EXAMPLE 4: VALUATION IMPACT ON (1 + WACC new)10
TRANSALTA’S OVERALL BUSINESS DUE TO
where;
INCREASED RISK
FCF 10th year = final year cash flow from step i)
Event: Overall current and future occurrences of
extreme weather on cash flows. g = terminal growth rate = 0.83%
Translation: The impact of a 7.5% increase in Beta PV of Terminal Value new = $3,254
(mid-point of 5-10%) of TransAlta’s overall DCF
DCF Valuation new = value from i) + value from ii)
calculation.
= $3,827 million + $3,254
Valuation: a) Adjust Cost of Equity to reflect increased
million
risk
= $7,081 million
Cost of Equity = Rf + β (Rm - Rf)
1) Calculate Share Price
Rf = Risk free rate = 3.50%
NPV to Common Equity = DCF – Debt – Pref –
(Rm - Rf) = Market risk premium = 7.00%
Minority Interest
β = unsystematic risk = 1.0 (current)
NPV to Common Equity = $7,081 – 2,669 – 942 –
(all values from Jarvi and Primak 2019)
1,610
β new = unsystematic risk with extreme
Common Equity = $1,860 million
weather adjustment
Per Share Value new = $6.62
β new = 1.0 * (1.075)
Previous DCF Share value = $9.64
β new = 1.075
Conclusion: The overall inclusion of extreme weather
Cost of Equity (current) = 10.50%
risk in the DCF Valuation of TransAlta reduces the stock
Cost of Equity (new) = 3.5% + 1.075 (7.0%) value estimate from $9.64 per share to $6.62 per share.
= 11.03%
The discussion now turns to the need to identify climate
b) Calculate new Weighted Average Cost of Capital change and extreme weather impacts that may affect
with new Cost of Equity financial valuation, as informed by industry specific
subject matter experts.
WACC new = Cost of Equity new X Equity Weight +
Cost of Debt X Debt Weight + Cost of Preferred Shares
X Preferred Share Weight
Factoring Climate Risk into Financial Valuation 17> ROLE OF SUBJECT analysts if recommendations by TCFD (2019) and
Macklem et al. (2019) are to become commonplace. It is in
MATTER EXPERTS the interest of industry sectors to contribute their expertise
to risk identification, as financial specialists, left on their
own with limited operational experience, can easily end
up chasing the wrong “climate risk rabbit”.
Subject matter experts, who generally reside within
industry associations, are key to advancing the There is a fortuitous predisposition within industry sectors
inclusion of climate change and extreme weather risk that could lead to the creation of Climate Risk Matrices
into institutional portfolio management. Material risks are with relative ease. When industry associations meet,
best identified by industry members with “on the ground” annually or bi-annually, they could create “climate risk
experience – these are professionals with decades of field committees” to create Climate Risk Matrices similar to
experience on an individual basis, and hundreds of years Tables 1 and 2 (see pages 9 and 10).
of experience collectively. Subject matter experts, although Within many industry sectors, climate related information
not infallible, can draw upon their experience, with insight is publicly available through industry associations and/or
unmatched through any other means, to identity material professional associations. For those sectors that have a high
expressions of how flood, fire, ice loading, wind, etc. affect percentage of associations reporting on climate change,
business operations/continuity. they may be prime candidates to pursue the creation of
Climate Risk Matrices (e.g., as per Appendix 1, these
As climate change continues to affect virtually all business
include: Materials – 100%; Energy – 100%; Utilities –
sectors, it would be prudent for industry associations
87%; Industrials – 67%; Real Estate – 63%).
to engage their membership to develop Climate Risk
Matrices – subsequently, as this information becomes A solid foundation for industry sectors to develop Climate
available, financial analysts could utilize this information. Risk Matrices has been established in some spheres: for
Subject matter experts from across industry sectors must example, the chemical sector (WBCSD – Chemical 2019)
work hand-in-hand with the capital markets/financial and electric utilities (WBCSD – Electric 2019).
18 Factoring Climate Risk into Financial Valuation> BENEFICIARIES 2019). This acquisition signifies a meaningful step toward
financial institutions committing to the realization that
OF CLIMATE RISK climate risk should enter into any evaluation of the
financial strength of any government or company and
MATRICES their ability to repay debt.
Access to Climate Risk Matrices would help inform
credit rating agencies such as Moody’s, Standard &
Beyond the utility that Climate Risk Matrices would Poor’s, DBRS and Fitch Ratings (Tigue 2019).
convey to institutional investors, other stakeholders
would also benefit from climate change and extreme Boards of Directors: From the perspective of
weather risk guidance. fiduciary oversight, it is incumbent upon Boards to
ensure that management is directing appropriate
Securities Commissions: Relative to enforcement attention to climate change and extreme weather
of a “comply-or-explain” mandate for issuers reporting risk (CPA 2017, Wylnco and Musulin 2019, Geneva
on climate risk (sensu Macklem et al. 2019), securities Association 2019). Upon recognition of risk that may be
commissions have limited guidance as to what would material, a Board must be satisfied that management is
constitute acceptable disclosure, per industry sector, appropriately engaged to address that risk. The difficulty
relative to multiple forms of climate impact (Evain et for Boards in executing on this direction may be a
al. 2018). combination of (a) the appropriate expertise may not
Climate Risk Matrices would provide securities exist amongst Board members to assess climate-related
commissions with a prioritized baseline of acceptable risk, and/or (b) Boards not having appropriate guidance
industry-specific climate risk disclosure – i.e., the that would enable them to ask the appropriate questions
“explain” part of comply-or-explain – that would help of management in reference to climate related risk.
to empower commissions to enforce their mandate. Boards could hire expertise to gain insight into risk, but
even that expertise may be nascent or poorly informed
Credit Rating Agencies: The impacts of climate (Tooze 2019, Geretto and Jacques-Brissette 2019).
change and extreme weather risk could affect a
borrower’s capacity to repay a lender (Moody’s 2017, Climate Risk Matrices could fill this risk awareness
Tigue 2019). As such, credit rating agencies should void by concisely conveying to Board members, in
incorporate climate risk into credit rating assignments. user-friendly format, material risks pertaining to
Growing recognition of the importance of climate climate change and extreme weather that could inform
risk to credit rating agencies is reflected in Moody’s a dialogue with management. By simply asking well
Corporation purchasing a controlling stake in Four informed questions to management on the subject
Twenty Seven, a California-based company that of climate risk, Boards would signal that they attach
measures a range of hazards, including extreme rainfall, importance to the issue, and they would demonstrate
hurricanes, heat stress and sea level rise, and tracks their due diligence that could serve them well if a material
impact on 2,000 companies and 196 countries (Flavelle risk were to manifest itself (Wylynko and Musulin 2019).
“ Climate Risk Matrices could fill a risk awareness void by concisely conveying to
Board members, in user-friendly format, material risks pertaining to climate
change and extreme weather that could inform a dialogue with management.”
Factoring Climate Risk into Financial Valuation 19You can also read