The science of climate change - questions and answers - Australian Academy of Science

Page created by Tommy Webster
 
CONTINUE READING
The science of climate change - questions and answers - Australian Academy of Science
The science of climate change
questions and answers
february 2015
The science of climate change - questions and answers - Australian Academy of Science
page    contents

  3     Foreword
  4     Summary
  6     Q1: What is climate change?
  8     Q2: How has climate changed?
 12     Q3: Are human activities causing climate change?
 16     Q4: How do we expect climate to evolve in the future?
 20     Q5: How are extreme events changing?
 22     Q6: How are sea levels changing?
 24     Q7: What are the impacts of climate change?
 28     Q8: What are the uncertainties and their implications?
 30     Q9: What does science say about options to address climate change?

 For a version with full references visit
 www.science.org.au/climatechange
 Published by the Australian Academy of Science
 ISBN 978 0 85847 413 0
 Please cite “The science of climate change: Questions and answers”,
 Australian Academy of Science, Canberra, 2015
 www.science.org.au/climatechange
 Cover: Wollongong Harbour, NSW. Photo: Robert Montgomery

 2 | The science of climate change
The science of climate change - questions and answers - Australian Academy of Science
Foreword

                                          The purpose of this booklet is to provide an understanding, based on our        As in all areas of active science, uncertainties remain. However, enormous
                                          present scientific knowledge, of some key questions about climate change.       scientific progress has been made in our understanding of climate change
                                          It is an extensively revised update of a similarly titled Academy publication   and its causes and implications. Since 2010, the IPCC has prepared a new
                                          in 2010 that summarised the state of knowledge at that time. It has been        international assessment with the active involvement of many Australian
                                          prepared by a broadly-based Working Group of Australian climate scientists      researchers, including several members of the Academy Working Group. This
                                          with review and guidance provided by an Oversight Committee composed of         Q&A update is thus well informed by recent international developments in the
                                          Academy Fellows and the former Chair of the Academy’s National Committee        science as well as the most recent work by our own scientists on peculiarly
                                          for Earth System Science.                                                       Australian aspects of the climate change problem.
                                          Along with its sister Academies, the Australian Academy of Science has played   As the summary states, ‘Societies, including Australia, face choices about how
                                          an active role in assessing the science of climate change since the 1970s.      to respond to the consequences of future climate change.’ It is incumbent on
                                          The Academy recognises the role of the Intergovernmental Panel on Climate       society to consider these choices.
                                          Change (IPCC) as the mechanism for the international scientific assessment of   I wish to thank all the members of the Working Group and Oversight
                                          climate change science, impacts and response strategies. However, it believes   Committee (whose names are listed on the back cover) for their painstaking
                                          that it is important that Australian climate scientists explain the science,    work in the preparation of this update. I also acknowledge the assistance
                                          including its uncertainties and implications, to the Australian community in    of the reviewers and others who helped with this update. The Academy is
                                          simpler terms than can be found in most of the IPCC reports.                    especially grateful to the Department of the Environment, which provided the
                                          The Working Group who prepared this update was led by Professor Michael         financial support for the preparation and publication of this document.
                                          Raupach FAA FTSE and Dr Ian Allison AO with special support, in the later       On behalf of the Academy, I am pleased to commend the information in the
                                          stages, from Professor Steven Sherwood. The views presented in the answers      following pages to all those who are looking for authoritative answers to the
                                          to the nine key questions were carefully reviewed by an Oversight Committee     key questions we are all asking about the science of climate change.
                                          and 12 independent climate scientists* who agreed to help with the
                                          preparation of this document. The role of the Oversight Committee was to        Andrew Holmes AM PresAA FRS FTSE
                                          make sure that all reasonable review comments were properly considered by       President
                                          the Working Group in preparing their final text. While the reviewers provided   Australian Academy of Science
                                          more than 600 individual comments on the penultimate draft, neither they
                                          nor the Oversight Committee are responsible for the final wording of the
                                          detailed answers that represent the views of the expert members of the
                                          Working Group.
                                          Nevertheless the summary on pages 4 and 5 represents the fully agreed           *In addition to multi-stage review carried out by the Oversight Committee, the penultimate
left: An image from space of the cloud
patterns associated with a mid-latitude
                                          views of both the Oversight Committee and the Working Group. It has been        draft of this document was reviewed by Dr G Ayers FTSE, Dr I G Enting, Professor D Griggs
cyclone off southwest Australia.          endorsed by the Academy as a balanced, objective and authoritative summary      FTSE, Professor D Karoly, Mr WR Kininmonth, Professor M J Manton FTSE, Dr K G McCracken
Photo: NASA                               of the current state of knowledge of the science of climate change.             AO FAA FTSE, Professor N Nicholls, Dr N Smith FTSE and three anonymous reviewers.

                                                                                                                                                                                      The science of climate change | 3
The science of climate change - questions and answers - Australian Academy of Science
Earth’s climate has changed over the past century. The
                                    atmosphere and oceans have warmed, sea levels have risen,
                                    and glaciers and ice sheets have decreased in size. The best
                                    available evidence indicates that greenhouse gas emissions
                                    from human activities are the main cause. Continuing increases

Summary
                                    in greenhouse gases will produce further warming and other
                                    changes in Earth’s physical environment and ecosystems.
                                    The science behind these statements       >> Measurements from the recent
                                    is supported by extensive studies            past (the last 150 years) tell us
                                    based on four main lines of evidence:        that Earth’s surface has warmed
                                    >> Physical principles established           as atmospheric concentrations
                                       more than a century ago tell              of greenhouse gases increased
                                       us that certain trace gases               through human activities, and
                                       in the atmosphere, such as                that this warming has led to
                                       carbon dioxide (CO2) and water            other environmental changes.
                                       vapour, restrict the radiant flow         Although climate varies from
                                       of heat from Earth to space.              decade to decade, the overall
                                       This mechanism, known as the              upward trend of average global
                                       ‘greenhouse effect’, keeps Earth’s        surface temperature over the last
                                       surface and lower atmosphere              century is clear.
                                       considerably warmer than they          >> Climate models allow us
                                       would otherwise be. The gases             to understand the causes of
                                       involved are called ‘greenhouse           past climate changes, and to
                                       gases’. An increase in greenhouse         project climate change into the
                                       gas concentrations raises the             future. Together with physical
                                       temperature of the surface.               principles and knowledge of
                                    >> The record of the distant                 past variations, models provide
                                       past (millions of years) tells us         compelling evidence that recent
                                       that climate has varied greatly           changes are due to increased
                                       through Earth’s history. It has, for      greenhouse gas concentrations
                                       example, gone through ten major           in the atmosphere. They tell
                                       ice age cycles over approximately         us that, unless greenhouse
                                       the past million years. Over the          gas emissions are reduced
                                       last few thousand years of this           greatly and greenhouse gas
                                       period, during which civilisations        concentrations are stabilised,
                                       developed, climate was unusually          greenhouse warming will
                                       stable. Evidence from the past            continue to increase.
                                       confirms that climate can be           This document aims to summarise
                                       sensitive to small persistent          and clarify the current scientific
                                       changes, such as variations in         understanding of climate change
                                       Earth’s orbit.                         by answering nine key questions.

4 | The science of climate change
The science of climate change - questions and answers - Australian Academy of Science
1 What is climate change?               3 Are human activities causing            5 How are extreme events                 8 What are the uncertainties
                                        The term ‘climate’, in its broadest     climate change?                           changing?                                and their implications?
                                        sense, refers to a statistical          Human activities are increasing           Since the mid-20th century, climate      There is near-unanimous agreement
                                        description of weather and of           greenhouse gas concentrations             change has resulted in increases in      among climate scientists that
                                        the related conditions of oceans,       in the atmosphere. This increase          the frequency and intensity of very      human-caused global warming is
                                        land surfaces and ice sheets. This      is extremely likely to have caused        hot days and decreases in very cold      real. However, future climate change
                                        includes consideration of averages,     most of the recent observed global        days. These trends will continue with    and its effects are hard to predict
                                        variability and extremes. Climate       warming, with CO2 being the largest       further global warming. Heavy rainfall   accurately or in detail, especially
                                        change is an alteration in the          contributor. Some observed changes        events have intensified over most        at regional and local levels. Many
                                        pattern of climate over a long          in Australia’s climate, including         land areas and will likely continue to   factors prevent more accurate
                                        period of time, and may be due to a     warming throughout the continent          do so, but changes are expected to       predictions, and some uncertainty is
                                        combination of natural and human-       and drying trends in the southwest,       vary by region.                          likely to remain for considerable time.
                                        induced causes.                         have been linked to rising                                                         Uncertainty in climate science is no
                                                                                greenhouse gas concentrations.            6 How are sea levels changing?           greater than in other areas where
                                        2 How has climate changed?                                                        Sea levels have risen during the         policy decisions are routinely taken to
                                        Global climate has varied greatly       4 How do we expect climate                20th century. The two major              minimise risk. Also, the uncertainty
                                        throughout Earth’s history. In the      to evolve in the future?                  contributing factors are the             means that the magnitude of future
                                        final decades of the 20th century,      If greenhouse gas emissions               expansion of sea water as it warms,      climate change could be either
                                        the world experienced a rate of         continue to grow rapidly, it is           and the loss of ice from glaciers. Sea   greater or less than present-day
                                        warming that is unprecedented for       expected that, by 2100, the global        levels are very likely to rise more      best estimates.
                                        thousands of years, as far as we        average air temperature over              quickly during the 21st century than
                                        can tell from the available evidence.   the Earth’s surface will warm by          the 20th century, and will continue to   9 What does science say
                                                                                around 4°C above mid-19th century         rise for many centuries.
                                                                                                                                                                   about options to address
                                        Global average temperature rise has
                                                                                temperatures. There are many
                                                                                                                                                                   climate change?
                                        been accompanied by ongoing rises
                                        in ocean temperatures, ocean heat       likely ramifications of this warming.     7 What are the impacts                   Societies, including Australia, face
                                        storage, sea levels and atmospheric     However, if emissions are reduced         of climate change?                       choices about how to respond to
                                        water vapour. There has also been       sufficiently rapidly, there is a chance   Climate change has impacts on            the consequences of future climate
                                        shrinkage in the size of ice sheets     that global average warming will not      ecosystems, coastal systems, fire        change. Available strategies include
                                        and most glaciers. The recent           exceed 2°C and other impacts will         regimes, food and water security,        reducing emissions, capturing CO2,
                                        slowdown in the rate of surface         be limited.                               health, infrastructure and human         adaptation and ‘geoengineering’.
                                        warming is mainly due to climate                                                  security. Impacts on ecosystems          These strategies, which can be
                                        variability that has redistributed                                                and societies are already occurring      combined to some extent, carry
                                        heat in the ocean, causing warming                                                around the world, including in           different levels of environmental risk
                                        at depth and cooling of surface                                                   Australia. The impacts will vary from    and different societal consequences.
                                        waters. Australia’s climate has                                                   one region to another and, in the        The role of climate science is to
                                        warmed along with the global                                                      short term, can be both positive and     inform decisions by providing the
                                        average warming.                                                                  negative. In the future, the impacts     best possible knowledge of climate
                                                                                                                          of climate change will intensify         outcomes and the consequences of
                                                                                                                          and interact with other stresses.        alternative courses of action.
                                                                                                                          If greenhouse gas emissions
facing page: People flocked to the
                                                                                                                          continue to be high, it is likely that
beach for respite one evening during
Melbourne’s record breaking four-day                                                                                      the human-induced component
heatwave in January 2014, under a sky                                                                                     of climate change will exceed the
made hazy by smoke from a scrub fire.                                                                                     capacity of some countries to adapt.
Photo: Neil O’Connor

                                                                                                                                                                            The science of climate change | 5
The science of climate change - questions and answers - Australian Academy of Science
Q1                                                                                                                         left: Meteorological variables such as
                                                                                                                             wind, temperature and humidity are
                                                                                                                                                                       space. This is called the ‘greenhouse
                                                                                                                                                                       effect’, and the gases that cause
                                                                                                                             measured by instruments attached to       it by interacting with infrared
                                                                                                                             balloons and relayed by radio to ground   radiation are called greenhouse
                                                                                                                             stations on land or on ships.             gases. The most important are water
                                                                                                                             Photo: Kyle D. Gahlau
                                                                                                                                                                       vapour, carbon dioxide (CO2) and

What is climate change?                                                                                                      by long-term influences that are
                                                                                                                             known or predictable (Box 1.1).
                                                                                                                                                                       methane. The greenhouse effect was
                                                                                                                                                                       identified more than a century ago;
                                                                                                                                                                       Earth’s surface would be about
                                                                                                                                                                       33oC cooler without it, so it keeps
                                                                                                                             Climate is determined by
                                                                                                                             many factors that influence               Earth habitable.
                                                                                                                             flows of energy through the
                                                                                                                             climate system, including                 Changes in climate can occur
                                                                                                                             greenhouse gases                          through both natural and
                                                                                                                                                                       human-induced causes
                                                                                                                             Energy from the Sun is the ultimate
                                                                                                                             driver of climate on Earth. The solar     Global climate varies naturally
                                                                                                                             energy received by Earth depends          over time scales from decades to
                                                                                                                             on how much the Sun emits and             thousands of years and longer. These
                                                                                                                             the distance between Earth and            natural variations can originate in
                                                                                                                             the Sun. Part of this sunlight is         two ways: from internal fluctuations
                                                                                                                             reflected directly back to space by       that exchange energy, water and
                                                                                                                             the atmosphere, clouds, and land, ice     carbon between the atmosphere,
                                                                                                                             and water surfaces. Aerosols (tiny        oceans, land and ice, and from
                                                                                                                             particles in the atmosphere, some         external influences on the climate
                                                                                                                             coming from human activities) can         system, including variations in the
                                                                                                                             increase the reflection of sunlight.      energy received from the sun and
                                                                                                                                                                       the effects of volcanic eruptions.
                                                                                                                             Eventually the solar energy absorbed
                                                                                                                             by Earth is returned to space as          Human activities can also influence
                                                                                                                             infrared (heat) radiation. In the         climate by changing concentrations
                                                                                                                             process it interacts with the whole       of CO2 and other greenhouse gases
                                                                                                                             climate system—atmosphere, oceans,        in the atmosphere (Box 1.2), altering
Climate change is a change in             system’. Climate, in its broadest          in the climate system, or due to        land surfaces and ice sheets. The         the concentrations of aerosols and
the pattern of weather, and               sense, is the statistical description of   human influences such as changes in     flows of radiation in the atmosphere      altering the reflectivity of Earth’s
related changes in oceans,                the state of the climate system.           the composition of the atmosphere       (Figure 1.1) are very important in        surface by changing land cover.
land surfaces and ice sheets,             Climate change is a change in the          or land use.                            determining climate. The main
occurring over time scales of             statistical properties of the climate      Weather can be forecast with            gases that make up the atmosphere,        A disturbance to the climate
decades or longer                                                                                                            nitrogen and oxygen, do not interact      system can trigger further
                                          system that persists for several           considerable skill up to about a week
                                                                                                                             with infrared radiation. However,         changes that amplify or damp
Weather is the state of the               decades or longer—usually at least         in advance. Short term fluctuations
                                                                                                                             certain gases present in smaller          the initial disturbance
atmosphere—its temperature,               30 years. These statistical properties     in climate, such as droughts, can
humidity, wind, rainfall and so on—over                                                                                      quantities absorb infrared radiation      There are close connections
                                          include averages, variability and          be predicted with limited skill
                                                                                                                             flowing upwards from Earth’s surface      between temperature, atmospheric
hours to weeks. It is influenced by the   extremes. Climate change may               from season to season. In contrast,
                                                                                                                             and re-radiate it in all directions,      water vapour, the extent of polar
oceans, land surfaces and ice sheets,     be due to natural processes, such          changes in the long-term statistics
                                                                                                                             including back downwards. By doing        ice sheets and the concentrations
which together with the atmosphere        as changes in the Sun’s radiation,         of the climate system (climate
                                                                                                                             this they impede the outward flow         of long-lived greenhouse gases
form what is called the ‘climate          volcanoes or internal variability          change) can be predicted if caused
                                                                                                                             of infrared energy from Earth to          (especially CO2) in the atmosphere.
6 | The science of climate change
The science of climate change - questions and answers - Australian Academy of Science
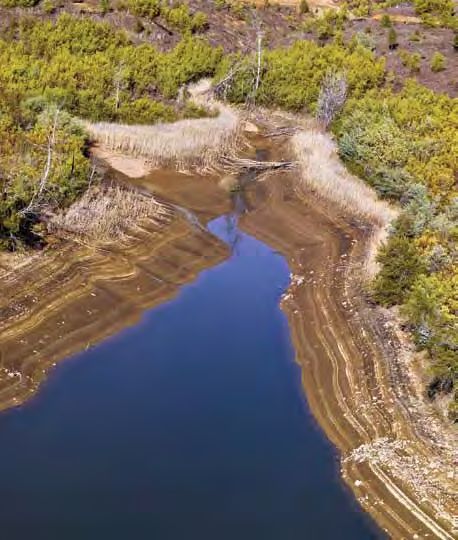
solar incoming                          solar reflected                                        infrared outgoing                    Box 1.1: If weather can only be forecast about a week in advance, how can
                                                                                                                                         we determine future climate?
                                                                                                                                         The challenges of predicting weather and climate are very different.
            340                                100                                                       239                             Predicting the weather is like predicting how a particular eddy will move
        (Units: W m-2)                                                                                                                   and evolve in a turbulent river: it is possible over short time scales by
                                                                                                                                         extrapolating the previous path of the eddy, but eventually the eddy is
                                                                                                                                         influenced by neighbouring eddies and currents to the extent that predicting
                                                                                                                                         its exact path and behaviour becomes impossible. Similarly, the limit for
                                                                                                                                         predicting individual weather systems in the atmosphere is around 10 days.
                                                                                                                                         On the other hand, predicting climate is like predicting the flow of the whole
                                                                                                            atmospheric
                                                                                                              window                     river. It requires a consideration of the major forces controlling the river
                                                                                                                                         such as changes in rainfall, the operation of dams, and extraction of water.
         79                                                                                                                              Projections of human-induced climate change over decades to centuries are
                                                           latent heat                                                greenhouse         possible because human activities have predictable effects on the future
 solar absorbed                                                                                                          gases           atmospheric composition, and in turn a predictable effect on climate.
  (atmosphere)
                           185
              solar down
               (surface)                    24                                                                                           Box 1.2: How do human activities enhance the ‘greenhouse effect’?
                                             solar                                                                                       Today, human activities are directly increasing atmospheric concentrations
                                             reflected
                                             (surface)
                                                           84 20                      398                         342                    of CO2, methane and nitrous oxide, plus some chemically manufactured
                                                                                                                                         greenhouse gases such as halocarbons (Question 3). These human-
                                   161                                                                                                   generated gases enhance the natural greenhouse effect and further warm
                            solar absorbed       evaporation sensible               infrared up              infrared down               the surface. In addition to the direct effect, the warming that results from
                               (surface)                       heat                  (surface)                  (surface)                increased concentrations of long-lived greenhouse gases can be amplified
                                                                                                                                         by other processes. A key example is water vapour amplification (Box 1.3).
Figure 1.1: The rates at which energy enters the Earth system from the Sun, and leaves the system, approximately balance on              Human activities are also increasing aerosols in the atmosphere, which
average globally. Energy absorbed at the surface is transferred to the atmosphere via infrared radiation, conduction of sensible heat,   reflect some incoming sunlight. This human-induced change offsets some
and evaporation of water whose latent heat is released later when the water condenses again. Energy leaves the system mostly via         of the warming from greenhouse gases.
infrared radiation from the atmosphere. The arrows show global average energy transfer rates in units of Watts per square metre.
With more greenhouse gases in the atmosphere, but no other changes, the system must reach a higher temperature to maintain balance.
Adapted from IPCC (2013), Fifth Assessment Report, Working Group 1, Figure 2.11.
                                                                                                                                         Box 1.3: If water vapour is the most important greenhouse gas, why all
                                                                                                                                         the fuss about CO2?
When one of these is disturbed,               An example of a slow feedback is
the others react through ‘feedback’           the ice age cycles that have taken                                                         Water vapour accounts for about half the natural greenhouse effect. Its
processes that may amplify or                                                                                                            concentrations in the atmosphere are controlled mainly by atmospheric
                                              place over the past million years,
                                                                                                                                         temperatures and winds, in contrast with the concentrations of other
dampen the original disturbance.              triggered by fluctuations in Earth’s
                                                                                                                                         greenhouse gases which are directly influenced by human-induced inputs
These feedbacks occur on a wide               rotation and orbit around the
                                                                                                                                         of these gases to the atmosphere. When global average atmospheric
range of time scales: those involving         sun. These fluctuations changed
                                                                                                                                         temperatures rise, global water vapour concentrations increase, amplifying
the atmosphere are typically rapid,           the distribution of solar radiation
                                                                                                                                         the initial warming through an enhanced greenhouse effect. In this way,
while those involving deep oceans             received by Earth, which caused                                                            human activity leads indirectly to increases in water vapour concentrations.
and ice sheets are slow and can               temperatures to change, in turn
cause delayed responses.                                                                     above: Surface meteorological observing     The reality of the water vapour feedback is supported by recent
                                              inducing changes in ice sheets
                                                                                             station at Cranbourne, Victoria, typical    observations and analyses. Increased water vapour concentrations have
An example of a rapid feedback                and carbon cycling that together
                                                                                             of stations used for observing climate      been observed and attributed to warming, and this feedback approximately
is the role of water vapour as                amplified the temperature response.            around the world. Photo: Bureau of          doubles the sensitivity of climate to human activities.
explained in Box 1.3.                         (Question 2).                                  Meteorology

                                                                                                                                                                                            The science of climate change | 7
The science of climate change - questions and answers - Australian Academy of Science
Q2

How has climate changed?

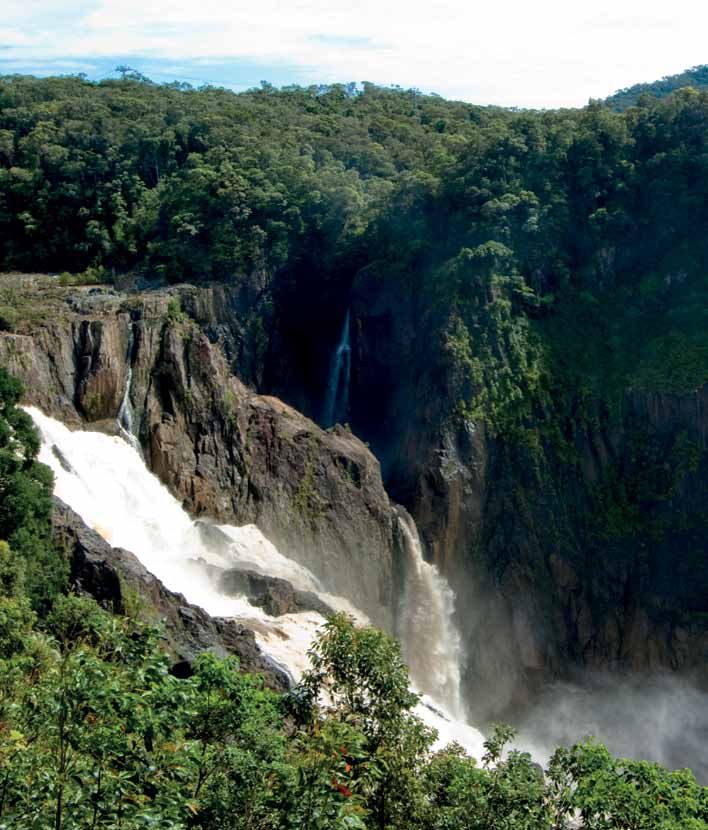
Past climate has varied                 in the atmosphere, the evolution       about 5˚C in ice-age cycles, roughly    Most past changes in global
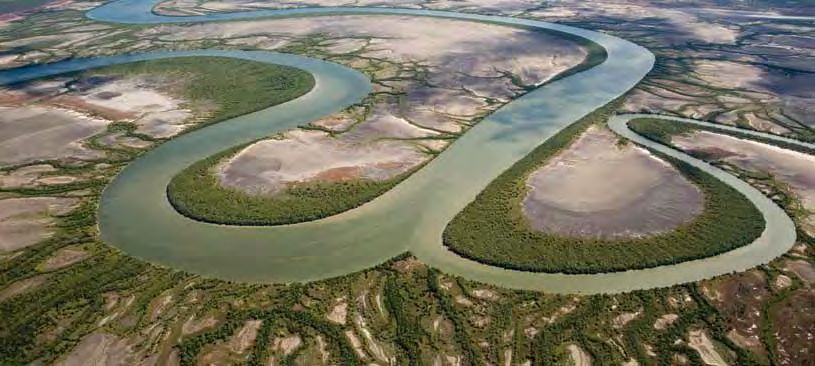
                                                                                                                                                                above: Aerial view of the Norman River
enormously on a variety of              of life and meteorite impacts have     every 100,000 years or so (Figure       temperature occurred slowly,             flowing towards the Gulf of Carpentaria
time-scales                             also caused climate change in the      2.1a). In the coldest period of the     over tens of thousands or millions       in far north Queensland. Photo:
Earth’s climate has changed             past. Several million years ago, for   last ice age, about 20,000 years ago,   of years. However, there is also         ©iStockphoto.com/John Carnemolla
dramatically many times since           example, global average temperature    sea level was at least 120 metres       evidence that some abrupt changes
the planet was formed 4.5 billion       was a few degrees higher than          lower than today because more           occurred, at least at regional scales.
years ago. These changes have           today and warm, tropical waters        water was locked up on land in          For example, during the last ice age,
been triggered by the changing          reached much farther from the          polar ice sheets. The last 8,000        temperatures in the North Atlantic
configuration of continents and         equator, resulting in very different   years, which includes most recorded     region changed by 5°C or more over
oceans, changes in the Sun’s            patterns of ocean and atmospheric      human history, have been relatively     as little as a few decades, likely due
intensity, variations in the orbit of   circulation from today.                stable at the warmer end of this        to sudden collapses of Northern
Earth, and volcanic eruptions.          Over the past million years,           temperature range. This stability       Hemisphere ice sheets or changes in
Natural variations in the               Earth’s globally averaged surface      enabled agriculture, permanent          ocean currents.
concentrations of greenhouse gases      temperature has risen and fallen by    settlements and population growth.

8 | The science of climate change
The science of climate change - questions and answers - Australian Academy of Science
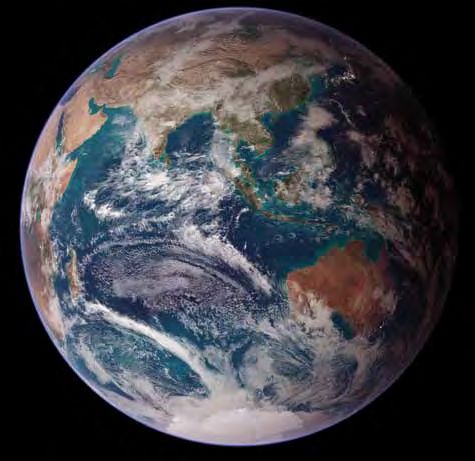
(a)                                         Changes over the last 800,000 years
                      5

Temp. change (°C)     0

                     -5

                    -10

                    400
                                                                                 2013 CO2 concentration (396 ppm)
CO2 (ppm)

                    325

                    250
                                                                                                                        Figure 2.1: Past changes                Past records demonstrate that            Global average temperatures
                                                                                                                        in temperature align with               global climate is sensitive to           have increased over the past
                    175
                                                                                                                        changes in CO2 at a variety of          small but persistent influences          century
                    800,000    700,000   600,000     500,000    400,000   300,000      200,000    100,000           0
                                                                                                                        time scales. These graphs show                                                   Climate and sea level were
                                                               Years BC                                                                                         Ice-age cycles were initiated by small
                                                                                                                        the changes from long‑term
                                                                                                                        average temperature (oC)                variations in the rotation of Earth      relatively stable over thousands of
 (b)                                             Changes over the last 2,000 years                                      and average atmospheric CO2             and in its orbit around the sun. These   years of recorded human history
                     0.4                                                                                                concentration (parts per million)       changed the seasonal and latitudinal     up to the 19th century, although
Temp. change (°C)

                     0.2                                                                                                over the last (a) 800,000 years,        distribution of solar energy reaching    with some variations (Figure 2.1b).
                                                                                                                        (b) 2,000 years and (c) 160 years.      Earth’s surface. Measurements
                       0                                                                                                                                                                                 However, globally averaged
                                                                                                                        The temperature changes in
                    -0.2                                                                                                                                        from climate archives such as ice        near-surface air temperature rose by
                    -0.4                                                                                                (a) are for Antarctica, while for
                                                                                                                        (b) and (c) they are global averages.
                                                                                                                                                                cores (Box 2.1) show that changing       around 0.8°C between 1850 and 2012
                    -0.6
                                                                                                                        Source: Compiled from various           temperatures triggered changes to        (Figure 2.1c). The rate of warming
                    400                                                                                                 publicly available data sources         other climate factors such as the        increased in the mid-1970s, and each
                                                                                                                        (for details, see web version of        concentration of carbon dioxide          of the most recent three decades
                    360                                                                                                 this document) as summarised            (CO2) in the atmosphere (Figure 2.1a),
CO2 (ppm)

                                                                                                                        in Box 2.1 (see page 10).                                                        has been warmer than all preceding
                                                                                                                                                                amplifying the initial disturbances.
                    320                                                                                                                                                                                  decades since 1850. The last decade
                                                                                                                                                                During warm periods, the major
                                                                                                                                                                                                         has been the warmest of these.
                    280                                                                                                                                         greenhouse gases CO2 and methane
                                                                                                                                                                                                         Satellite observations and direct
                           0              500                    1000                  1500                  2000                                               were released into the atmosphere,
                                                                                                                                                                                                         measurements also show warming
                                                               Years AD                                                                                         and receding ice sheets reflected less
                                                                                                                                                                sunlight to space. These observations    in the lower atmosphere over the
 (c)                                              Changes over the last 160 years                                                                               confirm that the climate system          past three decades. In contrast,
                     0.6                                                                                                                                        is sensitive to small disturbances       the atmosphere above about 15 km
                                                                                                                                                                                                         elevation (the stratosphere) has
Temp. change (°C)

                     0.4                                                                                                                                        that can be amplified by reinforcing
                     0.2
                                                                                                                                                                feedback processes. Likewise, the        cooled over this time.
                     0.0
                    -0.2
                                                                                                                                                                climate system today is sensitive to     The temperature of the oceans
                    -0.4                                                                                                                                        disturbances from human influences.      has also risen. More than 90% of
                    -0.6                                                                                                                                                                                 the total heat accumulated in the
                    400                                                                                                                                                                                  climate system between 1971 and
                                                                                                                                                                                                         2010 has been stored in the oceans.
                    360
CO2 (ppm)

                                                                                                                                                                                                         The greatest ocean warming has
                    320                                                                                                                                                                                  taken place close to the surface,
                    280
                                                                                                                                                                                                         with the upper 75 m of the ocean
                                                                                                                                                                                                         warming by an average of 0.11oC
                       1850     1870      1890        1910      1930      1950         1970       1990       2010
                                                                                                                                                                                                         each decade between 1971 and 2010.
                                                               Years AD

                                                                                                                                                                                                                  The science of climate change | 9
The science of climate change - questions and answers - Australian Academy of Science
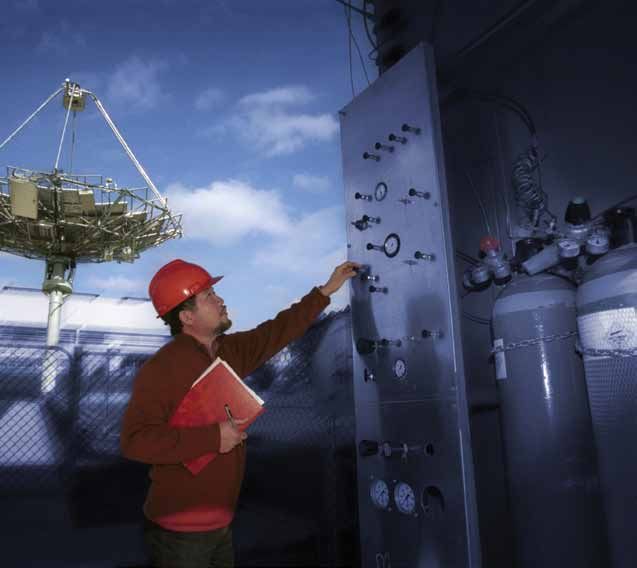
Box 2.2: Has climate warming recently stopped?
                                                                                                                          According to most estimates, the rate of average surface warming
                                                                                                                          has slowed since 2001, despite ongoing rises in greenhouse gases. This
                                                                                                                          slowdown is consistent with known climate variability. Indeed, decades
                                                                                                                          of little or no temperature trend can be seen throughout the last century,
                                                                                                                          superimposed on the long-term warming trend.
                                                                                                                          Two main factors have contributed to the most recent period of slowed
                                                                                                                          surface warming. First, decadal variability in the ocean-atmosphere system
                                                                                                                          has redistributed heat in the ocean, especially in the eastern and central
                                                                                                                          Pacific. This has caused warming at depth and cooling of surface waters
                                                                                                                          and the lower atmosphere in this region. Second, several temporary
                                                                                                                          global cooling influences have come into play including unusually weak
                                                                                                                          solar activity (Box 3.1, see page 15), increased aerosol production, and
                                                                                                                          volcanic activity.
                                                                                                                          None of these influences is likely to continue over the long term. Moreover,
                                                                                                                          despite the slowdown in warming at the surface, there have been
                                                                                                                          continuing increases in heat extremes and in the heat content of the
                                                                                                                          oceans, as well as rising sea levels, shrinking Arctic sea-ice, and ongoing
                                          Box 2.1: How do we detect climate change?
                                                                                                                          melt of ice sheets and glaciers. Some models predict that, when the
                                          Identifying temperature change that is global in extent requires frequent       current slowdown ends, renewed warming will be rapid.
                                          observations from many locations around the world. Thermometers, rain
                                          gauges and other simple instruments have been used to measure climate          Changes are evident in many                  the year and particularly in
                                          variables, starting in the mid-19th century. Over time the quality, variety    parts of the climate system                  summer. The thickness of the ice
                                          and quantity of observations has improved. Since the 1970s, sophisticated      Changes consistent with an increase          has also decreased by more than
                                          sensors on earth-orbiting satellites have provided near global coverage        in global temperature have been              30% over the last 30 years.
                                          of many climate variables. By carefully analysing the data gathered using      observed in many other components         >> In the Southern Ocean, there are
top right: Scientists use ice core        these techniques (with careful account for changes in instrument types,
samples to reconstruct climatic records                                                                                  of the climate system.                       strong regional differences in the
over hundreds of thousands of years.
                                          observational practices, instrument locations and urban areas) it has been                                                  changes to areas covered by sea
                                                                                                                         >> Mountain glaciers have been
Photo: NASA/Lora Koenig                   possible to map the distribution of temperature and other climate changes                                                   ice, but a small increase in total
                                                                                                                            shrinking and contributing
top left: Tree rings provide one source   since the late 19th century.                                                                                                coverage, driven by shifts in winds
                                                                                                                            to global sea-level rise since
of climate change data over hundreds      To study climate changes that occurred before direct measurements were                                                      and ocean currents in a warming
of years. Photo: LandLearn NSW                                                                                              about 1850. Melting accelerated
                                          made, scientists use indirect evidence from other sources that record a           significantly in the 1990s.               Southern Ocean. Strengthening
above left: Scientists have been using    climate signal. These include climate signals encoded in the composition                                                    circumpolar winds around
specialised equipment to measure                                                                                         >> The Greenland and West Antarctic
and record weather and climate since
                                          of ice cores, corals, sediments in oceans and lakes, and tree rings. All                                                    Antarctica have also been linked in
                                                                                                                            Ice Sheets have both lost ice
1850. NASA’s Global Precipitation         these records are laid down sequentially over time as an organism grows                                                     part to thinning of the ozone layer.
                                                                                                                            since 1990, further contributing
Measurement (GPM) Core Observatory        or as sediments accumulate. Ice cores from polar ice sheets, which                                                       >> The amount of water vapour in
satellite is designed to provide rain                                                                                       to sea-level rise as discussed in
                                          are built from snow laid down over tens to hundreds of thousands of                                                         the atmosphere has increased
and snow observations worldwide.                                                                                            Question 6. This is from increased
                                          years, provide records of both past CO2 and temperature. As the snow                                                        since the 1980s, which is consistent
Visualisation: NASA                                                                                                         discharge of ice into the ocean, and
                                          transforms into ice, it traps air in sealed bubbles that provide a sample of                                                with warmer air (Box 1.3,
                                                                                                                            also increased surface melting in
                                          past atmospheric composition, while the ratio of stable isotopes of either                                                  see page 7).
                                                                                                                            Greenland. The rate of loss from
                                          oxygen or hydrogen in the water molecule is related to the temperature
                                                                                                                            Greenland appears to be increasing.    >> The surface of the ocean in rainy
                                          at the time when the snow fell. More recent historical changes can be
                                                                                                                         >> The area of the Arctic Ocean              parts of the world is becoming
                                          identified by analysing written and pictorial records, for example of
                                                                                                                            covered by sea ice has decreased          less salty, which is consistent
                                          changes in glacier extent.
                                                                                                                            significantly since 1987 throughout       with freshwater dilution from
                                                                                                                                                                      increased rainfall.
10 | The science of climate change
>> Some ocean currents have                                                                                                                                       MLOST 1901-2012
                                         Figure 2.2: Surface temperature has
   changed in response to changes        increased across most of the world
   in surface winds, ocean               since 1901. This map shows the
   temperature and ocean saltiness.      distribution of the average temperature                                                                                      GISS 1901-2012
   The changes include a southward       change between 1901 and 2012. Adapted
                                         from IPCC (2013), Fifth Assessment
   shift of the Antarctic Circumpolar    Report, Working Group 1, Figure 2.21.
   Current and increasing
   southward penetration of the
   East Australian Current.
>> An increasing number of plants
   and animals, on land and in the
   oceans, are undergoing shifts in
   their distribution and lifecycles                                                                                                                                Trend ( C over period)
                                                                                                                                                                  GISS   1901-2012
                                                                                                                                                                              o

   that are consistent with
                                                                                                                                                     -0.6 -0.4
                                                                                                                                                     -0.6 -0.4 -0.2
                                                                                                                                                               -0.2 0.0
                                                                                                                                                                     0 0.2
                                                                                                                                                                        0.2 0.4
                                                                                                                                                                            0.4 0.6
                                                                                                                                                                                0.6 0.8 1. 1.25
                                                                                                                                                                                    0.8 1.0 1.25 1.5
                                                                                                                                                                                                 1.5 1.75
                                                                                                                                                                                                     1.75 2.5
                                                                                                                                                                                                          2.0
   observed temperature changes.
                                                                                                                                                                  Trend (ºC over period)

There are regional differences           Figure 2.3: Temperature has risen over
                                         Australia and in the surrounding ocean
to climate change including
                                         since the beginning of the 20th century,
within Australia

                                                                                     Temperature anomoly (°C)
                                                                                                                 1.00      Departures from 1961–1990 climatological average
                                         although there are regional differences.
Over the past 100 years, temperature     Plot on left shows deviations from
                                                                                                                0.50
has increased over almost the entire     the 1961–1990 average of sea surface
                                         temperature and temperatures over land
globe; the rate of increase has          in the Australian region; map on right
                                                                                                                 0.0
been largest in continental interiors    shows distribution of annual average
                                                                                                                -0.50
(Figure 2.2). The average surface        temperature change across Australia
temperatures over the Australian         since 1910. Adapted from BOM/CSIRO
                                                                                                                -1.00
continent and its surrounding oceans     State of the Climate 2014 p.4–5.
                                                                                                                                          -0.6 1960
                                                                                                                    1910 1920 1930 1940 1950     -0.4 1970
                                                                                                                                                       -0.2 1980
                                                                                                                                                             0   0.2
                                                                                                                                                                  1990 0.4
                                                                                                                                                                         20000.62010
                                                                                                                                                                                   0.8       1.   1.25 1.5 1.75 2.5
have increased by nearly 1°C since
the beginning of the 20th century                                                                                       Sea-surface temperature               Trendair(ºC
                                                                                                                                                             Surface      over period)
                                                                                                                                                                      temperature
(Figure 2.3 left). Seven of the ten                                                                                     Sea-surface temperature              Surface air temperature
                                                                                                                        10-year average                      10-year average
warmest years on record in Australia
have occurred since 2002. However
there are differences across Australia   Figure 2.4: Recent rainfall in northern
with some regions having warmed          Australia has been higher than average
faster and others showing relatively     during the northern wet season, and
                                         in southern Australia it has been drier
little warming (Figure 2.3 right).
                                         during the southern wet season. The
Since the mid 1990s there have been      maps show the relative ranking (in 10%
significant increases in wet season      increments) of rainfall from July 1995 to
rainfall over northwest Australia        June 2014 compared with the average
                                         since 1900 for (left) northern Australian
(Figure 2.4 left), a declining trend     wet season (Oct–Apr) and (right)
in southwest Australia, and a 15%        southern Australian wet season
decline in late autumn and early         (Apr–Nov). Adapted from BOM/CSIRO
winter rainfall in the southeast         State of the Climate 2014, p.6–7.
(Figure 2.4 right).

                                                                                                                                                                                                                      The science of climate change | 11
Q3                                 Human activities have
                                     increased greenhouse
                                                                              responses to warming and rainfall
                                                                              changes (though the mix of these
                                     gas concentrations in the                mechanisms remains unclear). The

Are human activities                 atmosphere
                                     Atmospheric concentrations of
                                     carbon dioxide (CO2), methane
                                                                              other 45% of emissions accumulated
                                                                              in the atmosphere. These changes
                                                                              to the carbon cycle are known from

causing climate change?              and nitrous oxide began to rise
                                     around two hundred years ago,
                                     after changing little since the end of
                                     the last ice age thousands of years
                                                                              measurements in the atmosphere,
                                                                              on land and in the ocean, and from
                                                                              modelling studies.
                                                                              The dominant cause of the
                                     earlier. The concentration of CO2 has    increasing concentration of CO2
                                     increased from 280 parts per million     in the atmosphere is the burning
                                     (ppm) before 1800, to 396 ppm in         of fossil fuels. Over the last two
                                     2013. This history of greenhouse         centuries, the growth of fossil-
                                     gas concentrations has been              fuel combustion has been closely
                                     established by a combination of          coupled to global growth in energy
                                     modern measurements and analysis         use and economic activity. Fossil-
                                     of ancient air bubbles in polar ice      fuel emissions grew by 3.2% per
                                     (Box 2.1, see page 10).                  year from 2000 to 2010 (Figure 3.3),
                                     Particularly important is CO2.           a rapid growth that is dominated
                                     Enormous amounts of it are               by growth in Asian emissions and
                                     continually exchanged between            has exceeded all but the highest
                                     the atmosphere, land and oceans,         recent long-range scenarios for
                                     as land and marine plants grow,          future emissions.
                                     die and decay, and as carbon-rich        Although fossil-fuel emissions of
                                     waters circulate in the ocean. For       CO2 have grown fairly steadily,
                                     several thousand years until around      the upward march of the CO2
                                     200 years ago, this ‘carbon cycle’       concentration in the atmosphere
                                     was approximately in balance and         varies from year to year. This is
                                     steady. Since the 19th century,          caused mainly by the effects of
                                     human-induced CO2 emissions from         weather variability on vegetation,
                                     fossil fuel combustion, cement           and also by sporadic volcanic
                                     manufacture and deforestation have       activity: major volcanic eruptions
                                     disturbed the balance, adding CO2 to     have a significant indirect influence
                                     the atmosphere faster than it can be     on atmospheric CO2 concentrations,
                                     taken up by the land biosphere and       causing temporary drawdown of
                                     the oceans (Figures 3.1 and 3.2). On     CO2 through the promotion of plant
                                     average over the last 50 years, about    growth by the light-scattering and
                                     25% of total CO2 emissions were          cooling effects of volcanic haze. By
                                     absorbed by the ocean—making             contrast, the direct contribution of
                                     sea water more acidic—and 30%            volcanic emissions to atmospheric
                                     was taken up on land, largely by         CO2 is negligible, amounting to
                                     increased plant growth stimulated        around 1% of current human-
                                     by rising atmospheric CO2,               induced emissions.
                                     increased nutrient availability, and

12 | The science of climate change
Atmospheric CO₂ sources and accumulation
                                                                                                                                                                                                              10
                                                                                                                                                                                                                          Emissions from fossil fuels
                                                                                                                                                                                                                                                                                                           Figure 3.2: An ‘atmospheric CO2 budget’
                                                                                                                                                                                                                          Emissions from land use changes                                                  reveals the amount of carbon in the
                                                                                                                                                                                                               8
                                                                                                                                                                                                                          Accumulation in the atmosphere                                                   net amounts of CO2 entering, leaving

                                                                                                                                                     Annual flow of CO₂ (billion tonnes of carbon per year)
                                                                                                                                                                                                                                                                                                           and accumulating in the atmosphere.
                                                                                                                                                                                                               6                                                                                           The upper panel shows the inflows of
                                                                                                                                                                                                                                                                                                           CO2 to the atmosphere from fossil fuel
                                                        Global carbon dioxide budget                                                                                                                                                                                                                       emissions (red) and net land use change
                                                            (gigatonnes of carbon per year)                                                                                                                   4
                                                                             2004-2013                                                                                                                                                                                                                     (orange), together with the net annual
                                                                                                                                                                                                                                                                                                           CO2 accumulation in the atmosphere (pale
                                                                                                                                                                                                               2                                                                                           blue). The lower panel shows the outflows
           Fossil fuel &                                    Atmospheric                                                                                                                                                                                                                                    of CO2 from the atmosphere to the ocean
             cement                                           growth                                            Land sink                                                                                                                                                                                  (dark blue) and to plants on land (green).
                                                                                                    Land-use
            8.9 ± 0.4                                           4.3 ± 0.1                            change     2.9 ± 0.8                                                                                      1850        1870         1890       1910        1930     1950     1970     1990     2010    The accumulation in the atmosphere is the
                                                                                                                                                                                                                                                                                                           difference between the sum of the two
                                                                                                    0.9 ± 0.5
                                                                                                                                                                                                                                                                                                           emissions and the sum of the two sinks
                                                                                                                            Ocean sink                                                                                                                  Atmospheric CO₂ sinks                              Source: Working Group for this document,
                                                                                                                            2.6 ± 0.5                                                                          6                                                                                           with data from the Global Carbon Project.
                                                                                                                                                                                                                          oceans                                                                           (www.globalcarbonproject.org/)
                                                                                                                                                                                                                          land
                                                                                                                                                                                                              4

                                                                                                                                                                                                               2

                                                                                                                                                                                                               1850        1870         1890       1910        1930     1950     1970     1990     2010

Prod
© Glouced by
     bal C the In
          arbo     te
                                               Geological
               n Pro rnation
                    ject     a
                         2010 l Geosp          reservoirs
                                      here-B
                                            iosp                                                                                                                                                              14
                                                here
                                                       Prog
                                                           ramme
                                                                   for th                                                                                                                                                    High emissions pathway                                                        Figure 3.3: CO2 emissions from burning
                                                                         e Glo
                                                                              bal C
                                                                                   arbo                                                  (billion tonnes of carbon per year)                                                 Low emissions pathway                                                         fossil fuels have continued to increase
                                                                                       n Pro
                                                                                            ject.
                                                                                                                                                                                                                                                                                                           over recent years. The black dots show
                                                                                                                                                                                                              12             Intermediate 1
                                                                                                                                                                                                                                                                                                           observed CO2 emissions from fossil fuels
                                                                                                                                              Fossil Fuel CO₂ emissions

                                                                                                                                                                                                                             Intermediate 2
                                                                                                                                                                                                                                                                                                           and other industrial processes (mainly
                                                                                                                                                                                                                             Observed
                                                                                                                                                                                                                                                                                                           cement manufacture); the coloured
                                                                                                                                                                                                              10                                                                                           lines represent four future pathways
Figure 3.1: The natural carbon cycle, in which CO2 circulates between the atmosphere, land                                                                                                                                                                                                                 as envisaged in 2006 for low to high
and oceans, has been changed by emissions of CO2 from human activities. In this diagram                                                                                                                                                                                                                    emissions. Observed emissions are
of the global carbon cycle, numbers on arrows represent carbon flows averaged over                                                                                                                                                                                                                         tracking the highest-emission pathway.
2004–2013, in gigatonnes (billion tonnes) of carbon per year. Source: Global Carbon                                                                                                                           8
                                                                                                                                                                                                                                                                                                           Source: Working Group for this document,
Project, with updated numbers.                                                                                                                                                                                                                                                                             with data from the Global Carbon Project.

                                                                                                                                                                                                              6

                                                                                                                                                                                                                   1990     1995        2000            2005     2010     2015     2020     2025    2030

facing page: Southern approach to the
Sydney Harbour Bridge, NSW.
Photo: ©iStockphoto.com/airspeed

                                                                                                                                                                                                                                                                                                                    The science of climate change | 13
Most of the observed recent              Of these, solar fluctuations and           Using climate models, it is possible
global warming results from              volcanic eruptions are entirely            to separate the effects of the natural                            Effect on climate (Watts per square metre)
human activities                         natural, while the other four are          and human-induced influences on
                                                                                                                                -3               -2              -1                 0       1              2
Climatic warming or cooling arises       predominantly caused by human              climate. Models can successfully
from changes in the flows of             influences. The human-induced              reproduce the observed warming
                                                                                                                                                                              CO2
energy through the climate system        drivers have been dominant over the        over the last 150 years when both
(Figure 1.1, see page 7) that can        past century (Figure 3.4). Changes         natural and human influences are
                                                                                                                                               Methane + other long-lived gases
originate from a number of possible      in greenhouse gas concentrations,          included, but not when natural
driving factors. The main drivers that   dominated by CO2, caused a large           influences act alone (Figure 3.5).
                                         warming contribution. Some of              This is both an important test of the                       Ozone + other short-lived gases
have acted over the last century are:
                                         this has been offset by the net            climate models against observations
>> increases in atmospheric CO2 and                                                                                                                         Land use change
                                         cooling effects of increased aerosol       and also a demonstration that
   other long-lived greenhouse gases
                                         concentrations and their impact            recent observed global warming
   (methane, nitrous oxide and
                                         on clouds. Black carbon or soot has        results largely from human rather                Aerosol
   halocarbons)
                                         probably exerted a smaller, warming        than natural influences on climate.
>> increases in short-lived              influence. The net effect of all aerosol   It is also possible to distinguish                                                 Solar
   greenhouse gases (mainly ozone)       types including soot remains hard          the effects of different human and
>> changes to land cover                 to quantify accurately. Among the          natural influences on climate by
   (replacement of darker forests        natural influences, the effect of          studying particular characteristics
   with paler croplands and              changes in the brightness of the Sun       of their effects. For example, it was    Figure 3.4: Human-induced drivers of climate change have been much larger than natural
   grasslands)                           has been very small (Box 3.1). Volcanic    predicted more than a century ago        drivers over the last century. The strength of these drivers, which are changing the
                                         influences are highly intermittent,                                                 long-term energy balance of the planet, is measured in Watts per square metre (see also
>> increases in aerosols (tiny                                                      that increases in CO2 would trap         Figure 1.1). Orange and green bars respectively indicate human and natural drivers; error
   particles in the atmosphere)          with major eruptions (such as              more heat near the surface and           bars indicate 5-95% uncertainties. The solar effect (shown in green) is very small. Volcanic
                                         Pinatubo in 1991) causing significant      also make the stratosphere colder.       effects are highly variable in time (see text) and are not shown here. Source: Working
>> solar fluctuations (changes in the
                                         cooling for a year or two, but their       In recent years, satellite and other     Group for this document, with data from IPCC (2013), Fifth Assessment Report, Working
   brightness of the sun)                                                                                                    Group 1, Chapter 8 Supplementary Material.
                                         average effects over the past century      measurements have provided strong
>> volcanic eruptions.                   have been relatively small.                evidence that the upper atmosphere

14 | The science of climate change
Land                                                                         Land + Ocean
                       2.0                                                                                2.0
                                                                                                                                                                       Figure 3.5: Climate models can correctly
                                                                                                                                                                       replicate recent warming only if they
                        1.5                                                                                1.5                                                         include human influences. Comparison
                                                                                                                                                                       of observed changes (black lines) in
                                                                                                                                                                       global temperatures (°C) over land (left)
    Temp change (°C)

                                                                                       Temp change (°C)
                        1.0                                                                                1.0                                                         and land plus ocean (right) with model
                                                                                                                                                                       projections including both natural plus
                                                                                                                                                                       human influences (red lines) and natural
                       0.5                                                                                0.5                                                          influences only (blue lines). Shadings
                                                                                                                                                                       around model results indicate 5-95%
                                                                                                                                                                       confidence bands. Adapted from IPCC
                       0.0                                                                                0.0                                                          (2013), Fifth Assessment Report, Working
                                                                                                                                                                       Group 1, Figure 10.21.

                       -0.5                                                                               -0.5

                       -1.0                                                                               -1.0
                          1850       1910                1960                2010                            1850      1910               1960                 2010

has cooled and the lower atmosphere         trends that have been observed
                                                                                      Box 3.1: Do changes in the Sun contribute to global warming?
has warmed significantly—the                in the Australian region over the
predicted consequence of extra              past two decades. These include           In comparison with other influences, the effects of solar variations on
greenhouse gases. This supports the         stronger westerly winds over the          present global warming are small. Indirect estimates suggest that changes
inference that the observed near-           Southern Ocean, strengthening             in the brightness of the Sun have contributed only a few percent of the
surface warming is due primarily            of the high-pressure ridge over           global warming since 1750. Direct measurements show a decreasing solar
to an enhanced greenhouse effect            southern Australia, and a related         intensity over recent decades, opposite to what would be required to
rather than, say, an increase in the        southward shift of weather systems.       explain the observed warming. Solar activity has declined significantly
brightness of the Sun.                      These trends are consistent with          over the last few years, and some estimates suggest that weak activity
                                            climate model projections, and are        will continue for another few decades, in contrast with strong activity
Some recent changes in                      likely to be largely human-induced        through the 20th century. Nevertheless, the possible effects on warming
Australia’s climate are linked              through a combination of increases        are modest compared with anthropogenic influences.
to rising greenhouse gases                  in greenhouse gases and thinning of
Modelling studies indicate that             the ozone layer.
rising greenhouse gases have made           Past decadal trends in Australian        There has very likely been net
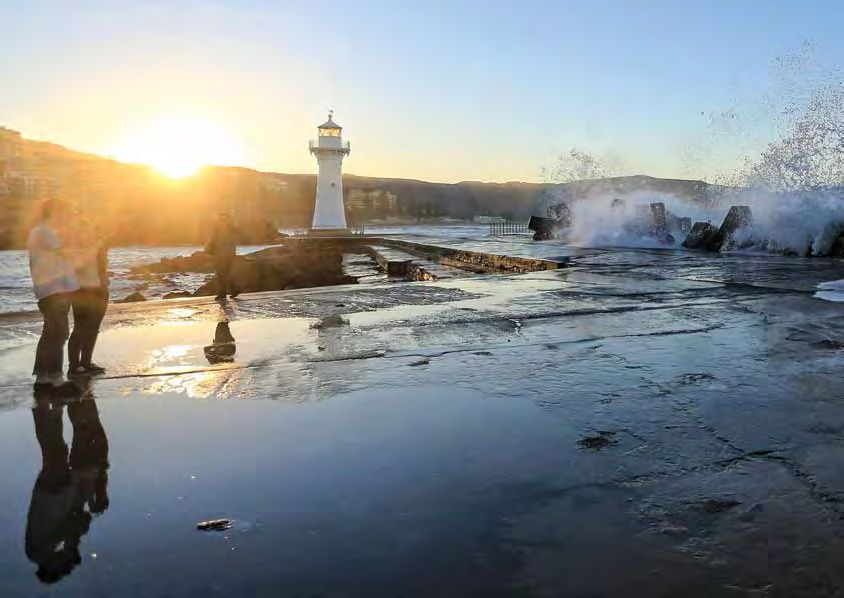
                                                                                                                              facing page: Wollongong, NSW at night.
a clear contribution to the recent          rainfall (Question 2) cannot yet be      uptake of CO2 by Australian              Photo: Jim Vrckovski
observed warming across Australia.          clearly separated from natural climate   vegetation, consistent with global       right: Rainforest canopy,
Depletion of the ozone layer in the         variations, except in southwest          uptake of CO2 by vegetation on land      Bellenden Ker Range, North Queensland.
upper atmosphere over Antarctica            Western Australia where a significant    (Figure 3.2, see page 13). This has      Photo: Robert Kerton
and rising greenhouse gas                   observed decline in rainfall has been    been accompanied by increases
concentrations are also likely to have      attributed to human influences on        in the greenness of Australian
contributed significantly to climate        the climate system.                      vegetation, which is also consistent
                                                                                     with global trends.

                                                                                                                                                                                The science of climate change | 15
Q4

How do we expect climate                                     With continued strong growth
                                                             in CO2 emissions, much more
                                                             warming is expected
                                                                                                                                         for CO2, coupled with rises in the
                                                                                                                                         other greenhouse gases, would

to evolve in the future?
                                                                                                                                         be expected to result in a global-
                                                             If society continues to rely on                                             average warming of around 4.5˚C
                                                             fossil fuels to the extent that it                                          by 2100, but possibly as low as 3˚C
                                                             is currently doing, then carbon                                             or as high as 6˚C. A ‘low emissions’
                                                             dioxide (CO2) concentrations in                                             pathway, based on a rapid shift away
                                                             the atmosphere are expected to                                              from fossil fuel use over the next
                                                             double from pre-industrial values                                           few decades, would see warming
                                                             by about 2050, and triple by about                                          significantly reduced later this
                                                             2100. This ‘high emissions’ pathway                                         century and beyond (Figure 4.1).

                                                                                               7
                                                                                                       40
                                                                                              6        30

                                                                                                       20
                                                                                              5

                                                             Global temperature change (°C)
                                                                                                       10

                                                                                              4         0

                                                                                                      − 10
                                                                                                        1980 2000 2020 2040 2060 2080 2100
                                                                                              3                        Year

                                                                                              2

                                                                                               1

                                                                                              0

                                                                                              −1
                                                                                               1980          2000       2020         2040         2060        2080       2100

                                                                                                                                      Year
                                                                                                                High emissions pathway        Low emissions pathway

above: Drawing on data from multiple satellite missions,     Figure 4.1: Future projected climate change depends on net emissions of greenhouse
NASA scientists and graphic artists have layered land        gases. Retrospective and future projected global surface air temperature changes
surface, polar sea ice, city lights, cloud cover and other   (°C; relative to 1861–1880) under both high and low emissions pathways. Individual model
data in a visualisation of Earth from space. Image: NASA     simulations are shown as faint lines, with bold lines indicating the multi-model average.
Goddard Space Flight Centre/Reto Stöckli                     The corresponding two emissions pathways, including all industrial sources, are included
                                                             in the inset. Emission units are gigatonnes (billion tonnes) of carbon per year (GtC/y).
                                                             Source: Data from Coupled Model Intercomparison Project (CMIP) 5.

16 | The science of climate change
Projections of surface air temperature and precipitation change for years 2081–2100

            A model with high climate sensitivity                                                               A model with low climate sensitivity               Figure 4.2: Projections of temperature
                                                                                                                                                                   and rainfall show consistent features at
                                                                             11                                                                                    large scales but differ regionally, especially
                                                                                                                                                                   for rainfall. Projected global distributions

                                                                                       temperature changes °C
                                                                             9                                                                                     of surface air temperature changes (top)

                                                                                        Projected surface air
                                                                                                                                                                   and percentage precipitation change
                                                                             7                                                                                     (bottom) averaged for the years
                                                                                                                                                                   2081–2100 (relative to 1981–2000), under a
                                                                             5                                                                                     high emissions pathway for two particular
                                                                                                                                                                   climate models, one with relatively high
                                                                             3                                                                                     sensitivity to an initial disturbance to the
                                                                                                                                                                   climate system (left hand panels) and
                                                                                                                                                                   one with relatively low climate sensitivity
                                                                             1
                                                                                                                                                                   (right hand panels). The projections have
                                                                                                                                                                   many similar patterns but differ in regional
                                                                             −1
                                                                                                                                                                   details, as is typical of climate projections
                                                                                                                                                                   from different models. Source: Data from
                                                                                                                                                                   Coupled Model Intercomparison Project 5.

                                                                             50
                                                                             40
                                                                             30

                                                                                       precipitation change
                                                                             20

                                                                                           Projected %
                                                                             10
                                                                             0
                                                                             −10
                                                                             −20
                                                                             −30
                                                                             −40
                                                                             −50

During the next few decades and         and decreases in many subtropical          worldwide, broadly agree on the          than under a high emissions
beyond, global warming is expected      and mid-latitude regions), further         patterns of global-scale warming,        scenario. At more localised regional
to cause further increases in           ocean warming, and further rises           with greater atmospheric warming         scales the models can produce
atmospheric moisture content, more      in sea levels. The magnitude of            over land than over the oceans, and      different results: for example,
extreme heatwaves, fewer frosts,        expected change depends on future          greater warming at high northern         some models project substantial
further decreases in the extent and     greenhouse gas emissions and               latitudes than in the tropics and        changes to phenomena such as
thickness of sea ice, further melting   climate feedbacks.                         Southern Ocean (Figure 4.2 top).         El Niño or dramatic changes to
of mountain glaciers and ice sheets,    Future projections, based on               Future changes depend on the             vegetation, and regional projections
shifts in rainfall (increases in most   climate models operated across a           emissions pathway, and will be           of precipitation vary between
tropical and high-latitude regions      large number of research centres           less if emissions are curtailed          models (Figure 4.2 bottom).

                                                                                                                                                                              The science of climate change | 17
Australia can expect further             Long-term climate change is
                                     warming and changes in water             effectively irreversible
                                     availability                             The decisions we make on carbon
                                     Australian temperatures are              emissions over coming decades will
                                     expected to rise by approximately        affect our climate for a long time to
                                     half a degree or more by 2030            come, as emissions will profoundly
                                     relative to 1990, bringing more hot      impact the rate of future climate
                                     days and nights. Average sea level is    change, particularly after 2030
                                     expected to be about 15 cm higher        (Figure. 4.1, see page 16). Even if
                                     by 2030 relative to 1990 and some        emissions of greenhouse gases are
                                     models project tropical cyclones         reduced to near zero during this
                                     becoming less frequent but more          century, we will have to live with
                                     severe in peak rainfall intensity as     a warmer climate for centuries.
                                     the world warms.                         For those parts of the climate
                                     It is likely that future rainfall        system that respond slowly, such
                                     patterns across Australia will be        as the deep ocean, ice sheets and
                                     different from today. However,           permafrost, change will continue
                                     compared with temperature trends,        for a long time. Many associated
                                     changes in rainfall patterns are         impacts—such as sea-level rise—
                                     harder to predict. Regional rainfall     and processes that exacerbate
                                     projections from different climate       climate change—such as releases
                                     models are frequently different          of methane and CO2 from thawing
                                     from one another (e.g. over              permafrost soils—will continue long
                                     Australia; Figure 4.2, see page 17).     after emissions are stopped.
                                     Nevertheless, some future trends         These characteristics of the climate
                                     are projected by a majority of           system mean that the only way
                                     models, including decreases over         to stop human-induced climate
                                     southwest Western Australia coastal      change (without resorting to
                                     regions. Future rainfall trends across   ‘geoengineering’—the deliberate,
                                     the Murray Darling basin remain          large-scale modification of climate)
                                     uncertain.                               is to reduce net greenhouse gas
                                     Changes in rainfall greatly affect       emissions to near-zero levels. The
                                     water availability because changes       longer this takes to achieve, and the
                                     in rainfall are amplified in the         more greenhouse gases that are
                                     resulting changes in runoff to rivers:   emitted in the meantime, the larger
                                     the runoff in typical Australian         the scale of future climate change.
                                     catchments changes by 2 to 3% for
                                     each 1% change in rainfall.
                                                                              left: Low water levels in the Cotter Dam
                                                                              near Canberra, ACT. Photo: Nick Pitsas
                                                                              above right: 1 Bligh St, Sydney, NSW is an
                                                                              energy efficient development with six-star
                                                                              green status. Improving urban energy
                                                                              efficiency will help reduce emissions.
                                                                              Photo: Sardaka

18 | The science of climate change
7
                                                                                                                                                            AR5
                                                                                                                                                            AR4
                                                                                                                                                    6

                                                                                                               Warming relative to 1860–1880 (°C)
                                                                                                                                                    5

                                                                                                                                                    4

                                                                                                                                                    3

                                                                                                                                                    2

                                                                                                                                                    1

                                                                                                                                                    0
                                                                                                                                                        0           500          1000         1500         2000          2500          3000
                                                                                                                                                                  Cumulative CO2 emissions from 1870 (billion tonnes of carbon)

To keep global warming           global average temperatures to no       emissions were 530 billion tonnes.      Figure 4.3: Global warming is closely
below any specified threshold,   more than 2°C above preindustrial       The remaining quota is equivalent       related to cumulative CO2 emissions.
there is a corresponding         levels, the total CO2 emitted from      to around 30 years worth of current     Points represent Intergovernmental Panel
limit on cumulative carbon       human activities (accounting also       emissions. To stay within such a        on Climate Change projections from
dioxide emissions                                                                                                the Fourth and Fifth Assessments (IPCC
                                 for effects of other gases) would       carbon quota, long-term global
                                                                                                                 AR4, AR5); coloured bands represent
The amount of future global      have to stay below a ‘carbon quota’     emissions reductions would have         uncertainty, by showing the relationship
warming is closely related       between 820 and 950 billion tonnes      to average between 5.5% and             if the climate were more (red) or less
to cumulative CO2 emissions      of carbon. So far, humanity has         8% per year, accounting for time        (blue) sensitive to disturbance than
                                 emitted well over half of this quota:   required to turn around present         current best estimates. Source: Working
(Figure 4.3). For example, to
                                                                                                                 Group for this document, with data from
have a 50:50 chance of keeping   between 1870 and 2013 cumulative        emissions growth.
                                                                                                                 IPCC AR4 and AR5.

                                                                                                                                                                                                          The science of climate change | 19
Q5

How are extreme
events changing?
Australia has a variable               decades, hot days and nights have       For other extreme weather events
climate with many extremes             become more frequent, more intense      such as tropical cyclones, there
With its iconic reference to           and longer lasting in tandem with       are not yet sufficient good quality
‘droughts and flooding rains’,         decreases in cold days and nights       observational data to make
Dorothea Mackellar’s 1904 poem         for most regions of the globe.          conclusive statements about past
My Country highlights the large        Since records began, the frequency,     long-term trends. However, as              above: Flooding in Darwin, NT, following
                                       duration and intensity of heatwaves     the climate continues to warm,             tropical cyclone Carlos in 2011. Photo:
natural variations that occur in
                                       have increased over large parts of      intensification of rainfall from           Charles Strebor
Australia’s climate, leading to
extremes that can frequently           Australia, with trends accelerating     tropical cyclones is expected.
cause substantial economic and         since 1970.                             Recent scientific advances now
environmental disruption. These        Because a warmer atmosphere             allow us to begin ascribing changes
variations have existed for many       contains more moisture, rainfall        in the climate system to a set of
thousands of years, and indeed         extremes are also expected to           underlying natural and human
past floods and droughts in many       become more frequent and intense        causes. For example, it is now
regions have likely been larger than   as global average temperatures          possible to estimate the contribution
those recorded since the early 20th    increase. This is already being         of human-induced global warming                        hot extremes threshold

century. This high variability poses   observed globally: heavy rainfall       to the probabilities of some kinds

                                                                                                                        Temperature
great challenges for recording         events over most land areas have        of extreme events. There is a
and analysing changes in climate       become more frequent and intense        discernible human influence in the
extremes not just in Australia,        in recent decades, although these       observed increases in extremely
but the world over. Nevertheless,      trends have varied notably between      hot days and heatwaves. While
some changes in Australia’s climate    regions and seasons. In southern        the record high temperatures of
extremes stand out from that           Australia, for example, the frequency   the 2012/2013 Australian summer
background variability.                of heavy rainfall has decreased in      could have occurred naturally, they
                                       some seasons. While there is no clear   were substantially more likely to                                 cold extremes threshold
Human-induced climate                  trend in drought occurrence globally,   occur because of human influences
change is superimposed on              indications are that droughts have      on climate. By contrast, the large
natural variability                    increased in some regions (such as      natural variability of other extremes,                                                      Time
In a warming climate, extremely cold   southwest Australia) and decreased      such as rainfall or tropical cyclones,
days occur less often and very hot     in others (such as northwest            means that there is still much less       Figure 5.1: Temperature extremes change as average temperature increases. In this
days occur more often (Figure 5.1).    Australia) since the middle of the      confidence in how these are being         schematic illustration, the increase in average temperature is shown by the sloping line
                                       20th century.                           affected by human influences.             on the right. The idealised temperature time series has similar variability throughout the
These changes have already been
                                                                                                                         whole record. In the latter part of the record, the hot extremes threshold is exceeded
observed. For example, in recent                                                                                         progressively more frequently. Source: Working Group for this document.

20 | The science of climate change
You can also read