HATE CRIME REPORT 2019 - Los Angeles County Commission on Human Relations - Los Angeles Human Relations ...
←
→
Page content transcription
If your browser does not render page correctly, please read the page content below

Los Angeles County
Commission on Human Relations

2019
HATE CRIME
REPORT

2019 Los Angeles County Hate Crimes

Central/South Central L.A.             San Fernando Valley                     Hollywood/West Hollywood

In addition to the hate crimes shown on these maps, there are crimes that are not      Maps by Florentino Bernal Jr.
displayed due to insufficient address information.
2019 HATE CRIME REPORT                                                             1

                                                                      2019 HATE CRIME REPORTLOS ANGELES COUNTY COMMISSION ON HUMAN RELATIONS
              Los Angeles County Board of Supervisors
            Kathryn Barger, Chair    Fifth District
                    Hilda L. Solis   First District
            Mark Ridley-Thomas       Second District
                    Sheila Kuehl     Third District
                     Janice Hahn     Fourth District

                       County of Los Angeles
                 Fesia Davenport     Acting Chief Executive Officer

Department of Workforce Development, Aging, and Community Services
                  Otto Solórzano     Acting Director

                  Commission on Human Relations
        Guadalupe Montaño, Ed.D      President
                    Ilan Davidson    Vice President/Secretary
                  Derric Johnson     Vice President
                   Fredrick Sykes    Vice President
         Sandra E. Thomas, Ph.D.     Vice President
        Jarrett Tomas Barrios, Esq. Jeanette Ellis-Royston
          Michael Gi-Hao Cheung Porter Gilberg
                 Kathleen Domingo Isabelle Gunning, Esq.
                       Adrian Dove Preeti P. Kulkarni
                            Samuel Liu, Esq.

                         Honorary Member
                           Philip R. Valera

                 Human Relations Commission Staff
                   Pierre Arreola Josh Parr
                   Roland Gilbert Gustavo Partida
                   April Johnson Fidel Rodriguez
             Mónica Lomeli, Ph.D. Sharon Williams
                Grace Löwenberg Jaye Winter
                           Marshall Wong
            Ray Regalado, Human Services Administrator I
             Robert Sowell, Assistant Executive Director
               Robin S. Toma, Esq., Executive Director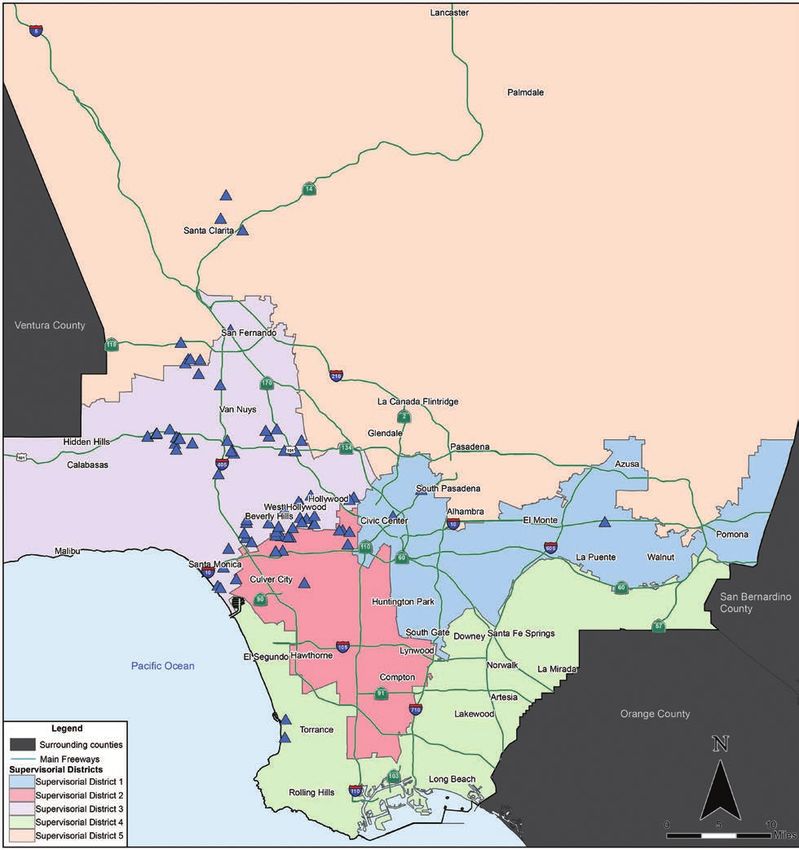
Table of Contents
          2                                                                Preface.....................................................................................................................................................................................................3
                                                                           What is a Hate Crime? .......................................................................................................................................................................3
                                                                           Underreporting of Hate Crimes ........................................................................................................................................................4
LOS ANGELES COUNTY COMMISSION ON HUMAN RELATIONS 2019 HATE CRIME REPORT

                                                                           Hate Crime and Human Rights .........................................................................................................................................................5
                                                                           2019 Quick Facts ..................................................................................................................................................................................6
                                                                           Executive Summary .............................................................................................................................................................................8
                                                                           2019 Hate Crimes in Perspective .....................................................................................................................................................9
                                                                           Documenting, Responding to, and Preventing Bias-Motivated Hostility............................................................................. 21
                                                                           A Closer Look at Racial Hate Crimes ........................................................................................................................................... 23
                                                                           A Closer Look at Sexual Orientation Hate Crimes ................................................................................................................... 30
                                                                           A Closer Look at Religious Hate Crimes...................................................................................................................................... 34
                                                                           A Closer Look at Gender Hate Crimes......................................................................................................................................... 38
                                                                           A Closer Look at Disability Hate Crimes .....................................................................................................................................40
                                                                           Hate Crime Prosecutions ................................................................................................................................................................. 41
                                                                           Review of 2019–2020 Hate Crime Legislation .......................................................................................................................... 42
                                                                           Methodology ......................................................................................................................................................................................44
                                                                           Appendix A: Hate Crimes by Service Planning Areas ............................................................................................................. 45
                                                                           Appendix B: Reporting Agencies ................................................................................................................................................... 47
                                                                           Acknowledgements ..........................................................................................................................................................................48

                                                                           Maps
                                                                           2019 Los Angeles County Hate Crimes ..........................................................................................................Inside Front Cover
                                                                           2015–2019 Gang-Related Hate Crimes ........................................................................................................................................ 19
                                                                           2019 Los Angeles County Hate Crimes Motivated by Race/Ethnicity/National Origin ................................................ 23
                                                                           2019 Los Angeles County Hate Crimes Motivated by Sexual Orientation ........................................................................ 30
                                                                           2019 Los Angeles County Hate Crimes Motivated by Religion ............................................................................................ 34
                                                                           Los Angeles County Service Planning Areas .............................................................................................................................. 45
                                                                           2014–2019 Los Angeles County Hate Crimes ........................................................................................................................... 49

                                                                           Charts
                                                                           Total Number of Reported Hate Crimes by Year ........................................................................................................................10
                                                                           Hate Crimes by Motivation .............................................................................................................................................................10
                                                                           Groups Targeted in Hate Crimes .....................................................................................................................................................11
                                                                           2009–2019 Hate Crimes: Most Frequently Targeted Groups ................................................................................................ 12
                                                                           2015–2019 Hate Crimes: Average Rates of Violence in Crimes Targeting Selected Groups .......................................... 12
                                                                           Hate Crimes by Criminal Offense .................................................................................................................................................. 13
                                                                           Hate Crimes by Location .................................................................................................................................................................. 15
                                                                           Hate Crimes Involving Gangs or White Supremacist Ideology .............................................................................................. 16
                                                                           Black-Latino/a Hate Crimes in 2018–2019 .................................................................................................................................. 18
                                                                           2009–2019 Hate Crimes: Known Suspects by Age .................................................................................................................20
                                                                           Los Angeles County Population by Race/Ethnicity .................................................................................................................. 25
                                                                           Racial Hate Crimes by Known Targeted Group ......................................................................................................................... 25
                                                                           Racial Hate Crimes by Criminal Offense ..................................................................................................................................... 26
                                                                           Rates of Violence for Victims of Racial Hate Crime ................................................................................................................. 27
                                                                           Sexual Orientation Hate Crimes by Criminal Offense .............................................................................................................. 31
                                                                           Sexual Orientation Hate Crimes by Known Victim Race/Ethnicity ..................................................................................... 32
                                                                           Religious Hate Crimes by Targeted Group .................................................................................................................................. 35
                                                                           Religious Hate Crimes by Criminal Offense ............................................................................................................................... 36
Preface                                                                                                                           3

                                                                                                                          2019 HATE CRIME REPORTLOS ANGELES COUNTY COMMISSION ON HUMAN RELATIONS
S  ince 1980, the Los Angeles County Commission on Human Relations has compiled, analyzed, and produced
   an annual report of hate crime data submitted by sheriff and city police agencies, educational institutions, and
community-based organizations.

Using information from the report, the Commission sponsors a number of ongoing programs related to preventing
and combating hate crime, including the Network Against Hate Crime and the LA vs Hate program. L.A. County
is one of the best trained jurisdictions in hate crime investigation and prosecution, and the Commission produces
one of the longest-standing reports in the nation documenting hate crime.

The report has been disseminated broadly to policy-makers, law enforcement agencies, educators, and
community groups throughout Los Angeles County and across the nation in order to better inform efforts to
prevent, detect, report, investigate, and prosecute hate crimes.

What is a Hate Crime?
A   ccording to California state law, hate crime charges may be filed when there is evidence that bias, hatred, or
    prejudice based on the victim’s real or perceived race/ethnicity, religion, ancestry, national origin, disability,
gender, or sexual orientation is a substantial factor in the commission of the offense.

This definition is codified in the California penal code sections 422.55 to 422.95 pertaining to hate crime.
Evidence of such bias, hatred, or prejudice can be direct or circumstantial. It can occur before, during, or after the
commission of the offense.

Hate speech is a criminal offense when the perpetrator has threatened violence with spoken or written words
against a specific person or group of persons. The threat must be immediate, unconditional and unequivocal.
It must also cause the victim sustained fear. Frequently, derogatory words or epithets are directed against a
member of a protected class, but no violence is threatened. Such hate incidents are important indicators of
intergroup tensions. They are not, however, criminal offenses. Such language is protected by free speech rights set
forth in the California and U.S. constitutions.

Graffiti is a hate crime when it is disparaging to a class of people protected by hate crime laws. This is most often
indicated by the use of epithets or hate group symbols or slogans. To be a hate crime, graffiti must be directed at a
specific target. For example, racial graffiti on a freeway overpass that does not address itself to a particular person
is vandalism, and therefore illegal, but probably not considered a hate crime. Vandalism of a house of worship
or of an ethnic, religious, or gay and lesbian organization may be investigated as a hate crime in the absence of
evidence of other motives.
4
                                                                           Underreporting of Hate Crimes
LOS ANGELES COUNTY COMMISSION ON HUMAN RELATIONS 2019 HATE CRIME REPORT

                                                                           T   he U.S. Department of Justice reported that 54% of hate-motivated incidents, including hate crimes, were
                                                                               not reported to law enforcement during 2011-2015.* This result was obtained from the department’s Bureau
                                                                           of Justice Statistics National Crime Victimization Survey. According to the survey, most of the incidents were not
                                                                           reported to law enforcement because they were handled in another way.

                                                                           In addition, survey respondents identified the following beliefs as other reasons hate-motivated incidents were not
                                                                           reported to law enforcement:

                                                                           • Incident was not important enough to be reported to police

                                                                           • There was nothing police could do to help

                                                                           • Police would not want to be bothered or to get involved

                                                                           • Reporting the incident would bring more trouble for the victim

                                                                           Other factors that may inhibit victims from reporting hate crimes include fear of retaliation, cultural and linguistic
                                                                           isolation, unfamiliarity with the criminal justice system, and previous negative experiences with law enforcement.
                                                                           For LGBT hate crime victims who are not “out” to their families, employers or neighbors there may also be fear of
                                                                           unwanted publicity that would disclose their sexual orientations or gender identities.

                                                                           It is important to keep in mind, as well, that there is not consistent uniformity in the ways that law enforcement
                                                                           agencies identify hate crime. This may be due to a variety of reasons. There are differences in priorities and
                                                                           training among different agencies, for example. Crimes with multiple motivations or involving gangs may not be
                                                                           formally identified as hate crimes. There is an additional burden on investigating detectives to identify and confirm
                                                                           evidence of hate motivation. Hate-motivated violence that occurs in schools, jails, and juvenile detention facilities,
                                                                           including large-scale racial brawls, may not be formally identified as hate crimes. In some cases, there may be
                                                                           reluctance to contribute to possible negative publicity for a neighborhood or municipality.

                                                                           It is reasonable, therefore, to conclude that the hate crimes documented in this report likely represent only a
                                                                           portion of hate crimes actually committed in 2019.

                                                                           *U.S. Department of Justice, Office of Justice Programs, Bureau of Justice Statistics, Special Report: Hate Crime Victimization Statistical Tables,
                                                                           2014 – 2015 June 2017.
Hate Crime and Human Rights                                                                                                     5

H

                                                                                                                         2019 HATE CRIME REPORTLOS ANGELES COUNTY COMMISSION ON HUMAN RELATIONS
     ate crimes are not only illegal under state and federal laws, they also violate human rights as defined by the
     international community.

In the aftermath of World War II, leaders from many nations came together in 1948 to establish the Universal
Declaration of Human Rights (UDHR). Among the principles included in this declaration are affirmations that
all human beings are equal in dignity and rights and no one is to be subject to torture or to cruel, inhuman or
degrading treatment. Groups and nations around the world continue to work diligently to turn the UDHR’s
powerful principles into action.

Since 1965, the U.S. and 176 other nations have signed the International Convention on the Elimination of All
Forms of Racial Discrimination (CERD), which compels signatory nations to combat racial and national origin
discrimination. Under this treaty, hate crimes are considered serious human rights abuses. The CERD Committee
has stressed that government action as well as inaction can violate CERD, and there is no excuse for complacency
or indifference by a government toward either public or private discrimination, particularly when it involves
violence.

 When the U.S. and 167 other nations signed the International Covenant on Civil and Political Rights (ICCPR),
they committed to respect and fulfill the right to life and the security of the person regardless of race, color, sex,
language, religion, political or other opinion, national or social origin, property, birth, or other status.

 The U.S. Constitution states that the Constitution and treaties are the supreme law of the land. Thus, all levels
of government in the U.S. – including counties, cities, and school districts – and individuals have a duty to uphold
these treaty obligations to address discrimination in any form, including hate crime.

Human Rights First (www.humanrightsfirst.org/discrimination) suggests the following strategies for responding to
hate crime:

• Acknowledge and condemn hate crimes whenever they occur. Senior leaders should send immediate, strong,
  public, and consistent messages that violent hate crimes—including against migrants, refugees, and asylum
  seekers—will be investigated thoroughly and prosecuted to the full extent of the law.

• Strengthen enforcement and prosecute offenders. Governments should ensure that those responsible for hate
   crimes are held accountable under the law and that the prosecution of hate crimes against any individuals
   regardless of their legal status in the country is a priority for the criminal justice system.

• Develop educational and transformative approaches, particularly restorative justice mechanisms, for hate crime
   offenders. Governments need to use effective methods to heal communities and reduce recidivism.

• Monitor and report on hate crimes. Governments should maintain official systems of monitoring and public
  reporting to provide accurate data for informed policy decisions to combat hate crimes.

• Reach out to community groups. Governments should conduct outreach and education to communities to
   reduce fear and assist victims, advance police-community relations, encourage improved reporting of hate
   crimes to the police, and improve the quality of data collection by law enforcement bodies.
6
                                                                           2019 Quick Facts
LOS ANGELES COUNTY COMMISSION ON HUMAN RELATIONS 2019 HATE CRIME REPORT

                                                                                                                           Racial hate crimes
                                                                                                                  declined 9% and comprised
                                                                                                                      49% of all hate crimes.
                                                                                                                               47% targeted
                                                                                                                          African Americans.

                                                                                   Hate crimes remained
                                                                                     virtually unchanged,
                                                                              increasing from 523 to 524
                                                                                    in 2019. However, this
                                                                              represents a 36% increase
                                                                               since hitting a 30-year low
                                                                                                   in 2013.
                                                                                                                   Sexual orientation crimes
                                                                                                                  dropped 22% and made up
                                                                                                                19% of the total. 85% of these
                                                                                                                    crimes targeted gay men.

                                                                                                                               Go
                                                                                        Crimes targeting
                                                                                                                              Back!
                                                                           African Americans, Latino/as
                                                                              and whites decreased, but         There were 48 crimes in which
                                                                            anti-Asian crimes grew 32%           the suspects used specifically
                                                                                and anti-Middle Eastern         anti-immigrant language. This
                                                                                      crimes rose 142%.        is the second largest number of
                                                                                                               crimes reported with such slurs
                                                                                                              since this report started tracking
                                                                                                                      xenophobic slurs in 2001.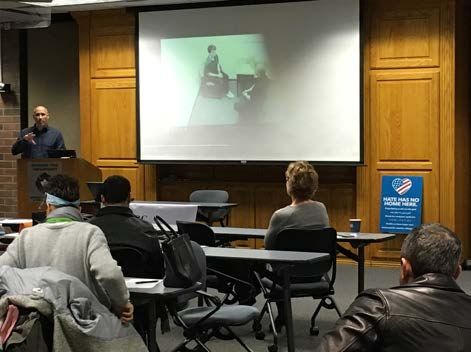
7

                                                                                   2019 HATE CRIME REPORTLOS ANGELES COUNTY COMMISSION ON HUMAN RELATIONS
                                        Hate crimes committed by
                                     gang members declined 37%.
      Anti-transgender crimes
                                     Anti-African American crimes
   rose 64% from 25 to 41, the
                                      committed by gang members
 largest number ever reported.
                                                  plummeted 72%.

                                        Religious crimes grew 11%
Violent hate crimes grew from       and constituted 19% of all hate
 61% to 65%, the highest rate       crimes. 89% were anti-Semitic.
     reported since 2008. 93%
   percent of gender-motivated                                   Antelope Valley

crimes were of a violent nature,                 San

 followed by sexual orientation
                                                 Fernando
                                                 Valley                 San
                                                                        Gabriel

        (79%), race (75%), and
                                                                        Valley
                                                  West   Metro

                religion (32%).                          South   East

                                                         South
                                                         Bay

                                       The largest number of hate
                                   crimes took place in the Metro
                                     Service Planning Area (SPA)
                                     followed by the San Fernando
                                       Valley SPA. However, if one
    After declining two years in       accounts for population, the
     a row, white supremacist      Metro SPA had the highest rate
          crimes jumped 38%.             followed by the West SPA.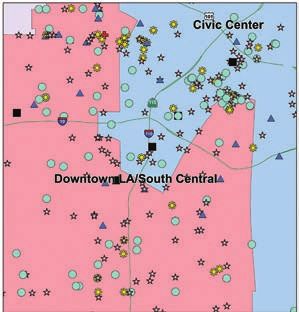
8
                                                                           Executive Summary
LOS ANGELES COUNTY COMMISSION ON HUMAN RELATIONS 2019 HATE CRIME REPORT

                                                                           T   he Los Angeles County Commission on Human Relations (Commission) has produced an annual Hate Crime
                                                                               Report since 1980, one of the longest running reports of its kind in the nation. Hate crimes are serious violations
                                                                           of state, federal, and international law. The Commission collects reports from every law enforcement agency in Los
                                                                           Angeles County, as well as from some colleges, school districts, and community-based organizations, and directly
                                                                           from victims (see Reporting Agencies).
                                                                           Yet, hate crimes documented in this and other reports represent only a portion of hate crimes actually committed
                                                                           in 2019. The U.S. Justice Department reported in 2017 that more than half of all hate-motivated incidents, including
                                                                           hate crimes, were not reported to law enforcement during 2011-2015 (see Underreporting of Hate Crimes).

                                                                           Significant findings of this report include:
                                                                           • There were 524 hate crimes reported in the County in 2019, compared to 523 the previous year. This is the
                                                                             largest number reported since 2009. For the past 6 years, hate crimes have been trending upwards and since 2013
                                                                             there has been a 36% rise (see 2019 Hate Crimes in Perspective).
                                                                           • The overall rate of violence increased from 61% to 65%, the highest rate reported since 2007 (see 2019 Hate
                                                                             Crimes in Perspective).
                                                                           • Anti-transgender crimes increased 64% from 25 to 41, the largest number ever reported. Ninety-three percent
                                                                             were of a violent nature (see A Closer Look at Gender Hate Crimes).
                                                                           • After declining 2 years in a row, hate crimes containing evidence of white supremacist ideology increased 38%
                                                                             in 2019, constituting 22% of all hate crimes. Seventy percent of these were acts of vandalism (see 2019 Hate
                                                                             Crimes in Perspective).
                                                                           • African Americans were again the largest group of victims. African Americans only comprise 9% of L.A. County
                                                                             residents but make up 47% of racial hate crime victims. African Americans were also over-represented as victims
                                                                             of sexual orientation and anti-transgender crimes (see A Closer Look at Racial Hate Crimes).
                                                                           • Religious crimes grew 11% from 97 to 105 and comprised 19% of all hate crimes. The overwhelming majority
                                                                             (89%) of these crimes were anti-Jewish (see A Closer Look at Religious Crimes).
                                                                           • After rising for 4 years, anti-Latino/a* crimes declined 22% and constituted 25% of all racial hate crimes.
                                                                             Latino/as were the most likely of any racial/ethnic group to be victims of violent racially-motivated crime (88%).
                                                                             Suspects used anti-immigrant slurs in 48% of these cases (see A Closer Look at Racial Hate Crimes).
                                                                           • Crimes targeting gay men, lesbians, and LGBT organizations declined 22% and comprised 19% of all reported
                                                                             hate crimes. Gay men were targeted in 84% of these crimes. Seventy-nine percent of these crimes were of a
                                                                             violent nature, a rate higher than those motivated by race (75%) or religion (32%) (see A Closer Look at Sexual
                                                                             Orientation Crimes).
                                                                           • There were 48 crimes in which the suspects used specifically anti-immigrant language. This is the second
                                                                             largest number of crimes reported with such slurs since this report started tracking xenophobic slurs in 2001.
                                                                           • The largest number of hate crimes took place in the Metro Service Planning Area (SPA) followed by the San
                                                                             Fernando Valley SPA. The Metro SPA had the highest rate followed by the West SPA (see Hate Crimes by Service
                                                                             Planning Area).
                                                                           • Hate crimes committed by gang members declined 37%. Anti-black crimes committed by gang members fell
                                                                             72% (see 2019 Hate Crimes in Perspective).
                                                                           By providing the extensive information contained in this report on hate crimes in Los Angeles County, the
                                                                           Commission helps law enforcement as well as educational, community, governmental, and faith-based agencies to
                                                                           more effectively prevent and respond to this serious violation of human rights.

                                                                           *In traditional Spanish, the masculine noun “Latino” is used to refer to men and women of Latin American heritage. “Latino/a” is an alternative
                                                                           term that is more gender-inclusive.
2019 Hate Crimes in Perspective 9
2019 HATE CRIME REPORTLOS ANGELES COUNTY COMMISSION ON HUMAN RELATIONS
The release of this report coincides with several unprecedented events:
• A pandemic that has taken the lives of more than 200,000 Americans and sparked a backlash against Asians
who have been blamed for the spread of coronavirus. A website (stopaapihate.com) created by the Asian Pacific
Planning and Policy Council (A3PCON) and Chinese for Affirmative Action documented nearly 1,900 incidents of
verbal harassment, shunning, physical assaults, and discrimination between its official launch on March 19, 2020
and May 13, 900 cases in California alone.
• An unprecedented outpouring of grassroots political protest sparked by Black Lives Matter in the aftermath of the
May 25 choking death by police officers of George Floyd, a 46-year-old African American man in Minneapolis.
Literally millions of Americans of all backgrounds have taken to the streets protesting his death and those of other
unarmed African Americans. As a result, in a matter of a few weeks terms like “white supremacy and privilege,”
and “systemic racism” previously used mainly by activists entered the lexicon of mainstream journalists and
elected officials.
• A bitter Presidential Election that reflects deep divisions and racial and political polarization.
It is important to keep in mind, though, that this report exclsively covers calendar year 2019. The impact of these
current events will be more apparent in next year’s report on 2020 hate crimes.
Hate Crimes Remain Elevated in Los Angeles County
R eported hate crime in Los Angeles County increased by a single case in 2019, from 523 to 524. Although this
was the largest total reported since 2009, hate crimes have been flattening over the past few years. The previous
year they rose only 2.9%. The number of hate crimes had been declining for many years and hit a 23 year-low in
2013 but has been slowly rising since then. The 524 hate crimes reported in 2019 represented a 36% increase since
2013, but it’s important to note that the greatest growth occurred between 2013-16, prior to President Trump taking
office. Still, the 2019 count is well below the numbers reported most years between 1990 and 2009 (see table on
page 10).
By contrast, the California State Attorney General reported that the number of hate crime events* through-out
the state decreased 4.8% from 1,066 in 2018 to 1,015 in 2019. Interestingly, the number of hate crime victims in
California grew 0.8% percent from 1,237 to 1,247.
At the time of this report’s publication, the FBI had not released national hate crime statistics for 2019.
It can be helpful to consider the number of hate crimes in the context of overall crime statistics. With regard to
general crime statistics, the Los Angeles County Sheriff’s Department documented a 6% decline in Part I crime
and a 6% increase in Part II crime in 2019. The Los Angeles Police Department documented a 6% decrease in
Part I crime and a 7% decline in Part II crime. Part I Crimes, as defined by the Federal Bureau of Investigation (FBI),
are: criminal homicide, forcible rape, robbery, aggravated assault, burglary, larceny theft, grand theft auto, and arson.
Part II Crimes, as defined by the Federal Bureau of Investigation (FBI), include: sex offenses (both felonies and
misdemeanors), non-aggravated assaults, weapons laws, disorderly conduct, and vandalism.
*As stated in the Methodology section, this report counts the number of hate crime victims, not events.Total Number of Reported Hate Crimes by Year
1,200 —
10
1,031
1,000 —
LOS ANGELES COUNTY COMMISSION ON HUMAN RELATIONS 2019 HATE CRIME REPORT
933
859
804
800 — 763
729
691
632
596 593
600 —
502 489 508 523 524
462 484 482
427
400 — 384 390
200 —
0—
1999 2000 2001 2002 2003 2004 2005 2006 2007 2008 2009 2010 2011 2012 2013 2014 2015 2016 2017 2018 2019
Reported hate crimes rose in the 1990s, following adoption of legislation by the California State
legislature in 1989 that mandated law enforcement to record and report hate crimes.
Hate Crimes by Motivation Percentage Percentage
of Total Change
■ 2019 ´■ 2018 2019 from 2018
Race/ 262
Ethnicity/ 49% -9%
National Origin 287
105
Religion 19% 11%
95
101
Sexual 19% -22%
Orientation 130
44
Gender 8% 76%
25
25
Unknown* 5% 257%
7
3
Disability 1% N/A
0
0 50 100 150 200 250 300
* These were primarily cases of vandalism that used hate symbols and the motivation could not be
determined. Note: Some cases contained multiple motivations. The total number of motivations
does not equal the total number of hate crime.Groups Targeted in Hate Crimes Percentage Percentage
of Total Change
■ 2019 ´■ 2018 2019 from 2018 11
125
Black 24% -13%
2019 HATE CRIME REPORTLOS ANGELES COUNTY COMMISSION ON HUMAN RELATIONS
144
Lesbian, Gay Male, 101
Bisexual and LGBT 19% -22%
(non-specified)* 129
93
Jewish 18% 18%
79
49
Mexican 9% -9%
54
41
Transgender 8% 64%
25
22
White 4% -15%
26
Latino/a 15
3% -40%
(non-specified)** 25
11
Chinese 2% 267%
3
Middle Easterner 9
2% 80%
(non-specified)** 5
8
Iranian 2% NA
0
7
Muslim 1% 75%
4
Asian/ 5
Pacific Islander 1% -55%
(non-specified)** 11
4
Armenian 1% 0%
4
4
Korean 1% 33%
3
4
Non-White 1% 33%
3
1
Christian12 2009–2019 Hate Crimes: Most Frequently Targeted Groups
300 —
LOS ANGELES COUNTY COMMISSION ON HUMAN RELATIONS 2019 HATE CRIME REPORT
250 —
200 — Black ■
150 —
Jewish ■
LGBT ■
100 —
Latino/a ■
50 —
0—
2009 2010 2011 2012 2013 2014 2015 2016 2017 2018 2019
2015–2019 Hate Crimes: Average Rates of Violence Against Selected Groups
Transgender 94%
LGBT 78%
Latino/a 76%
White 69%
Black 65%
Asian/
Pacific Islander 63%
Jewish 22%
0% 10% 20% 30% 40% 50% 60% 70% 80% 90% 100%Hate Crimes by Criminal Offense Percentage Percentage 13
of Total Change
■ 2019 ´■ 2018 2019 from 2018
2019 HATE CRIME REPORTLOS ANGELES COUNTY COMMISSION ON HUMAN RELATIONS
152
Vandalism 29% -11%
170
143
Simple 27% 6%
Assault
135
102
Aggravated 19% 20%
Assault
85
85
Intimidation 16% 10%
77
Disorderly 20
4% 0%
Conduct 20
7
Robbery 1% 0%
7
5
Burglary 1% 25%
4
0 50 100 150 200
In 2019, there were also 3 cases of trespassing, 2 cases of arson and sexual assault, and single
cases of attempted murder, and theft.
Racial and Sexual Orientation Crimes Decline but Religious and Gender Crimes Rise
T he distribution of hate crimes based on motivation shifted slightly from the patterns of the previous five years.
Crimes based on real or perceived race, ethnicity, or national origin* remained by far the largest category,
constituting 49% of all hate crimes, compared to 53% the previous year. Racial hate crimes declined 9% from
287 to 262. Throughout the history of this report, sexual orientation crimes have nearly always been the second
largest motivation category, but in 2019 religious crimes exceeded them. Religious crimes grew 8% from 95 to
105 and comprised 19% of all hate crimes. Sexual orientation crimes dropped 22% from 130 to 101 and because
of rounded numbers also made up 19% of the total (down from 24%). Gender-based crimes constituted the
fourth largest group (8%) and grew 76% from 25 to 44. This was the largest number of gender-motivated crimes
in this report’s history. Forty-one of these crimes targeted transgender persons and 3 were anti-female. There
were 3 disability crimes compared to none the previous year. There were also 25 crimes in which the motive was
undetermined (up from 7). These cases most commonly were swastikas painted on the property of white, non-
Jewish victims. It is possible that these acts of vandalism were random and did not target any of the property
owners. These crimes could also have been cases of mistaken identity. This report classifies these crimes as
having “unknown” motivation.
*For the sake of brevity, we refer to crimes motivated by race, ethnicity, or national origin as “racial” hate crimes throughout this report.14 As in the past, the great majority of hate crimes (73%) targeted four groups: African Americans, gay men/
lesbians/LGBT organizations, Jewish persons, and Latino/as. The previous year these four groups constituted 83%
of all victims. Each of these communities experienced decreases except anti-Jewish crimes, which rose 18% from
LOS ANGELES COUNTY COMMISSION ON HUMAN RELATIONS 2019 HATE CRIME REPORT
79 to 93. This is the largest number of anti-Semitic hate crimes reported since 2009.
Of the smaller groups of victims, a few experienced increases in hate crimes. Anti-transgender crimes rose 64%
from 25 to 41, the largest number ever reported. Anti-Asian crimes grew 32% from 19 to 25 and anti-Middle
Eastern crimes grew 143% from 7 to 17 (including 1 case that had 5 victims).
As mentioned in the Methodology section, fluctuations in numbers from year to year are common and don’t
necessarily indicate trends. It is more useful to study multi-year analyses to get an accurate picture of hate crime
in Los Angeles County.
Highest Rate of Violence since 2007
T he most common criminal offense reported in 2018 was vandalism (29%) followed by simple assaults
(27%), aggravated assaults (19%), and acts of intimidation (16%). These 4 offenses comprised 92% of all
hate crimes, similar to earlier years. The biggest changes were that aggravated assaults grew 20% and acts of
vandalism dropped 11%.
For the second year in a row the percentage of hate crimes that were of a violent nature rose. They grew from 61%
to 65%. This is the highest rate of violence reported since 2007, and the 343 violent crimes reported in 2019 is
the largest number since 2008. In 2018, there were no murders but there was 1 attempted murder.
• In Lancaster, a Latino male was arguing with another Latino male on a bus. A black male victim asked the
suspect to stop. The suspect replied, “What are you going to do about it, Nigger?” The two began to argue
and started fighting. The suspect pinned the victim to the front windshield of the bus, pulled out a knife and
stabbed the victim multiple times in the face while calling him a “Nigger.” The suspect was arrested by sheriff’s
deputies. The victim was transported to a hospital with several deep lacerations in his head, neck and face.
As in previous years, there were dramatically different rates of violence based on motivation. Ninety-three percent
of gender-motivated crimes were violent, followed by sexual orientation (79%), race (75%), and religion (32%).
Racial crimes saw the largest jump in the rate of violence from 64% to 75%.
Hate Crimes Most Common in Public Places
T he largest number of hate crimes occurred in public places (38%), followed by residences (22%), businesses
(20%), schools (8%), and religious sites (7 %). The distribution was similar to the previous year but hate
crimes in religious sites increased 84% from 19 to 35. Hate crimes at residences declined 22% from 146 to 114.
Metro Region Again Has Highest Rate of Hate Crimes
T he largest number of hate crimes (124) reported in 2019 took place in the Metro Service Planning Area (SPA)
Region IV (which stretches from West Hollywood to Boyle Heights) followed by San Fernando Valley SPA
Region II (95). The previous year the largest number occurred in the San Fernando Valley SPA. However, if one
compares the populations of the regions to the numbers of reported hate crimes, the Metro SPA had the highest
rate followed by West SPA Region V (which includes Beverly Hills, Culver City and a number of affluent beachHate Crimes by Location Percentage Percentage
15
of Total Change
■ 2019 ´■ 2018 2019 from 2018
2019 HATE CRIME REPORTLOS ANGELES COUNTY COMMISSION ON HUMAN RELATIONS
195
Public Place 38% 1%
193
114
Residence 22% -22%
146
106
Business 20% 16%
91
42
School 8% 0%
42
35
Religious Site/ 7% 84%
Organization
19
Government/ 12
2% 9%
Public Building
11
Electronic 12
2% 9%
Communication
11
Community- 2
Based 0% 100%
Organization 1
0 50 100 150 200
communities). These two regions have had the highest rates for several years in a row. The region with the lowest
number of hate crimes (16) was the East SPA Region VII (which includes cities such as Huntington Park, South
Gate, and Whittier) followed by the Antelope Valley Region 1 (21). The areas with the lowest rates of hate crime
were the East SPA followed by San Gabriel SPA Region III. This geographic distribution is similar to previous years.
As stated earlier, African Americans, gay men/lesbians/LGBT organizations, Jewish persons, and Latino/as were
targeted in 74% of all reported hate crimes in 2019. The San Gabriel and East SPAs have extremely low numbers
of black residents, LGBT-oriented businesses, and Jewish religious sites or businesses. This could account for the
lower rates of hate crimes reported in those areas. More information on geographic distribution of reported hate
crimes is provided in Appendix A.16 White Supremacist Crime Jumped 38% Hate Crimes Involving Gangs
or White Supremacist Ideology
T his report has tracked hate crime in which there is evidence
LOS ANGELES COUNTY COMMISSION ON HUMAN RELATIONS 2019 HATE CRIME REPORT
of white supremacist ideology since 2004. Usually, these are
crimes in which swastikas and other hate symbols are used in
graffiti. Occasionally a suspect will yell out a white supremacist
slogan or self-identify as a skinhead or member of a specific hate White
Supremacist
group.
Ideology
In 2016, the year of the last presidential election, white 22%
supremacist crimes rose 67% in Los Angeles County from 63 Gangs
to 105. They then declined 11% in 2017 and another 10% in 6%
Other
2018. In 2019, white supremacist crimes jumped 38% from 84 72%
to 116. They grew from 16% to 22% of all hate crimes. There
was evidence of white supremacist belief systems in 47% of all
religious crimes and 16% of racial crimes.
The largest group of white supremacist crimes were motivated
by religion (53%), followed by race (44%) and sexual In 2019, 4 cases were both gang-related and
orientation (3%). It should be noted that these percentages do had evidence of white supremacist ideology.
not include white supremacist crimes in which the motivation
was unknown. These would include crimes in which a hate
symbol was left on public or private property but it was unclear what group was being targeted.
Jewish persons were the most frequently targeted group (51%), followed by African Americans (28%) and Latino/
as (6%). The increase in anti-black white supremacist crimes was 23%.
The great majority of these crimes were acts of vandalism (70%), followed by acts of intimidation (11%) and
disorderly conduct and aggravated assaults (7% each). Acts of disorderly conduct include cases in which
swastikas are drawn on private property but do not constitute vandalism because they are easily removable and
leave no permanent damage. The rate of violence in white supremacist crimes grew from 10% to 21%.
Residences were the most common location (25%), followed closely by public places (24%), schools (22%),
businesses (15%), and religious sites (7%).
Crimes Related to Terrorism or Conflict in the Middle East
S ince the attacks on September 11, 2001, this report has examined hate crimes in which the perpetrators used
language that blamed the victims for terrorism or ongoing conflict in the Middle East. During the period
immediately following 9/11, there were 188 reported anti-Muslim/Middle Eastern hate crimes committed in Los
Angeles County. Since that time, crimes fitting this profile have plummeted locally even though Muslims, South
Asians, and Middle Easterners still report harassment, racial/religious profiling, and discrimination. However, in
recent years, several reports have been issued that suggest there is a rise in Islamophobia. For example, the FBI
reported anti-Muslim hate crimes in the United States rose 67%, from 154 to 257 in 2015, the highest number
since 9/11.
The Council on American-Islamic Relations (CAIR), the nation’s largest Muslim civil rights and advocacy
organization, issued a report showing anti-Muslim acts (non-criminal) rose 83% and anti-Muslim hate crimes
rose 21% nationwide in the second quarter (April-June) of 2018, as compared to the first quarter.
But surprisingly, crimes reported in LA County in which there was specific language regarding terrorism and/or
unrest in the Middle East decreased from 14 to 3 the previous year and in 2019 the number did not change. The
three crimes reported were actually 2 cases, 1 involving 2 victims. The following is a description of 1 of those cases:• Two victims received a letter at their business that stated “(You) bring your filth immoral Muslim Jihad hate!” It 17
also stated “We know you are dishonest, cheat our community and want to be here for terrorism. You are being
watched ...You’re going to die.” The letter also included racial slurs such as “Sand Nigger” and “Camel jockey.”
2019 HATE CRIME REPORTLOS ANGELES COUNTY COMMISSION ON HUMAN RELATIONS
In addition to the three crimes that specifically referenced Middle East conflict, there were nine other anti-Muslim
and /or anti-Middle Eastern crimes. Although these contained no specific slurs like “terrorist,” it is possible that
the perpetrators were motivated by such sentiments.
Hate Crimes Between African Americans and Latino/as
T he great majority of African Americans and Latino/as in Los Angeles County co-exist peacefully and are not
involved in ongoing racial conflict. However, for many years this report has documented that most hate crimes
targeting African Americans are committed by Latino/as and vice versa. This is particularly true in neighborhoods
that have undergone rapid demographic shifts from being primarily black to majority Latino/a. Another factor
driving this phenomenon is the large number of Latino/a street gangs which have ties to the Mexican Mafia, the
largest and most violent prison-based gang. The Mexican Mafia has been feuding with black inmates for decades
and has encouraged their affiliated street gangs to drive African Americans out of their neighborhoods.
There was a major shift from this pattern in 2019. Anti-black crimes were most frequently committed by whites
(61%) and Latino/as (37%). The previous year, 55% of anti-black crimes were committed by Latino/as. Latino/a-
on-black crimes declined from 59 to 33, a 44% drop. This is the first time since this report started analyzing
victim-suspect racial associations 20 years ago that whites, not Latino/as, committed the largest number of anti-
black crimes.
Fifty percent of anti-Latino/a crimes were committed by African Americans compared to 53% in 2018. The
number of these crimes declined from 40 to 30, a 25% decrease.
A major factor in the decline of Latino/a-on-black crimes was a sharp decline in the number committed by gang
members.
In terms of gang involvement, of the 33 Latino/a-on-black hate crimes, only 5 were committed by gang members,
an 82% decrease. Another way to view this drop is that in 2018 gang members committed 47% of Latino/a-on-
black crimes compared to only 15% in 2019. Of the 30 black-on-Latino/a crimes, there was evidence of gang
involvement in only 10 cases or 33% of the total. The previous year gang members committed 9 of these crimes
but because the total number of black-on-Latino/a crimes declined, gang involvement rose from 23% to 33% of
the total.
Declining Gang Involvement
A fter increasing the previous year, hate crimes committed by gang members declined 37% from 51 to 32.
Gang members were responsible for 6% of all hate crimes (down from 10%) and 9% of racial hate crimes,
compared to 15% the previous year.
As a general rule, this report classifies suspects as gang members if they shout their affiliation during the
commission of an offense or include gang names or monikers in graffiti. This report does not label suspects as
gang members solely based on appearance or clothing. Therefore, it is likely that the actual number of gang
members who committed hate crimes is higher.
Reported hate crimes committed by gang members were overwhelmingly racially-motivated (75% compared to
86% in 2018) and they decreased 45% from 44 to 24. Sexual orientation crimes committed by gang members
comprised 19% of the total compared to 10% the previous year. There was a lone religious crime and one in which
the motivation was unknown.18 Anti-African American hate crimes Black-Latino/a Hate Crimes in 2018–2019
committed by gang members
plummeted 72% from 29 to 8. 70—
LOS ANGELES COUNTY COMMISSION ON HUMAN RELATIONS 2019 HATE CRIME REPORT
They constituted only 25% of gang-
related hate crimes compared to Total 2018: ■ Non-gang-related
60 — 59 ■ Gang-related
57% the previous year. They were
outnumbered by anti-Mexican
crimes which constituted 31% of 50 —
the total. Gay men were targeted Total 2018:
in 19% of the gang-related crimes 40
followed by Asian Indians and 40 — 53% Total 2019:
Chinese (6% each) and there were Total 2019: 33
30
lone crimes against African and 30 —
Jewish victims.
78%
Eighty-eight percent of crimes 20 — 67% 85%
committed by gang members
were of a violent nature, up from 47%
10 —
67% the previous year. The most
common criminal offenses were 33% 23%
15%
aggravated assaults (38%), 0—
followed by intimidation (31%), Latino/a- Latino/a- Black- Black-
on-Black on-Black on-Latino/a on-Latino/a
and vandalism and simple assaults
2018 2019 2018 2019
(13% each). This represented
increases in the percentages of
both aggravated assaults and acts
of intimidation.
Gang members committed hate crimes most frequently at residences (31%), followed by public places (28%),
businesses (19%), schools (13%), and government buildings (9%). This represented a sharp drop in the
percentage of crimes taking place in public places.
Latino/a suspects dropped from 70% to 39% and black suspects jumped from 26% to 43% of the total. White
suspects grew from 4% to 18%. This is the first time since this report bagan capturing data on gangs in 2006
that black gang member suspects outnumbered Latino/as.
List of Gangs involved in Hate Crimes
In 2019, there was evidence that members of the following gangs committed hate crimes: Armenian Power,
Bloods*, Crips*, Eastside Longos*, Hoover Street Crips, Latin Kings, Mara Salvatrucha (MS-13)*. Mariana
Maravilla, Mongols, Neighborhood Crips, PJ Watts Crips, Rolling 20s, Sangra, and Wicked Insane Diablos
Suspects
As in previous years, the suspects were overwhelmingly male (86%).
The largest group of suspects (37%) were adults age 26-40. This represented a decline of 30% compared to the
previous year. They were followed by suspects 40 or older (26%). Persons 18-25 comprised 27% of all suspects.
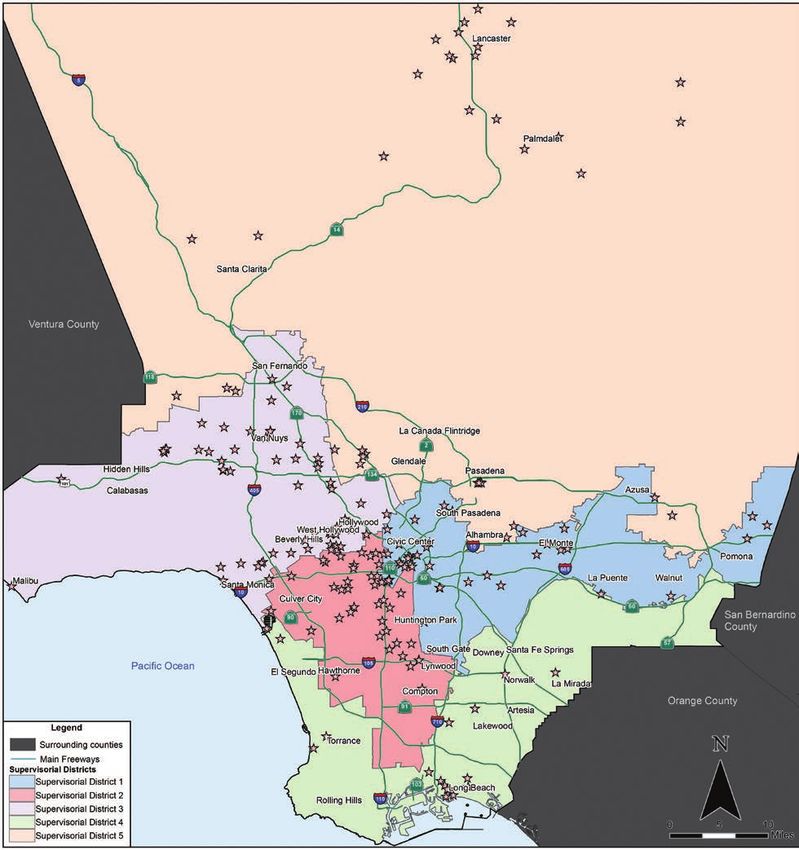
For the seventh year in a row, juveniles comprised the smallest group (9%).2015–2019 Gang-Related Hate Crimes 19
2019 HATE CRIME REPORTLOS ANGELES COUNTY COMMISSION ON HUMAN RELATIONS
In addition to the hate crimes shown on this map, there are crimes that are Map by Florentino Bernal Jr.
not displayed due to insufficient address information.
Hate Crimes Committed by Groups of Suspects
T his report tracks the number of hate crimes committed by multiple suspects. In 2019, in cases in which
suspects were identified, 83% of the crimes were committed by lone suspects, similar to the previous year.
In 10% of hate crimes there were 2 suspects, and in 5% there were 3. There was 1 crime involving a group of 8
suspects and 2 crimes in which the suspects numbered 15.
Following are brief descriptions of what occurred with these two cases with 15 suspects each.
• A Mexican couple was at a Colombian salsa dance when they saw a male friend attacked by a group of 15
Colombian men. When the wife asked why they were fighting, a suspect replied, “Because you’re fucking
Mexicans.” Then a suspect grabbed the wife by the hair and another suspect kicked her. The husband was
pushed to the ground and a suspect stepped on his ankle.20 2009–2019 Hate Crimes: Known Suspects by Age
60% —
■ Over 40´
LOS ANGELES COUNTY COMMISSION ON HUMAN RELATIONS 2019 HATE CRIME REPORT
■ 26–40
50% — ■ 18–25´
■ Under 18
40% —
30% —
20% —
10% —
0% —
2009 2010 2011 2012 2013 2014 2015 2016 2017 2018 2019
This graph depicts what percentage of suspects fell within different age groups each year.
• A Latina girl was dropped off by her grandparents at her family’s apartment at a housing development? She saw
15 young black males who’d harassed her family previously approach. Frightened, she ran home and locked the
door behind her. The suspects pounded on the door. The girl’s mother asked them to leave because they were
scaring her children. When they continued, the mother opened the door and told them to stop. A suspect, “You
Mexican bitch! You don’t belong here! This is PJ ‘hood!” He then threw a skateboard at her striking her head and
shoulder. The suspects then fled. The victim complained to police of pain to her head and shoulder.
Hate Crimes in Which Suspects Invoked the President’s Name
S ince 2016, this report has documented hate crimes in which President Trump’s name was invoked. Given that
the country has been increasingly polarized along the lines of race, sexual orientation, religion, and gender one
would have expected that the number of these might increase. They have, in fact, fallen each year.
In 2019 there were 4 crimes in which the suspect named the President and in 3 the victims were attacked and
called racial or religious slurs because they were perceived to be Trump supporters. In the 4th, a gay, white male
couple received an annoying phone call on their voice mail at home. An unknown caller said, “Why don’t you two
faggots put a bullet in your head because Trump hates faggots like you!”Documenting, Responding to, and 21
Preventing Bias-Motivated Hostility
2019 HATE CRIME REPORTLOS ANGELES COUNTY COMMISSION ON HUMAN RELATIONS
Working to transform prejudice into acceptance, inequity into justice, and
hostility into peace.
T he Los Angeles County Commission on Human Relations (LACCHR) was first established as a committee
by the County Board of Supervisors in January 1944, in response to what has been labelled as the “Zoot Suit
Riots,” three days of racially-motivated street violence during the previous June. For nearly 75 years, LACCHR and
its prior forms have been bringing people together across boundaries of difference to advance equity. We continue
to support, inform, train, and mobilize groups and organizations to replace prejudice and fear with respect and
trust in one of the most diverse regions in the world. These efforts are in service of LACCHR’s mission to promote
better human relations in Los Angeles County by working to transform prejudice into acceptance, inequity into
justice, and hostility into peace.
We are moved to action by our vision for a County where the fundamental rights of every person are met, all
people and groups are unrestricted in the pursuit of their full potential, conflicts are peacefully and equitably
resolved, and County government leads and models the highest level of respect for civil liberties and human rights,
safeguarding the intrinsic dignity of each individual.
Public displays of hate remind us of the ongoing challenge to fully realize this vision. In response to this challenge,
LACCHR continues to work to document, respond to, and prevent hate crime.
Assessment
T o adequately address bias-motivated hostility we must identify its roots, incidence, and impact. With this end
in mind, Commission staff members gather, verify, and disseminate accurate information about hate acts and
hostile situations that display prejudice. Since 1980, our assessment efforts have included this annual report that
compiles and analyzes hate crime data submitted by sheriff and city police agencies, educational institutions,
and community-based organizations. In September 2019, we began an anti-hate initiative which would become
the LA vs Hate program that contracts with 211LA to receive reports of hate incidents and hate crimes. Through
this initiative we also coordinate services to persons targeted by bias-motivated hostility. More information on
this element of the project is provided under “Coalition-Building” below. Analysis of hate act reports to 211 from
September through December 2019 identified 42 hate incidents and 11 hate crimes targeting people based on
perceived race/ethnicity, disability, sexual orientation, or gender.
Training
E ach year, Commission staff members speak on the scope and impact of bias-motivated hostility. In 2019,
these activities included training and other presentations to 211LA staff; the Beverly Hills Human Relations
Commission; the CA Law Enforcement Association of Records Supervisors; the Hate Violence Prevention
Partnership-LA (Bienestar, Brotherhood Crusade, California Conference for Equality and Justice, and the Muslim
Public Affairs Council); the International Association of Official Human Rights Agencies; the LA City Human
Relations Commission; the LA County Department of Workforce Development, Aging, and Community Services;
the Long Beach Immigrant Rights Coalition; the Long Beach LGBT Center; the Long Beach Trauma and Recovery
Center; the Network against Hate Crime; the Orange County Human Relations Commission; and Stonewall
Democrats. Presentations on hate crime in 2019 included press briefings for multiple English, Spanish-language,
Chinese, and Korean media organizations.22 In addition, Commission staff members are regularly engaged to design and deliver training that facilitates change
in underlying attitudes and overt behavior that, left unchecked, can lead to hate crime in their most extreme
expressions. We also lead training experiences to support advocacy for and build the capacity of groups frequently
LOS ANGELES COUNTY COMMISSION ON HUMAN RELATIONS 2019 HATE CRIME REPORT
targeted by hate crime. Topics we addressed in training during 2019 included equipping and engaging youth
as social justice leaders, environmental racism, gender and social justice, homophobia, immigration, managing
implicit bias, mediation, positive and effective responses to conflict, responding to public displays of hate, the
school-to-prison pipeline, strengthening cultural competence, and transphobia.
Coalition-Building
W hile hate crime is a concern for many different groups, strategic coordination and collaboration can multiply
their impact. We bring stakeholders together and help them take the fullest possible advantage of their
distinctive experiences, skills, and resources.
As part of this effort, LACCHR staff coordinates a countywide Network Against Hate Crime that includes
government representatives, law enforcement agencies, civil and human rights organizations, educators, faith
communities, and service groups. We also assembled and continue to support the Hate Violence Prevention
Partnership-LA that works to reduce and end hate violence by providing practitioners opportunities to share best
practices and exchange relevant and timely information. In 2019, as part of the new anti-hate initiative, we began
assembling a network of organizations to provide support and services to persons targeted by bias-motivated
hostility. Referrals to these organizations are provided by care coordinators for whom we contract with 211LA.
The LA vs Hate Rapid Response Network is made up of, Special Services for Groups (SSG), Anti-Defamation
League (ADL), Antelope Valley Partners for Health (AVPH), Asian Pacific Policy & Planning Council (A3PCON),
Coalition for Humane Immigrant Rights of L.A. (CHIRLA), Hate Violence Prevention Partnership of L.A.(HVPP-LA)
composed of Bienestar, Brotherhood Crusade, California Conference for Equality & Justice, and Muslim Public
Affairs Council, Not In Our Town (NIOT), San Fernando Valley Community Mental Health Center, Inc. Bullying &
School Violence Advocacy Program, Western Justice Center, 211-LA, and Taskforce PR.
In observance of the National Day of Racial Healing, a group of youth Award-winning ProPublica investigative reporter A.C. Thompson
justice leaders from across the Country participated in a dialogue on addresses the Network Against Hate Crime on the rise of violent
Deepening Racial Justice in Community Organizing. white nationalists.You can also read