Community Health Needs Assessment 2014 - 2016 - Advocate Health Care
←
→
Page content transcription
If your browser does not render page correctly, please read the page content below

Community Health
Needs Assessment
2014 – 2016
December 2016
Advocate Illinois Masonic Medical Center is honored to serve our community and committed to serving
its health needs. We look forward to addressing the issues identified in this Community Health Needs
Assessment (CHNA). We believe that collaborating with partners to assess health needs and collectively
addressing health issues will have the deepest impact on our community.
Beginning in 2015, Advocate Health Care and Illinois Masonic Medical Center were among the founding
organizations of the Health Impact Collaborative of Cook County (HICCC). HICCC is a national best practice
model of broad collaboration, funded by hospitals. The collaborative members include 26 hospitals,
7 health departments and nearly 100 community-based organizations working collectively on CHNAs for
the North, Central and South regions of Cook County. This CHNA is the result of active participation in the
HICCC’s North Region, along with aligning this work to the individual needs of Advocate Illinois Masonic
Medical Center’s primary service area.
In addition to the work with HICCC, Advocate Illinois Masonic Medical Center worked directly with
community leaders and formed a Community Health Council (CHC). For the community/public health
representatives on the council, special consideration was given to the geographic distribution of council
members as well as their representation of unique population groups in the region. Additionally, we
collected and analyzed key data for the communities that we serve. Together, all of these efforts guided
our work to identify those health issues of the highest priority.
Contained in this report, you will find we are focusing on three health issues: Chronic Disease Prevention/
Management, Behavioral Health, and Social Determinants of Health.
On behalf of Advocate Illinois Masonic Medical Center’s staff and Governing Council, I hope you find
this assessment an effective tool for improving the health of our community. If you would like more
information, please contact Lisa Kritz, Director Community Health at 773.296.5804.
Sincerely,

Susan Nordstrom Lopez
President
Advocate Illinois Masonic Medical Center
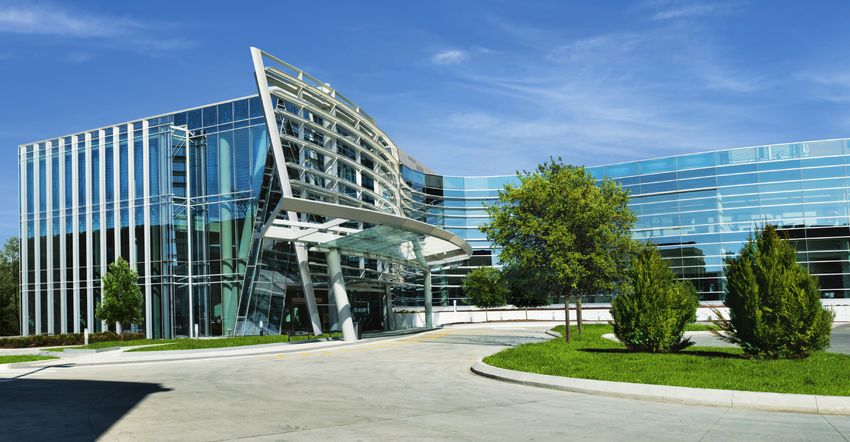
Table of Contents
I. Executive Summary 3

II. Description of Advocate Health Care and Advocate Illinois Masonic Medical Center 5

III. S
      ummary of the 2011-2013 Community Health Needs Assessment (CHNA)
     and Program Implementation 7
   7  Community Definition
   8  CHNA Process
   8  Needs Identified and Priorities Selected
   8  Summary of Program Strategies and Outcomes to Meet Identified Priorities
         8  Behavioral Health
              8  First Access
         8  Dental Health
              8  Mobile Dental Van
              9  Special Needs Dentistry Program
   9  Input from Community for 2011-2013 CHNA
   9  Lessons Learned from the 2011-2013 CHNA

IV. 2014-2016 Community Health Needs Assessment 10
   10  CHNA Community Definition
   12  Sociodemographic Description of PSA
         12  Race/Ethnicity
         15  Economic Disparities by Race/Ethnicity
         16  Income
         17  Education and Employment
         18  Health Insurance Coverage
         18  Socioeconomic Need
         19  Languages Spoken
         19  Gender
         20  Sexual Orientation and Gender Identification
         20  Age
   20  Key Roles in the 2014-2016 Community Health Needs Assessment
         21  System and Medical Center Leadership
         21  Health Impact Collaborative of Cook County (HICCC)
         22  Illinois Masonic Medical Center Community Health Council
         23  Illinois Masonic Medical Center Governing Council
   23  Methodology Used for the 2014-2016 Community Health Needs Assessment
         23  MAPP Process/Health Impact Collaborative of Cook County
         25  Community Surveys
         26  Focus Groups
         27  Use of Healthy Communities Institute Data Platform
         27  Review of Other Available Local and National Data

                                                      1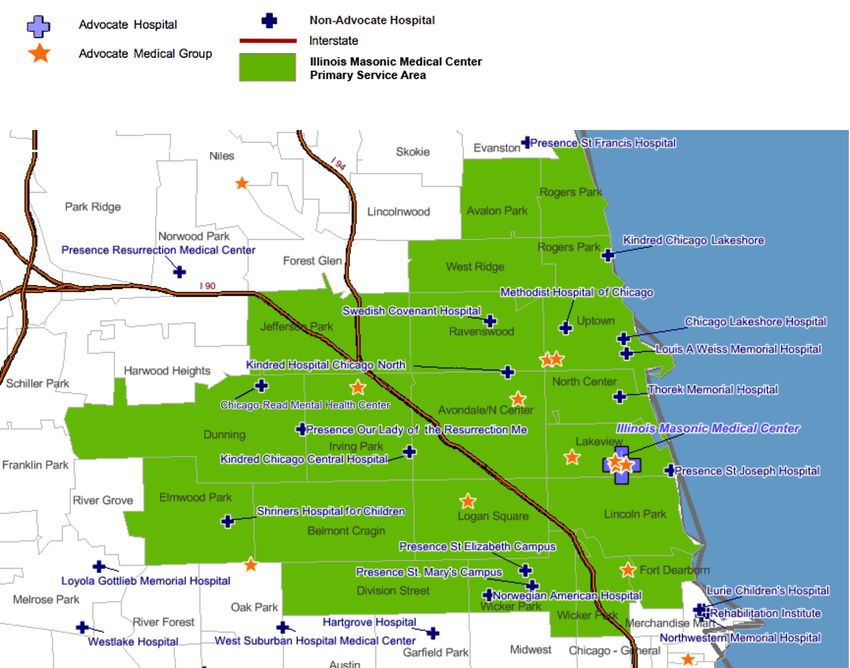
Table of Contents continued...
  27  Key Findings for Illinois Masonic Medical Center’s PSA
         27  Behavioral Health
         33  Chronic Disease
              34  Asthma
              35  Cancer
              37  Diabetes
              38  Hypertension
              40  Heart Disease
              41  Hepatitis
              42  HIV
              43  Obesity
              44  Dental Health
  45  Social Determinants of Health (SDOH)
         45  Housing
         47  Violence/Sexual Abuse
         48  Teen Births
  48  Health Disparities
         49  Hispanics
         49  LGBQIA and Transgender Population
         50  African Americans
         50  Asian Populations
  50  Identifying Priorities
         50  Health Impact Collaborative of Cook County
         51  Illinois Masonic Medical Center Community Health Council
         53  Priorities Selected to Address
         53  Explanation Why Other Needs Not Selected as Priorities

V. Implementation Planning for 2014-2016 CHNA 55
  55  Implementation Plans
         55  Chronic Disease Prevention/Management
         55  Behavioral Health
         56  Social Determinants of Health (SDOH)

VI. Vehicle for Community Feedback 57

VII. Appendices 58
  58  Appendix 1: 2014-2016 Community Health Needs Assessment Data Sources
  61  Appendix 2: Results of Community Health Council Prioritization Process

                                                    2
I. Executive Summary
Advocate Illinois Masonic Medical Center 2014-2016 Community Health Needs
Assessment (CHNA)
The mission, values and philosophy of Advocate Health Care calls Illinois Masonic Medical Center to
extend its services into the community to address access to care issues and to improve the health and
well-being of the people in the communities that the medical center serves. The purpose of the medical
center’s Community Health Needs Assessment is to identify and prioritize health needs that exist within
the communities that the medical center serves and to develop a plan to address those needs. Below is a
description of the 2014-2016 CHNA process and outcomes.
For the purposes of the 2014-2016 CHNA, the “community” is defined as the Primary Service Area (PSA)
of the medical center which consists of 20 zip codes on the North Side of Chicago. Nearly 73% of the
medical center’s total patient volume comes from its PSA.
The total population of the PSA is 1,198,692 and it is a very diverse area. The communities within the PSA
range from wealthy residents along Chicago’s lakefront to areas where over 20 percent of the population is
living below the poverty level. There are communities of long-time middle and working class Caucasians
as well as several areas that are home to financially challenged immigrants. The medical center resides
in the nation’s first municipally recognized gay neighborhood. The PSA also includes a community area
where it is estimated that residents are three times more likely to experience a mental health disorder
than other Chicago community areas. (National Health Corps Chicago, Facing Mental Illness in Uptown,
Caroline Sacko, Blog, February 14, 2014.)
The percent of the PSA population that is Hispanic is almost twice the percent of Hispanics that live in
the US population as a whole. The Non-Hispanic African American population is only 9.9 percent of the
PSA, yet 18.93 percent of the medical center’s 2015 inpatient population. The Asian and Pacific Islander
(non-Hispanic) population in the medical center’s PSA (7.3 percent) is larger than the percent of Asian and
Pacific Islanders that live in the US as a whole (5.4 percent).
Currently, 10.7 percent of the PSA population is over the age of 65. 16.9 percent of the PSA population
over age 65 are living below the federal poverty level. In 2016, 6.9 percent of the PSA population is
uninsured. (In the US, 8.4 percent of the population is uninsured.) 25.3 percent of the population within the
PSA has Medicaid and 10.2 percent of the population within the PSA has Medicare.
Collaboration was an essential component of this CHNA. Beginning in 2015, Advocate Health Care
and Illinois Masonic Medical Center were among the founding organizations of the Health Impact
Collaborative of Cook County (HICCC). HICCC is a national best practice model of broad collaboration,
funded by hospitals. The collaborative members include 26 hospitals, 7 health departments and nearly
100 community-based organizations working collectively on CHNAs for three regions in Cook County:
North, Central and South. This CHNA is the result of active participation in the Health Impact Collaborative
of Cook County’s North Region collective CHNA process along with aligning this work to the individual
needs of Illinois Masonic Medical Center’s primary service area.
Many individuals participated in completing this CHNA. Illinois Masonic Medical Center’s Community
Health Council (CHC) provided oversight to this process. The 22 member CHC was comprised of diverse
community and medical center leaders. Two members of the CHC serve on the medical center’s Governing
Council. The CHC reviewed data and selected three priority community health issues for the communities
that the medical center serves. The CHC then submitted the CHNA and the selected health priorities to
the Governing Council for approval. The Illinois Masonic Medical Center Governing Council approved the
CHNA report on September 27, 2016.
The methodology for this CHNA had three components: 1) the MAPP process used by the Health Impact
Collaborative of Cook County (2/2015-6/2016); 2) use of the Healthy Communities Institute platform to
review county, service area and zip code data (3/2014-6/2016); and 3) review of other available local and
national data (1/2016-6/2016).
The Health Impact Collaborative of Cook County conducted its collaborative CHNA between February
2015 and June 2016. The Illinois Public Health Institute (IPHI), which staffed the collaborative, designed

                                                     3
and facilitated a community-engaged assessment based on the Mobilizing for Action through Planning
and Partnerships (MAPP) framework. The MAPP framework promotes a system focus, emphasizing the
importance of community engagement, partnership development and the dynamic interplay of factors
and forces within the public health system. The Health Impact Collaborative of Cook County chose this
inclusive, community-driven process so that the assessment and identification of priority health issues
would be informed by the direct participation of stakeholders and community residents. This process
included the use of community surveys as well as focus groups.
Healthy Communities Institute (HCI) data was a primary source of data. This data, customized for the
Advocate system, provided access to data for the counties, service areas and zip codes served by the
system’s hospitals. This robust platform provided the hospitals with 171 indicators including a variety of
demographic indicators and 31 hospitalization and emergency department (ED) visit indicators also at the
service area and zip code levels.
Illinois Masonic Medical Center staff also collected additional pertinent data for the medical center’s PSA
and organized all data (including HICCC and HCI) to reflect the community health needs of the medical
center’s PSA. This data was presented to the medical center’s Community Health Council. In addition to
data provided by HICCC and HCI, data was collected from the medical center’s strategic planning and
finance departments, the Illinois Hospital Association, the Chicago Department of Public Health, the Illinois
Department of Public Health, the US Census Bureau, the Centers for Disease Control and Prevention and
other relevant sources. National data was used when it helped to define an issue.
The data and key findings are discussed at length in the CHNA report. Selected findings include the
following:
 • The PSA experiences higher rates of behavioral health issues than the whole of Illinois with certain
   communities within the PSA more deeply affected including: Uptown, Rogers Park, Wicker Park,
   Dunning, Fort Dearborn and Division Street.
 • Chronic diseases accounted for approximately 64 percent of all deaths in Chicago in 2014. The leading
   causes of death under age 75 in Illinois Masonic Medical Center’s PSA in 2010-2011 were: Cancer,
   Heart Disease, Accidents (excluding motor vehicles), Diabetes, Chronic Lower Respiratory Diseases,
   Stroke, Intentional self–harm, Chronic Liver Disease, Influenza and Pneumonia, and Kidney Diseases.
   Asthma, diabetes, hypertension, heart disease, hepatitis and HIV are all found at higher rates in the
   PSA than in Illinois as a whole. According to the Health Impact Collaborative of Cook County, the
   following communities in the PSA have the highest burden of chronic disease within the North Region
   of Cook County: Edgewater, Jefferson Park, Portage Park, Rogers Park and Uptown.
 • The top five cancer incidence rates in the PSA (not age adjusted) five year average for 2008-2012 are:
   Breast Invasive, Prostate, Lung and Bronchus, Colorectal and Leukemia and Lymphomas.
 • The Chicago Department of Public Health’s Healthy Chicago 2.0, 2016-2020, reports that one in four
   adults in Chicago were obese in 2014. One in five kindergartners enrolled in Chicago Public Schools
   were obese in the 2013-2014 academic year.
 • According to the Chicago Community Oral Health Forum 2013-2014 study, Healthy Smiles, Healthy
   Growth, approximately 52 percent of third grade children in Illinois had caries experience, suggesting
   that tooth decay is still a significant public health problem affecting Illinois children; over 22 percent
   had untreated decay and 2 percent had an urgent treatment need.
 • A substantial amount of data was presented throughout the CHNA regarding the Social Determinants
   of Health in the medical center’s PSA. Data was presented on poverty, income levels, employment
   and education disparities that exist within the medical center’s PSA. The impact of race/ethnicity,
   income levels and sexual orientation/gender identification on health were discussed. All of these
   are significant issues impacting the overall health of the medical center’s PSA. Additionally, housing
   instability, violence/sexual abuse and teen births were all identified as areas of need.

                                                     4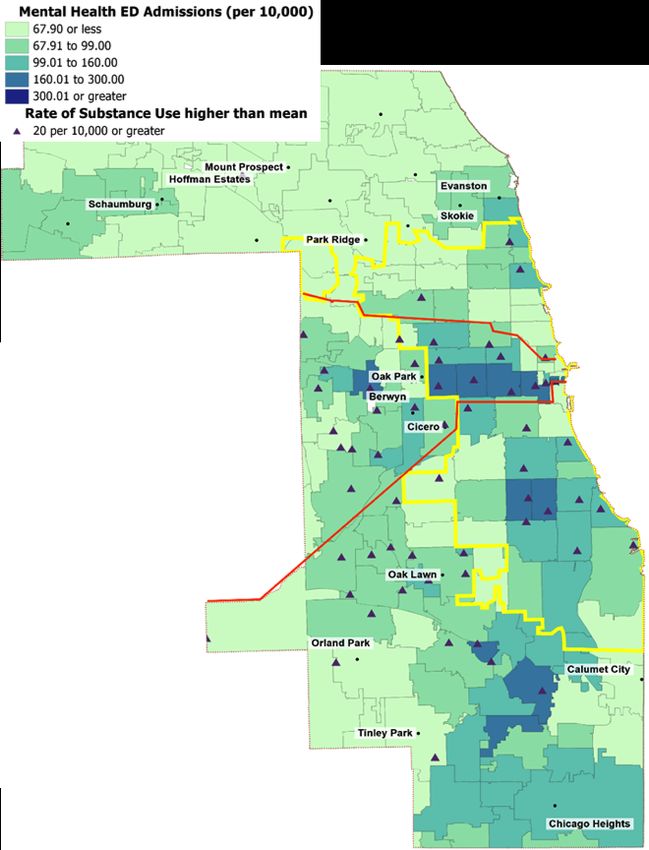
After discussion of the data, a ranking process and keeping in line with the medical center’s commitment
to the Health Impact Collaborative of Cook County process, the Community Health Council selected three
issues by a unanimous vote as priority needs for the 2014-2016 Illinois Masonic Medical Center CHNA:
1. Chronic Disease Prevention/Management
2. Behavioral Health
3. Social Determinants of Health
Illinois Masonic Medical Center will strategically work to address these priority needs. Discussions around
these issues and how to address them will include an examination of evidence-based, measureable
strategies and identification of areas and/or populations that could most benefit from intervention.
Work on the issues will be coordinated with the work of HICCC, the Healthy Chicago Hospital Collaborative
and other potential partners.

II. Description of Advocate Health Care and Advocate
Illinois Masonic Medical Center
Advocate Health Care
Advocate Illinois Masonic Medical Center (Illinois Masonic Medical Center) is one of 11 hospitals in the
Advocate Health Care (Advocate) system. Advocate is the largest health system in Illinois and one of the
largest healthcare providers in the Midwest; operating more than 400 sites of care including 11 acute
care hospitals, the state’s largest integrated children’s network, 5 Level I trauma centers, 2 Level II trauma
centers, the region’s largest medical group and one of the region’s largest home health care companies.
The Advocate system trains more primary care physicians and residents at its four teaching hospitals than
any other health system in the state.
Advocate is a faith-based, not-for-profit health system related to both the Evangelical Lutheran Church in
America and the United Church of Christ. Advocate’s mission is to serve the health needs of individuals,
families and communities through a wholistic philosophy rooted in the fundamental understanding
of human beings as created in the image of God. This wholistic approach provides quality care and
service and treats each patient with dignity, respect and integrity. To guide its relationships and actions,
Advocate embraces the five values of compassion, equality, excellence, partnership and stewardship. The
mission, values and wholistic philosophy (MVP) permeate all areas of Advocate’s healing ministry and are
integrated into every aspect of the organization building a cultural foundation. The MVP calls Advocate
to extend its services into the community to address access to care issues and to improve the health and
well-being of the people in the communities Advocate serves. As an Advocate hospital, Illinois Masonic
Medical Center embraces the Advocate system MVP.

Advocate Illinois Masonic Medical Center
Illinois Masonic Medical Center is a 397-bed teaching medical center located on Chicago’s North Side.
Illinois Masonic Medical Center is one of only four Level I Trauma Centers in Chicago, treating more than
900 trauma patients a year and has one of Chicago’s most active emergency departments (EDs) with more
than 44,000 emergency visits annually. The medical center’s Level III Neonatal Intensive Care Unit (NICU)
holds the state’s highest designation. The medical center is fully accredited by Det Norske Veritas (Norway)
and Germanischer Lloyd (Germany) (DNV-GL) with the exception of Outpatient Behavioral Health which is
accredited by the Commission on Accreditation of Rehabilitation Facilities (CARF) and Laboratory Point of
Service Testing which is accredited by The Joint Commission.
Illinois Masonic Medical Center has more than 900 active physicians on staff representing 43 medical
specialties. It employs almost 800 registered nurses. The medical center offers a wide range of medical
services and is nationally recognized for its medical expertise, innovative technologies, and dedication
to patient safety, quality and service. Illinois Masonic Medical Center’s major services include: behavioral
health, comprehensive surgical services; emergency and trauma services; cancer care; cardiovascular
services; digestive disease services; obstetric, midwifery and pediatric services and neuroscience services.
Ambulatory and community health services include primary care; a dentistry program, including a mobile
dental van; vision services; a deaf and hard of hearing program; the Pediatric Developmental Center; ear,

                                                      5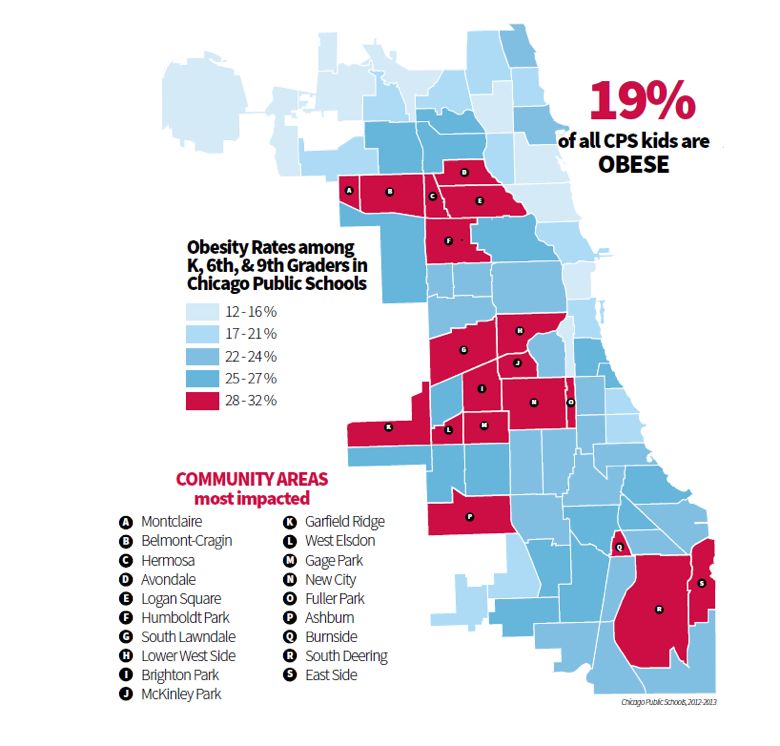
nose and throat services; urology and urogynecology; physical rehabilitative services; diagnostic imaging
services; infusion therapy; pain management; rheumatology; and a unique relationship with school–based
health centers.
Currently, the medical center employs over 2,300 associates and has more than 450 volunteers. Illinois
Masonic Medical Center trains 225 residents and 563 medical students each year. The medical center is
one of Illinois’ largest non-university medical teaching hospitals and is affiliated with the University of
Illinois at Chicago Health Sciences Center, Rosalind Franklin University and Midwestern University.
Exhibit 1: General Medical Center Annual Statistics 2015
                    Number of:                                         Total
                  Admissions **                                       14,609
                 Inpatient Days **                                    68,697
              Emergency Visits ***                                    44,289
              Outpatient Visits ****                                 152,368
                        Births                                         2,400
                     Surgeries                                        12,231

**Does not include normal newborn
***ER visits include patients that were admitted
****Outpatient visits include ER patients not admitted
Source: Finance Department, Illinois Masonic Medical Center, 2016.

A commitment to community, medical education and ongoing clinical research affirms Illinois Masonic
Medical Center’s mission of providing patients the highest quality care in Chicagoland. This is illustrated
by its many honors, including being ranked one of Illinois’ Best Hospitals by US News & World Report for
the past five consecutive years.

                                                                6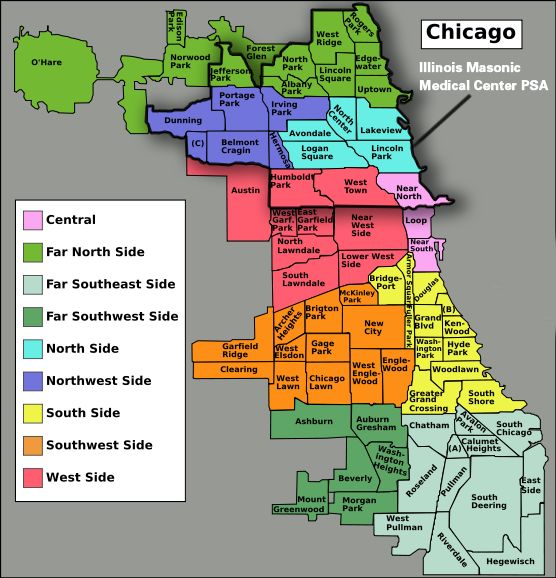
III. Summary of the 2011-2013 Community Health Needs
Assessment (CHNA) and Program Implementation
Community Definition
For the purposes of the 2011-2013 CHNA cycle, Illinois Masonic Medical Center defined its “community”
as the Primary Service Area (PSA) for the medical center. The medical center’s PSA consisted of 17 zip
codes in Northeast Chicago. These zip codes included: 60610, 60613, 60657, 60614, 60618, 60622, 60625,
60626, 60630, 60634, 60635, 60639, 60640, 60641, 60645, 60647 and 60651.
Exhibit 2: Map of Illinois Masonic Medical Center Primary Service Area 2011-2013

Source: Advocate Health Care Strategic Planning Department, 2013.

The medical center’s PSA consisted of 1.2 million people. The White Non-Hispanic population comprised
48.3 percent of the PSA compared to 62.3 percent nationally. The Hispanic population comprised 32.3
percent of the PSA compared to 17.3 percent nationally. Black non-Hispanics accounted for 10.5 percent of
the PSA population compared to 12.3 percent nationally. Asian & Pacific Islander Non-Hispanics accounted
for 6.9 percent of the PSA compared to 5.1 percent nationally.
Within Illinois Masonic Medical Center’s PSA, one-quarter of households reported an income of
$25K-$50K, which mirrored the percent total for the United States. Household incomes of $25K or less
were 26.6 percent, which was slightly higher than the percent total for the United States. Sixty-three
percent of the population in the PSA had a post-high school education, including 42 percent with a
bachelor’s degree or higher, while 16.6 percent reported no high school diploma or equivalent.
The PSA population was 51.1 percent male and 48.9 percent female, with 20.4 percent of the population
under 18 years of age and 19.7 percent of the population 55 and older. (Neilsen-Truven Demographic
Snapshot, 2012.)
                                                              7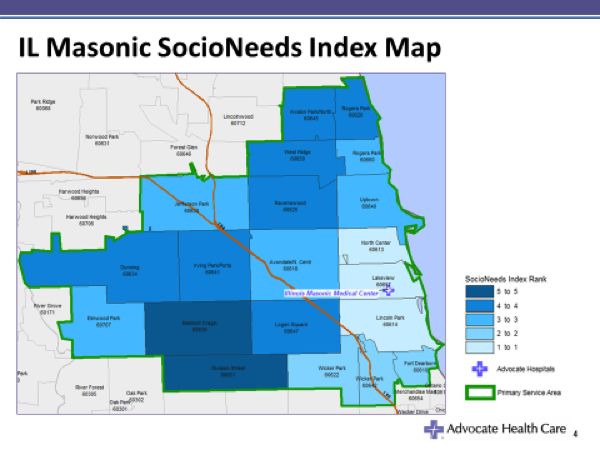
CHNA Process
In 2011, Illinois Masonic Medical Center convened a Community Health Council (CHC) to oversee a
comprehensive Community Health Needs Assessment to meet the requirements of the Patient Protection
and Affordable Care Act. Data was collected and analyzed in 2011 and 2012.
The Community Health Council was co-chaired by the medical center’s Vice President of Mission and
Spiritual Care and Community Relations, and the Director of Hispanocare and Community Outreach. The
Community Health Council membership was comprised of representatives from the medical center and
the community.
Using both primary and secondary community health data, the council identified the medical center PSA’s
key health needs and then employed a priority-setting process to determine priority health needs on
which to focus. This process included an examination of both the medical center’s and the community’s
assets and challenges, and discussions with external and internal key informants to determine the
potential for partnerships with other organizations to address the community needs.
Illinois Masonic Medical Center’s Governing Council approved the selected priorities in December 2013.
In April 2014, the Governing Council endorsed an Implementation Plan that outlined how the priorities
selected would be addressed by the medical center.

Needs Identified and Priorities Selected
After reviewing substantial amounts of data, the Community Health Council identified five key areas of
need: Behavioral Health, Cancer, Dental Health, Heart Disease and Obesity.
After deliberation, the Community Health Council selected Behavioral Health and Dental Health as the
areas of focus for this three-year implementation cycle; based upon the availability of resources, current
programs and the opportunities to impact community health outcomes.

Summary of Program Strategies and Outcomes to Meet Identified Priorities
Behavioral Health
First Access
Given the high number of admissions and ED visits for behavioral health conditions at Illinois Masonic
Medical Center and the high number of discharged patients that were not keeping their outpatient follow-
up appointments, the medical center’s Behavioral Health Services Department created the First Access
Program in 2013. The goal of First Access is to provide immediate access to follow-up behavioral health
services to support recovery and prevent relapses.
Through First Access, behavioral health ED patients, as well as patients referred by the medical center’s
inpatient psychiatric unit, medical floors and physicians, are walked over to outpatient care by a staff
member to ensure same day follow-up for outpatient appointments. Since its implementation, First Access
has consistently increased Behavioral Health patients’ appointment follow-through rates from 40 percent
in 2013 to as high as 90 percent in 2015. Repeat ED visits in a sample representative population decreased
by 75 percent from pre-First Access to post-First Access. Inpatient visits in a sample representative
population decreased by 50 percent from pre-First Access to post-First Access. In 2015, First Access
interventions demonstrated an 80% decrease in depression symptoms among the First Access population.

Dental Health
Mobile Dental Van
The Mobile Dental Van program at Illinois Masonic Medical Center provides access to oral health services
for underserved and uninsured individuals. The goal of the Mobile Dental Van is to improve the oral health
of vulnerable populations such as low income children and families, homeless individuals, older adults
and persons with special needs. Services provided include dental screenings, treatment and education.
The Mobile Van sees patients five days per week. In 2015, the program served 19 sites including high
schools, elementary schools, organizations that serve the homeless, community health centers, as well
as organizations that serve individuals with mental illness, developmental disabilities, and seniors.
In 2015, the program served 566 unique patients, providing 1,443 patient visits. In 2015, there was
a 78 percent reduction in diseased teeth from pre and post surveys provided to patients that
received services.
                                                     8
Special Needs Dentistry Program
Special needs patients and their families may overlook essential dental care in the face of more urgent
health needs. Many dentists lack the training or equipment needed to effectively serve special needs
patients and as a result, many people with disabilities lack access to even basic routine dental care.
Additionally, patients with special needs may not understand the need for dental care or why a dentist
wants to probe inside his or her mouth and may find it challenging to sit in a dental chair for extended
periods of time. The Special Needs Dentistry program at Illinois Masonic Medical Center provides oral
health care to patients with mental or physical disabilities such as Down syndrome, developmental delays
and Cerebral Palsy. In addition to seeing patients at the clinic, the Special Needs Dentistry program
provides educational outreach and screening services within the community. The program’s dental
hygienist travels to schools and residential facilities for the disabled and provides on-site oral hygiene
instruction.
The goal of the Special Needs Dentistry Program is to improve access to oral health for children and
adults with special needs and therefore to improve the oral health of children and adults with special
needs. In 2015, there were 2,263 patient visits that served 104 children and 874 adults with special needs.
More than 150 individuals with special needs were screened at Shore Training Center, Chicago Lighthouse
for the Blind, Shore Lois Lloyd Center and the Victor C. Neumann Association.
Input from Community for 2011-2013 CHNA
Illinois Masonic Medical Center convened a Community Health Council to oversee its CHNA conducted
between 2011 and 2013. Members representing community needs included three local church pastors,
a local school principal and a representative from the Chicago Department of Public Health. Additional
community representatives were added as the process evolved to fill in any Community Health Council
gaps in expertise.
Additionally, the medical center’s Governing Council, that gave final approval for the CHNA and its
implementation plans, represents leadership from the community. Of the 15 members, eight (53 percent)
represent the community.
After the CHNA was completed, it was posted on the medical center’s website for public comment.
Subsequently, the CHNA’s progress has been posted on the medical center’s website each year for
community information and comment. No comments have been received from the public regarding the
2011-2013 CHNA report or implementation plan.
Lessons Learned from the 2011-2013 CHNA
Valuable lessons were learned from conducting the 2011-2013 CHNA. The medical center recognized that
a great deal of duplication may be avoided, more in-depth data/research may be produced and broader
reaching issues may be addressed if the CHNA process is conducted in a more collaborative manner.
Thus, in 2015, the medical center began participating in the Health Impact Collaborative of Cook County,
a project involving 26 hospitals, 7 health departments and nearly 100 community-based organizations.
The goal of this initiative is to work collaboratively on a CHNA and an implementation plan once priorities
have been identified. The medical center is also participating in another collaborative in Chicago; the
Healthy Chicago Hospital Collaborative. The purpose of this collaborative is to collectively address three
priorities that were identified during the previous CHNA cycle—mental health, obesity and access to care.
9IV. 2014-2016 Community Health Needs Assessment
CHNA Community Definition
Nearly 73 percent of Illinois Masonic Medical Center’s total patient volume is from its Primary Service Area
(PSA) while 7.2 percent comes from the Secondary Service Area (SSA), and 19.9 percent of the patient
population comes from outside of the Total Service Area (TSA). (Illinois Masonic Medical Center Patient
Origin Report, 2015.) Therefore, for the purpose of this CHNA, “community” is defined as the medical
center’s PSA.
In 2016, the total population for the PSA is 1,198,692. (The Nielsen Co., Truven Health Analytics Inc., 2016.)
Exhibit 3: Map of Illinois Masonic Medical Center Primary Service Area
Source: Advocate Health Care Strategic Planning Department, 2016.
The PSA consists of 20 zip codes with the following community areas assigned to each by the medical
center’s Strategic Planning Department: 60610 (Fort Dearborn), 60640 (Uptown), 60613 (North Center),
60641 (Irving Park/Portage Park), 60614 (Lincoln Park), 60642 (Wicker Park), 60618 (Avondale/North
Center), 60645 (West Ridge), 60622 (Wicker Park), 60647 (Logan Square), 60625 (Ravenswood), 60651
(Division Street), 60626 (Rogers Park), 60657 (Lakeview), 60630 (Jefferson Park), 60659 (West Ridge), 60634
(Dunning), 60660 (Rogers Park), 60639 (Belmont Cragin) and 60707 (Elmwood Park).
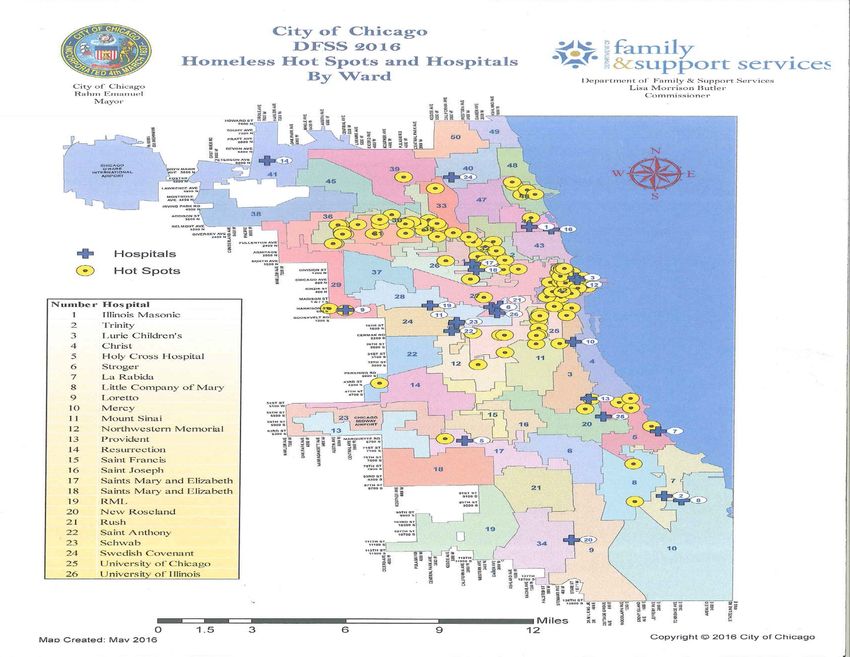
The City of Chicago divides Chicago into 77 unique community areas. Below is a City of Chicago
Community Area Map. The dark line outlines the medical center’s PSA.
10Exhibit 4: City of Chicago Communities Within Illinois Masonic Medical Center PSA 2016
Source: The Chicago 77, 2016. (http://www.thechicago77.com/about-the-chicago-77/)
Consideration of the zip codes comprising the PSA reveals that Illinois Masonic Medical Center serves
residents of the following community areas as defined by the City of Chicago: Near North Side, Lincoln
Park, Lakeview, Uptown, Edgewater, Rogers Park, West Ridge, Lincoln Square, North Park, Albany Park,
Avondale, Logan Square, West Town, Jefferson Park, Portage Park, Belmont Cragin, Humboldt Park,
Dunning, Elmwood Park, Evergreen Park, Hermosa, Irving Park, North Center and Montclare.
Communities identified by the medical center’s Strategic Planning Department and the City of Chicago will
be referred to throughout this report. Community designation will vary depending on what source of data
is being referenced.
Illinois Masonic Medical Center’s PSA is a diverse area. The communities within the PSA range from
wealthy residents along Chicago’s lakefront to areas where over 20 percent of the population is living
below the poverty level. There are communities of long-time middle and working class Caucasians as well
as several areas that are home to financially challenged immigrants. The medical center resides in the
nation’s first municipally recognized gay neighborhood. The percent of the PSA population that is Hispanic
is almost twice the percent of Hispanics that live in the US population as a whole. The PSA also includes
a community area where it is estimated that residents are three times more likely to experience a mental
disorder than other Chicago community areas. (National Health Corps Chicago, Facing Mental Illness in
Uptown, Caroline Sacko, Blog, February 14, 2014.)
11Below is a chart illustrating the level of health diversity that exists within the PSA. This exhibit shows
Years of Potential Life Lost (YPLL), comparing communities within Chicago in the North Region of Cook
County with the highest number of YPLL to Chicago communities in the North region of Cook County with
the lowest number of YPLL. Five of the communities are within Illinois Masonic Medical Center’s PSA. All
three of the lowest YPLL numbers are in the PSA, while two of the communities with the highest number
of YPLL are also in the PSA (Uptown and Jefferson Park).
Exhibit 5: Years of Potential Life Lost (YPLL) comparing Communities in Chicago in the North Region
of Cook County 2009-2013
Source: Health Impact Collaborative of Cook County, Community Health Needs Assessment, North Region, 2016; Chicago
Department of Public Health Data, 2009-2013.
Sociodemographic Description of PSA
The term “sociodemographic” refers to sociological and demographic characteristics. The importance
of understanding the sociodemographic characteristics of a group or area lies in its contribution to
identifying the issues and demands of given populations. Below are some sociodemographic descriptions
of Illinois Masonic Medical Center’s PSA or sociodemographic information that is relevant to the medical
center’s PSA.
Race/Ethnicity
Two charts are presented here to reflect the racial/ethnic make-up of the community that Illinois Masonic
Medical Center serves. The first chart shows the race/ethnicity percentages of people living within the
medical center’s PSA. The second chart shows the race/ethnicity percentages of patients that the medical
center serves.
12Exhibit 6: Illinois Masonic Medical Center PSA Population by Race/Ethnicity 2016
Source: The Nielsen Co., Truven Health Analytics Inc., 2016.
Exhibit 7: Percent of Illinois Masonic Medical Center Patients Served in Inpatient, Outpatient and
Emergency Department (ED) Settings by Race/Ethnicity 2015
Race/Ethnicity Total Inpatient Total Outpatient Outpatient/ED
Non-Hispanic Caucasian 36.70% 39.29% 39.34%
Hispanic 30.92% 35.92% 36.80%
Non-Hispanic-African American 18.93% 16.50% 18.48%
Non-Hispanic Asian 3.82% 4.43% 2.94%
Non-Hispanic-Native American/
.33% .30% .26%
Alaska Native
Non-Hispanic-Pacific Islander/
.11% .12% .08%
Hawaiian
Other .29% .22% .18%
Unknown 8.90% 3.21% 1.92%
Source: Finance Department, Illinois Masonic Medical Center, 2016.
The medical center’s PSA has a large percentage of Hispanic residents (32.1 percent). This is almost
double the percentage of Hispanics that live in the US as a whole. The medical center also serves a high
percentage of Hispanic patients—30.92 percent of inpatients and 35.92 percent of outpatients in 2015. In
2015, Illinois Masonic Medical Center’s Strategic Planning Department projected that by 2020, the Hispanic
population in the TSA will increase 2.7 percent.
The Non-Hispanic African American population is only 9.9 percent of the PSA, although it comprises
18.93 percent of the medical center’s 2015 inpatient population and 16.50 percent of the medical center’s
2015 outpatient population. In 2015, Illinois Masonic Medical Center’s Strategic Planning Department
estimated that by 2020, the African American population will decline by 5.8 percent in the TSA.
The Asian and Pacific Islander (non-Hispanic) population in the medical center’s PSA (7.3 percent) is larger
than the percent of Asian and Pacific Islanders that live in the US as a whole (5.4 percent.) In 2015, Illinois
Masonic Medical Center’s Strategic Planning Department estimated that by 2020, the Asian population will
increase by 7.2 percent in the TSA.
13The race/ethnicity percentages for the PSA have remained fairly constant since the last CHNA was
conducted.
Below is a table of Chicago community areas within Illinois Masonic Medical Center’s PSA by race/
ethnicity. While the PSA as a whole consists of different percentages of racial/ethnic groups, the
community areas within the PSA do as well. In some cases, a particular racial/ethnic group may
account for a large percentage of a given community area. For example, there are two communities
that are over 80% White (Lincoln Park and Lakeview). There are six community areas that are over 50%
Hispanic (Avondale, Logan Square, Humboldt Park, Hermosa, Montclare and Belmont Cragin). There is
one community area that is over 40% Non-Hispanic African American (Humboldt Park).There are two
communities that are over 20% Non-Hispanic Asian (West Ridge and North Park).
Exhibit 8: Chicago Community Areas within Illinois Masonic Medical Center PSA by Race/Ethnicity 2010
Community % White % Non-Hispanic % Hispanic % Non-Hispanic
African American Asian
USA 63.7% 12.2% 16.3% 4.7%
Chicago 31.7% 32.9% 28.9% .1%
Illinois 63.7% 14.3% 15.8% 4.5%
Near North 72.1% 10.8% 4.9% 10.1%
Lincoln Park 82.9% 4.3% 5.6% 5.1%
Lakeview 80.4% 3.9% 7.6% 6.0%
Uptown 51.6% 20% 14.2% 11.4%
Edgewater 54.7% 14.3% 16.5% 11.6%
Rogers Park 39.3% 26.3% 24.4% 6.4%
West Ridge 42.7% 11.1% 20.4% 22.5%
Lincoln Square 63.1% 3.8% 19.1% 11.1%
North Park 49.3% 3.2% 18% 25.7%
Albany Park 29.2% 4.0% 49.4% 14.4%
Avondale 28.4% 2.5% 64.4% 3.0%
Logan Square 39.6% 5.3% 50.7% 2.6%
West Town 57% 7.8% 29.3% 3.7%
Jefferson Park 68.7% 1% 19.4% 8.9%
Portage Park 53.5% 1.3% 38.8% 4.6%
Belmont Cragin 15.2% 3.2% 78.9% 2%
Humboldt Park 4.4% 40.9% 53.3% .4%
Dunning 70.4% .7% 23.8% 3.8%
Elmwood Park 72.1% 1.9% 23% 2.3%
Evergreen Park 68.7% 18.7% 10.3% 1.2%
Hermosa 7.6% 3% 87.4% 1.2%
Irving Park 41.7% 3.3% 45.6% 7.1%
North Center 73.3% 2.3% 13.6% 4.5%
Montclare 37.5% 4.5% 54% 2.8%
Source: Health Impact Collaborative of Cook County, Community Health Needs Assessment, North Region, 2016; US Census Bureau,
2010.
14Economic Disparities by Race/Ethnicity
Understanding the racial/ethnic make-up of the PSA only tells part of a story. Economic disparities exist
between racial/ethnic groups. The data below shows these disparities in the northern region of Cook
County. African Americans are the racial/ethnic group with the highest percentage of people living below
100 percent of the federal poverty level, have lower per capita income and the highest unemployment
rate. The Hispanic population has almost twice the percentage of people living below 100 percent of the
federal poverty level than Whites, less than half of the per capita income of Whites and the second highest
unemployment rate. These populations of color experience economic disparities.
Exhibit 9: Percentage of the Population Living at or Below 100% of the Federal Poverty Level in the North
Region of Cook County by Race and Ethnicity 2009-2013
Source: Health Impact Collaborative of Cook County, Community Health Needs Assessment, North Region, 2016; American
Community Survey, 2009-2013.
Exhibit 10: Per Capita Income in the North Region of Cook County by Race and Ethnicity 2009-2013
Source: Health Impact Collaborative of Cook County, Community Health Needs Assessment, North Region, 2016; American
Community Survey, 2009-2013.
15Exhibit 11: Unemployment Rates in the North Region of Cook County by Race and Ethnicity 2009-2013 Source: Health Impact Collaborative of Cook County, Community Health Needs Assessment, North Region Report, 2016; American Community Survey, 2009-2013. Income There is great diversity of income levels existing within the Illinois Masonic Medical Center PSA. While 26.7 percent of the PSA was reported in 2016 to have had a household income of over $100,000 annually, there are eight community areas in the PSA where over 20 percent of the population lives below the federal poverty level. Exhibit 12: Household Income Distribution in PSA 2016 Household Income % of PSA Population % of US Population
Exhibit 13: PSA Community Populations living in Households with Incomes below the Federal Poverty
Level 2009-2013

 USA                                      15.6%
 Chicago                                  22.6%
 Illinois                                 14.1%
 PSA Communities
 Humboldt Park                            34.7%
 Rogers Park                              27.7%
 Uptown                                   25.9%
 Albany Park                              20.9%
 West Ridge                               20.8 %
 Belmont Cragin                           20.6%
 Logan Square                             20.4%
 Hermosa                                  20.3%
 Avondale                                 18%
 Edgewater                                17.8%
 West Town                                16%
 Irving Park                              14.5%
 Montclare                                14%
 Portage Park                             13.6%
 Near North                               13.1%
 Lincoln Park                             12.7%
 Lincoln Square                           12.7%
 Lakeview                                 12.2%
 North Park                               11.7%
 Dunning                                  10.4%
 Evergreen Park                           8.7%
 Elmwood Park                             7.7%
 Jefferson Park                           7.7%
 North Center                             5.9%
Source: Health Impact Collaborative of Cook County, Community Health Needs Assessment, North Region, 2016; US Census Bureau,
American Community Survey, 2009-2013.

Education and Employment
In 2016, the unemployment rate for the population over age 16 within the medical center’s PSA was 9.2
percent. The United States unemployment rate for the population over age 16 was 5.8 percent. In terms
of education, in 2016, 15.3 percent of the medical center’s PSA population over 25 years old had no High
School diploma. This is compared to 13.6 percent of the entire US population over 25 years old that had
no High School diploma. Forty-four percent of the PSA over the age of 25 holds a Bachelor’s Degree or
greater compared to 29.4 percent of the US population in 2014. (The Nielsen Co., Truven Health Analytics
Inc., 2016.)

                                                            17
Health Insurance Coverage
In 2016, 6.9 percent of the Illinois Masonic Medical Center PSA population was uninsured compared to
8.4 percent of the US population as a whole. Medicaid covered 25.3 percent of the PSA, while Medicare
covered an additional 10.2 percent. (Truven Insurance Coverage Estimates, 2016.) However, as can be seen
in Exhibit 14, over 30 percent of medical center admissions in 2015 were for patients covered by Medicare
and 29 percent for patients covered by Medicaid.
Exhibit 14: Illinois Masonic Medical Center Reported Payer Mix for Admissions 2015
Source % of Admissions
Medicare 30.97%
Medicaid 29%
Managed Care 14.48%
Blue Cross 21.68%
Self-Pay 2.68%
Other 1.12%
Source: Finance Department, Illinois Masonic Medical Center, 2016.
Socioeconomic Need
To clearly illustrate the disparity of income and other socioeconomic factors that exist within Illinois
Masonic Medical Center’s PSA, it is useful to examine a map of the PSA that indicates areas of high
socioeconomic need. Created by the Healthy Communities Institute, the SocioNeeds Index is a measure
of socioeconomic need that is correlated with poor health outcomes. Indicators for the index are weighted
to maximize the correlation of the index with premature death rates and preventable hospitalization
rates. This index combines multiple socioeconomic indicators into a single composite value. As a single
indicator, the index can serve as a concise way to explain which areas are of highest need. The scores can
range from 1 to 100. A score of 100 represents the highest socioeconomic need. The ranking of 1-5 is a
comparison of each zip code to all others within the PSA; a 5 represents areas of highest socioeconomic
need in comparison to others in the specific geographic area under consideration.
The two areas in the darkest blue, with an index rank of 5, have overall index scores in the high 90’s. The
areas with an index rank of 4, have overall index scores that lie between 68.8 and 82.6. The areas with an
index rank of 1 have overall index scores of between 3.9 and 9.6.
18Exhibit 15: Illinois Masonic Medical Center SocioNeeds Index Map
Source: Healthy Communities Institute, 2016.
Languages Spoken
In a 2014 report that surveyed hospital patients about the languages they spoke:
• 13.5 percent reported speaking Spanish.
• 1.6 percent reported speaking Polish.
• Other languages frequently reported by less than 1 percent of the patients were sign language,
Vietnamese, Serbian, Russian, Hindi, Bosnian and Arabic.
The Health Impact Collaborative of Cook County examined limited English proficiency by communities
using data from the American Community Survey, 2009-2013. Three community areas from Illinois
Masonic Medical Center’s PSA were identified as communities within the North Region as having the
highest percentages of households with limited English proficiency. They were: Avondale, Albany Park
and West Ridge.
Gender
Exhibit 16: PSA Population by Gender 2016
Male 49.7%
Female 50.3%
Source: The Nielsen Co., Truven Health Analytics Inc., 2016.
Additionally, 24.4 percent of the total PSA population was reported as females of child bearing ages
(15-44.)
19Sexual Orientation and Gender Identification
Limited community demographic data exists for the Lesbian, Gay, Bisexual, Queer, Intersex and Asexual
(LGBQIA) and Transgender population. However, the following data helps to define the predominance of
this population in the medical center’s PSA:
• Illinois Masonic Medical Center resides in the nation’s first municipally recognized gay neighborhood.
• According to the website ChooseChicago.com, this neighborhood “is one of the largest lesbian, gay,
bisexual and transgender communities in the United States.”
• According to a 2014 USA Today article, this neighborhood “and its adjacent neighborhood account for
about 12 percent of the city’s self-identified same-sex households according to Census figures. It is the
highest concentration in Chicago.”
• According to provisional data from the Chicago Department of Public Health, based upon a 2015
Healthy Chicago Survey, it is estimated that 116,293 persons in Chicago identify as Lesbian, Gay or
Bisexual.
• According to staff from Howard Brown Health Clinic (HBH), a health center in the medical center’s
PSA that serves the Lesbian, Gay, Bisexual, Queer, Intersex and Asexual (LGBQIA) and Transgender
population, from 2010-2015, there was a 370 percent increase in Transgender/Gender Non-Conforming
(TGNC) patients at the clinic. Thirty new TGNC patients join HBH per month. As of 2016, the clinic had
2,100 TGNC patients.
Age
Exhibit 17: Age Distribution in PSA 2016
Age % of PSA
0-14 17.8%
15-17 2.9%
18-24 7.9%
25-34 21.5%
35-54 29.1%
55-64 10.2%
65+ 10.7%
Source: The Nielsen Co., Truven Health Analytics Inc., 2016.
The 25-34 age group (21.5 percent) is significantly higher than the national percentage for this age group
(13.3 percent.)
While only 10.7 percent of the PSA population is individuals 65 years of age and older, this population
accounted for 42 percent of Illinois Masonic Medical Center’s 7,669 medical and surgical admissions
in 2014. (Hospital Profile submitted to Illinois Department of Public Health by Illinois Masonic Medical
Center, 2014.) Additionally, according to the Strategic Planning Department at Illinois Masonic Medical
Center, the 65+ age group is the fastest growing segment of the population, with a projected growth of 16
percent in the next five years.
In 2010-2014, the percent of people 65 years and older living below the poverty level in the medical
center’s PSA was 16.9 percent. (Healthy Communities Institute, American Community Survey, 2010-2014.)
Healthy Communities Institute also reported that Illinois Masonic Medical Center’s PSA had a higher
percent of people over 65 years old living below the poverty level in comparison to other counties in the
United States.
Key Roles in the 2014-2016 Community Health Needs Assessment
This CHNA is the result of active participation in the Health Impact Collaborative of Cook County’s
collective CHNA process and alignment of this work with the identified needs in Illinois Masonic Medical
Center’s own PSA. It is the product of work conducted by several key players. Below is a description of
those players.
20System and Medical Center Leadership
In 2014, Advocate Health Care began organizing resources to implement the 2014-2016 CHNA cycle. The
system signed a three-year contract with the Healthy Communities Institute, now a Xerox Company, to
provide an internet-based data resource for their eleven hospitals during the 2014-2016 CHNA cycle. This
robust platform offered the hospitals 171 health and demographic indicators, including 31 hospitalization
and emergency department (ED) visit indicators, at the service area and zip code levels. In addition, system
leaders collaborated with the Strategic Planning Department to create sets of demographic, mortality and
utilization data for each hospital site. This collaboration with Strategic Planning continued during the three-
year cycle ensuring that each hospital had hospital-specific detailed inpatient, outpatient and emergency
department data.
By the end of 2014, a new Department of Community Health was established at Advocate Health Care
under Mission and Spiritual Care, a vice-president was named to lead the department and a plan was
developed to ensure that each hospital in the system would have ample resources to complete their
respective CHNAs. In 2015, participation began in the Health Impact Collaborative of Cook County. A
master’s prepared director of community health began at Illinois Masonic Medical Center in January of
2016, responsible for coordinating and promoting the medical center’s involvement in policies, programs
and services to improve the overall health status of the communities it serves. The Community Health
Needs Assessment process, the convening of the Community Health Council and the co-administering
of the medical center’s community benefits reporting process are all responsibilities of the director of
community health.
Health Impact Collaborative of Cook County (HICCC)
In 2015, Advocate Health Care and its five hospitals principally serving Cook County (including Illinois
Masonic Medical Center) contributed financially and provided in-kind resources to the formation and
development of the Health Impact Collaborative of Cook County, a project involving 26 hospitals,
7 health departments and nearly 100 community-based organizations. The goal of this initiative is to
work collaboratively on a county-wide CHNA and implementation plan once priorities have been identified.
The Illinois Public Health Institute (IPHI) serves as the backbone organization for the collaborative including
coordinating the data collection and report preparation activities.
Cook County is a county in northeastern Illinois that includes Chicago and several of its closer suburbs.
Cook County’s population is 5,294,664 (Oxford Dictionary, 2016.) The City of Chicago’s population is
2,695,598 (City of Chicago Website, 2016); just about half of the population of Cook County. The Primary
Service Area for Illinois Masonic Medical Center is located on the North Side of Chicago, including only
one suburb. The PSA population is 1,198,692; a little less than half of the population of Chicago.
Given the size and diversity of Cook County (second largest county in the United States), the collaborative
created three regions--North, Central and South—for purposes of organizing the assessment process.
Illinois Masonic Medical Center was appropriately assigned to the North Region consisting of both the
North Side of Chicago as well as some of the northern suburbs of Chicago.
Non-Hispanic whites are the largest racial or ethnic group in the North region, representing 64 percent of
the population. Asian residents make up 10.8.percent of the North region. Approximately 17.8 percent of
individuals in the North region identify as Hispanic/Latino and 5.6 percent identify as African American/
Black. Despite an overall decrease in the total population of the North region, the Asian and Hispanic/
Latino populations grew by 6 percent and 7 percent, respectively, between 2000 and 2010.
As will be described in more detail in the accompanying report—Health Impact Collaborative of Cook
County: Community Health Needs Assessment, North Region—a regional leadership team was formed
for the North region including representatives from the hospitals and health departments in the region.
A regional stakeholder group was also organized including members of community organizations
representing various sectors. From February 2015 through June of 2016, the collaborative completed an
extensive community health assessment process within each of the three regions using the public health
process—MAPP—Mobilizing for Action through Partnerships and Planning. More details regarding the data
collection and prioritization process will be presented later in this report.
21Illinois Masonic Medical Center Community Health Council
In January 2016, the Community Health Director began re-forming a Community Health Council (CHC) for
the Illinois Masonic Medical Center. The CHC serves as a decision-making and advisory body to medical
center leadership and the medical center Governing Council regarding community health assessment,
strategies and programs. The goal of the CHC is to improve the health equity and the overall health status
of the communities that the medical center serves. The objectives of the CHC are to identify the health
needs of the communities that the medical center serves; determine priority areas of need; advise on
evidence-based strategies to address those needs; and assist in the evaluation of implemented community
health programs and services that have medical center involvement. A principal responsibility of the CHC
is participation in the medical center’s Community Health Needs Assessment process.
The new CHC charter explicitly stated: “Membership of the CHC will consist of medical center staff
who have involvement in policies, programs and/or services that improve the health equity and/or the
overall health status of the communities that the medical center serves; two medical center Governing
Council members and a minimum of 30 percent representation from community and/or public health
organizations.”
For the community/public health representation, special consideration was given to the geographic
distribution of council members as well as representation of unique population groups in the region. The
Community Health Council was instrumental in shaping the assessment findings and priority issues that
are presented in this CHNA.
The 2016 CHC consists of twenty two members—45 percent of which are representatives from the
community and/or public health organizations. Members include:
• Asian Health Coalition, Executive Director
• Centro Romero, Resource Developer
• Chicago Department of Public Health, Director, Healthy Chicago 2.0
• Chuhak & Tecson, Principal; Illinois Masonic Medical Center Governing Council Member
• Heartland Health Centers, Vice President, Strategy and Development
• Howard Brown Clinic, Manager, Clinical Quality Improvement
• Illinois African American Coalition on Prevention, Coordinator, Special Initiatives
• Lakeview Rehabilitation and Nursing Center, Chief Operations Officer of Parent Organization
• Metropolitan Family Services, Director, North Center
• Northeastern Illinois University, Professor, Community Health and Wellness Program
• WJ Brodine & Co, President*; Illinois Masonic Medical Center Governing Council Member
• Illinois Masonic Medical Center, Vice President, Clinical Operations
• Illinois Masonic Medical Center, Director, Community Health*
• Illinois Masonic Medical Center, Director, Hispanocare and Community Outreach
• Illinois Masonic Medical Center, Director, Medical Education
• Illinois Masonic Medical Center, Director, Physician Services
• Illinois Masonic Medical Center, Faith Community Nurse
• Illinois Masonic Medical Center, First Year Medical Resident
• Illinois Masonic Medical Center, Manager, Case Management
• Illinois Masonic Medical Center, Manager, Community Relations
• Illinois Masonic Medical Center, Manager, Strategic Planning and Business Development
• Illinois Masonic Medical Center, Special Projects Coordinator, Foundation and Physician Services
*CHC Co-Chairs
22You can also read