Swaziland - National Investment Profile - Food and Agriculture Organization
←
→
Page content transcription
If your browser does not render page correctly, please read the page content below

National Investment Profile. Water for Agriculture and Energy: Swaziland

National Investment Profile

                                                               Water for
                                                               Agriculture
                                                               and Energy
                                                               Final Report
                                                               Swaziland

                                        Mbabane/Rome

                                           June 2015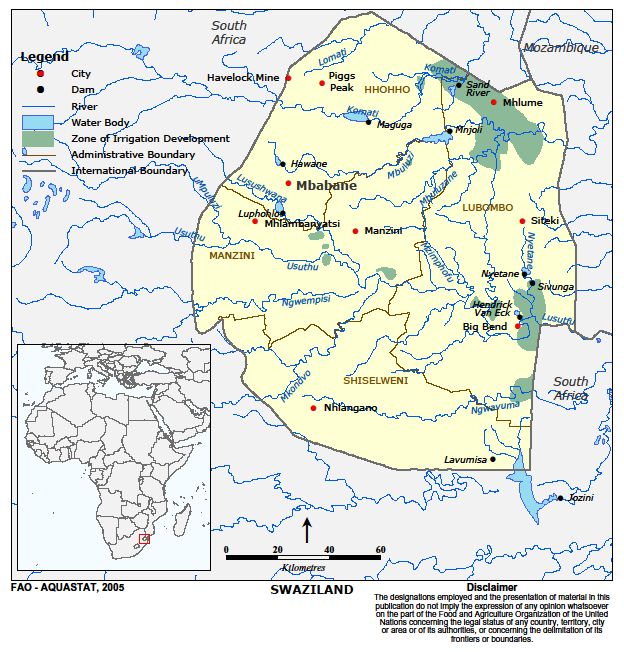
National Investment Profile. Water for Agriculture and Energy: Swaziland

         EXECUTIVE SUMMARY

Agriculture is of great importance to the development of the Kingdom of Swaziland in both economic
and social terms. In 2011, agriculture accounted for 7.48 percent of the total GDP of the country (World
Bank, 2014) and it employed approximately 11 percent of the total economically active population
(FAOSTAT, 2014). However, agriculture’s contribution to the economy has decreased gradually over the
last two decades, to the extent that the poor performance of this sector has turned the country into a
net importer of agricultural commodities (Thompson, 2014).

The agricultural sector has a dualistic character as it is divided into commercial and subsistence
subsectors. Subsistence farming is characterized by low levels of investment, irrigation and generally low
productivity while commercial agriculture is characterized by high levels of investment, irrigation and
high productivity. The farming systems in the country are still predominantly subsistence-based and
rain-fed, thereby explaining the country’s low productivity levels with gaps between current and
potential yields.

According to AQUASTAT, the irrigation potential of the country was estimated at 93 220 hectares with
49 843 hectares equipped for irrigation, while the area actually irrigated was 90 percent of the area
equipped for irrigation (44 859 hectares) (AQUASTAT 2012). Irrigation is the major user of water in the
country accounting for 96.6 percent of water withdrawal. The main crops produced are sugarcane, citrus
fruits, pineapples, vegetables and cotton (NDS, 2014). The Swazi Government recognizes the important
role of irrigation in contributing to closing the yield gaps which is reflected in the planned investment of
approximately US$444.5 million in irrigation projects by the government over a 10 year period (SNAIP,
2014).

Regarding energy resources, the country’s river network offers considerable potential for developing
hydropower in the country, particularly for mini and micro plants that utilize run-of-river flows.

The National Vision 2022 highlights the need to raising the capability of the agricultural sector. To this
end, Swaziland launched in 2010 the Comprehensive Africa Agriculture Development Programme
(CAADP) process and prepared several policy documents, like National Development Strategy 1997;
2014, National Water Policy 2005, Comprehensive Agriculture Sector Development Programme (CASP)
2005, National Irrigation Policy 2005, National Food Security Policy (2005), National Agriculture Summit
Report (2007), National Program for Food Security (Sectorial Development Plan for Agriculture
(2008/09-2010/11) and more recently the Swaziland’s National Agriculture Investment Plan (SNAIP)
2015-2025. All these plans aim to increase the area under irrigation, although with different specific
targets and time frames.

To translate these goals into reality, Swaziland is planning to implement a number of irrigation and
hydropower projects for a total estimated at US$665.4 million (18% of Swaziland’s GDP in 2013,
World bank) of which US$427.2 million is allocated to the development of small scale irrigation
schemes, US$51.2 million to the development of small/medium scale hydropower, US$14.8
National Investment Profile. Water for Agriculture and Energy: Swaziland million to the rehabilitation/modernization of irrigation schemes, US$2.5 million to the development of large scale irrigation schemes and US$470 000 to the development of large scale hydropower projects. The others category is worth US$169.2 million and is allocated for activities such as training, awareness raising and strengthening of sector institutions. No funding is allocated to the rehabilitation of hydropower plants. These figures show that investment in small-scale irrigation is predominant in the envelope. Investment will be mostly executed by public sources, some major irrigation projects are long term which coincides with the planned long term investment projects that are mainly in the SNAIP. It is important for the country to ensure an adequate institutional and political environment for the success of these investments. It is also recommended that mechanisms are put in place to encourage the participation of the private sector in developing water resources and to support project formulation in the long term for hydropower projects.
National Investment Profile. Water for Agriculture and Energy: Swaziland

TABLE OF CONTENTS
EXECUTIVE SUMMARY .................................................................................................................... 2
1.      CONTEXT ................................................................................................................................. 5
     1.1      AGRICULTURE AND FOOD SECURITY................................................................................ 5
        Agriculture .............................................................................................................................. 5
        Irrigation and water control.................................................................................................... 8
        Food security........................................................................................................................... 9
        Food self sufficiency................................................................................................................ 9
     1.2      WATER RESOURCES AND HYDROPOWER ...................................................................... 11
     1.3      CLIMATE CHANGE .......................................................................................................... 15
2       NATIONAL STRATEGIES FOR WATER, AGRICULTURE AND ENERGY ..................................... 17
        Overall development strategies............................................................................................ 17
        Agriculture and irrigation ...................................................................................................... 18
        Water resources.................................................................................................................... 21
        Energy and hydropower ....................................................................................................... 22
3       INVESTMENT ENVELOPE ....................................................................................................... 23
        Description of project portfolio ............................................................................................ 24
        Investment envelope ............................................................................................................ 25
        Cost distribution.................................................................................................................... 27
        Source of funding .................................................................................................................. 30
        Hectares to develop or rehabilitate ...................................................................................... 30
        Internal Rate of Return ......................................................................................................... 32
4       PROJECT PORTFOLIO ............................................................................................................. 34
5       CONCLUSIONS ....................................................................................................................... 35
ANNEX 1. PROJECT PORTFOLIO .................................................................................................... 37
     Table 1.1. ON-GOING PROJECTS ............................................................................................... 37
     Table 1.2. PIPELINE PROJECTS .................................................................................................. 43
ANNEX 2: MAP OF WATER CONTROL IN SWAZILAND .................................................................. 46
National Investment Profile. Water for Agriculture and Energy: Swaziland
1. CONTEXT
This chapter will give an introduction into the contextual information of agriculture and food
security (chapter 1.1), water resources and hydropower (chapter 1.2) and climate change in
Swaziland (chapter 1.3).
1.1 AGRICULTURE AND FOOD SECURITY
Agriculture
The Kingdom of Swaziland is a landlocked country, with an estimated 1.3 million inhabitants in 2014 of
which 79 percent are rural (World Bank, 2014). In recent years, the population has been growing at a
slow rate. The annual population growth rate was estimated at 1.64 percent in 2010 and had declined to
1.49 percent in 2013 (World Bank, 2014). In contrast, the economy has been growing at a fast rate, the
annual growth rate of the Gross Domestic Product (GDP) increased from 1.92 percent in 2012 to 2.79 in
2013 (World Bank, 2014). Agriculture, accounting for 7.48 percent of the total GDP of the country in
2011 (World Bank, 2014) and employing around 11 percent of the total economically active population
(FAOSTAT, 2014), is of great importance in both economic and social terms.
Agriculture’s contribution to the GDP has decreased gradually over the last two decades. The share of
agriculture to GDP fell from 15 percent in 1989 to 13 percent in 1999, 10 percent in 2001 and 7 percent
in 2011 (World Bank, 2014). Agriculture’s share of GDP has consistently been lower than 15 percent
since 1990 (World Bank, 2014). However, agriculture is more important for Swaziland’s population and
national economic development than its contribution to GDP suggests, because over 70 percent of the
population and households rely on agricultural output as a major source of income and food security
(NDS, 2014).
The performance of the agriculture sector has been affected by repeated droughts, underinvestment
and the devastating effects of HIV/AIDS and as a result, the poor performance of this sector has turned
the country into a net importer of agricultural commodities (Thompson, 2014). The value of agricultural
imports in 2012 was SZL3 273 million (US$275.74 million), an increase from SZL2 655 million (US$223.7
million) in 2011 while the value of agricultural exports in 2012 was SZL7 190 million (US$605.73 million),
as opposed to SZL10 867 million (US$915.5 million)1 in 2011 (CBS, 2013). Thus, the agricultural sector of
Swaziland has not recorded much growth; the average growth rate from 2005- 2011 is 1.31 percent
(World Bank, 2014).
The agricultural sector has a dualistic character as it is divided into commercial and subsistence
subsectors. The subsistence sub-sector is done on Swazi National Land (SNL) while the Title Deed Land
(TDL) is mainly used for commercial agriculture. Subsistence farming is characterized by low levels of
investment, irrigation and generally low productivity while commercial agriculture is characterized by
high levels of investment, irrigation and high productivity.
1
1US$=11.87SZL in 2011 (retrieved on www.oanda.com on 13-07-2015)National Investment Profile. Water for Agriculture and Energy: Swaziland TDL, covering 46 percent of the country, is privately owned land and it is used mainly for ranching, forestry or estate production of crops such as sugar cane (the main irrigated crop), citrus and pineapples. SNL, covering 54 percent of the country, is land held in trust by the King for the Swazi people, 61 percent of SNL farm holdings are less than one hectare in size (Thompson, 2014). The country is divided into four agro-ecological zones, based on elevation, landforms, geology, soils and vegetation. The Highveld, Middleveld and Lowveld occupy about 30 percent of the country each, while the Lubombo Plateau occupies less than one-tenth of the country. Poor soils restrict the agriculture of the Highveld to mainly grazing activities, as only 3 percent of the area of the region constitutes good arable soils. Close to 15 percent of the Middleveld have arable soils of good to fair quality, whilst about 20 percent of the Lowveld has good or fair soils. The Lubombo Plateau has about 12 percent arable soils of good to fair quality (Manyatsi and Brown, 2009). The country occupies a total land area of 1.7 million hectares which consists of about 1.2 million hectares of agricultural land. Of the latter, about 0.2 million hectares were actually cultivated; 178 000 hectares is arable land and 12 000 hectares are used for permanent crops (AQUASTAT, 2014). This indicates that there is still an evidence of food security challenges in Swaziland. Maize is the staple food and the most important crop grown in Swaziland. It is the most important subsistence crop on SNL, followed by groundnuts, pumpkins, beans, sweet potatoes and vegetables. Sorghum, cowpeas, jugo beans, melons, watermelons, cassava, bananas, peaches and avocados are also produced, but in limited quantities. The yield of maize in Swaziland is far below that of its neighbor country, South Africa; for example, yields in South Africa were 3 766 kg/ha for the 2012/2013 season, which is more than triple the yield of 1 086 kg/ha in Swaziland. The yields of potatoes, vegetables, citrus and bananas are also far less than that of South Africa too (FAOSTAT, 2014). As mentioned, maize is often produced by the vast majority of the small subsistence farmers with little or no access to irrigation, and production fluctuates depending on climatic conditions. In recent years maize production has been falling short of demand and the shortfall is imported mainly from South Africa. Maize was actually the main agricultural import commodity in the period 2007 -2011 (FAOSTAT, 2014). Figure 1 below compares average yields of the aforementioned crops for the period 2000-2012 in Swaziland with other developing countries. It can be seen that yield gaps can go over 200 percent, as it is the case for maize, which is a staple crop for the country, and as high as 600 percent for bananas when compared with South Africa. South Africa reaches outputs of around 35 365 kg per ha of maize, whereas Swaziland only produces about 11 767 kg/ha. Livestock production is a major agricultural activity in Swaziland too, with small farmers owning about 77 percent of the total cattle population. Cattle are the main livestock; other animal species raised in Swaziland are goats, sheep, pigs, equines and poultry. The traditional SNL sector manages about 86 percent of cattle and 95 percent of small stock whereas the commercial TDL system carries the rest; the stocking rate on SNL is two times larger than on TDL (CBS, 2010). Livestock production is a major activity in subsistence farming. About 80 percent of the national herd is owned by SNL farmers and the rest is owned by a small but very well developed commercial cattle industry.
National Investment Profile. Water for Agriculture and Energy: Swaziland

It is evident from the foregoing that the farming systems in the country are still predominantly
subsistence-based and rain-fed, which makes them dependent on weather fluctuations. In addition,
many agricultural policies have also been ineffective. Due to these challenges, the Government of
Swaziland has identified the modernization of the agricultural sector as a major priority (NDS 2014). The
role of irrigation in closing the yield gaps is also acknowledged by the Swazi government (SNAIP 2014).

According to His Majesty’s Government Programme of Action (MGPA) (2013 – 2018), the country is
adopting a paradigm shift from current dry-land, subsistence farming to irrigated, commercial
agriculture.

For the country to attain First World status, agriculture is expected to receive an accelerated support in
three key areas – broader access to water for irrigation purposes, assistance in the diversification of crop
production and encouragement of adding value to primary crops through an increase in agro-processing
activity (MGPA, 2013-2018).

 Figure 1: Yield gaps between Swaziland and other producing countries (2000-2012)

          450000

                                                                                                                                                                                                       ∆601%
          400000

                                                                                                                                                         ∆465%

                                                                                                                                                                                ∆373%
          350000

          300000

          250000

                                                                                                                                                                                                        South Africa
                                                                                                                                                                                        South Africa
                                                                                                                                                                 South Africa
  Hg/Ha

          200000

          150000
                                                                                                                       ∆239%

                                                                                                                                                Uganda
                                                                                                        South Africa
                             South Africa

                                                                                South Africa
                                            Δ201%

                                                    South Africa

                                                                    Indonesia

                                                                                                                                        Δ159%
                                                                                                                               Uganda

          100000
                     Δ299%

                                                                                  Δ616%

                                                                                                ∆143%

          50000

               0

                                                                   Swaziland                   Other Country

Own elaboration using FAOSTAT 2014 data
National Investment Profile. Water for Agriculture and Energy: Swaziland Irrigation and water control The country is rich in water resources with a high irrigation potential. According to AQUASTAT, the irrigation potential for the country, based on the physical land capability and water availability, is estimated at 93 220 hectares. In 2000, 49 843 hectares of the land was equipped for irrigation, with over 41 500 hectares being used for irrigated sugar cane. Of the total equipped for irrigation, around 48 843 hectares comes from surface water and 1 000 hectares comes from groundwater. In 2002 the harvested irrigated crop area was 45 480 hectares resulting in a cropping intensity of 101 percent (AQUASTAT 2012). More than 84 percent of the irrigated land is found in the Lowveld, with about 15 percent in the Middleveld. In the year 2002 the area actually irrigated was 90 percent of the area equipped for irrigation (44 859 hectares) (AQUASTAT, 2012). Public and private large scale schemes usually extract the irrigation water from reservoirs; while in small scale private schemes, irrigation water is normally abstracted from the rivers using electric pumps (FAO, 2014). About 10 large irrigation schemes (> 500 hectares) occupy 67 percent of the irrigated land. Medium irrigation schemes (50-500 hectares) and small irrigation schemes (< 50 ha) occupy 20 percent and 13 percent of the land respectively (AQUASTAT, 2005). Large schemes are dominant in TDL, while small schemes are dominant in SNL. In the latter, there are several micro-irrigation schemes which are communal projects funded by several NGOs and IFAD through the Swaziland Ministry of Agriculture and Cooperatives. These schemes occupy about 1 500 hectares of land scattered around the country (AQUASTAT, 2005). About 52 percent of the land is under surface irrigation, followed by overhead irrigation (drag lines, fixed sprinklers, center pivots, etc.) on 42 percent of the area. The remaining 6 percent of the area is under localized irrigation (Regional Report, 2005). Irrigation is the major user of water in the country accounting for 96.6 percent of water withdrawal. And the crops that are grown are sugarcane, citrus fruits, pineapples, vegetables and cotton (NDS, 2014). The dominant irrigated crop is sugar cane which covers over 91 percent of the harvested irrigated cropped area followed by citrus at approximately 6 percent (AQUASTAT, 2012). Smaller areas are covered by vegetables, maize, potatoes, rice and bananas. Temporary crops are irrigated only during dry summer, from April to August (AQUASTAT, 2005). Most of the irrigation activities are located in the Lowveld, which is the dryer part of the country, with low levels of annual rainfall rendering it more prone to droughts. Swaziland areas are categorized into three drought risk zones namely little/none, moderate and severe. The northwest Highveld region is in the little/none drought risk zone, with the highest amount of rainfall (1200–1500 mm). The south west Highveld, Middleveld and Lubombo regions are in the moderate drought risk zone with annual rainfall values ranging from 700 to 1 200 mm. The Lowveld region is in the severe drought risk zone with annual rainfall ranging from 500 to 700 mm (MTEA, 2011). Several irrigation and water resources development programmes exist in Swaziland. Relative improvements in large and medium-sized dam construction for enhancing agricultural production have been made. For instance, the development of Maguga and Lubovane dams under the Komati Basin
National Investment Profile. Water for Agriculture and Energy: Swaziland

Water Authority Lower Usuthu Smallholder Irrigation Projects (KOBWA LUSIP) respectively has increased
the areas under cultivation especially for sugar cane production (NDS, 2014).

Food security

According to the Comprehensive Agricultural Sector Policy (CASP) (2005), persistent shortages in
satisfying domestic food requirements have caused a significant proportion of the population to suffer
from under-nutrition, a high death toll in extreme cases, stunted growth among children and an
estimated 348 000 people to be vulnerable and food insecure in the country. As of 2005, 12 percent of
the population was estimated to be malnourished, and nearly one-third of the population needed food
aid to survive (CASP, 2005).

According to FAOSTAT (2014), Swaziland has not made appreciable progress in reducing the levels of
undernourishment. The share of undernourished in the total population increased from 16 percent in
the period 1991-93 to around 34 percent in 2010-12. However, the percent of children under five
suffering from malnutrition fell from 36 percent in 2000 to 31 percent in 2010 (FAOSTAT, 2014).

In order for the country to be food secured by 2022, the government has indicated its commitment to
continually build the capacity of the farmers to increase yields of food crops. Specifically the
government plans to increase maize production to 140 000 ton by 2018 and to 160 000 ton by 2022,
which represent a 60 percent increase on present levels (MGPA, 2013 – 2018).

Food self sufficiency

Since 1980 Swaziland has not been self-sufficient in its maize production (Figure 2). In the 1990s
Swaziland produced about 60 percent of its own staple food (maize) requirements, but since 2001
production has fallen under 40 percent (Table 2). The shortfall to cover consumption needs has always
been satisfied by commercial imports and food aid. Table 2 shows the maize production and imports for
the seasons from 2000/01 to 2010/11. In 2007/08, 650 000 beneficiaries received emergency food relief
under free food distribution (NDS, 2014). The serious gap in supply of maize has contributed to a 45
percent food price increase since 1998, which has further eroded the purchasing power of poor
households, and reduced their access to food (CASP, 2005).

As mentioned before, the largely subsistence-based agricultural sector in the country has failed to keep
up with rapid population growth, making Swaziland a net food and agricultural commodities importer.
The value of agricultural imports in 2011 was US$234 million which had a slight increase from 2010 for a
value of US$223 million. The value of agricultural exports in 2011 was US$277 million, an increase from
US$245 million in 2010 (FAOSTAT, 2014). Thus, the agricultural sector of Swaziland has not recorded
much growth, the average growth rate from 2005-2011 is 1.31 percent (World Bank, 2012). Figure 3
shows how Swaziland’s import bill for agricultural products has been on the rise ever since the late
1980s. It grew from US$42 million in 1986 to almost US$234 million in 2011. The sharpest increase was
in 2004, when the bill almost doubled. The main imported products (in value) for the period 2007-2011
were maize, wheat, food wastes and food prep nes (processed agricultural products) (FAOSTAT, 2014).
National Investment Profile. Water for Agriculture and Energy: Swaziland

As for exports, there has also been an increase from the late 1980s, but at a much slower pace than
imports. The export earnings for agriculture went up from US$100 million in 1986 to around US$277
million in 2011. Main exported products (in value) for the period 2007-2011 were sugar, edible
concentrate, wood pulp and citrus fruits.

Table 2: Maize production and imports for years from 2001 to 2011 in Swaziland

                 Production              Imports          Total Consumption        Imports as
                                                                               percentage of total
               ( 1 000 tonnes)       (1 000 tonnes)          ( 1 000 tonnes)
                                                                                  consumption
Year                                                                                (percent)

2001                82 536               72 124                  154 660               47

2002                67 639               71 327                  138 966               51

2003                69 273               84 775                  154 048               55

2004                68 087               86 200                  154 287               56

2005                74 540               111 600                 186 140               60

2006                67 127                76888                  144015                53

2007                26 170               101494                  127 664               79

2008                60 012               100000                  160012                62

2009                57 007               110000                  167007                66

2010                68 000               100000                  168000                60

2011                85 000               105000                  190000                55

Source: FAOSTAT 2014
National Investment Profile. Water for Agriculture and Energy: Swaziland Figure 2: Maize Production and Imports in Swaziland 1970-2011 Own elaboration using FAOSTAT 2014 data Figure 3: Trade in agricultural products in value 1970-2011 Own elaboration using FAOSTAT 2014 data 1.2 WATER RESOURCES AND HYDROPOWER Swaziland is well endowed with surface water resources, but has limited groundwater resources. Swaziland has 7 river basins (Figure 4). All except Komati, Usutu and Lomati originate from Swaziland. Development of the water resources from the three rivers (Komati, Usutu and Lomati) is subject to Southern African Development Community (SADC) protocols on shared water courses.
National Investment Profile. Water for Agriculture and Energy: Swaziland

Swaziland’s total annual renewable water resources are estimated at 4.51 km3. Annual internally
renewable water resources amount to 2.64 km3 made up of 2.64 km3 surface water and 0.66 km3
groundwater, while 0.66 km3 of the former is assumed to be an overlap between surface water and
groundwater. External water resources are estimated at 1.87 km3 /year originating from surface water
from South Africa. The total renewable water resources of the country are estimated at 4.5 km3/year,
with 42 percent originating from South Africa. The five main river systems in the country are the Komati,
the Lomati, the Mbuluzi, the Usutu and the Ngwavuma. The sixth river system contributing to surface
water in Swaziland is the Pongola River, which is found on the South African side, south of Swaziland.
The Jozini dam built on the South African side, floods some land on the Swaziland side and its water is
available for use in Swaziland. Swaziland has nine major dams, of which seven are used for irrigation
purposes, one for hydroelectric purposes and one for water supply. The total dam storage capacity as of
2010 is estimated at 585 million m3 (AQUASTAT, 2014).

According to AQUASTAT, the total annual water withdrawal was estimated at 1.042 km3 for the year
2000. Irrigation was the main water user with 0.993 km3 (95.3 percent), followed by municipalities with
0.024 km3 (2.3 percent), livestock with 0.013 km3 (1.2 percent) and industry with 0.012 km3 (1.15
percent) (AQUASTAT, 2014). According to Regional Report (2005), 95 percent of the water resources in
the country were used for irrigation.

The bulk of the groundwater resources occurs in the Highveld and Middleveld regions. With the
exception of the post-Karoo igneous intrusive formation and the recent thin alluvia along the major river
valleys, the strongly consolidated rocks of the Archean Basement Complex and the Karoo system
underlie practically all of Swaziland and limit the groundwater development potential of the country
(Regional Report 2005).

There are over 2 000 boreholes in the country, with over 1 340 boreholes in the Swaziland portion of the
Maputo River basin only. It is estimated that groundwater recharge rates in Swaziland range between 2
percent and 10 percent of average annual rainfall (Regional Report, 2005).

Regarding energy resources, the river network of the country offers considerable potential for
developing hydropower, particularly for mini and micro plants that utilize run-of-river flows. This
potential is, however, dependent on the country receiving good amounts of rainfall, which is not easy to
guarantee in view of the impact of climate change on the water resources of the country (Matondo and
Msibi, 2002).

Swaziland’s main electricity production is by hydro generation with a production capacity of 70.1 MW.
Swaziland produces hydroelectric power through four hydroelectric schemes, contributing to about 23
percent of energy supply in the country (NDS, 2014). Swaziland also has considerable amount of
potential for expanding its electricity generation through harnessing hydropower. Not only is there new
untapped capacity in a form of mini and micro hydropower plants, but there is also potential to expand
existing capacity (Mwendera, 2006).

Hydropower is the major source (more than 90 percent) of nationally produced electricity with installed
capacity. The Swaziland Electricity Company has conducted several studies for expanding the
National Investment Profile. Water for Agriculture and Energy: Swaziland

hydropower capacity. Two possible sites (Lower Maguduza, Ngwempisi) with a capacity of 20 MW and
one on the Ngwempisi River with a potential 120 MW) have been earmarked (NDS, 2014).

Due to limited capacity to generate hydropower, the Swaziland Electricity Board (SEB) imported most of
the electricity from the Electricity Supply Commission (ESKOM) in South Africa. In 2013, the imported
power was about 77 percent of the total electricity consumed in Swaziland (SEC, 2013). While the
future of locally generated hydropower is limited by dwindling water flows, the capacity to generate
more power can be increased by constructing additional dams (Mwendera, 2006).

In order to facilitate the development of water resources of common interest, in 1992 the governments
of Swaziland and South Africa signed a treaty for the establishment and functioning of the Joint Water
Commission. The Commission advises the two countries on all technical matters relating to the
allocation, development and control of water resources of common interest (AQUASTAT, 2005).

Another international body is the Komati Basin Water Authority (KOBWA) formed in 1993 by the two
governments to implement Phase 1 of the Komati River Basin Development Project comprising the
design, construction and maintenance of Driekoppes Dam in South Africa and the Maguga Dam in
Swaziland (AQUASTAT, 2005).

A Tripartite Technical Committee (TCTP), established under the Tripartite Agreements between
Swaziland, South Africa and Mozambique, is responsible inter alia for the identification and prioritization
of capacity-building challenges and opportunities in the water sectors of the three parties and the
establishment of regime allocations (AQUASTAT, 2005).

The member states of the Southern African Development Community (SADC) signed a protocol on
shared watercourses (Protocol on Shared Watercourses in SADC, 2000). The overall objectives of the
protocol are to foster closer cooperation for judicious, sustainable and coordinated management,
protection and utilization of shared watercourses and to advance the SADC agenda of regional
integration and poverty alleviation (AQUASTAT, 2005).
National Investment Profile. Water for Agriculture and Energy: Swaziland

 Figure 4: Main river basins with potential dam sites (blue boxes) in Swaziland

                                  Lomati

                                        Komati

                                                                         Mbuluzi

                Lusushwana

                                                              Great Usuthu

   Ngwempisi

                                                     Mhlathuzane
                Mkhondvo

                             Ngwavuma

                                                                Lavumisa

Source: Mwendera, 2006
National Investment Profile. Water for Agriculture and Energy: Swaziland
1.3 CLIMATE CHANGE
Swaziland has a subtropical climate with wet hot summers. Approximately 75 percent of the annual
rainfall occurs in the period from October to March (Regional report, 2005) and cold dry winters (April-
September). The climatic conditions range from sub-humid and temperate in the Highveld to semi-arid
and warm in the Lowveld. The climate of Swaziland is generally temperate in the western parts of the
country and subtropical in the eastern regions. The country experiences four distinct seasons (NDS,
2014).
Swaziland lies at the transition of major climatic zones, being influenced by air masses from different
origins: equatorial convergence zone (summer rains), subtropical eastern continental moist maritime
(onshore flow with occasional cyclones), dry continental tropical and marine west Mediterranean
(winter rains, with rare snow) (NDS, 2014).
Mean annual rainfall ranges from about 1 500 mm in the northern Highveld to 500 mm in the southern
Lowveld (MoTEA, 2011). Precipitation varies considerably from year to year, which either may lead to
periods of flash flooding or drought. Drought is an inherent feature of the current semi-arid climate
(Ministry of Tourism and Environmental Affairs, 2011).
The mean annual temperature varies from 16°C in the Highveld to 22°C in the Lowveld. The climatic
pattern, especially rainfall, has become very unpredictable and erratic with annual fluctuations and
variability in rainfall amounts and distribution attributed to the influence of climate change. Impacts of
climate change and especially the persistent drought and high temperature have affected agricultural
productivity adversely. The result is chronic food shortages with many households depending on food
aid (UNDP, 2010).
In Swaziland’s First National Communication to the United Nations Framework Convention on Climate
Change (UNFCCC) (Ministry of Public Works and Transport), the expected climate changes were
analysed for the period 1961-2075. The main findings are as summarized below:
1. Temperature increases in future years with varying magnitudes;
2. Precipitation projections on the other hand give mixed results;
3. As most of the country’s annual rainfall is received over the summer period, an increase in
precipitation over this period is likely to result in flooding conditions;
4. The projections of winter rainfall reduction also pose the problem of higher possibilities of
drought occurrences.
Agriculture, being predominantly rain-fed, is very vulnerable to climate change. The general observation
was that for the maize crop, most of the country could be unsuitable for its growth since yields are
estimated to decrease considerably. In the other regions yields could be improved by changing the
planting season from the traditional second week of October to the second week of August. For
sorghum and beans, yields are also projected to decrease in general with the exception of the western
parts where these are currently not grown extensively.National Investment Profile. Water for Agriculture and Energy: Swaziland
The First National Communication of Swaziland to the UNFCCC proposes measures centred in the energy
and forestry sectors to adapt and cope with climate change. These include i) the use of high-pressure
steam turbines burning bagasse and wood-pulp residue as input fuel in electricity generation, ii) use of
energy efficient boilers, and electric motors, iii) matching electric supply to demand, iv) Improved
maintenance and inspection of motor vehicles and v) gasoline/ethanol blending among other measures.
In Swaziland’s Second National Communication to the UNFCCC the expected climate changes are
analysed for the periods 2046 – 2065 and 2081 - 2100. The results showed:
1. A significant increase in the observed annual mean temperature.
Temperatures would continue to rise with the latter period having a relatively higher rate of
warming than the former;
2. Trends in rainfall indices were much more heterogeneous than those for temperature, whilst
there were statistically significant increases in some intensity related indices at specific locations
and for specific periods (Second National Communication to UNFCCC 2011).
In Swaziland, climate change is expected to affect production of crops differently depending on the crop
type, the agro-ecological zone and the planting time period for the particular crop. For example, maize
yields are most likely to be high when planted in the first week of December rather than when planted
in mid-October when there is enough rain. Increased maize yields are most likely from the Middleveld
than in any other region (Second National Communication to UNFCCC, 2011).
The Second National Communication of Swaziland to the UNFCCC proposes the following measures to
adapt and cope with climate change: i) shifting planting periods, ii) growing of drought tolerant crops,
and iii) raising suitable crops in appropriate regions.
Since the publication of its First National Communication, Swaziland has undertaken a number of
activities that can broadly be presented as addressing the needs of climate change and these include:
the establishment of a National Climate Change Committee (NCCC) and a Designated National Authority
(DNA) to handle and manage Clean Development Mechanism (CDM) project applications and processes,
and conducting various programmes on public awareness at grassroots level.
Besides establishment of the NCCC and DNA, Swaziland is working toward developing a climate change
strategy and action plan with financial support from the UNDP Country Office.
One notable activity related to technology transfer was the undertaking of a Technology Needs
Assessment (TNA) in 2010. The objective of this exercise was to identify and evaluate climate change
mitigation and adaptation technologies and measures that are in line with national development
priorities in Swaziland (MoTEA, 2011).
In September 2010, the Ministry of Tourism and Environmental Affairs established a multi-sectorial
NCCC comprised of various Swaziland government Ministries. The NCCC is responsible for developing
and coordinating programmes and projects aimed at addressing climate change in line with the
country's development priorities (Ministry of Tourism and Environmental Affairs, 2011).National Investment Profile. Water for Agriculture and Energy: Swaziland 2 NATIONAL STRATEGIES FOR WATER, AGRICULTURE AND ENERGY This chapter will discuss the national strategies for water, agriculture and energy divided over four categories: overall development strategies, agriculture and irrigation, water resources and energy and hydropower. Overall development strategies Swaziland’s overall development agenda is guided by its National Vision 2022 that was launched in 1997. Vision 2022 aims to build a truly Twenty-First Century Kingdom of Swaziland, culturally united, integrated and stable, economically prosperous and socially well organised with equal opportunities for all, irrespective of gender, and responsibility from all. Vision 2022 has been incorporated into the national development planning process through the development of the National Development Strategy (NDS). The goal of the NDS is that by the year 2022, the Kingdom of Swaziland will be in the top ten percent of the medium human development group of countries founded on sustainable economic development, social justice and political stability (Dlamini, 2010). The NDS guides the long-term socio-economic development of the country and gives direction for the development of key economic sectors including agriculture. The NDS highlights the need of raising the capability of the agricultural sector to generate a higher volume of goods and services for given factors of production, without destroying the environment. It emphasizes the importance of food security at the household and community levels, commercialisation of agriculture on SNL, efficient water resource management and usage, and rational land allocation and utilization (CASP, 2005). In pursuit of achieving the vision and mission of the NDS, the Government formulated the Poverty Reduction Strategy and Action Programme (PRSAP) in 2006. The goal of the PRSAP is to reduce poverty by more than 50 percent in 2015, currently at 63 percent of the total population (World Bank, 2014), and absolutely eradicate it by 2022. It is a critical component for operationalising the NDS and achieving this vision. It is the overarching framework for addressing poverty and challenges related to poverty. The PRSAP is composed of six pillars, where agricultural development mainly falls in pillar number three: “Empowering the Poor to Generate Income and Reduce Inequalities”. However, across all the pillars, strategies for addressing agricultural development still appear because agriculture has been identified as a key driver for poverty reduction (NDS, 2014). The vision of the updated NDS proclaims the following: “By the Year 2022 the Kingdom of Swaziland will have attained a level of development akin to that of developed countries while ensuring, that all citizens are able to sustainably pursue their life goals, enjoy lives of value and dignity in a safe and secure environment in line with the objectives of Sustainable Development.” The vision attaches a high premium on improving the quality of life and prosperity for all individual citizens in the country and proclaims that from the year 2014, the Kingdom of Swaziland will improve its world standing in terms of measurable indices of sustainable human development considerably.
National Investment Profile. Water for Agriculture and Energy: Swaziland
Underpinning the vision is the need to fast track the growth of the economy and transform Swaziland
from its current limited agricultural and manufacturing base to a higher state of industrialization which
will ultimately pave the way for an advanced information-based society and knowledge-based economy.
The attainment of this vision hinges on four thematic areas namely i) good governance, ii) a vibrant and
diverse economy, iii) environmental sustainability and iv) highest human capital and social development
(NDS 2014). Above all, every citizen is expected to contribute towards the attainment of the strategic
goals of the vision. By its very nature, this vision is quantifiable and can be measured on the basis of
objective criteria. Some of its dimensions are reflected in the Human Development Index (HDI) and
Swazi Development Index (SDI).
Agriculture and irrigation
The NDS gives directions for the development of various economic sectors including agriculture. To drive
the agricultural development programme, the Government formulated the Comprehensive Agriculture
Sector Policy (CASP), which is currently the guide for all agricultural programmes. The CASP goal and
objectives have been formulated in accordance with the national aspirations as stated in the Vision 2022
and the NDS. CASP aims to focus on the contribution of the agriculture sector to the realization of the
Vision 2022 and to the achievement of national development goals of the NDS. The goal of CASP is,
therefore, to ensure that the agriculture sector contributes fully to the socio-economic development of
the country. The broad objective is to provide clear guidance on policy options and measures necessary
to enhance sustainable agriculture sector development and its contribution to overall economic growth,
poverty alleviation, food security and sustainable natural resources management. The following specific
objectives are set to be pursued by CASP:
Increase agricultural output and productivity;
Increase the earnings for those engaged in agriculture by promoting adoption of diversification
and sustainable intensification and use of appropriate technology;
Enhance food security;
Ensure sustainable use and management of land and water resources;
Stabilize agricultural markets.
As a sign of commitment to agricultural development, the Government of the Kingdom of Swaziland
hosted a summit in July 2007, where various Heads of State and stakeholders were present. After
deliberations in this Summit, a resolution was made, and all stakeholders agreed that agriculture is the
backbone of the economy. The Summit resolved to transform the agriculture sector through farmer
empowerment. To speed up implementation of these policy initiatives, in 2008 a five-year Government
Action Plan was produced. Food security became one of the priorities along with health services
(CAADP, 2010).
The Government agenda for ensuring agricultural growth, poverty reduction and food and nutrition
security is guided by the following development policies and strategies i) NDS (Vision 2022), PRSAP
2006, CASP 2005, National Food Security Policy (2005), National Agriculture Summit Report (2007),National Investment Profile. Water for Agriculture and Energy: Swaziland National Program for Food Security , Sectorial Development Plan for Agriculture (2008/09-2010/11). The overall objective of the agricultural sector as outlined in the CASP is to facilitate and support the development of a sustainable and competitive agricultural sector that ensures food security at national and household levels and maximizes the sector’s contribution to the GDP. The overall goal of the 2005 National Irrigation Policy is to ensure that the irrigated agriculture sub- sector in Swaziland contributes fully to economic growth and poverty alleviation in accordance with national development goals, the Water Act of 2003 and the need to use the country’s resources in a sustainable manner. The Policy has three specific objectives: optimize the productivity of water in the country’s agricultural sector and broaden the scope for agricultural intensification and diversification; establish an irrigation sector institutional landscape characterised by transparent regulation and strong, participatory and/or responsive and accountable institutions in Swaziland and ; enhance the structure of the irrigated sub-sector by promoting new public and private investment opportunities for emerging farmers (Dlamini, 2010). The policy covers areas such as water productivity in agriculture, soil erosion, exploitation of wetlands, control of alien invasive plant species, efficiency of irrigation systems, construction of irrigation infrastructure including dam construction and water allocation issues as well as the active participation of youth and women in irrigated agriculture. This Water Act of 2003 was developed to harmonise the management of water resources in the country through the establishment of a National Water Authority and formulation of a Water Resources Master Plan. According to His Majesty’s Government Programme of Action (MGPA) (2013 – 2018), the government plans to increase the area under irrigation by 10 000 hectares by 2018 with an additional increase of 4 000 hectares by 2022 by constructing 25 medium-sized dams and 12 earth dams per year. The long-term goal of the National Food Security Policy (NFSP) (2005) is to ensure that “All people in Swaziland, at all times, have physical and economic access to sufficient, safe and nutritious food to meet their dietary needs and food preferences for an active and healthy life.” This goal is based on the four pillars of food security, namely, food availability, access to food, food utilisation and nutritional requirements. It has four specific objectives: i) ensure that a sufficient quantity of food of appropriate quality is available to all people in Swaziland through domestic production and import; ii) ensure that there is access by all individuals in Swaziland to adequate resources (entitlements) to acquire appropriate foods for a nutritious diet; iii) ensure that all individuals in Swaziland reach a state of nutritional wellbeing for which all physiological needs are met and; iv) and ensure that all people in Swaziland have access to adequate food at all times (NFSP, 2005). At the international level, the Comprehensive Africa Agricultural Development Programme (CAADP) has been endorsed by the African Heads of State and Government as a framework for the restoration of agriculture growth, food security, and rural development in Africa. The CAADP is an initiative of the African Union (AU) within the context of The New Partnership for Africa’s Development (NEPAD). The CAADP framework and process is core to efforts being undertaken by African Governments to accelerate economic growth, enhance food and nutrition security and eliminate hunger in the continent. The CAADP framework and process is expected to clarify sector policy, budgetary and investment
National Investment Profile. Water for Agriculture and Energy: Swaziland

commitments. This initiative will help accelerate the county’s realisation of its goals and aspirations in
the agricultural sector. In Swaziland these goals and aspirations are as stipulated in several national
development documents, e.g. NDS, National Agriculture Summit and Agenda for Action (NASAA), PRSAP,
and the National Food Security Policy.

CAADP has four pillars which serve as the bases for its implementation: i) Land and water management,
ii) Market access, iii) Food supply and hunger, and iv) Agricultural research (CAADP, 2010).

A wide range of programmes; sub-programmes and projects, have been identified by the Swazi
government as investment options that can accelerate agriculture development and reduce poverty.
These programmes are aligned with the CAADP pillars. The primary CAADP goal is agriculture led
development that eliminates hunger, reduces poverty and food insecurity, opening the way for export
expansion. To this end, countries are expected to increase agricultural productivity by at least 6 percent
per annum and increase public investment in agriculture by up to 10 percent of the national annual
budget. In the case of Swaziland, neither the targeted productivity nor the budgetary allocations have
thus far been attained (NDS 2014). Chapter three will elaborate on the public investment in irrigation
and hydropower projects.

The NDS, CASP, PRSAP, National Water Policy, National Irrigation Policy and the CAADP were the basis
for the development of the Swaziland National Investment Plan (SNAIP) (2014). The overall goal of the
SNAIP is to increase the contribution of agriculture to economic development, reduce rural poverty and
improve food and nutrition security. The development objective of the SNAIP is to achieve six percent
agricultural growth, consistent with national objectives for natural resource management, rural poverty
reduction and food and nutrition security. The major impact indicators of the SNAIP are closely aligned
with continental CAADP initiative and national policies. For example, one of the targets is to achieve an
average agriculture annual growth rate of 6 percent, up from the average of 3.6 percent through
supporting public expenditure of at least 10 percent of the national budget (SNAIP 2014).

The SNAIP concentrates on five main programmes for investment in the next ten years and embodies
the 2022 vision of the NDS. These are interrelated and complementary towards achieving the overall
goals and objectives of the plan. The five programmes are: i) Sustainable Natural Resources
Management; ii) Improved Access to Markets and Value Chains; iii) Food Supply and Reducing Hunger;
iv) Agricultural Research, Training and Extension and; v) Agricultural Knowledge Management. Cross-
cutting issues such as climate resilience, involvement of marginalized and vulnerable groups, poverty
reduction, and food and nutrition security are mainstreamed across all the programmes. Each
programme includes sub-programmes in the form of ongoing projects/programmes and developmental
interventions which require new projects and up-scaling in terms of geographical coverage, increased
number of beneficiaries and enhanced output.

Programme 1 focuses on sustainable use of natural resources (water, land, and environment). A key
element of the SNAIP, consistent with pillar 1 of the CAADP compact, is the management of Swaziland’s
land and water resources in ways that improve overall productivity in a sustainable manner. This
translates into capturing and storing as much rainfall as possible in the soil or in storage structures so
National Investment Profile. Water for Agriculture and Energy: Swaziland

that it can be used efficiently for rain fed and irrigated crops; as well as sustainable management of land
resources to maintain and increase their productivity (SNAIP, 2014).

As per programme 1 objectives, water harvesting will be done at different levels starting from the main
river basins where the target is to develop one large scale dam (Ethemba) and provide funds for
feasibility studies of another large scale dam (Nsilingane). These dams are expected to provide sufficient
water to irrigate up to 10 000 hectares and provide water for electricity generation and domestic and
industrial uses. The next level is the construction of 15 medium scale dams with a combined capacity to
irrigate more than 750 hectares of non-sugar crops2 and 45 small scale earth dams to provide drinking
water for livestock in the dry regions of the country as well as downstream water for irrigated gardening
for income generation and household food security. In addition, the construction and rehabilitation of
irrigation schemes to provide land equipped with irrigation infrastructure in excess of 1 000 hectares is
planned. This is expected to benefit 1 000 households directly (SNAIP, 2014).

Improvement of land use planning and environmental management at local level will be done through
developing and up-scaling the concept of chiefdom development planning (targeting a total of 30
chiefdoms within ten years of the plan). Land rehabilitation and environmental conservation are
included as specific components of the programme, including development of fisheries, forestry and
improving rangeland management and control of alien invasive species (SNAIP, 2014).

Water resources

A National Water Policy was promulgated in 2009 after the incorporation of inputs from stakeholders in
the water sector. The policy promotes sustainable water development and management in the interest
of the entire country and region without abdicating state integrity and responsibility towards
neighboring countries. It provides guidance to stakeholders in the water sector regarding integrated
planning, development and management of water resources, with particular emphasis on the role and
responsibility of stakeholders. It also seeks to ensure equitable access to water resources by all sectors
of society without prejudicing existing users.

The Draft National Water Policy (2009) also acknowledges the need for water conservation in relation to
irrigation. One of the strategies for water conservation in irrigated agriculture is to promote the use of
efficient irrigation systems, re-use of water and the construction of water storage facilities for irrigation
purposes.

The Integrated Water Resources Master Plan (IWRMP) was developed in line with the Constitution
declarations, Government Vision and other national documents such as NDS. The plan is to provide
strategic guidance to decision and policy makers, water managers and water users on how best to
develop and manage the country’s water resources (Swaziland Government 2011).

The establishment of a National Water Authority, through the Water Act of 2003, is responsible for
overseeing all water resources development and management issues in the country.

2
    Includes fruit trees, beans, vegetables and bananas
National Investment Profile. Water for Agriculture and Energy: Swaziland Energy and hydropower The National Energy Policy (NEP) was promulgated in 2003. Its overall goal is to ensure that the development goals of the country are met through the sustainable supply and use of energy for the benefit of all the citizens of the country through five specific objectives: i) ensure access to energy for all; ii) enhance employment creation; iii) ensure security of energy supply; iv) stimulate economic growth and development and; v) ensure environmental and health sustainability. Swaziland has several renewable energy resources including biomass, solar energy, and hydro energy. The two main renewable sources of energy in Swaziland are biomass and hydroelectric power (NDS, 2014). Regarding hydropower, Swaziland’s main electricity production is by hydroelectricity with a production capacity of 60.4 MW. Swaziland produces hydroelectric power through four hydroelectric schemes, contributing to about 15-17 (Swaziland Electricity Company, 2014) percent of energy supply in the country. The Swaziland Electricity Company has conducted several studies for expanding the hydropower capacity. Two possible sites (Lower Maguduza with a capacity of 20 MW and one on the Ngwempisi River with a potential 120 MW) have been earmarked (NDS, 2014). The major demand sectors for electricity in Swaziland are agriculture, industrial, commercial and domestic sectors reaching a maximum demand of 200 MW in 2011 (SEC, 2011). Notwithstanding, the current domestic energy generation capacity is very low and Swaziland depends highly on imported energy sources. In 2013, 821.9 GWh of electricity was imported and about 239.8 GWh was generated locally (SEC, 2013). In order to increase the country’s energy security, the central focus of the renewed strategy will be to develop domestic power generation capacity while at the same time using imported energy until self- sufficiency is attained. (NDS, 2014). The Ministry of Natural Resources and Energy (MNRE) developed a Renewable Energy Action Plan in 1997 as a long-term programme for the development of renewable energy. A number of activities in the plan have already been undertaken but there are still activities requiring attention. The vision of the MNRE is to create a conducive environment that promotes the efficient and effective utilization, beneficiation and management of natural resources in order to enhance sustainable socio- economic development. In pursuit of this vision, the MNRE formulated the 2014-2018 strategic plan as a vehicle for its effective implementation. The MNRE’s Strategic Plan for 2014-2018 is a composite document that will help improve the internal general program coordination and builds from the momentum of the Strategic Plan 2009-2011. The strategy is further informed by the imperatives of the Government Plan of Action for 2022. It seeks to position the MNRE to meet its obligations in respect to the Investor Roadmap, the Program of Action for Vision 2022, the NDS and the Millennium Development Goals (MDGs). In view of the macro-environmental challenges that were confronted by the Ministry during the 2009- 2011 period, some of the critical deliverables that were not attained in the period 2011-2013 have been incorporated into the strategic plan for 2014-2018. One of strategic objectives of the 2014-2018
You can also read