November 2020 Housing Element and Fair Share Plan - Hanover Township Morris County, New Jersey - Hanover Township Planning Board - Hanover ...
←
→
Page content transcription
If your browser does not render page correctly, please read the page content below
November 2020
Housing Element and
Fair Share Plan
Hanover Township
Morris County, New Jersey

PREPARED FOR:
Hanover Township Planning Board
BA: 3071.01
NOVEMBER 4, 2020
ADOPTED: NOVEMBER 17, 2020
b a                             Community Planning
                                    Land Development and Design
                                    Landscape Architecture
                                                                                                                  Principals:
                                                                                                   Joseph H. Burgis PP, AICP
                                                                                           Edward Snieckus, Jr. PP, LLA, ASLA
                                                                                                       David Novak PP, AICP

B      U R G I S
A   S S O C I A T E S,   I   N C.

NOVEMBER 2020 HOUSING ELEMENT AND FAIR SHARE PLAN
HANOVER TOWNSHIP
MORRIS COUNTY, NEW JERSEY

PREPARED FOR:

HANOVER TOWNSHIP PLANNING BOARD
BA# 3071.01

The original document was appropriately signed and sealed on November 4, 2020 in accordance with
Chapter 41 of Title 13 of the State Board of Professional Planners.

_____________________________                                            _____________________________
Joseph H. Burgis P.P, AICP                                               Robyn K. Welch, P.P., AICP
Professional Planner #2450                                               Professional Planner #5971

                                                          November 4, 2020

                                                   Adopted: November 17, 2020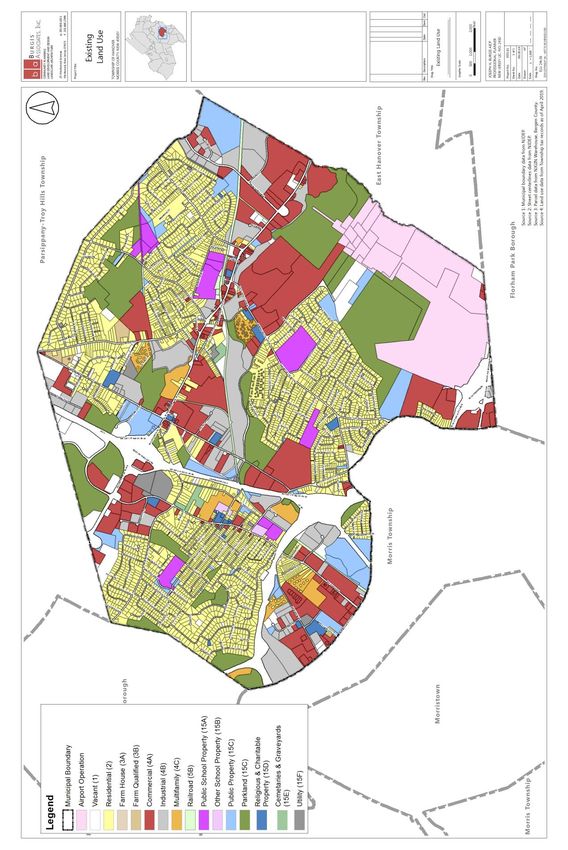
MEMBERS OF THE HANOVER TOWNSHIP PLANNING BOARD

           Eugene Pinadella, Chairperson
          Peter De Nigris, Vice-Chairperson
      Thomas “Ace” Gallagher, Director of Planning
              John L. Ferramosca, Mayor
              Bill Byrne, Class II Member
                   Michael E. Critchley
                     Robert Deehan
                     Russell Dobson
                      Howard Olsen
                 Phil Glawe, Alternate 1
              Charles Monzo, Alternate 2

               Planning Board Secretary
               Kimberly Bongiorno, LUA

                Planning Board Attorney
                  Michael Sullivan, Esq.

                   Township Planner
                  Blais Brancheau, P.P.

                  Township Engineer
                 Gerardo Maceira, P.E.

                Township Committee
             Mayor John L. Ferramosca
        Thomas “Ace” Gallagher, Deputy Mayor
                 Ronald F. Francioli
                   Brian J. Cahill
                 Michael A. Mihalko

         Township Clerk/Business Administrator
              Joseph A. Giorgio, R.M.C.

                  Township Attorney
                  Fred Semrau, Esq.

        Affordable Housing Planning Consultant
               Joseph H. Burgis, PP, AICP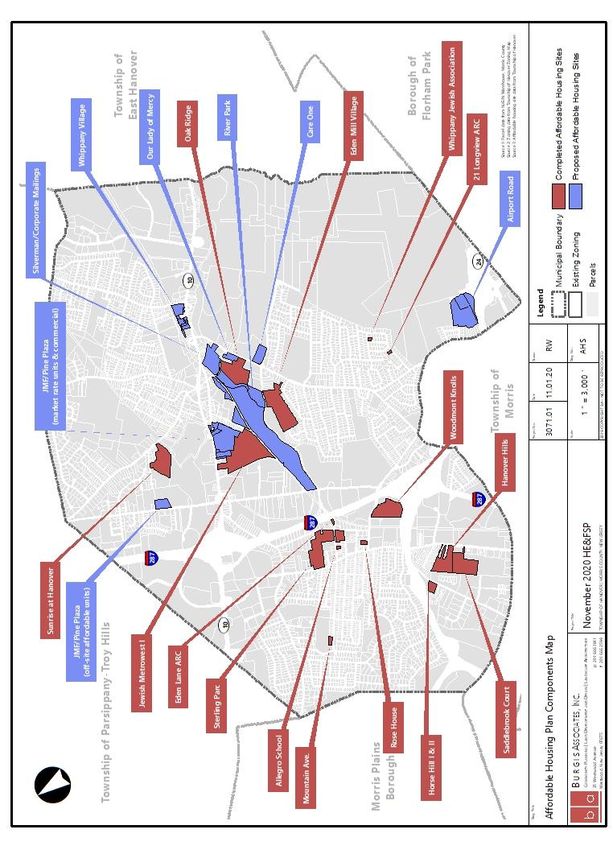
TABLE OF CONTENTS

Introduction                                                                                    1

Section I: Housing Element                                                                     7

Section II: Fair Share Obligation                                                             25

Section III: Fair Share Plan                                                                  31

Appendices                                                                                    64

                                         LIST OF TABLES

Table 1: Certified Prior Round Plan Components                                                  3
Table 2: Dwelling Units (1990 to 2017)                                                         11
Table 3: Housing Units by Tenure and Occupancy Status (2000 and 2017)                          11
Table 4: Units in Structure (2000 and 2017)                                                   12
Table 5: Number of Bedrooms in Housing Units (2000 and 2017)                                  12
Table 6: Year Structure Built                                                                 13
Table 7: Occupants Per Room (2000 and 2017)                                                   13
Table 8: Occupied Housing Units - Equipment and Plumbing Facilities (2000 and 2017)           14
Table 9: Gross Rent of Specified Renter-Occupied Housing Units (2000 and 2017)                14
Table 10: Value of Owner-Occupied Housing Units (2000 and 2017)                               15
Table 11: Completed Affordable Units                                                          16
Table 12: Number of Residential Building Permits Issued for New Construction (2009 to 2018)   17
Table 13: Population Growth (1920 to 2017)                                                    18
Table 14: Age Characteristics (2000 and 2017)                                                 19
Table 15: Average Household Size (1970 to 2017)                                               20
Table 16: Household Income Distribution (1999 and 2017)                                       20
Table 17: Employment Status, Population 16 and Over (2000 and 2017)                           21
Table 18: Employed Residents Age 16 and Over, By Occupation (2000 and 2017)                   21
Table 19: Employed Residents Age 16 and Over, By Industry (2000 and 2017)                     22
Table 20: Covered Employment Trends (2007 to 2017)                                            23
Table 21: Non-Residential Space Authorized by Building Permits (sq. ft.) (2009 to 2018)       23
Table 22: Plan Minimums and Maximums                                                          34
Table 23: Plan Components Satisfying Prior Round Obligation                                   35
Table 24: Satisfaction of Prior Round Minimums and Maximums                                   36
Table 25: Plan Components Satisfying Third Round RDP                                          36
Table 26: Satisfaction of Third Round Minimums and Maximums                                   37
LIST OF MAPS
Existing Land Use Map 9
Environmental Constraints Map 10
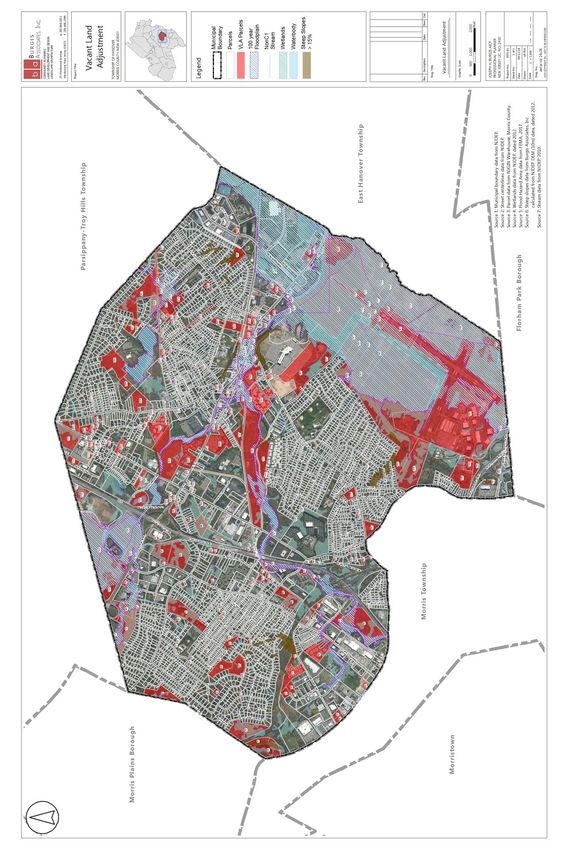
Vacant Land Adjustment Map 30
Aerial 1: Hanover Hills 37
Aerial 2: Sunrise at Hanover 38
Aerial 3: Eden Mill Village 39
Aerial 4: Oak Ridge 39
Aerial 5: Sterling Parc 40
Aerial 6: Saddlebrook Court 41
Aerial 7: 21 Longview Dr. ARC 41
Aerial 8: Horse Hill Rd. I ARC 42
Aerial 9: Whippany Jewish Association 42
Aerial 10: Mountain Ave. ARC 43
Aerial 11: Eden Lane ARC 44
Aerial 12: Allegro School 44
Aerial 13: Woodmont Knolls 45
Aerial 14: Jewish Metrowest I 46
Aerial 15: Rose House 46
Aerial 16: Horse Hill Rd. II ARC 47
Aerial 17: Silverman/Corporate Mailings 48
Aerial 18: Airport Road 50
Aerial 19: River Park 52
Aerial 20: JMF/Pine Plaza 55
Aerial 21: Proposed Off-Site Location of JMF/Pine Plaza Affordable Housing Units 56
Aerial 22: Whippany Village 58
Aerial 23: Our Lady of Mercy 59
Aerial 24: Care One 61
Affordable Housing Plan Components Map 63
APPENDICES
A-1 Structural Conditions Survey
A-2 Vacant Land Assessment Table
A-3 Affordable Housing Professionals of New Jersey 2020 Regional Income Limits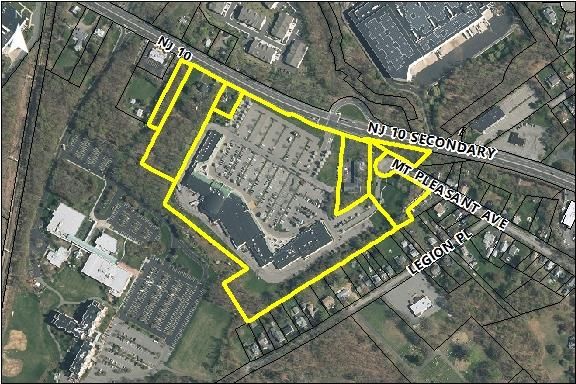
INTRODUCTION

Historic Overview of the Courts and COAH

In 1975, the New Jersey Supreme Court decided So. Burl. Cty. N.A.A.C.P. v. Tp. Of Mt. Laurel, 67
N.J. 151 (1975)(“Mount Laurel I”), in which it held that every developing municipality in the state
had an affirmative constitutional obligation to provide for its fair share of affordable housing.
After there was little movement by municipalities to produce affordable housing, the Supreme
Court issued a second decision known as So. Burlington Ct. N.A.A.C.P. v. Mount Laurel Tp., 92
N.J. 158 (1983)(“Mount Laurel II”), in which it created the builder’s remedy lawsuit in an effort to
get municipalities to comply with their constitutional affordable housing obligations. The
Supreme Court also refined the constitutional obligation to focus primarily on those municipalities
with portions of their boundaries within the growth area as shown on the State Development and
Redevelopment Plan, and called for the state legislature to enact legislation that would save
municipalities from the burden of having the courts determine their affordable housing needs. As
a result, the state legislature adopted the Fair Housing Act in 1985, and this was followed by the
establishment of the New Jersey Council on Affordable Housing (COAH), the State agency
responsible for overseeing the manner in which the State’s municipalities address their low and
moderate income housing needs.

COAH adopted regulations establishing housing need numbers for the First Round obligation
covering the years 1987 to 1993, and established Second Round housing-need numbers that
cumulatively covered the years 1987 through 1999. Under both the First and Second housing
rounds COAH utilized what is commonly referred to as the “fair share” methodology.

COAH utilized a different methodology, called “growth share,” to prepare Third Round housing-
need numbers. COAH first adopted Third Round substantive and procedural rules in 2004. These
regulations were challenged, and in January of 2007, the Appellate Division invalidated various
aspects of the regulations and remanded considerable portions of the rules to COAH with the
directive to adopt revised rules.

In May 2008, COAH proposed revised Third Round regulations, which became effective on June
2, 2008. On the same day, COAH proposed amendments to the rules it just adopted, and said
amendments went into effect in October 2008.

The rules and regulations adopted in 2008 were also challenged, and in October 2010, the
Appellate Division concluded that COAH’s revised 2008 regulations suffered from many of the
same deficiencies as the first iteration of COAH’s Third Round rules, and it therefore invalidated
substantial portions of the 2008 Third Round regulations, including all regulations that dealt with
the growth share methodology. See In re Adoption of N.J.A.C. 5:96 & 5:97, 416 N.J. Super. 462
(App. Div. 2010). The Supreme Court affirmed this decision in September 2013, and on March 14,
2014, issued an order which required COAH to adopt new Round 3 regulations by October 22,
2014.

                                                               25 Westwood Avenue, Westwood NJ 07675           1
                                                       p: 201.666.1811 | f: 201.666.2599 | e: jhb@burgis.com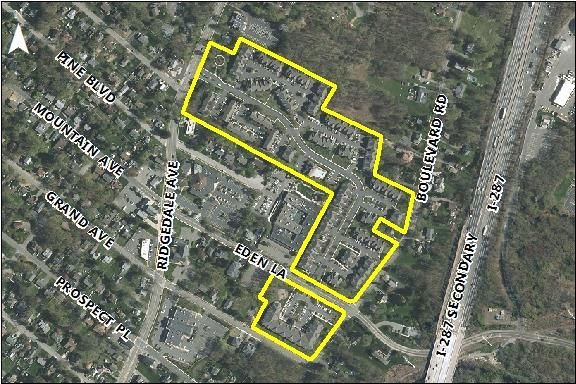
Unfortunately, COAH failed to adopt their newly revised Third Round regulations, deadlocking
with a 3-3 vote in October of 2014. Fair Share Housing Center (“FSHC”), who was a party in both
the 2010 and 2013 cases, responded by filing a motion in aid of litigants rights with the New
Jersey Supreme Court. The Supreme Court heard the motion in January 2015, and on March 10,
2015 issued In the Matter of the adoption of N.J.A.C. 5:96 and 5:97 by the New Jersey Council on
Affordable Housing, 221 N.J. 1 (2015)(“Mount Laurel IV”). In this decision, the Supreme Court held
that COAH was effectively dysfunctional, and consequently, returned jurisdiction of affordable
housing issues back to the trial courts, where it had been prior to the creation of COAH in 1986.

The Mount Laurel IV decision also created a process for municipalities, like Hanover, that have
endeavored to address their fair share obligations in the past, but could not obtain Third Round
substantive certification of their Housing Element and Fair Share Plan (HE&FSP) because of
COAH’s inaction, to instead work towards getting its plan approved via a Third Round Judgment
of Compliance and Repose. These municipalities were entitled to file declaratory judgment
actions seeking to declare their affordable housing plans constitutionally compliant, and were
also entitled to apply for temporary immunity from all Mount Laurel lawsuits, including builder’s
remedy lawsuits, while they prepared a new or revised affordable housing plan.

In response to the Mount Laurel IV decision, the Township of Hanover filed a Declaratory
Judgment Complaint, along with a simultaneous motion for temporary immunity, on July 2, 2015.
The Court granted temporary immunity to the Township on August 14, 2015, which has been
subsequently extended via the entry of a series of court orders through the present date.

The Township’s Historic Response to Its Affordable Housing Obligations

Hanover has prepared a number of Housing Elements and Fair Share Plans over the years to
address its affordable housing obligations. The Township was initially granted a judgment of
compliance and repose to address an obligation of 250 units (new construction) on September
24, 1984 by the Honorable Stephen Skillman, J.S.C.

The 1984 Judgment of Compliance and Repose included the zoning of five sites to address the
Township’s 250-unit First Round obligation. An RM Residential Multifamily district encompassing
these sites was adopted (Ordinance 19-84) to implement this Judgment, permitting multifamily
development, consisting of townhouse, garden apartment and other housing types, with a 22
percent set-aside for low and moderate income units.

In 1994, COAH issued new housing need numbers for the combined First and Second Round
period between 1987 and 1999. Hanover was assigned a pre-credited need of 366 units, inclusive
of a 355-unit new construction obligation and an 11-unit rehabilitation share. This number was
ultimately reduced to 83 units after credits and reductions for zoning in place were considered.

                                                              25 Westwood Avenue, Westwood NJ 07675           2
                                                      p: 201.666.1811 | f: 201.666.2599 | e: jhb@burgis.com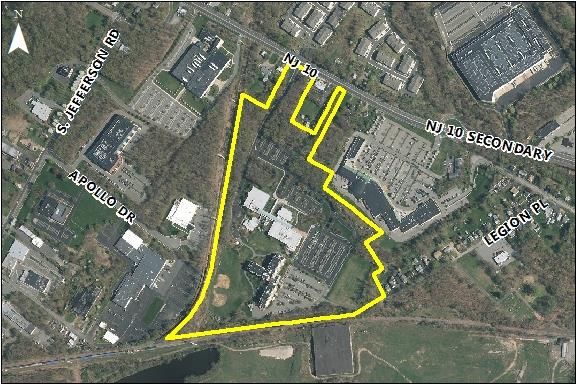
The calculated need of 83 units consisted of 72 new construction units and 11 rehabilitation units.
The Township’s Second Round Housing Element and Fair Share Plan (adopted July 22, 1997)
addressed a twelve-year cumulative obligation for the years 1987-1999. No objections were
received and COAH granted substantive certification on August 4, 1999.

The prior round plan components are summarized in the accompanying table. As shown, each
of these plan components has been fully implemented.

                          Table 1: Certified Prior Round Plan Components
                                         Hanover, New Jersey
             Plan Component                    # of Affordable Units                                   Status
RCA
      City of Orange Twp                       9                                               Complete
Inclusionary
      Hanover Hills                            39                                              Complete
      Sunrise at Hanover                       32                                              Complete
      Eden Mill Village                        66                                              Complete
      Oak Ridge at Hanover                     50                                              Complete
      Sterling Parc* (rentals)                 64 (56 age restricted, 8 family)                Complete
      Jewish Metrowest I (rentals)             36 (age restricted)                             Complete
Special Needs/Supportive Housing
      21 Longview Dr. ARC Group Home           4 bedrooms                                      Complete
      Horse Hill Rd. I Group Home              6 bedrooms                                      Complete
      Horse Hill Rd. II Group Home             6 bedrooms                                      Complete
      Mountain Ave. Group Home                 5 bedrooms                                      Complete
Rental Bonus Credits
      Sterling Parc                            26 (18 age restricted, 8 family)                Complete
      Jewish Metrowest I                       3                                               Complete
      Group Homes                              15                                              Complete
Total                                          361                                             Complete
                                        * Formerly Cedar Glen

In December 2004, COAH adopted new substantive (N.J.A.C. 5:94) and procedural (N.J.A.C. 5:95)
rules to address the Third Round period. Subsequently, in May 2008, COAH proposed revised
procedural (N.J.A.C. 5:96) and substantive (N.J.A.C. 5:97) rules for the Third Round period.
However, as detailed above, the 2004 regulations were challenged and, in 2007, various aspects
of those regulations were invalidated by the Appellate Division.

The Township adopted a Housing Element & Fair Share Plan on September 28, 2010 to address
this second iteration of Third Round Rules, and subsequently petitioned COAH for Substantive
Certification on October 27, 2010. The Petition was deemed complete by COAH on December 7,
2010 and no objections were filed. However, as detailed above, the Third Round methodology
                                                                25 Westwood Avenue, Westwood NJ 07675           3
                                                        p: 201.666.1811 | f: 201.666.2599 | e: jhb@burgis.com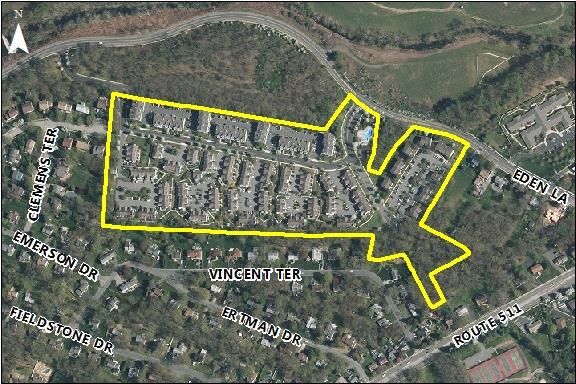
based upon growth share was subsequently invalidated, necessitating a new plan based upon the
prior rounds’ fair share methodology.

In response to In re Adoption of N.J.A.C. 5:96 & 5:97 ex rel. New Jersey Council on Affordable
Housing., 221 N.J. 1 (2015) (“Mount Laurel IV”), the Township of Hanover filed a Declaratory
Judgment action on July 2, 2015, along with a simultaneous motion for temporary immunity,
which was granted by the Court on August 14, 2015. Subsequently, on March 15, 2016, the
Township adopted a new Third Round HE&FSP based upon the prior rounds’ fair share
methodology. That 2016 HE&FSP was then replaced with a 2019 HE&FSP, adopted on October
22, 2019, pursuant to a settlement agreement entered into by the Township and FSHC in March
of 2019, and then subsequently with a 2020 HE&FSP, adopted on September 15, 2020, pursuant
to an amended settlement agreement entered into by the Township and FSHC on June 2, 2020.
This November 2020 HE&FSP updates and revises that 2020 HE&FSP.

The Third Round Affordable Housing Obligation and the Township’s Response

The state of the Third Round affordable housing obligations for municipalities throughout New
Jersey at present remains a fluid one, given the fact that neither the Courts, COAH, nor the
legislature has come up with a definitive set of housing-need numbers that has been universally
accepted. Two sets of numbers have been promulgated. These include numbers prepared by
Econsult Solutions on behalf of a consortium of municipalities known as the Municipal Joint
Defense Group, of which Hanover is a part, and numbers prepared by Dr. David Kinsey on behalf
of FSHC. The statewide affordable housing-need numbers vary dramatically.

On March 8, 2018, an opinion was entered by the Honorable Mary C. Jacobson, A.J.S.C., in the
consolidated declaratory judgment proceedings: In the Matter of the Municipality of Princeton,
Docket No. MER-L-1550-15 and In the Matter of West Windsor Township, Docket No. MER-L-
1561-15, Superior Court of New Jersey, Law Division, Mercer County (collectively, the “Mercer
Proceeding”). The opinion rendered in the Mercer Proceeding is titled: “Opinion on Fair Share
Methodology to Implement the Mount Laurel Affordable Housing Doctrine for the Third Round”
(the “Jacobson Opinion”). The Jacobson Opinion considered, analyzed and, ultimately,
determined the appropriateness of the competing methodologies advocated by Econsult
Solutions and Dr. Kinsey to determine New Jersey state-wide, regional and municipal present
need rehabilitation and present need Gap + Prospective Need (1999-2015) affordable housing
obligations. On March 28, 2018, state-wide and municipal obligations using the methodology
found to be most appropriate by Judge Jacobson in the Jacobson Opinion (the “Jacobson
Methodology”) were released.

The following table compares the latest Econsult report’s fair share obligation numbers for
Hanover (dated November 2017) against those assigned to Hanover in FSHC’s May 2016 report
and the affordable housing obligations for Hanover as calculated in the March 2018 report using

                                                            25 Westwood Avenue, Westwood NJ 07675           4
                                                    p: 201.666.1811 | f: 201.666.2599 | e: jhb@burgis.com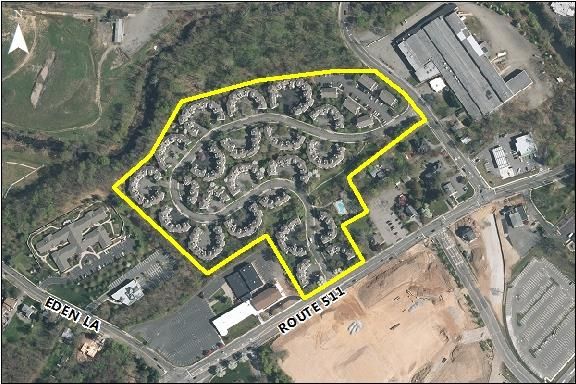
the Jacobson Methodology:

                                                                         Econsult            FSHC            Jacobson
    1.     Rehabilitation Obligation:                                    49                  26              29
    2.     Prior Round Obligation (1987-1999):                           356                 356             356
    3.     Gap + Prospective Need Obligation (1999-2025):                393                 1,1391          897

Since the Township lacks vacant land, it decided to attempt to globally settle with FSHC, rather
than engage in a trial with FSHC to determine fair share numbers. Under the supervision of the
Court Master, the Township and FSHC entered into a Settlement Agreement in March of 2019,
which was subsequently amended on June 2, 2020.

Under the terms of the Settlement Agreement, as amended, FSHC and the Township agreed that
Hanover would accept, for settlement purposes only, the following affordable housing
obligations:

                 1. Rehabilitation Obligation: 26
                 2. Prior Round (1987-1999) Obligation: 356
                 3. Gap (1999-2015) + Prospective Need (2015-2025) Obligation: 975

The Settlement Agreement, as amended, also affirms, irrespective of the above, that the
Township’s Third Round realistic development potential (RDP) is 550, which was based upon a
vacant land adjustment (VLA) analysis, and that its remaining Unmet Need is 425. In addition, the
Settlement Agreement, as amended, details the manner in which the Township will address its
affordable housing obligations, which can be summarized as follows.

The Township will address its affordable housing need through the identification of existing
affordable housing units and credits, proposed inclusionary housing units, alternative living
arrangements, assisted living units, the extension of expiring affordability controls on existing
units, the creation of an Accessory Apartment Program, and the creation of a Township-wide
mandatory set-aside ordinance. To address its Prior Round obligation, the Township seeks 9
credits from a completed Regional Contribution Agreement (RCA), 282 credits from existing
affordable housing units, and 65 rental bonus credits. To address its Third Round RDP, the
Township seeks 146 credits from existing affordable units, 262 credits for proposed inclusionary
developments, 4 credits for proposed alternative living arrangement bedrooms, and 138 rental
bonus credits. To address its Unmet Need, the Township seeks 91 credits for proposed

1
 Although Kinsey calculated Hanover’s total Gap + Prospective Need (1999-2025) to be 1,549 units, based on an
April 2017 Gap Period (1999-2015) calculation of 710 units and a May 2016 Prospective Need (2015-2025)
calculation of 839 units, the application of the 20% cap rule ultimately reduced Kinsey’s figure to a total Gap +
Prospective Need (1999-2025) for Hanover of 1,139 units. (Twenty percent (20%) of the 5,654 occupied housing
units in Hanover in 2015 equals 1,139.)
                                                                      25 Westwood Avenue, Westwood NJ 07675             5
                                                              p: 201.666.1811 | f: 201.666.2599 | e: jhb@burgis.com
inclusionary development, 32 credits for proposed alternative living arrangement bedrooms, 4
credits for approved assisted living Medicaid waiver units, and 137 credits for extensions of
affordability controls. The Township also provides a realistic opportunity for the development of
affordable housing through the creation of an Accessory Apartment Program and the adoption
of a Township-wide mandatory set-aside ordinance. This is discussed in more detail herein.
In addition, the Settlement Agreement, as amended, affirms, irrespective of the above, that the
Township may conduct a Structural Conditions Survey in accordance with COAH’s Round 2 rules
at NJAC 5:93-5.2(a) to reduce or eliminate its Rehabilitation obligation of 26 units. The Township
prepared a Structural Conditions Survey in June 2019, the results of which reduce Hanover’s
Rehabilitation obligation from 26 units to 6 units. The Township will address its 6-unit
rehabilitation obligation through continued participation in the Morris County Housing
Rehabilitation Program and the hiring of a rehabilitation consultant, with funding from the
Township’s affordable housing trust fund. This is also discussed in more detail herein.
The HE&FSP is organized into three sections. The first part of this plan, the Housing Element,
contains background data on the Township’s population and housing characteristics. The second
part, the Fair Share Obligation, describes the Township’s obligation for the provision of affordable
housing. The Township’s plan for meeting its affordable housing obligations is detailed in the
final part, the Fair Share Plan.
25 Westwood Avenue, Westwood NJ 07675 6
p: 201.666.1811 | f: 201.666.2599 | e: jhb@burgis.comSECTION I: HOUSING ELEMENT
25 Westwood Avenue, Westwood NJ 07675 7
p: 201.666.1811 | f: 201.666.2599 | e: jhb@burgis.comA. COMMUNITY OVERVIEW
The Township of Hanover is located in the easterly portion of Morris County. It is bounded to the
north by the Township of Parsippany-Troy Hills, to the east by the Township of East Hanover to
the south by the Borough of Florham Park, to the southwest by the Township of Morris, and to
the northwest by the Borough of Morris Plains, all of which are also located in Morris County.
The Township, comprised of Cedar Knolls and Whippany, occupies an area of 10.8 square miles. It
is located entirely within the Highlands Region, with the entirety of its land area located in the
Highlands Planning Area.
Major regional traffic is carried through the Township on Interstate Route 287, as well as States
Routes 10 and 24. Route 287 runs north-south and traverses the central portion of the
municipality. Routes 10 and 24 run east-west across the northern and southern portions of the
municipality, respectively.
The Whippany Line of the Morristown and Erie Railway, a small freight line, traverses the
Township. The line runs from Morristown and runs through East Hanover Township and Hanover
Township to Roseland.
The community is characterized by a mixture of suburban residential neighborhoods, parkland
and commercial & industrial businesses. The Morristown Airport is located in Hanover Township.
It is the second largest corporate airport in New Jersey. Some of the businesses located in the
Township include Bayer HealthCare and MetLife. The Red Bulls Training Facility is also situated in
the Township. Hanover also has five major hotels within its boundaries, including the Hanover
Marriott Hotel, the Courtyard Hanover and Hyatt House. The Township’s existing land uses, as
determined by Township tax records, are illustrated on the accompanying Existing Land Use Map.
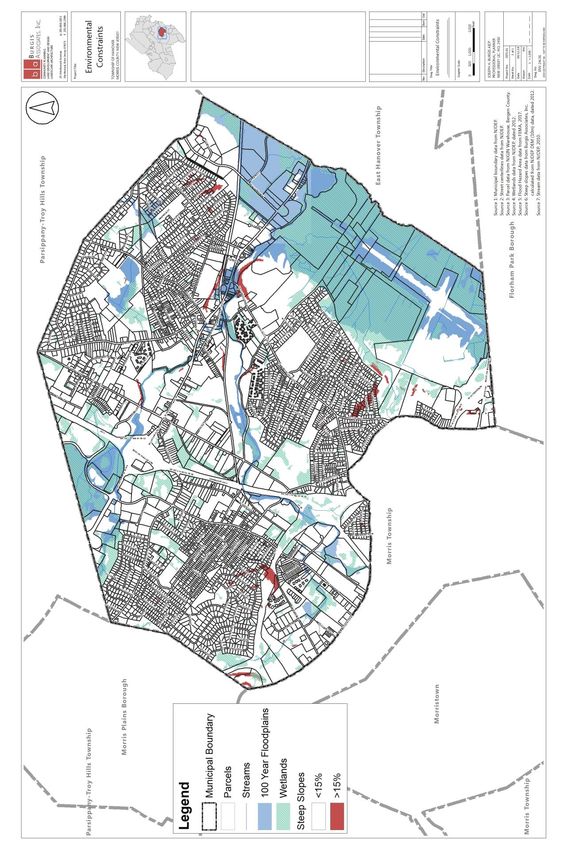
Environmentally constrained areas within the Township are identified on the accompanying
Environmental Constraints Map. As shown, Hanover has extensive areas of wetlands, floodplains,
streams, and steep slopes (defined as slopes greater than 15 percent).
25 Westwood Avenue, Westwood NJ 07675 8
p: 201.666.1811 | f: 201.666.2599 | e: jhb@burgis.com25 Westwood Avenue, Westwood NJ 07675 9 p: 201.666.1811 | f: 201.666.2599 | e: jhb@burgis.com
25 Westwood Avenue, Westwood NJ 07675           10
p: 201.666.1811 | f: 201.666.2599 | e: jhb@burgis.com
B. INVENTORY OF MUNICIPAL HOUSING STOCK

This section of the Housing Element provides an inventory of the Township’s housing stock, as
required by the Municipal Land Use Law. The inventory details housing characteristics such as
age, condition, purchase/rental value, and occupancy. It also details the number of affordable
units available to low- and moderate-income households and the number of substandard
housing units capable of being rehabilitated.

   1. Number of Dwelling Units. As shown in the accompanying table, the Township’s housing
      stock grew substantially between 1990 and 2000. Whereas there were 3,882 dwellings in
      1990, there were 4,818 dwellings in 2000, representing a 24 percent increase. However,
      the rate of growth has slowed relatively in subsequent decades. Hanover’s housing stock
      grew by 8% between 2000 and 2010, and by 10% between 2010 and 2017. In 2017, the
      total number of dwellings was estimated at 5,723.

                                 Table 2: Dwelling Units (1990 to 2017)
                                         Hanover, New Jersey
                    Year             Dwelling Units         Change (#)              Change (%)
                    1990                3,882                   --                       --
                    2000                4,818                  936                     24%
                    2010                5,222                  404                      8%
                    2017                5,723                  501                     10%
                        * 2017 data is the average between January 2013 and December 2017.
             Sources: U.S. Census – 1990 & 2000; 2017 American Community Survey 5-Year Estimates.

       The following table provides additional detail regarding the tenure and occupancy of the
       Township’s housing stock. As shown below, 78 percent of the Township’s housing stock was
       estimated to be owner-occupied in 2017, down from 91 percent in 2000. Over this same
       period, the percentage of rental units doubled, from 8 percent of all units in 2000 to 16
       percent of all units in 2017, and the percentage of vacant units quadrupled, from 1 percent of
       all units in 2000 to 5 percent of all units in 2017.

            Table 3: Housing Units by Tenure and Occupancy Status (2000 and 2017)
                                      Hanover, New Jersey
             Characteristics              2000                       2017
                                  Number        Percent     Number        Percent
          Owner-occupied           4,364           91         4,520          78
          Renter-occupied            381           8           891           16
          Vacant units               73             1          312           5
          Total                     4,818         100         5,723         100
                     * 2017 data is the average between January 2013 and December 2017.
                Sources: U.S. Census – 2000; 2017 American Community Survey 5-Year Estimates.

                                                                     25 Westwood Avenue, Westwood NJ 07675           11
                                                             p: 201.666.1811 | f: 201.666.2599 | e: jhb@burgis.com
2. Housing Characteristics. The following tables provide additional information on the
characteristics of the Township’s housing stock, including data on the number of units in
the structure and the number of bedrooms. As shown below, the housing stock is
predominantly characterized by single-family detached units, which represent 72 percent
of all dwelling units. Single-family attached units (townhouses) represent the second most
predominant housing type, at 10 percent. The majority of dwellings in Hanover tend to
have three bedrooms or more.
Table 4: Units in Structure (2000 and 2017)
Hanover, New Jersey
2000 2017
Units in Structure
Number Percent Number Percent
Single Family, detached 3,844 80 3,880 72
Single Family, attached 443 9 542 10
2 83 2 147 3
3 or 4 63 1 103 2
5 to 9 170 4 271 5
10-19 166 3
468 9
20 or more 49 1
Other 0 0 0 0
Total 4,818 100 5,411 100
* 2017 data is the average between January 2013 and December 2017.
Sources: U.S. Census – 2000; 2017 American Community Survey 5-Year Estimates.
Table 5: Number of Bedrooms in Housing Units (2000 and 2017)
Hanover, New Jersey
2000 2017
Bedrooms
Number Percent Number Percent
None 24 1 63 1
One 169 3 370 7
Two 992 21
2,905 53
Three 1,770 36
Four 1,540 32
2,073 38
Five or More 323 7
Total 4,818 100 5,435 100
* 2017 data is the average between January 2013 and December 2017.
Sources: U.S. Census – 2000; 2017 American Community Survey 5-Year Estimates.
3. Housing Age. The following table details the age of the Township’s housing stock. As
shown, the majority (60 percent) of the Township’s housing units were constructed prior
to 1980. Approximately 13 percent of Hanover’s housing stock was built in 2000 or later.
25 Westwood Avenue, Westwood NJ 07675 12
p: 201.666.1811 | f: 201.666.2599 | e: jhb@burgis.comTable 6: Year Structure Built (2017)
Hanover, New Jersey
Year Units Built Number Percent
2010 or Later 177 3
2000 to 2009 558 10
1980 to 1999 1,470 27
1960 to 1979 1,388 26
1940 to 1959 1,470 27
1939 or earlier 387 7
Total 5,435 100
Sources: 2017 American Community Survey 5-Year Estimates.
4. Housing Conditions. An inventory of the Township’s housing conditions is presented in
the following tables. Table 7 identifies the extent of overcrowding in the Township,
defined as housing units with more than one occupant per room. The data indicates that
the number of occupied housing units considered overcrowded has increased slightly
since 2000, from 52 units (1.1 percent of all occupied units) in 2000 to 83 units (1.5 percent
of all occupied units) in 2017.
Table 7: Occupants per Room (2000 and 2017)
Hanover, New Jersey
2000 2017
Occupants Per Room
Number Percent Number Percent
0.50 to 1.00 4,693 99 5,328 98.5
1.01 to 1.50 35 1 12 0.2
1.51 or more 17Table 8: Occupied Housing Units - Equipment and Plumbing Facilities (2000 and 2017)
Hanover, New Jersey
2000 2017
Facilities
Number Percent Number Percent
Kitchen:
With Complete Facilities 4,745 100.0 5,393 99.7
Lacking Complete Facilities 0 0.0 18 0.3
Plumbing:
With Complete Facilities 4,745 100.0 5,411 100.0
Lacking Complete Facilities 0 0.0 0 0.0
Heating Equipment (Occupied Units):
Standard Heating Facilities 4,739 99.8 5,411 100.0
Other Means, No Fuel Used 6 0.2 0 0.0
* 2017 data is the average between January 2013 and December 2017.
Sources: U.S. Census – 2000; 2017 American Community Survey 5-Year Estimates.
5. Purchase and Rental Values. Table 9 shows that whereas only 21 percent of Hanover’s
rental housing stock had monthly rents of $1,500 or more in 2000, 70 percent of
Hanover’s rental units had monthly rents of $1,500 or more by 2017. The Township’s
median monthly rent in 2017 was $1,980, representing an 80 percent increase over the
Township’s median monthly rent in 2000. The Township’s median monthly rent in 2017
was 39 percent higher than the median monthly rent of Morris County as a whole, which
was $1,420 in 2017.
Table 9: Gross Rent of Specified Renter-Occupied Housing Units (2000 and 2017)
Hanover, New Jersey
2000 2017
Rent
Number Percent Number Percent
Less than $200 5 1
8 0.9
$200 to $499 29 8
$500 to $749 79 21
65 7.7
$750 to $999 51 13
$1,000 to $1,499 88 23 181 21.3
$1,500 or more 78 21 594 70
No cash rent 48 13 43 5
Total 378 100 848 100
Median Gross Rent $1,098 $1,980
* 2017 data is the average between January 2013 and December 2017.
Sources: U.S. Census – 2000; 2017 American Community Survey 5-Year Estimates.
Table 10 below shows that whereas only 3 percent of Hanover’s owner-occupied units had
a value of $500,000 or more in 2000, approximately 46 percent of Hanover’s owner-
occupied units had a value of $500,000 or more in 2017. The Township’s median housing
25 Westwood Avenue, Westwood NJ 07675 14
p: 201.666.1811 | f: 201.666.2599 | e: jhb@burgis.comvalue of $485,600 in 2017 was approximately 83 percent higher than the Township’s median
value in 2000, and approximately 13 percent higher than the County’s 2017 median value of
$428,900.
Table 10: Value of Specified Owner-Occupied Housing Units (2000 and 2017)
Hanover, New Jersey
2000 2017
Value Range
Number Percent Number Percent
Less than $100,000 67 2 164 4
$100,000 to $149,999 53 1 45 1
$150,000 to $199,999 481 12 64 1
$200,000 to $299,999 1,570 40 164 4
$300,000 to $499,999 1,597 41 1,995 44
$500,000 or more 125 3 2,088 46
Total 3,893 100 4,520 100
Median Value $265,776 $485,600
* 2017 data is the average between January 2013 and December 2017.
Sources: U.S. Census – 2000; 2017 American Community Survey 5-Year Estimates.
6. Number of Units Affordable to Low- and Moderate-Income Households. Based on the
Affordable Housing Professionals of New Jersey 2020 regional income limits (attached
hereto as Appendix A-3, the median household income for a three-person household in
COAH Region 2, Hanover’s housing region comprised of Morris, Essex, Union and Warren
Counties, is $94,959. A three-person moderate-income household, established at no
more than 80 percent of the median income, would have an income not exceeding
$75,967. A three-person low-income household, established at no more than 50 percent
of the median income, would have an income not exceeding $47,479.
An affordable sales price for a three person moderate-income household earning 80
percent of the median income is estimated at approximately $350,000. An affordable
sales price for a three person low-income household earning 50 percent of the median
income is estimated at approximately $210,000. These estimates are based on the UHAC
affordability controls outlined in N.J.A.C. 5:80-26.1 et seq. Approximately 10 percent of
Hanover’s housing units are valued at less than $300,000, and approximately six percent
are valued at less than $200,000, according to the 2017 American Community Survey.
For renter-occupied housing, an affordable monthly rent for a three person moderate-
income household is estimated at approximately $1,900. An affordable monthly rent for a
three person low-income household is estimated at approximately $1,200. According to
the 2017 American Community Survey, approximately 51 percent of Hanover’s rental units
had a gross rent less than $2,000, and approximately nine percent of the rental units had
a gross rent less than $1,000.
25 Westwood Avenue, Westwood NJ 07675 15
p: 201.666.1811 | f: 201.666.2599 | e: jhb@burgis.com7. Completed Affordable Units. As detailed in Table 11 below, the Township has an array of
developments incorporating a range of housing options for very low, low, and moderate
income residents. The Township has constructed a total of 1,570 housing units in all of the
affordable developments. These developments have yielded 428 affordable units. This
number is substantial in light of the total number of housing units in the Township. The
most recent information available indicates there are a total 5,723 dwelling units in the
community as of 2017. Therefore, approximately 27 percent (1,570/5,723) of all dwelling
units in the community were constructed as a result of affordable housing initiatives.
Most significantly, the existing affordable housing units in the community account for 7.5
percent (428/5,723) of all housing in the Township.
Table 11: Completed Affordable Units
Hanover, New Jersey
Project Very Low Low Mod Total
Inclusionary - Sale
Sunrise 18 14 32
Eden Mill Village 33 33 66
Hanover Hills 19 20 39
Oak Ridge 25 25 50
Subtotal 0 95 92 187
Inclusionary - Rental
MetroWest – Age Restricted 18 18 36
Sterling Parc – Age Restricted 47 9 56
Sterling Parc - Family 8 8
Woodmont Knolls 2 6 6 14
Subtotal 2 79 33 114
100% Affordable - Rental
Saddlebrook Court 11 28 34 73
Subtotal 11 28 34 73
Special Needs/Supportive - Rental
Saddlebrook Court 5 5
Rose House 12 12
Allegro School 6 6
Whippany Jewish Assoc. 4 4
Mountain Ave. ARC 5 5
21 Longview Dr. ARC 4 4
Eden Lane ARC 6 6
Horse Hill Rd. I ARC 6 6
Horse Hill Rd. II ARC 6 6
Subtotal 42 12 0 54
Total 55 214 159 428
25 Westwood Avenue, Westwood NJ 07675 16
p: 201.666.1811 | f: 201.666.2599 | e: jhb@burgis.com8. Substandard Housing Capable of Being Rehabilitated. As discussed in more detail in the
Fair Share Obligation section of this report, the Township of Hanover has undertaken a
Structural Conditions Survey, pursuant to COAH’s Round 2 rules, to provide an estimate
of the number of units in Hanover that are in need of rehabilitation and are not likely to
experience “spontaneous rehabilitation.” Per the results of the Structural Conditions
Survey, Hanover’s rehabilitation share is determined to be 6 units. The Township’s
rehabilitation share is further explored in the Fair Share Obligation section of this
document.
C. PROJECTION OF MUNICIPAL HOUSING STOCK
The COAH regulations require a projection of the community’s housing stock, including the
probable future construction of low- and moderate-income housing, for the ten years
subsequent to the adoption of the Housing Element. This projection shall be based upon an
assessment of data which minimally must include the number of residential construction permits
issued, approvals of applications for residential development, and probable residential
development of lands. Each of these items are identified and outlined below.
1. Housing Units Constructed During the Last Ten Years. The table below provides data
concerning residential building permits issued for new construction during the past ten
years. During this period, a total of 417 residential building permits were issued for new
construction, including 121 for one- and two-family residences and 296 for housing units
within multifamily developments. More than 72 percent of these building permits were
issued in just two years, 2012 and 2013. Since 2014, the Township has issued, on average,
approximately 10 residential permits per year for new construction.
Table 12: Number of Residential Building Permits Issued For New Construction (2009 to 2018)
Hanover, New Jersey
One & Two Multi-
Year Issued Mixed-Use Total
Family Family
2009 12 0 0 12
2010 10 38 0 48
2011 5 0 0 5
2012 33 107 0 140
2013 10 151 0 161
2014 7 0 0 7
2015 20 0 0 20
2016 2 0 0 2
2017 17 0 0 17
2018 5 0 0 5
Total 121 296 0 417
Source: New Jersey Construction Reporter.
25 Westwood Avenue, Westwood NJ 07675 17
p: 201.666.1811 | f: 201.666.2599 | e: jhb@burgis.com2. Probable Residential Development of Lands. Considering the rate of residential growth
experienced in Hanover over the past five years, the continuing economic stagnation
following the Great Recession, and the fact that there are a limited amount of
developable parcels remaining in the Township, it is anticipated that Hanover will
continue to see only modest growth in one- and two-family residential development over
the next five years. The Township does, however, anticipate more multifamily residential
development than Hanover has experienced over the past five years due to recent
approvals for inclusionary residential development that have not yet been constructed, as
well as modified zoning which will allow for additional inclusionary residential
development, as discussed in more detail in the Fair Share Plan section of this document.
D. POPULATION ANALYSIS
The COAH regulations require that a Housing Element provide an analysis of the community's
demographic characteristics, including an assessment of population size, rate of population
growth, age characteristics, income levels, and household size. Each of these items is described
in this section of the report.
1. Population Size. As seen in the table below, the Township has experienced growth in
nearly every decade since 1920 (except in the 1980s), with the most growth occurring in
the 1950s. The 2017 population estimate of 14,436 people, provided by the American
Community Survey, suggests that Hanover has grown at a rate of approximately 12
percent since 2000.
Table 13: Population Growth (1920 to 2017)
Hanover, New Jersey
Year Population Change ( # ) Change (%)
1920 1,595 -- --
1930 2,516 921 58
1940 2,812 296 11
1950 3,756 944 34
1960 9,329 5,573 148
1970 10,700 1,371 15
1980 11,846 1,146 11
1990 11,538 -308 -3
2000 12,898 1,360 12
2010 13,712 814 6
2017 14,436 724 5
* 2017 data is the average between January 2013 and December 2017.
Sources: Morris County Data Book – 2009; 2017 American Community Survey 5-Year Estimates.
25 Westwood Avenue, Westwood NJ 07675 18
p: 201.666.1811 | f: 201.666.2599 | e: jhb@burgis.com2. Age Characteristics. The Township’s age characteristics, which are outlined in the table
below, indicate an aging community. The largest population decline between 2000 and
2017 occurred in the population 25 to 44 years of age, which decreased by approximately
20 percent during this period. Meanwhile, the Township experienced a marked increase in
the population age 85 and over, which increased more than 200 percent between 2000
and 2017. Overall, the median age of Township residents increased from 40.1 in 2000 to
44.0 in 2017.
Table 14: Age Characteristics (2000 and 2017)
Hanover, New Jersey
2000 2017 2000-2017
Age Group Total % Total Total % Total % Change
Under 5 828 6 801 5 -3
5-9 781 6 812 6 4
10-14 859 7 876 8 2
15-19 681 5 939 7 38
20-24 518 4 927 5 79
25-34 1,644 13 1,316 10 -20
35-44 2,233 17 1,802 17 -19
45-54 1,919 15 2,372 8 24
55-59 871 7 1,115 8 28
60-64 643 5 926 7 44
65-74 1,020 8 1,333 9 31
75-84 728 6 684 6 -6
85 and over 173 1 533 4 208
Total 12,898 100 14,436 100 12
Median Age 40.1 44.0 --
* 2017 data is the average between January 2013 and December 2017.
Sources: U.S. Census – 2000; 2017 American Community Survey 5-Year Estimates.
3. Average Household Size. The average household size for the Township declined steadily
in the years between 1970 and 2010. However, the average household size for 2017
showed a slight increase from 2010, at 2.66 people per household.
25 Westwood Avenue, Westwood NJ 07675 19
p: 201.666.1811 | f: 201.666.2599 | e: jhb@burgis.comTable 15: Average Household Size (1970 to 2017)
Hanover, New Jersey
Year Average Household Size
1970 3.65
1980 3.33
1990 3.03
2000 2.71
2010 2.60
2017 2.66
* 2017 data is the average between January 2013 and December 2017.
Sources: Morris County Data Book - 2009; 2017 American Community Survey 5-Year Estimates.
4. Household Income. Detailed household income figures are shown in the table below. As
shown, between 1999 and 2017, the proportion of households earning annual incomes of
$150,000 increased by more than 137 percent. During this period, the Township’s median
household income increased by approximately 38 percent, from $84,115 in 1999 to
$116,020 in 2017. The Township’s 2017 median household income was eight percent
higher than that of Morris County as a whole, which was $107,034 in 2017.
Table 16: Household Income Distribution (1999 and 2017)
Hanover, New Jersey
1999 2017
Income Category
Number Percent Number Percent
Less than $10,000 32 1 119 2.20
$10,000 to $14,999 85 2 55 1.02
$15,000 to $24,999 324 6 267 4.93
$25,000 to $34,999 300 6 102 1.89
$35,000 to $49,999 508 11 352 6.51
$50,000 to $74,999 878 18 845 15.62
$75,000 to $99,999 790 17 562 10.39
$100,000 to $149,999 1,061 22 1,181 21.83
$150,000 or more 790 17 1,875 34.65
Total 4,768 100 5,238 100
Median $84,115 $116,020
* 2017 data is the average between January 2013 and December 2017.
Sources: U.S. Census – 2000; 2017 American Community Survey 5-Year Estimates.
E. EMPLOYMENT ANALYSIS
The COAH regulations require that the Housing Element include an analysis of the existing and
probable future employment characteristics of the community. The following tables present
information on historic trends, employment characteristics, occupational patterns, and related
data.
25 Westwood Avenue, Westwood NJ 07675 20
p: 201.666.1811 | f: 201.666.2599 | e: jhb@burgis.com1. Employment Status. Table 17 provides information on the employment status of Township
residents age 16 and over. As shown, the unemployment rate for Hanover’s civilian labor
force more than doubled between 2000 and 2017, from 1.5 percent in 2000 to 3.8 percent
in 2017. This is, however, lower than Morris County’s 2017 unemployment rate of 5.2
percent. It is also important to note that the percentage of Hanover’s population not in
the labor force remained consistent during this period at 33 percent.
Table 17: Employment Status - Population 16 & Over (2000 and 2017)
Hanover, New Jersey
Employment Status 2000 2017
Number Percent Number Percent
In labor force 6,941 67 7,834 67
Civilian labor force 6,941 67 7,834 67
Employed 6,834 66 7,540 64
Unemployed 107 1 294 2.5
% of civilian labor force -- 1.5 -- 3.8
Armed Forces 0 0 0 0
Not in labor force 3,366 33 3,937 33
Total Population 16 and Over 10,307 100 11,771 100
* 2017 data is the average between January 2013 and December 2017.
Sources: U.S. Census – 2000; 2017 American Community Survey 5-Year Estimates.
2. Employment Characteristics of Employed Residents. The following two tables detail
information on the employment characteristics of Hanover residents. Table 18 details
employment by occupation and Table 19 details employment by industry. More than half
of the Township residents are employed in the management, professional and related
occupations sector. Additionally, the amount of residents employed in education, health
and social services has increased to more than one-fifth of the total population. The
number of residents working in manufacturing and information has declined since 2000.
Table 18: Employed Residents Age 16 and Over, By Occupation (2000 and 2017)
Hanover, New Jersey
2000 2017
Occupation
Number Percent Number Percent
Management, professional, and related occupations 3,150 46 3,879 51
Service occupations 638 9 918 12
Sales and office occupations 2,050 30 1,891 25
Farming, fishing, and forestry occupations 0 0 0 0
Construction, extraction, and maintenance occupations 510 8 454 6
Production, transportation, and material moving occupations 486 7 398 6
Total 6,834 100 7,540 100
* 2017 data is the average between January 2013 and December 2017.
Sources: U.S. Census – 2000; 2017 American Community Survey 5-Year Estimates.
25 Westwood Avenue, Westwood NJ 07675 21
p: 201.666.1811 | f: 201.666.2599 | e: jhb@burgis.comTable 19: Employed Residents Age 16 and Over, By Industry (2000 and 2017)
Hanover, New Jersey
Industry 2000 2017
Number Percent Number Percent
Agriculture, Forestry, Fisheries & Mining 7 1 0 0
Construction 424 6 451 6
Manufacturing 881 13 780 10
Transportation and Warehousing, and Utilities 309 5 293 4
Wholesale Trade 263 4 210 3
Retail Trade 755 11 851 11
Information 437 6 248 3
Finance, Insurance & Real Estate 750 11 1,006 14
Education, Health and Social Services 1,252 18 1,483 20
Arts, Entertainment & Recreational Services 289 4 504 7
Professional & Related Services 977 14 1,255 17
Public Administration 169 2 291 4
Other Services 321 5 168 2
Total 6,834 100 7,540 100
* 2017 data is the average between January 2013 and December 2017.
Sources: U.S. Census – 2000; 2017 American Community Survey 5-Year Estimates.
3. Employment Projections. A projection of the Township’s probable future employment
characteristics is based on an assessment of historic employment trends, the number of
non-residential construction permits issued, and probable non-residential development of
lands. Each of these items are identified and outlined below.
a. Historic Employment Trends. The table below provides data on Hanover’s average
annual employment over the past ten years. As shown, jobs lost due to the financial
crisis in 2008 have not been fully recovered. Although the Township made some gains
between 2012 and 2014, it steadily lost jobs again in 2015 and 2016. Assuming the
current economic climate continues, and recognizing the limited availability of vacant
land for new non-residential development, it appears unlikely that employment levels
in Hanover will return to the pre-financial crisis peak in the near future.
25 Westwood Avenue, Westwood NJ 07675 22
p: 201.666.1811 | f: 201.666.2599 | e: jhb@burgis.comTable 20: Covered Employment Trends (2007 to 2017)
Hanover, New Jersey
Change in
Year Number of Jobs Percent Change
Number of Jobs
2007 17,127 -- --
2008 16,289 -838 -5%
2009 14,242 -2,047 -13%
2010 13,046 -1,196 -8%
2011 11,733 -1,313 -10%
2012 12,603 870 7%
2013 13,120 517 4%
2014 15,982 2,862 22%
2015 14,171 -1,811 -11%
2016 13,702 -469 -3%
2017 14,597 895 7%
Sources: New Jersey Department of Labor and Workforce Development
b. Non-Residential Square Footage Constructed During the Last Ten Years. The table
below provides data concerning the amount of non-residential square footage
authorized by building permits between 2009 and 2018. During this period, building
permits were issued for nearly 1.7 million square feet of non-residential space. One-
half of this space was for storage, and 30 percent of this was office space.
Approximately 13 percent was retail space. Since 2012, the Township has issued
permits for an average of 232,000 square feet of non-residential space per year.
Table 21: Non-Residential Space Authorized by Building Permits (sq. ft.) (2009 to 2018)
Hanover, New Jersey
Institu- Indus-
Year Issued Office Retail A-2 A-3 A-4 Storage Total
tional trial
2009 7,075 0 0 40,130 0 0 0 98 47,303
2010 0 13,982 0 4,033 0 0 0 2,439 20,454
2011 2,981 0 0 0 0 6,072 0 0 9,053
2012 271,258 4,230 0 0 7,100 0 0 3,120 285,708
2013 24 77,052 0 3,270 0 0 0 0 80,346
2014 32,648 0 0 0 0 0 620 38,934 72,202
2015 50,705 0 19,032 0 0 0 0 148,715 218,452
2016 110,696 0 0 0 0 0 0 0 110,696
2017 8,680 0 0 0 0 0 0 332,337 341,017
2018 24,111 117,573 0 39,532 0 0 0 332,337 513,553
Total 508,178 212,837 19,032 86,965 7,100 6,072 620 857,980 1,698,784
Source: New Jersey Construction Reporter.
25 Westwood Avenue, Westwood NJ 07675 23
p: 201.666.1811 | f: 201.666.2599 | e: jhb@burgis.comc. Probable Non-Residential Development of Lands. Over the past decade, Hanover
Township added approximately 1.7 million square feet of new non-residential space,
as demonstrated in Table 21 above. Nearly all of this space was for storage (50
percent), office (30 percent), and retail (13 percent). Recognizing the limited availability
of vacant land for new non-residential development, the Township anticipates a
somewhat slower pace of non-residential growth to occur over the next ten year
period.
d. Probable Future Employment Characteristics. As detailed in Table 20 above,
employment levels in Hanover have fluctuated over the past decade, but have not yet
fully recovered from the 2008 financial crisis. Despite this trend, it is anticipated that
future employment levels in the Township may increase over the next decade due to
recent development approvals for retail and office development, such as on Hanover
Avenue (Lowes and Crossings), Whippany Village, and Barclays, as well as additional
projected mixed-use projects, such as River Park and Pine Plaza. If realized, these
projects could very well result in employment growth for Hanover.
25 Westwood Avenue, Westwood NJ 07675 24
p: 201.666.1811 | f: 201.666.2599 | e: jhb@burgis.comSECTION II: FAIR SHARE OBLIGATION
25 Westwood Avenue, Westwood NJ 07675 25
p: 201.666.1811 | f: 201.666.2599 | e: jhb@burgis.comA. SUMMARY OF FAIR SHARE OBLIGATION
The state of the Third Round affordable housing obligations for municipalities throughout New
Jersey continues to be in flux, given the fact that neither the Courts, COAH, nor the legislature
has come up with a definitive set of housing-need numbers that has been universally accepted.
Thus far, two sets of numbers have been promulgated and widely discussed. These include
numbers prepared by Econsult Solutions on behalf of a consortium of municipalities known as
the Municipal Joint Defense Group, of which Hanover is a part, and numbers prepared by Dr.
David Kinsey on behalf of the Fair Share Housing Center (FSHC). In addition, state-wide and
municipal obligations for the present need rehabilitation obligation, as well as the Gap +
Prospective Need obligation (1999-2015) have been calculated using the Jacobson Methodology.
These housing-need numbers for the Township of Hanover are as follows:
Econsult FSHC Jacobson
(Nov. 2017) (May 2016) (March 2018)
1. Rehabilitation Obligation: 49 26 29
2. Prior Round Obligation (1987-1999): 356 356 356
3. Gap + Prospective Need Obligation (1999-2025): 393 1,1392 897
Ultimately, an amended Settlement Agreement, which was entered into by the Township and
FSHC on June 2, 2020, sets forth the extent of Hanover’s Rehabilitation, Prior Round, and Gap +
Prospective Need Obligations. Under the terms and conditions of the Settlement Agreement, the
Township has the following obligations for the period from 1987 through July 2, 2025:
Obligation per Settlement
1. Rehabilitation Obligation: 26
2. Prior Round Obligation (1987-1999): 356
3. Gap + Prospective Need Obligation (1999-2025): 975
B. ADJUSTMENT TO REHABILITATION OBLIGATION
The rehabilitation component of the affordable housing obligation is based on a municipality’s
existing housing deficiencies. It is defined as the number of deficient housing units occupied by
low- and moderate-income households within a municipality. A deficient housing unit is a unit
with health and safety code violations that require the repair or replacement of a major system.
A major system includes any of the following: weatherization, roofing, plumbing, heating,
electricity, sanitary plumbing, lead paint abatement and/or load bearing structural systems.
2
Although Kinsey calculated Hanover’s total Gap + Prospective Need (1999-2025) to be 1,549 units, based on
an April 2017 Gap Period (1999-2015) calculation of 710 units and a May 2016 Prospective Need (2015-2025)
calculation of 839 units, the application of the 20% cap rule ultimately reduced Kinsey’s figure to a total Gap +
Prospective Need (1999-2025) for Hanover of 1,139 units. (Twenty percent (20%) of the 5,654 occupied housing
units in Hanover in 2015 equals 1,139.)
25 Westwood Avenue, Westwood NJ 07675 26
p: 201.666.1811 | f: 201.666.2599 | e: jhb@burgis.comWhereas the FSHC Settlement Agreement, as amended, establishes the Township’s Rehabilitation
obligation at 26 units, the agreement permits the Township to conduct a Structural Conditions
Survey in accordance with COAH’s Round 2 rules at NJAC 5:93-5.2(a) to reduce or eliminate the
Township’s Rehabilitation obligation. Hanover’s Structural Conditions Survey was prepared in
June 2019 by the Township’s Construction Code Official. The results of the survey reveal that
Hanover presently contains 9 dwelling units that are deficient and in need of repair. This figure
was then multiplied by 66.55%, which is Morris County’s estimated share of low- and moderate-
income households pursuant to Dr. Kinsey’s May 2016 present need calculations. This formula
resulted in 6 units that are estimated to be both deficient and occupied by low- or moderate-
income households, thereby reducing Hanover’s Rehabilitation obligation from 26 units to 6
units. A copy of the Structural Conditions Survey is attached hereto as Appendix A-1.
C. VACANT LAND ADJUSTMENT
Since Hanover Township lacks developable vacant land, it is entitled to adjust its Gap +
Prospective Need (1999-2025) obligation in accordance with the Vacant Land Adjustment (VLA)
procedures set forth in COAH’s Round 2 rules. As provided therein, a Realistic Development
Potential (“RDP”) Analysis is intended to determine which sites in a municipality are the most likely
sites to develop for low- and moderate-income housing. Accordingly, the FSHC Settlement
Agreement, as amended, establishes the Township’s Third Round RDP at 550 and its remaining
Unmet Need at 425. The calculation of the Township’s Third Round RDP is discussed in more
detail below.
The vacant land analysis presented herein first identified all privately-owned and publicly-owned
vacant sites in the Township, as determined by Township tax records, which encompass a total of
1,857 acres. Farm parcels located within State Planning Area 1 (Metropolitan) and driving ranges
were also identified, which encompass an additional 44 acres. In an effort to be as inclusive as
possible, we then added to the analysis six additional sites that the Township identifies as having
the potential to redevelop. These properties are as follows:
1. Block 3801, Lot 2: This parcel is located on Eden Lane and owned by River Park Business
Center, LLC. The site is not vacant but is included in the vacant land assessment as it is
proposed for inclusionary development as part of the Fair Share Plan (River Park).
2. Block 4204, Lot 1: This parcel is located at 26 Parsippany Road and owned by 26
Parsippany Road, LLC. The site is not vacant but is included in the vacant land assessment
as it is proposed for inclusionary development as part of the Fair Share Plan
(Silverman/Corporate Mailings).
3. Block 4901, Lots 2 and 17: These parcels, at Rear Park Avenue and 25 Airport Road, are
owned by 45 Airport Road, LLC, and 25-35 Airport Road, respectively. These parcels are
25 Westwood Avenue, Westwood NJ 07675 27
p: 201.666.1811 | f: 201.666.2599 | e: jhb@burgis.comnot vacant but are included in the vacant land assessment as they are proposed for
inclusionary development as part of the Fair Share Plan (Airport Road).
4. Block 4001, Lots 11, 12 and 14: These parcels, at 851 and 801-849 Route 10, are owned by
Hanover Towne Center, LLC3. These parcels are not vacant but are included in the vacant
land assessment as portions of this tract are proposed for inclusionary development as
part of the Fair Share Plan (JMF/Pine Plaza).
5. Block 7402, Lots 2.01 and 2.02, and Block 7501, Lot 10: These parcels are located at 476
and 410 Route 10. Lots 2.01 and 10 are owned by Whippany Village, LLC, and Lot 2.02 is
owned by Cole CV Hanover Township NJ, LLC. These parcels are not vacant but are
included in the vacant land assessment as they are proposed for inclusionary
development as part of the Fair Share Plan (Whippany Village).
6. Block 4603, Lot 2: This parcel is located at 270 Whippany Road and owned by Malankara
Archdiocese Syrian Church. This parcel is not vacant but has been identified as potentially
redevelopable and is therefore included in the vacant land assessment.
The analysis then evaluated each site for size (a minimum of five dwelling units were required to
be accommodated based on the applicable densities) and subtracted out environmentally
constrained land (wetlands, steep slopes, streams, and flood plains) pursuant to the applicable
regulations at N.J.A.C. 5:93-4.2. In addition, preserved open space was also eliminated from RDP
analysis. The remaining 187 acres of developable area were then evaluated to determine the
Township’s Third Round RDP.
Ultimately, the 187 acres of developable area which qualify for RDP Analysis resulted in a total
Third Round RDP for the Township of 550. RDP was calculated as follows:
1. Five sites (River Park, Silverman/Corporate Mailings, Airport Road, JMF/Pine Plaza, and
Whippany Village) have either been approved or are proposed for inclusionary
development as part of the Fair Share Plan. For each of these five sites, the Township
applied a variety of densities negotiated for settlement purposes and a 20 percent
affordable housing set-aside to calculate the RDP. Together, these sites amount to an
RDP of 480.
2. The remainder of the sites that qualify for RDP Analysis are not proposed for inclusionary
development in the Plan and were assigned varying densities based on their size,
location, and surrounding development patterns. A 20 percent set-aside was then
imposed on these calculations. This formula resulted in a total RDP of 70 for these
remaining sites.
3
At the time the Vacant Land Assessment was prepared, Lot 11 was owned by Marino Associates, LLC, and Lots
12 and 14 were owned by Pine Plaza Associates, LLC. This prior ownership is reflected in Appendix A-2.
25 Westwood Avenue, Westwood NJ 07675 28
p: 201.666.1811 | f: 201.666.2599 | e: jhb@burgis.comYou can also read