Six 56 Warrington Addendum to Environmental Statement Part 2 - Socio Economic Technical Paper 6
←
→
Page content transcription
If your browser does not render page correctly, please read the page content below

Langtree PP and Panattoni

Six 56 Warrington
Addendum to Environmental Statement

Part 2 – Socio Economic Technical Paper 6
Revision 3 5   21 February 2019 14 July 2020
Revision Record

                   Revision          Date of          Nature of Revision         Author       Checked By
                  Reference          Revision

              Revision 1              25.01.19     First Draft               Andy Wallis    Graham Russell

              Revision 2              04.02.19     Second Draft              Andy Wallis    Graham Russell

              Revision 3              21.02.19     Third Draft               Andy Wallis    Graham Russell

              Revision 4              30.03.20     Addendum Draft            Peter Alford   Graham Russell

              Revision 5              14.07.20     Addendum Draft v.2        Peter Alford   Graham Russell

               Report Author                         Andy Wallis Peter Alford

                Report Date                          21.02.19 14.07.20

                 Project No.

               Document Ref.                         ES Technical Paper 6

                   Revision                          Revision 3 Revision 5

ES Part 2 – Socio Economic Technical Paper 6 – Six 56 Warrington                                           2
Contents
Revision Record.............................................................................................................................................2
Contents ..........................................................................................................................................................3
1. Introduction ........................................................................................... 6
Overview .........................................................................................................................................................8
2. Documents Consulted ........................................................................ 10
Socio-Economic Policy Context ............................................................................................................. 10
Socio-Economic Data and Guidance ..................................................................................................... 15
3. Consultations ....................................................................................... 18
4. Methodology and Approach ............................................................... 21
Receptors ..................................................................................................................................................... 23
Environmental Impacts .............................................................................................................................. 24
Significance of Effects ................................................................................................................................. 27
Impact Prediction Confidence................................................................................................................. 27
5. Baseline Information........................................................................... 29
Economic activity and employment ....................................................................................................... 29
Local Labour Market ................................................................................................................................. 33
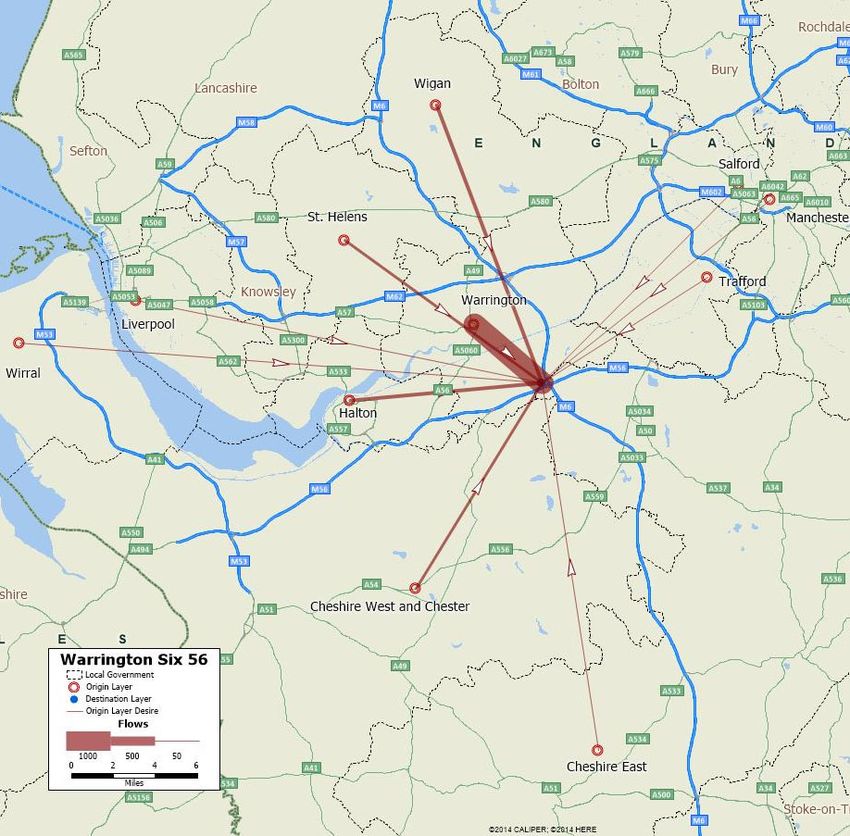
Commuting Patterns ................................................................................................................................. 35
Unemployment and Worklessness ........................................................................................................ 36
Capacity of Social Infrastructure ............................................................................................................ 38
Deprivation .................................................................................................................................................. 40
6. Alternatives Considered ..................................................................... 43
7. Potential Environmental Effects ........................................................ 44
Construction Phase ................................................................................................................................... 44
Operational Phase ...................................................................................................................................... 51
8. Proposed Mitigation ............................................................................ 65
Construction Phase ................................................................................................................................... 65
Operational Phase ...................................................................................................................................... 65
9. Potential Residual Effects ................................................................... 66
Potential Residual Effects – Construction Phase ................................................................................ 66
Potential Residual Effects – Operational Phase .................................................................................. 66
10. Additive Impacts (Cumulative Impacts and their Effects) ............. 67
Construction Phase ................................................................................................................................... 71
Operational Phase ...................................................................................................................................... 71
ES Part 2 – Socio Economic Technical Paper 6– Six 56
Warrington
3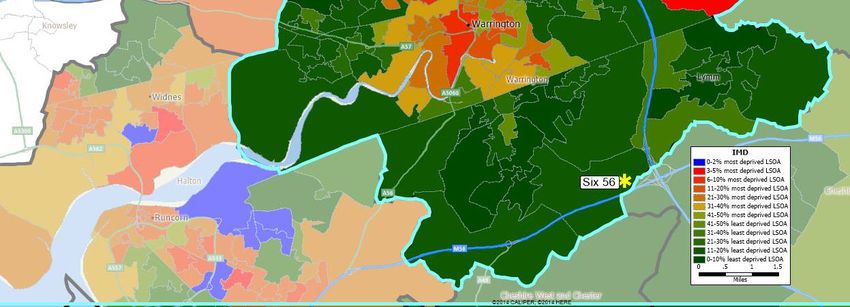
Short Term .................................................................................................................................................. 74
             Medium Term.............................................................................................................................................. 74
             Long Term.................................................................................................................................................... 75

11.          Conclusion............................................................................................ 76
12.          Reference List ...................................................................................... 79
13.          Appendices ........................................................................................... 80

             Tables and Figures:
                                     Table 6.1 - Socio-economic policy context
                                     Table 6.2 - Sources of socio-economic data and guidance
                                     Table 6.3 - Receptors
                                     Table 6.4 - Environmental Impacts
                                     Table 6.5 - Confidence Levels
                                     Table 6.6 - Economic Activity, source: ONS annual population survey
                                     Table 6.7 - Employment, source: ONS Business Register and Employment Survey
                                     Table 6.8 - Sectoral employment, source: ONS Business Register and Employment Survey
                                     Table 6.9 - Occupational profile, source: ONS annual population profile
                                     Table 6.10 - Earnings, source: ONS annual survey of hours and earnings – resident analysis
                                     Table 6.11 - Qualifications, source: ONS annual population survey
                                     Table 6.12 - Claimant rate, source: ONS claimant count
                                     Table 6.12 - Claimant rate, source: ONS claimant count
                                     Table 6.14 - State-funded Primary schools (Source: School capacity: academic year 2016 to 2017)
                                     Table 6.15 - State-funded Secondary schools (Source: School capacity: academic year 2016 to 2017)
                                     Table 6.16 - Local Authority Primary and Secondary Schools pupil numbers (Source: School
                                     Capacity Survey 2017)
                                     Table 6.17 - Gross construction employment (average annual jobs over construction period)
                                     Table 6.18 - Net additional construction employment (average annual jobs over construction
                                     period)
                                     Table 6.19 - Net additional GVA per annum over the construction period
                                     Table 6.20 - Significance of Effect – Construction Phase
                                     Table 6.21 - Gross operational employment (FTE jobs)
                                     Table 6.22 - Net additional operational employment (FTE jobs)
                                     Table 6.23 - Net additional GVA per annum – Operational Phase
                                     Table 6.24 - Projected skills required, source: AMION, Census 2011
                                     Table 6.25 - Occupational profile, source: Census 2011
                                     Table 6.26 - Significance of Effect – Operational Phase
                                     Table 6.27 - Cumulative Development
                                     Table 6.28 - Gross employment impacts from Cumulative Schemes
                                     Figure 6.1 - Approach to calculating net additional impact
                                     Figure 6.2 - Receptor Plan
                                     Figure 6.3: Employment in Warrington, source Oxford Economics

 ES Part 2 – Socio Economic Technical Paper 6 – Six 56 Warrington                                                                                                     4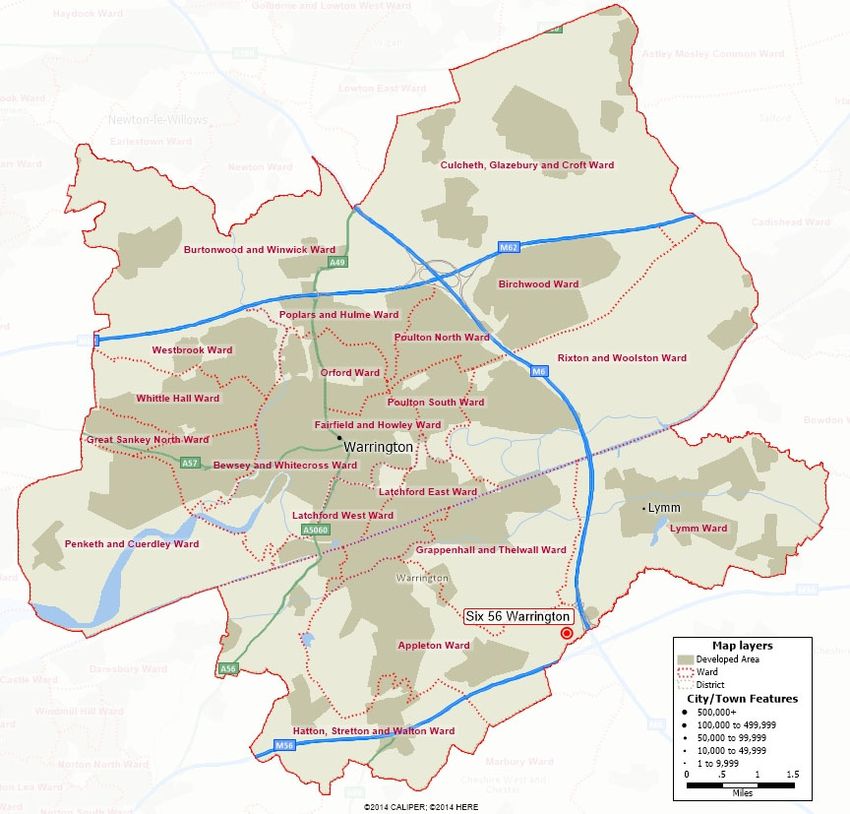
Figure 6.4 - Commuting flows, source: ONS Census 2011
                Figure 6.5 - Index of Multiple Deprivation, source: MHCLG 2015

 ES Part 2 – Socio Economic Technical Paper 6– Six 56
Warrington
                                                              5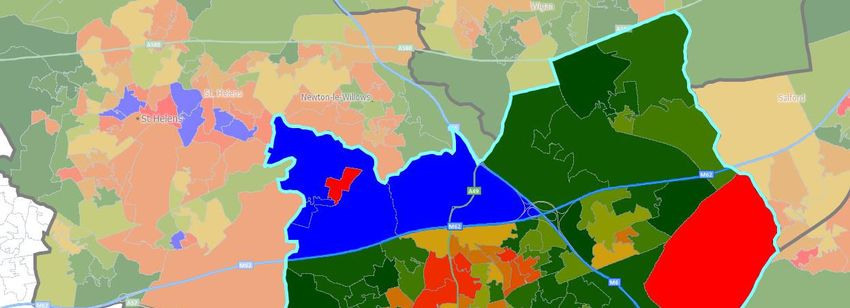
1. Introduction
1.1. This document now constitutes part of an addendum to the Environmental Statement
originally submitted to Warrington Borough Council (WBC) in March 2019 to accompany the
outline planning application for warehouse development (Use Class B8 with ancillary B1(a)
offices) and associated infrastructure at the Application Site referred to as Six 56 Warrington.
1.2. Since the submission of the planning application, consultation responses have been received
from key consultees and further discussions have taken place with the Council and their key
consultees (namely WBC Highway Officers, Highways England (HE) and their consultants
Atkins, WBC Environmental Protection Officers, Historic England and WBC Conservation
Officer and Ramboll landscape designers acting on behalf of WBC).
1.3. Further clarification and information has been provided in line with requests by HE and WBC
Highway’s Officer relating to the design of the mitigation and the WMMTM traffic model.
1.4. Environmental Protection have concerns with exposure to high noise levels that will be
experienced at existing properties on Cartridge Lane and sensitive receptors within the site
comprising Bradley Hall Cottages and Bradley View to potentially unacceptably high noise
levels, even with mitigation in place, based on the worst case estimates of the proposals as
illustrated on submitted masterplan and parameters plans.
1.5. Landscape Consultants Ramboll’s acting on behalf of the Council have also recommended
further supplementary information, including an assessment of potential effects on the visual
amenity of properties in the vicinity, in order to provide greater transparency to the LVIA and
its findings and to aid WBC in its determination of the application.
1.6. The indicative masterplan and parameters plans have evolved to address comments raised by
key consultees (including HE and WBC Highway’s Officer) and reduce the noise impacts on
sensitive receptors within the site with realignment of estate roads. Further assessments have
also been undertaken in respect of noise and vibration and landscape and visual impacts and
cultural heritage. This addendum therefore includes additional and updated information to
address the comments raised by key consultees. Part 2 of this addendum includes addendums
to the following technical papers:
Traffic and Transportation
ES Part 2 – Socio Economic Technical Paper 6 – Six 56 Warrington 6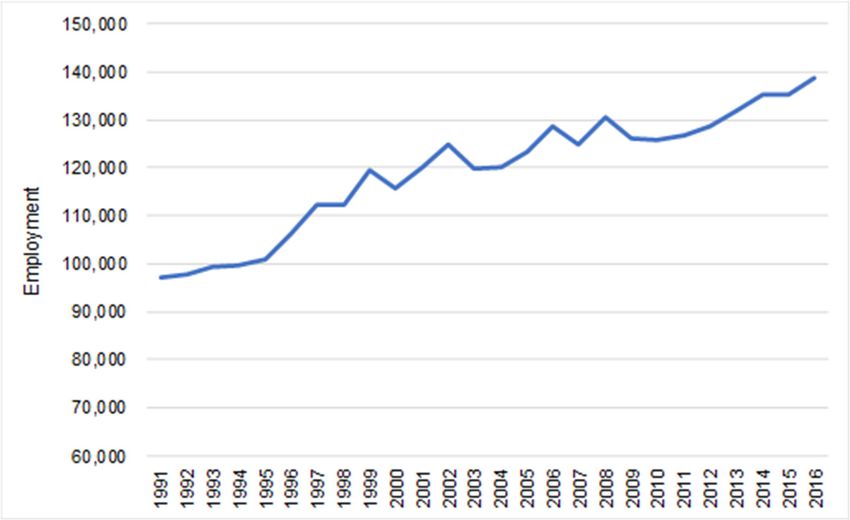
Water Quality and Drainage
Landscape and Visual Impact
Ecology and Nature Conservation
Socio Economic
Noise and Vibration
Cultural Heritage
1.7. WDC also commented to query the impact of future automation within the transport logistics
sector on employment estimates. In response, an addendum has also been prepared to the
socio-economic technical paper.
1.8. This addendum should however be read in conjunction with the original ES submitted to WBC
in April 2019 as the other technical papers (Ground Conditions and Contamination, Air
Quality, Utilities, Energy, Waste and Agricultural Land and Soils) have not been amended or
subject to change and as such are not included within this addendum, but still remain valid and
still form part of the ES for the planning application. See Appendix 18 of the ES Part 1
Addendum which provides Consultants confirmation that there are no changes to the
significance of impacts in the Ground Conditions and Contamination, Air Quality, Utilities,
Energy, Waste and Agricultural Land and Soils Technical Papers arising from the updated
project description presented in this ES Addendum.
1.9. In order to make the addendum more understandable and to avoid extensive cross
referencing, changes have been integrated within the original text of this technical paper to
form a single addendum to the ES. Wherever changes or additions have been made to the
text of the original technical paper, the text has been underlined and anything that is no longer
relevant or valid has been struck through but retained within the text. A log is also included
within Appendix 1 of this technical paper addendum so that the text to be removed (i.e. the
text struck through within the paper) is identified and a reason for its removal provided.
ES Part 2 – Socio Economic Technical Paper 6– Six 56
Warrington
7
Overview
1.10. This Addendum Technical Paper, prepared by AMION Consulting (having been instructed by
Langtree PP and Panattoni), assesses the potential socio-economic effects of the Proposed Six
56 Development on local and sub-regional socio-economic receptors.
1.11. Through the construction and occupation of B8 floorspace, the Proposed Development is
expected to generate a range of socio-economic impacts, both during the Construction Phase
and Operational Phase, including direct, indirect and induced impacts such as increased
employment and economic output (defined in terms of Gross Value Added (GVA))1.
1.12. The socio-economic assessment has considered the potential impacts arising from:
New temporary and long-term employment opportunities.
Increased economic output (GVA).
Increased business rate revenue.
Creation of training and apprenticeship opportunities.
Local labour market effects.
Commuting and migration impacts.
Effects on local services and facilities.
Wider socio-economic impacts.
1.13. This Addendum Report also considers the potential implications of automation technologies
in the transport and logistics sector. This is informed by an examination of implications of
automation for future employment within the sector, having regard to broad macroeconomic
trends, the effects on logistics sector employment displacement at the local level.
1.14. The key objectives of the socio-economic assessment are as follows:
To review the local economy and determine the associated socio-economic issues in
the context of the Proposed Development.
To identify the principal socio-economic impacts (both positive and negative) that
may result from the Proposed Development and assess the significance of these
effects.
1
Gross Value Added is a measure of the economic value of goods and services produced in an area.
ES Part 2 – Socio Economic Technical Paper 6 – Six 56 Warrington 8
To recommend measures for avoiding or reducing any identified adverse effects,
and/or enhancing positive effects, where possible.
To highlight the significance of any residual effects that would remain after mitigation.
ES Part 2 – Socio Economic Technical Paper 6– Six 56
Warrington
9
2.           Documents Consulted

             Socio-Economic Policy Context
2.1.         This section summarises the socio-economic policy context relating to the Proposed
             Development, at national, regional and local levels. Table 6.1 identifies the relevant socio-
             economic frameworks, strategies, plans and studies, together with how the Proposed
             Development will address their respective aims and objectives.

               Framework / Strategy       Proposed Development strategic fit
               / Plan / Study
               National Planning Policy   The National Planning Policy Framework (NPPF) outlines the Government’s vision
               Framework (2018)           of sustainable development for England through effective planning policies,
               (2019)                     comprising of interdependent and mutually supportive economic, social and
                                          environmental objectives. The economic dimension of the Framework emphasises
                                          that the core purpose of planning is to promote “a strong, responsive and
                                          competitive economy”, supporting growth and productivity, which will “improve
                                          the economic, social and environmental conditions of an area.”

                                          Paragraph 22 8 of the NPPF is forward-looking, emphasising the need for local
                                          planning authorities to be proactive in “anticipating and responding to long-term
                                          requirements and opportunities” by promoting innovation, supporting sustainable
                                          growth and improving productivity. The framework goes on to reiterate the
                                          Government’s commitment to ensuring that “the planning system contributes to
                                          the achievement of sustainable development” taking into account “both local
                                          business needs and wider opportunities for development” through the provision of
                                          affordable homes and business infrastructure.

                                          The Proposed Development is consistent with the Government’s commitment to
                                          economic growth, job creation and prosperity, as outlined within the Framework,
                                          and the priority of sustainable development, particularly in relation to “contributing
                                          to building a strong, responsive and competitive economy, by ensuring that
                                          sufficient land of the right type is available in the right places and at the right time
                                          to support growth and innovation”.

               Northern Powerhouse        The Northern Powerhouse Strategy (NPS) sets out the Government’s ambition to
               Strategy (2016)            achieve the “full economic potential of the North”. The Government’s strategy for
                                          improving economic growth in the north is divided into five main areas:
                                          connectivity, skills, enterprise and innovation, trade and innovation and
                                          engagement. The NPS priorities improvements in the education and skills of the
                                          labour force in the North and investment in transport to improve the connectivity
                                          throughout the region in order to address “persistent barriers to productivity in

 ES Part 2 – Socio Economic Technical Paper 6 – Six 56 Warrington                                                                10
Framework / Strategy Proposed Development strategic fit
/ Plan / Study
the North” and ensure the region is “an excellent place to start and grow a
business”.
The proposed development will contribute to rectifying the economic imbalance in
England’s regions. By expanding the logistics sector in Warrington, the proposed
development will make an important contribution to achieving the aspirations of
the NPS. The logistics sector is seen as a key enabler of growth for the North’s
other sectors (particularly linked to port and airport activity) and, while historically
logistics has been associated with relatively low-level skill requirements, the sector
has begun to move towards a higher skill business model, providing a routeway
towards improved productivity. The logistics sector’s economic productivity is
projected to grow by 83% between 2013 and 2035.
Cheshire and Warrington The Cheshire and Warrington Matters (CWM) paper is a strategic economic plan
Strategic Economic Plan establishing the region’s investment proposals to build additional housing and
(2017) create “12,473 jobs over the next three years”. CWM sets out the vision for
growth within the area in the hope of creating “an economy of £26.6bn with GVA
per head 110% of the UK average” by 2021. By 2030, Cheshire and Warrington
sub-region hopes to become “an economy of £35bn with GVA per head 115% of
the UK average. Home to an additional 100,000 residents, 75,000 new jobs and
70,000 new homes”.
The report highlights the strategic location of Warrington for business with close
links to Manchester, Liverpool and the Midlands. Warrington is also located at the
intersection of the HS2/West Coast Mainline and HS3 proposed route and at the
“unique cross-border opportunities within the Mersey Dee Economic Axis”. The
locational advantage to the logistics sector of the Warrington and Cheshire region
is proven, with an established logistic base already in operation in the area
(Omega). In the region, the logistics sector equates to 18% of the GVA and 5% of
employment. According to the indices of how concentrated an industry is in a
region, the logistics sector is more concentrated (1.52) in comparison to the
national average (1.00).
The Proposed Development will directly contribute to realising the aims identified
in the Cheshire and Warrington Strategic Economic Plan, including ‘job creation
and economic growth which benefits as many communities as possible’. In
Warrington & Cheshire “there appears to be a dumbbell, with higher than average
numbers of people with low qualifications”. The CWM paper also highlights the
“pockets of deprivation across the sub-region where large numbers of residents fall
into the ‘just about managing’ classification”. Logistics represents an industry that is
‘fairly accessible to those without a degree with possibilities to start at a lower
level and work your way up’. Moreover, a key way of “realising the economic
ES Part 2 – Socio Economic Technical Paper 6– Six 56
Warrington
11Framework / Strategy Proposed Development strategic fit
/ Plan / Study
potential of Warrington and Cheshire” is to expand the strengths of the Superport
region (Liverpool City Region, Cheshire West & Chester, Warrington and West
Lancashire), with logistics in Warrington already proven to be a successful sector.
More generally, the Proposed Development will contribute to supporting the
Growth Strategy’s aspirations of creating over 75,000 additional jobs in the City
Region, increasing the number of businesses by 20,000, raising GVA per head to
115% of the UK average, increasing average productivity per worker and reducing
unemployment.
Gateway to the The Devolution Growth Deal Bid (DGDB) establishes an ambitious plan of
Northern Powerhouse development for the Cheshire and Warrington’s sub-region, promoting the regions
(Cheshire and contribution to the Northern Powerhouse project. The economic ambition for the
Warrington Devolution – area is to create a “£50 billion economy, adding £27 billion per annum to our GVA
A Growth Deal Bid and creating 127,000 new jobs and 139,000 new homes” by 2040. In order to
Summary (2015)) realise these ambitions, the DGDB highlights the regions need to create “excellent
transport connectivity” and a “skilled and productive workforce”.
The proposal identifies several interconnecting spatial proposals which will aid
growth in the area; the development of the Warrington New City, Northern
Gateway Development Zone, Mersey Dee Economic Axis, highlighting the strategic
advantage of Warrington’s connectivity in driving the region’s economic growth.
Looking forward, this role may broaden as Warrington ‘sits at the intersection of
HS2/West Coast Mainline and HS3 (TransNorth Rail) with unrivalled access to
both the Manchester and Liverpool’.
The main objectives of the DGDB such as ‘increasing business productivity’ and
‘enabling business growth and investment’ interlink with the objectives of the
Proposed Development. Efficient supply chains are critical to economic
competitiveness and productivity and logistics and transport will continue to be key
economic drivers for a number of industries, ‘improving the productivity of the
supply-chain’.
Warrington Local Plan The Warrington Local Plan Preferred Options (LPPO) and later Submission of the
Preferred Options (2017) Local Plan (March 2019) establishes, after consultations with ‘local developers, land
and Submission Version owners and residents’, the preferred development option for Warrington, with the
of the Local Plan (March aim of ‘unlocking major development opportunities in the Town’. The updated plan
2019) prioritises land for housing and employment purposes in four separate stages:
1)The report seeks to establish the exact development needs of the Warrington
borough, identifying a target of over the 20-year plan period of 381 hectares of
employment land and 1,113 homes per annum to obtain the Council’s growth
ambitions. The updated plan concedes that some of the development land will have
to be obtained through non-radical ‘amendments of green Belt boundaries’. To
ES Part 2 – Socio Economic Technical Paper 6 – Six 56 Warrington 12Framework / Strategy Proposed Development strategic fit
/ Plan / Study
derive the preferred development for Warrington ‘at least 251 Ha of land for
employment purposes will be required to be released from the Green Belt’.
The LPPO recognises the need to address economic activity rates, acknowledging
the ‘proportion of the existing population who are currently not working but who
could take up new jobs in the future’ could be the most sustainable demographic to
drive economic growth in Warrington as they ‘do not put the same demands on
housing as people moving into the area’.
2) The strategic objectives for the Local Plan are interlinked, ranging from
‘regeneration of areas to transition Warrington into a ‘New City’ status (W1) the
delivery of infrastructure (W4) and expand ‘the role of Warrington Town Centre
as a regional employment and transport hub’ (W3).
The Council explicitly ties the consequences of ‘not releasing Green Belt land’ with
‘not meeting its development needs’. When undertaking consultations to identify
‘land for homes, employment and ensuring delivery of infrastructure’, the majority
of new employment spaces were outlined as infringing on the Green Belt with ‘29%
is within the existing urban area and 71% is proposed on Green Belt land’.
3) Stage 3 of the LPPO demonstrates the scrutiny of high spatial options for
housing and employment in Warrington to only modest release of Green Belt land,
while not undermining the permanence of the Green Belt. One proposed option is
disregarded as it could have non-sustainable and ‘detrimental impacts on Green
Belt and may result in secondary capacity issues’. The proposed spatial option
enables ‘the majority of growth to be delivered adjacent to main urban areas’.
4) After establishing the preferred spatial options for development (Green belt
adjacent to urban areas), stages four of the LPPO assessed options for
development locations. Six main development locations were analysed, judged on
criteria such as ‘the likelihood of delivery, transport implications in the area and
concentration of development in an area’. The options were also judged on the
main objectives of the plan with ambitions to ‘contribute to the wider New City
Concept’, ‘accommodate the level of growth required’ and ‘provide infrastructure
to the town as a whole’.
The Development Proposal has identified Green Belt land to further the
development of Warrington’s logistics sector. A strong industry in the Borough
already, the plan will create accessible jobs for the ‘existing population who are
currently not working’ and aligns with LPPO’s assessment of ‘demand for
employment land’. The LPPO acknowledges that the ‘predominant growth sector
in terms of land for new development is within the distribution sector’ and ‘71% of
land used for employment purposes will be Green Belt land’. The Six 56
Development Proposal has the potential to ‘contribute positively to the plan
ES Part 2 – Socio Economic Technical Paper 6– Six 56
Warrington
13Framework / Strategy Proposed Development strategic fit
/ Plan / Study
objectives’ of Warrington’s council and ‘the long-term sustainability of local
business’.
Warrington’s Economic Warrington Means Business (WMB) outlines the Council’s significant ambitions for
Growth & Regeneration the borough to reinforce ‘Warrington as a strong national driver of prosperity’.
Programme (Warrington Acknowledging Warrington’s economic success up to this point, WMB cites
Means Business) (2017) Warrington’s ‘skilled people’, ‘business clustering’ and ‘connectivity’ as key drivers
for the region’s economic growth. Warrington is ‘the largest catchment area in the
UK outside of London’, sitting at the ‘heart of Northern Powerhouse’ surrounded
by neighbouring economic hubs such as Manchester and Liverpool. Future rail and
development proposals such as HS2 and Northern Powerhouse Rail (HS3) will
reinforce Warrington’s strategic position.
WMB outlines a number of large-scale new developments including a multi-use
space called ‘Time Square Warrington’, the development of Warrington’s culture
quarter, the development of the Southern and Eastern Gateway to revitalise the
Town and drive the creation of 60,000 jobs and ‘more connected, resilient’
economic growth in the region. The ambitions of the WMB plan including to ‘grow
the Cheshire and Warrington economy by £27bn to £50bn, create 112,000 jobs
and ‘increase GVA per head to 120% of the national average’ align with the
Government’s priority to rebalance the economy in the Northern Powerhouse
Strategy (2016), driving economic growth in the North of England. The Proposed
Development will contribute to driving the economic growth in the region by
‘getting people to work’, ‘improving connectivity’ and creating ‘a skilled workforce
tailored to Warrington’s current and future business needs’.
Economic Development The Economic Development Needs Study for Warrington (EDNS) aims to identify
Needs Study (2016) future land allocation in the region, pursuing the national planning framework’s aim
of sustainable economic growth in the region. The assessment outlines the context
which shaped the calculation of employment land and floorspace necessary,
including the necessary expansion of ‘offices, industrial spaces, warehouses and
distribution sites’ in the region.
The analysis of gaps in the current land supply, in terms of quality and location,
identifies a need to allocate land to the logistics and transport sector. While in
2016, 5% of employment and a GVA value substantially above national average for
the borough came from transport and storage uses, the study forecasts the role of
logistics in the regional economy will continue to expand: ‘the current success of
Omega in attracting big shed warehousing has demonstrated the pent-up demand
in this sector’. Highlighting the high price of the new build Omega distribution
units’ shows demand in the region is at highs as ‘not achieved for distribution units
in the North West previously'. Moreover, changes in the retail sector with
ES Part 2 – Socio Economic Technical Paper 6 – Six 56 Warrington 14Framework / Strategy Proposed Development strategic fit
/ Plan / Study
increased online shopping will continue to drive demand and encourage expansion
in the demand for logistics sites.
According to the EDNS, the expansion of Warrington’s logistics sector ‘would
require an adjustment to Warrington’s Green Belt boundaries’ with a need for
additional ‘industrial and warehouse units of 2,000-5,000 sqm’. A forecast of future
employment indicates an expanding logistics sector is likely to strengthen job
creation in the area despite automation, translating into job numbers and additional
employment floorspace requirements.
Table 6.1: Socio-economic policy context
Socio-Economic Data and Guidance
2.2. The principal sources of socio-economic data and the guidance used to conduct the
assessment of socio-economic impacts is summarised in Table 6.2.
Topic area Sources of data and guidance
Economic activity and Office of National Statistics (ONS) annual population survey and Business Register
employment and Employment Survey (BRES)
Local labour market ONS annual population survey and annual survey of hours and earnings
Commuting patterns Census 2011 origin destination data
Unemployment and ONS claimant count data and annual population survey
worklessness
Capacity of social Department for Education school capacity data; NHS Choices datasets
infrastructure
Deprivation Ministry of Housing, Communities and Local Government (MHCLG) English
indices of deprivation 2015’
Construction phase Homes and Communities Agency (HCA) (2015), ‘Calculating Cost Per Job: Best
employment and GVA Practice Note 2015 (3rd Edition)’; ONS Annual Population Survey
impact
Operational phase HCA (2015), ‘Employment Density Guide, 3rd Edition’; Prologis (2015), ‘Technical
employment and GVA insight from Prologis UK: Distribution warehouses deliver more jobs’; British
impact Property Federation (BPF) (2015) ‘Delivering the Goods: The economic impact of
the UK logistics sector’; ONS Annual Population Survey
Automation, productivity Acemoglu D and Restrepo P (2018a) The Race Between Machine and Man:
and employment Implications of Technology for Growth, Factor Shares and Employment American
ES Part 2 – Socio Economic Technical Paper 6– Six 56
Warrington
15Topic area Sources of data and guidance
Economic Review; Acemoglu D and Restrepo P (2019), Automation and New
Tasks: How Technology Displaces and Reinstates Labor, IZA Discussion Paper
Acemoglu D, Restrepo P (2017) Robots and jobs: Evidence from US Labour
Markets, in NBER Working Paper No. w23285; Arntz M, Gregory T and Zierahn U
(2016), The Risk of Automation for Jobs in OECD Countries, OECD Social,
Employment and Migration Working Papers No. 189; Autor, D and Salomons A
(2018) Is Automation Labor-Displacing? Productivity Growth, Employment, and the
Labor Share, Brookings Papers of Economic Activity, BEPA Conference, 2018
Autor, David H., Frank Levy, and Richard J. Murnane. 2003. “The Skill Content of
Recent Technological Change: An Empirical Exploration.” Quarterly Journal of
Economics 118 (4): 1279–333; Brynjolfsson E, Mitchell T and Rock D, What Can
Machines Learn and What Does It Mean for Occupations and the Economy?, AEA
Papers and Proceedings 2018, 108: 43–47; Carbonero F, Ekkehard E and Weber, E
(2018), Robots worldwide: The impact of automation on employment and trade,
ILO, Working Paper 36; Chiacchio F; Petropoulos G, Pichler D (2018). The impact
of industrial robots on EU employment and wages: A local labour market
approach, Bruegel Working Papers; De Backer, K. DeStefano T. Menon, C. and
Suh, J (2018). Industrial robotics and the global organisation of production, in
OECD Science, Technology and Industry Working Papers, 2018/03, OECD
Publishing, Paris; Frey, C and Osborne, M (2013), The future of employment: How
susceptible are jobs to computerisation? Working Paper, University of Oxford,
Oxford later published (2017) in Technological Forecasting & Social Change
Graetz, G.; Michaels, G. (2015) Robots at work, in CEP Discussion Paper No 1335
McKinsey (2019), Automation in logistics: Big opportunity, bigger uncertainty
McKinsey Global Institute (2017) A Future That Works: Automation, Employment,
And Productivity; Nedelkoska L and Quintini G, (2018) Automation, skills use and
training, OECD Social, Employment and Migration Working Papers No. 202
ONS (2019) The probability of automation in England: 2011 and 2017.
Oxford Economics (2017) The AI Paradox: How Robots Will Make Work More
Human; Oxford Economics (2019) How Robots Change the World
Piketty, Thomas. 2014. Capital in the Twenty-First Century. Harvard University
Press; Autor, David, David Dorn, Lawrence F. Katz, Christina Patterson, and John
Van Reenen. 2017b. “The Fall of the Labor Share and the Rise of Superstar Firms.”
NBER Working Paper No. 23396; Dao, Mai, Mitali Das, Zsoka Koczan, and
Weicheng Lian. 2017. “Why is Labor Receiving a Smaller Share of Global Income?
Theory and Empirical Evidence,” IMF Working Paper; Price Waterhouse Coopers
(PwC) (2018), Will robots really steal our jobs? An international analysis of the
potential long term impact of automation; Prologis Technical Insight (2019),
Delivering the future: the changing nature of employment in distribution
warehouses; Vermeulen B , Kesselhut J, Pyka A and Saviotti p (2018) The Impact of
Automation on Employment: Just the Usual Structural Change, mdpi,
ES Part 2 – Socio Economic Technical Paper 6 – Six 56 Warrington 16Topic area Sources of data and guidance
Net additional impact HCA (2014), ‘Additionality Guide, Fourth Edition 2014’; Department for Business
Innovation & Skills (BIS) (2009), ‘Guidance for using additionality benchmarks in
appraisal’; ONS UK input-output analytical tables
Business rate revenue Valuation Office Agency (VOA) ratetable value data
Training and Targeted Recruitment and Training benchmarks
apprenticeship Department for Education learner volumes
opportunities
Local labour market ONS BRES and annual population survey; Census 2011 highest level of qualification
impacts by economic activity
Commuting impacts Census 2011 origin destination data
Effect on local facilities Department for Education school capacity data; NHS Choices datasets
and services
Table 6.2: Sources of socio-economic data and guidance
ES Part 2 – Socio Economic Technical Paper 6– Six 56
Warrington
173. Consultations
3.1. Two public consultation events were held on 15th October 2018 and 16th October 2018, at
which the results of the initial economic impact assessment along with other details of the
Proposed Development were presented. The feedback from these events relating to the
socio-economic aspects of the Proposed Development included:
Concern over the quantity of jobs created – a number of people raised the
issue of how many jobs the Proposed Development would create, given the
increasing use of warehouse automation, potentially limiting employment
opportunities for local people. The assessment of employment impact has been
based on standard employment densities, as detailed in Section 7 of this Technical
Paper. Analysis of recent and planned developments, such as at Omega,
demonstrates employment densities in line or above the standard benchmarks.
Indeed, analysis undertaken for BPF on the economic impact of the UK logistics
sector argues that “the investment in automation has a positive effect on employment
volume as a larger workforce (e.g. drivers and other staff) is needed to dispatch the
greater number of parcels sorted per hour”.2
Concern over the quality of the jobs created – another principal concern, in
terms of socio-economic impact, raised during the consultation process related to
the quality of the jobs that would be created. This is reflective of the view that the
logistics sector provides low skilled, elementary jobs. However, despite the relatively
low level skill requirements that have typically been associated with the logistics
sector, technological change is driving a requirement for workers to be multi-skilled
and a greater need for specialised technical skills, such as in term of managing IT
systems.3 Research by the UK Commission for Employment and Skills identifies an
increasing need for individuals within the logistics sector to be multi-skilled in many
areas, including management roles, drivers, port operatives, warehouse operatives,
transport office, IT professionals and trainers.4
Concern over how to ensure local people are able to access the jobs
provided – a further issue raised during the consultation process was the extent to
2
BDF (2015), Delivering the Goods: The economic impact of the UK logistics sector, p.22
3
Essex Employment and Skills Board (2017), Evidence Base Sector Profile Logistics 2017
4
UKCES (2014), Understanding Skills and Performance Challenges in the Logistics Sector
ES Part 2 – Socio Economic Technical Paper 6 – Six 56 Warrington 18which local people will be able to access the employment opportunities created
through the Proposed Development. It is expected that the development will be a
key source of local employment. As set out within the Framework Travel Plan (see
Section 2.2 of Traffic and Transportation ES Technical Chapter 2), a number of
improvements are proposed such as new bus services and pedestrian and cycle links
which will help improve the accessibility of the site to local residents. A Local
Employment Agreement will also be put in place that will seek to maximise the local
economic impact that can be achieved through the Construction Phase through active
engagement with local people, businesses, schools and other organisations (see
Section 7 of this Technical Paper).
3.2. A Scoping Request was submitted to Warrington Council on 27th February 2018, requesting
the Council’s opinion on the scope of the ES. The Council’s Opinion was received on 6th April
2018. In relation to Socio Economics, the Council agreed the general approach and the
consideration of matters set out in the scope (see Scoping Opinion included at Appendix 13
of the ES Part One Addendum Report). However, the Council’s Public Health Team identified
the need for a sub Warrington assessment, taking into account the positives and negatives of
the socio economic impacts on different population groups and providing evidence on how
this project would impact local residents that are greatest in need. As part of the assessment
of socio-economic effects in Section 7 of this Technical Paper, an analysis has therefore been
carried out of the nature of the employment opportunities created and the extent to which
these will be accessible to local unemployed people.
3.3. In addition to the two public consultation events and Scoping Request, discussions were also
held with representatives from Cheshire and Warrington Local Enterprise Partnership (LEP),
Warrington & Co., Youth Fed and the Construction Industry Training Board (CITB). The
discussions sought to examine how best to maximise the benefits of the Proposed
Development for local people and businesses, including through, for example, “meet the
buyer” events, site visits and presentations at local schools and further community engagement
to ensure people were aware of the opportunities that will be created.
3.4. Based on comments raised by consultees in response to the ES, further consideration has
been given to the implications of automation for future employment in the transport and
logistics sector. As part of the assessment of ongoing operational effects in Section 7 of this
ES Part 2 – Socio Economic Technical Paper 6– Six 56
Warrington
19Addendum Report, consideration has been given to the potential effects of automation on
employment over the long term.
ES Part 2 – Socio Economic Technical Paper 6 – Six 56 Warrington 204. Methodology and Approach
4.1. The assessment of socio-economic impacts has been undertaken using the following
methodology:
A review of the strategic policy context to provide an outline of the relevant national
and sub-national / local social and economic objectives of the area.
Identification of the impact area, in relation to each potential socio-economic impact,
for the assessment of the Proposed Development.
A desktop review of all publicly available information on current socio-economic and
labour market conditions in the study area to establish the baseline using accepted
Government sources, such as the Census and Office for National Statistics (ONS)
data.
Assessment of likely significant socio-economic effects of the Proposed Development
during the Construction and Operational Phases, based on sensitivity value of
receptor and magnitude of effect.
Recommendation of mitigation measures where necessary.
Assessment of significance of residual effects assuming that the mitigation measures
are implemented.
Identification of likely significant additive / cumulative effects with regard to other
consented schemes in the local area.
4.2. Qualitative and quantitative assessments have been undertaken using assessment
methodologies from published guidance, including the former Homes and Communities
Agency’s (HCA’s) (now Homes England) Additionality Guide and Employment Densities
Guide, and professional judgement.
4.3. The estimate of operational employment set out within this Addendum Report has been
informed by an examination of the effects of automation for employment in the transport and
logistics sector. This has been informed by a macroeconomic review of automation and
implications for employment, alongside evidence relating to the potential scale of employment
displacement at the microeconomic level.
4.4. Key to understating the socio-economic effects of the Proposed Development is determining
its net additional impact or ‘additionality’. This is the extent to which activity takes place at
all, on a larger scale, earlier or within a specific designated area or target group as a result of
ES Part 2 – Socio Economic Technical Paper 6– Six 56
Warrington
21the intervention. The approach to assessing the net additional impact of a project is shown
diagrammatically in Figure 6.1 overleaf.
Figure 6.1: Approach to calculating net additional impact
4.5. In order to assess the additionality of the Proposed Development, the following factors were
considered:
Leakage – the proportion of outputs that benefit those outside of the area of impact.
Displacement – the proportion of outputs accounted for by reduced outputs
elsewhere in the area of impact. Displacement may occur in both the factor and
product markets.
Multiplier effects – further economic activity associated with additional local income
and local supplier purchases.
Deadweight – outputs which would have occurred without the Proposed
Development. This is referred to as the reference case.
ES Part 2 – Socio Economic Technical Paper 6 – Six 56 Warrington 224.6. The above approach to assessing the additional impact of a project is consistent with central
Government guidance for physical development projects, including the Appraisal Guide (2016)
published by the then Department for Communities and Local Government (DCLG).
Receptors
4.7. Table 6.3 sets out a definition of the receptor criteria that will be used to inform the
significance of effects.
Designation Receptors
International The receptor is of international importance
It has Socio-economic value outside of the UK
National The receptor is of national importance
It is identified as a key priority within national policy
Regional The receptor is of regional importance
It is identified as a key priority within regional policy
County / sub-region The receptor is of importance at the county / sub-regional level
It is identified as a key priority within policy for the county / sub-region
Borough/District The receptor is of importance to the Borough of Warrington
It is identified as a key priority within policy for Warrington
Local/Neighbourhood The receptor is of importance locally
It is identified as a key priority locally
Table 6.3: Receptors
4.8. Based on the initial identified receptors, the area of impact is expected to principally extend
to the Boroughs of Warrington and its constituent wards. The wider area of impact will also
incorporate the Boroughs of Cheshire East, Cheshire West and Chester, Halton, St Helens
and Wigan, as outlined within Figure 6.2 overleaf.
ES Part 2 – Socio Economic Technical Paper 6– Six 56
Warrington
23Figure 6.2: Receptor Plan
Environmental Impacts
4.9. In relation to socio-economics, there are no published standards against which the predicted
impacts of a development can be assessed in terms of defining the magnitude of effect. The
approach adopted therefore takes account of the socio-economic profile of the area and
industry knowledge of similar projects being brought forward across the sub-region. As set
out in Table 6.4, for a number of the socio-economic impacts, thresholds have been identified
to categorise the magnitude of effect. For other impacts, such as wider socio-economic
effects, it has been necessary to make a more subjective judgement.
ES Part 2 – Socio Economic Technical Paper 6 – Six 56 Warrington 24Magnitude Environmental Impact
Employ- Economic Business Training & Effect on Commuting Effect on Wider
ment output rates appren- local labour & migration local socio-
effects effects revenue ticeship market impacts facilities economic
and effects
services
Substantial A A A A substantial A substantial A substantial Substantial Substantial
substantial substantial substantial change in change in change in net restriction wider
change in change in change in training and local labour out or socio-
net number net business apprenticeship market commuting increase in economic
of jobs at economic rates opportunities conditions, from within local effects
the county output at revenue at the county with an Warrington facilities within the
/ sub- the county within / sub-regional impact or Borough
regional / sub- Warrington level of more equivalent to services area for a
level of regional of more than 1% of more than for a period of
more than level of than £5m current 1% of the period of at least five
1,000 jobs more than per annum provision resident at least years
£50m per workforce five years
annum (economically
active) in
Warrington
High A high level A high level A high level A high level of A high level A high level High High
of change of change of change change in of change in of change in degree of occurrence
in net in net in business training and local labour net out restriction of wider
number of economic rates apprenticeship market commuting or socio-
jobs at the output at revenue opportunities conditions, from increase in economic
county / the county within at the county with an Warrington local effects
sub- / sub- Warrington / sub-regional impact facilities within the
regional regional of between level of equivalent to or Borough
level of level of £2.5m and between between services for a
between between £5m per 0.75% and 1% 0.75% and 1% for a period of
500 and £25m and annum of current of the period of at least
1,000 jobs £50m per provision resident at least three years
annum workforce three
(economically years
active) in
Warrington
ES Part 2 – Socio Economic Technical Paper 6– Six 56
Warrington
25Magnitude Environmental Impact
Employ- Economic Business Training & Effect on Commuting Effect on Wider
ment output rates appren- local labour & migration local socio-
effects effects revenue ticeship market impacts facilities economic
and effects
services
Moderate A A A A moderate A moderate A moderate A Moderate
moderate moderate moderate change in change in change in net moderate wider
change in change in change in training and local labour out restriction socio-
net number net business apprenticeship market commuting or economic
of jobs at economic rates opportunities conditions, from within increase in effects
the county output at revenue at the county with an Warrington local within the
/ sub- the county within / sub-regional impact facilities Borough
regional / sub- Warrington level of equivalent to or for a
level of regional of between between 0.5% between services period of
between level of £1m and and 0.75% of 0.5% and for a at least
100 and between £2.5m per current 0.75% of the period of two years
500 jobs £5m and annum provision resident at least
£25m per workforce two years
annum (economically
active) in
Warrington
Minor A small, but A small, but A small, but A small, but A small, but A small, but A small, Small, but
measurable, measurable, measurable, measurable, measurable measurable, but noticeable,
change in change in change in change in change in change in net noticeable, wider
net number net business training and local labour out restriction socio-
of jobs at economic rates apprenticeship market commuting or economic
the county output at revenue opportunities conditions, from within increase in effects
/ sub- the county within at the county with an Warrington local within the
regional / sub- Warrington / sub-regional impact facilities Borough
level of less regional of less than level of less equivalent to or for a
than 100 level of less £1m per than 0.5% of less than services period of
jobs than £5m annum current 0.5% of the for a at least
per annum provision resident period of one year
workforce at least
(economically one year
active) in
Warrington
ES Part 2 – Socio Economic Technical Paper 6 – Six 56 Warrington 26Magnitude Environmental Impact
Employ- Economic Business Training & Effect on Commuting Effect on Wider
ment output rates appren- local labour & migration local socio-
effects effects revenue ticeship market impacts facilities economic
and effects
services
Negligible No No No No noticeable No No Not a No
noticeable noticeable noticeable change in noticeable noticeable noticeable noticeable
change in change in change in training and change in change in net difference wider
net number economic business apprenticeship local labour out in the socio-
of jobs at output at rates opportunities market commuting provision economic
the county the county revenue at the county conditions from within of local effects
/ sub- / sub- within / sub-regional Warrington facilities within the
regional regional Warrington level or Borough
level level services
Neutral No change No net No change No change in No change in No change in A neutral Neutral
in net change in in business training and the local net out effect on wider
number of economic rates apprenticeship labour commuting the socio-
jobs at the output at revenue opportunities market from within provision economic
county / the county within at the county Warrington of local effects
sub- / sub- Warrington / sub-regional facilities within the
regional regional level and Borough
level level services area
Table 6.4: Environmental Impacts
Significance of Effects
4.10. The significance of effect is determined using the significance matrix in Section 6 of the
Environmental Statement Part One Report. This identifies the receptor level across the top
of the matrix and the magnitude of environmental impact down the side and where they meet
within the matrix identifies the significance of the effect.
Impact Prediction Confidence
4.11. It is also of value to attribute a level of confidence by which the predicted impact has been
assessed. The criteria for these definitions are set out below:
ES Part 2 – Socio Economic Technical Paper 6– Six 56
Warrington
27Confidence Level Description
The predicted impact is either certain i.e. a direct impact, or believed to be very likely
High
to occur, based on reliable information or previous experience.
The predicted impact and its levels are best estimates, generally derived from first
Low principles of relevant theory and experience of the assessor. More information may be
needed to improve confidence levels.
Table 6.5: Confidence Levels
ES Part 2 – Socio Economic Technical Paper 6 – Six 56 Warrington 285. Baseline Information
5.1. Prior to considering the socio-economic effects, it is necessary to establish a clear
understanding of baseline socio-economic conditions within the geographical areas relevant
to the Site. The baseline analysis has focused on the Borough of Warrington, as well as the
area covered by Cheshire and Warrington LEP, reflecting the location of the site close to the
boundaries of Cheshire East and Cheshire West and Chester. In addition, reflecting the
Scoping Opinion received by the Council, a sub Warrington level analysis has been undertaken
in relation to unemployment and deprivation. Trends in the change over time of key socio-
economic indicators have been analysed compared to those for the North West and
nationally.
5.2. The following indicator groups have been assessed:
Employment (economic activity rate and sectoral employment analysis).
Local labour market (resident employment by occupation, resident earnings and
qualifications).
Commuting patterns.
Unemployment and worklessness.
Capacity of social infrastructure (local education and health facilities).
Deprivation.
Economic activity and employment
Economic activity
5.3. Economic activity rates for Warrington and comparator areas between July 2013 and June
2018 are provided in Table 6.6. The number of economically active people aged between 16
and 64 in Warrington stood at 105,700 as at July 2017 to June 2018. This represents 79.0%
of the total working age population of Warrington. Despite some recorded declines over
recent years, the economic activity rate in Warrington has been consistently above the North
West and Great Britain averages. This is reflective of the borough being one of the strongest
local economies in the North of England.
5.4. Notwithstanding the above, over the last five years of recorded data for economic activity
rates, there has been an overall downwards trend in the level of economic activity in
ES Part 2 – Socio Economic Technical Paper 6– Six 56
Warrington
29You can also read