Ireland's Ocean Economy - June 2019 - NUI Galway
←
→
Page content transcription
If your browser does not render page correctly, please read the page content below
Ireland’s Ocean Economy 1

Ireland’s
Ocean
Economy
June 2019

                €
            %
Contributing Authors
Andreas Tsakiridis,

Murat Aymelek,

Daniel Norton,

Ryan Burger,

Jenny O’Leary,

Rebecca Corless,

Stephen Hynes

   FOR FURTHER INFORMATION PLEASE CONTACT:

   Dr. Stephen Hynes

   Socio-Economic Marine Research Unit (SEMRU)

   J.E. Cairnes School of Business and Economics,

   National University of Ireland, Galway

   Office: +353(0)91 493105

   Email: stephen.hynes@nuigalway.ie

   Web: http://www.nuigalway.ie/semru/

Acknowledgments
The authors would like to thank Gerard Doolan and Stephanie Kelleher (Central Statistics Office),
Liam Lacey and Ciaran O’Driscoll (Irish Maritime Development Office), Nessa Skehan (Fáilte Ireland),
Emmet Jackson (BIM) and Keillan Clancy (Marine Institute). Finally, we would like to thank all the
companies that kindly gave their time to complete the SEMRU Marine Enterprise Survey.

SEMRU
The Socio-Economic Marine Research Unit (SEMRU) at NUI Galway has been commissioned under
the Marine Research Sub-Programme PBA/SE/16/01 to report on the performance of Ireland’s ocean
economy. The focus is not only on continuing to collect reliable and comparable marine socio-
economic data across all the marine sectors, but also to satisfy one of the specific core tasks for
SEMRU, namely to develop a methodology which will provide reliable estimates of the economic
contribution of the marine sector and its growth over time.

This work was carried out with the support of the Marine Institute and it is funded by the Marine
Research Sub-Programme PBA/SE/16/01 Valuing and understanding the dynamics of Ireland’s Ocean
Economy.
Ireland’s Ocean Economy 3

Contents
  04                 09                  11                 13
   Executive        Introduction      Indirect Gross        A Profile of
   Summary                             Value Added       Ireland’s Ocean
                                                             Economy

  20
  Established
                     23
                    Shipping and
                                        25
                                       Tourism and
                                                            29
                                                          International
     Marine           Maritime       Leisure in Marine   Cruise Industry
   Industries        Transport         and Coastal
                                           Areas

   31                34                 36                  39
 Marine Retail      Sea Fisheries        Marine             Seafood
   Services                            Aquaculture         Processing

   41
  Oil and Gas
                     44Marine
                                        46
                                     Emerging Marine
                                                            49
                                                         Advanced Marine
Exploration and    Manufacturing,      Industries          Technology
  Production        Construction                          Products and
                   and Engineering                           Services

   51                54                 56                  59
   Marine              Marine            Marine          Ireland’s Coastal
  Commerce         Biotechnology       Renewable             Economy
                        and              Energy
                    Bio-products

   67Valuing
                     70
                    Conclusions
                                        73
                                       Appendix:
Ireland’s marine                      Methodology
   ecosystem                           and Data
     services                           Sources
4 Ireland’s Ocean Economy

Executive Summary
Reliable socio-economic marine data is essential if policy makers are to use an
evidence based approach to foster development of our ocean related industries. It
is also vital if Ireland is to utilise its substantial marine resources in a manner that,
as envisioned under the EU Blue Growth Strategy and Ireland’s Integrated Marine
Plan, ensures a healthy marine environment and the continued delivery of marine
ecosystem services to Irish society.

With that in mind, this report provides a detailed analysis of Ireland’s ocean economy over time and
presents a complete and comparable profile across thirteen marine related industries, which allows
us to observe progress on the targets set out in the Government’s Integrated Marine Plan for Ireland
- Harnessing Our Ocean Wealth (2012). The report includes a set of economic projections that
forecast Ireland’s ocean economy up to 2018. It also provides a profile of Ireland’s coastal economy
using Census of Population Small Area Statistics.

   THIS REPORT AIMS TO:
   •   Provide a profile of Ireland’s ocean                          for Ireland - Harnessing Our Ocean
       economy for 2016 and 2018;                                    Wealth (2012);

   •   Provide estimates for turnover, Gross                     •   Provide an overview of the policy
       Value Added1 (GVA) and employment                             environment and outlook of the sector
       for the 2010-2018 period;                                     where appropriate;

   •   Assist in monitoring progress of a                        •   Provide an analysis of trends in each
       number of targets set out in the                              ocean industry in the 2008-2018
       Government’s Integrated Marine Plan                           period.

In 2018, Ireland’s ocean economy had a turnover of €6.2 billion. The direct economic contribution,
as measured by GVA was €2.2 billion or 1.1% of GDP. Ireland’s ocean economy provided employment
for 34,132 FTEs. Compared to 2016, 2018 saw a 13% increase in turnover, a 11% increase in gross
value added (GVA) and a 13% increase in employment.

The indirect GVA that is generated from ocean related activity in Ireland in 2018 amounts to a €1.96
billion, with a total GVA (direct and indirect) of €4.19 billion, which represents 2% of GDP.

1
  Gross value added is the value of output less the value of intermediate consumption and it is a measure of the contribution to
GDP made by an individual producer, industry or sector.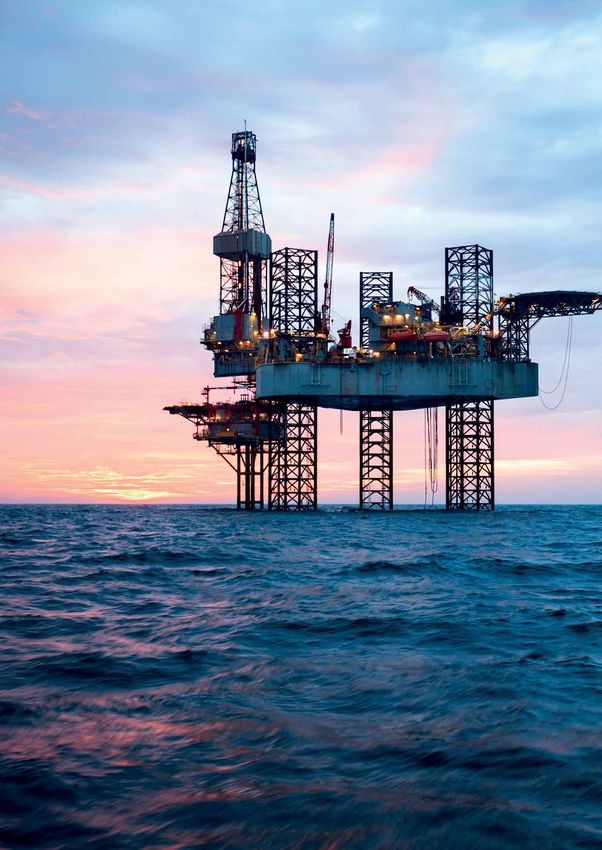
Ireland’s Ocean Economy 5

This report is divided into two broad types of marine industries:

The Established Marine Industries in 2018 had an estimated turnover of €5.8 billion and provided
employment of 32,048 FTEs representing 93% of the total turnover and 94% of total employment
in Ireland’s ocean economy. This sector includes shipping and maritime transport, tourism and
leisure in marine and coastal areas, international cruise, sea fisheries, marine aquaculture, seafood
processing, oil and gas exploration and production, marine manufacturing, construction and
engineering and marine retail services.

      International cruise, oil and gas exploration and production, and marine manufacturing,
      construction and engineering experienced the largest increases in economic activity
      over the 2016-2018 period.

The Emerging Marine Industries in 2018 had an estimated turnover of €459 million and provided
estimated employment to 2,084 FTEs representing 7% of the turnover and 6% of employment in
Ireland’s ocean economy. Emerging industries refer to those that are still at a relatively early stage
of development, and are primarily R&D intensive and/or use the latest cutting edge technology in
their pursuit of economic growth. Ireland’s ocean economy emerging industries includes advanced
marine technology products and services, marine commerce, marine biotechnology and bio-
products and marine renewable energy.

      Marine commerce and the marine biotechnology and bio-products industries
      experienced the largest increases in turnover and GVA in the 2016-2018 period. The
      marine renewable energy and the advanced marine technology products and services
      industries saw a decline in both turnover and GVA over the same period. On aggregate
      employment experienced a 7% increase across the emerging industries in the 2016-
      2018 period.

   THE OCEAN ECONOMY - DEFINITION

   The ocean economy is defined as any economic activity that directly or indirectly uses the
   sea as an input or produces an output for use in a sea-specific activity.

   The coastal economy, on the other hand, represents all economic activity that takes place in
   the coastal region, which is not necessarily part of the ocean economy.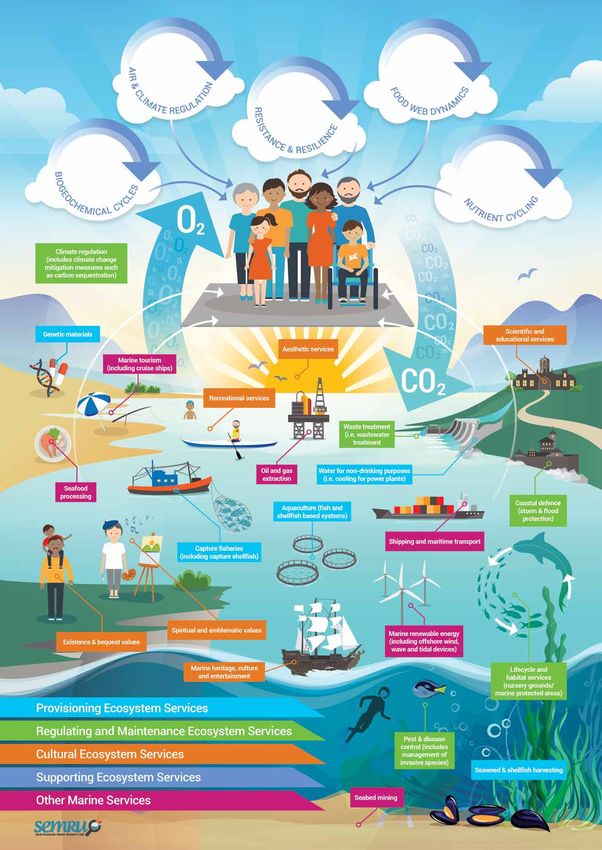
6 Ireland’s Ocean Economy

                                   IRELAND’S
                                    OCEAN ECONOMY 2018

     DIRECT IMPACT                                                                             (SEMRU, UPDATE JUNE 2019)

           34,130                   €6.23 BN                         1.16%                      €2.23 BN
           EMPLOYEES                 TURNOVER                            % GDP                        GVA

     TOTAL (DIRECT & INDIRECT)

                                                                               ARGET 2
                                                                            30T       .4
                                                                           0   STATU           S2
                                                                                 18
                                                                                                    %
                                                                     2
                                                                          20

                                                                                                %

                                                                                   2007
                 2%
                % GDP                       1.8%                                 BASELINE
                                           €4.2 BN                                 1.2%
                                              GVA

                                                                                      % Change          % Change
                                2016               2018
                                                                HOOW Targets          2014-2016         2016-2018
                               (Actual)          (Estimate)
                                                                                        (Actual)         (Estimate)
     GVA                       €2.00bn           €2.23bn                                33%*               11%**
     Employment
                               30,208             34,132                                 10%              13%***
     (FTEs)
     % GDP (Direct)              0.9%               1.1%
     % GDP (Direct
                                                    2%            2.4% (2030)
     & Indirect)
     Turnover                  €5.52bn           €6.23bn         €6.4bn (2020)           18%                13%

        * National growth over the period estimated at 16% (GNI)
        ** National growth over the period estimated at 10%
        *** National employment growth over the period estimated at 3%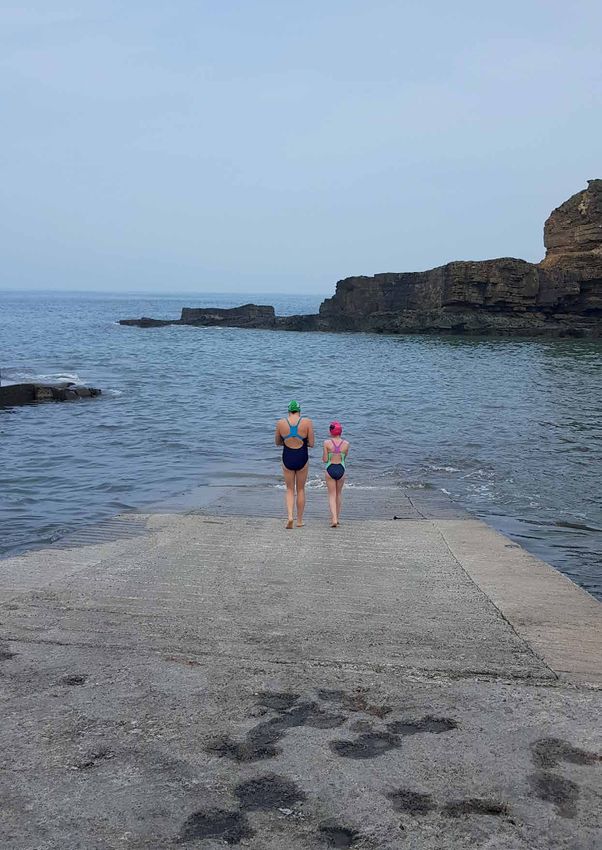
Ireland’s Ocean Economy 7

Ireland’s marine
territory covers
an area of
880,000km2
8 Ireland’s Ocean Economy

Introduction

                            €
Ireland’s Ocean Economy 9

This report is the fifth in the series produced by the Socio-Economic Marine
Research Unit (SEMRU) at the National University of Ireland Galway. The four
previous reports examined the economic value of Ireland’s ocean economy using
2007, 2010, 2012 and 2014 data respectively. This report builds on those previous
ones by profiling and analysing Ireland’s ocean economy in the 2016 to 2018 period.
While the latest data available for a number of the industries is 2016 this report
presents economic estimates for the years 2017 and 2018 for those industries where
more recent data was not available.

In addition, this report also profiles the socio demographic profile of Ireland coastal economy and
in recognition of the importance of Ireland’s oceans for the delivery of marine ecosystem services
to Irish society it also presents the results from a recent SEMRU report that estimated the value of
a range of marine ecosystem service benefits. Accounting for these services and how they change
as the ocean economy grows is vital to ensure ‘blue growth’, i.e. ensuring the “development of
marine economic activities in such a manner that the long term ability of the marine environment to
continue to provide ecosystem service benefits is not compromised”2.

As in previous years the data is used to examine the progress of the ocean economy in terms of the
targets set out by the Irish Government in Harnessing Our Ocean Wealth – an Integrated Marine Plan
(IMP) for Ireland and shown in Table 1. Published in 2012, the IMP presents “the Government’s vision,
high-level goals and integrated actions across policy, governance and business to enable Ireland’s
marine potential to be realised”3.

      HARNESSING OUR OCEAN WEALTH TARGETS
      (Baseline year for targets: 2007)

      Double the value of Ireland’s ocean wealth to 2.4% of GDP by 2030
      Increase the turnover from Ireland’s ocean economy to exceed €6.4bn by 2020

Source: Government of Ireland, Inter-Departmental Marine Coordination Group (MCG), Harnessing Our Ocean Wealth - An
Integrated Marine Plan (IMP) for Ireland,” July 2012

Table 1: Sectoral Targets set out in Harnessing Our Ocean Wealth

    Sector                                                                                                 2020 Target*
    Seafood (fisheries, aquaculture, seafood processing)                                                  €1,000 million
    Maritime Commerce and Ship Leasing                                                                    €2,600 million
    Marine and Coastal Tourism and Leisure (including Cruise Tourism)                                      €1,500 million
    Marine ICT and Biotechnology                                                                             >€61 million
    Ports and Maritime Transport Services, Maritime Manufacturing,
                                                                                                         >€1,200 million
    Engineering, Offshore Oil and Gas, other marine industries
Source: Harnessing our Ocean Wealth – An Integrated Marine Plan for Ireland; *Projected Annual Turnover by 2020. Baseline period:
2007

2
 Norton, D., Hynes, S. and Boyd, J. (2018). EPA Research Report No 239: Valuing Ireland’s Coastal, Marine and Estuarine
Ecosystem Services, EPA Publications, Wexford.
3
  Government of Ireland, Inter-Departmental Marine Coordination Group (MCG), Harnessing Our Ocean Wealth - An
Integrated Marine Plan (IMP) for Ireland,” July 2012.
10 Ireland’s Ocean Economy

The overarching aim of this report is to assist policy making by providing a profile of Ireland’s Ocean
Economy in the 2008-2018 period and industry-by-industry economic projections for the 2016 to
2018 period against which future marine socio-economic data can be compared. Data is also being
provided to support the implementation of the EU Marine Strategy Framework Directive (MSFD)
and the Maritime Spatial Planning (MSP) Directive in Ireland. The ocean industry data, coupled with
the coastal economy statistics and the marine ecosystem service benefit values provides important
information that can also contribute in achieving the UN Sustainable Development Goal 14:
Conserve and sustainably use the oceans, seas and marine resources for sustainable development.

The methodology used in compiling this report on Ireland’s ocean economy is the same as that used
in previous reports. The reference year, the latest year for which data is available from the Central
Statistics Office (CSO) for a number of the industries looked at is 2016. There is a two-year time lag
in the release of Structural Business Statistics (SBS) from the CSO. However, more up-to-date data
is available for some sectors such as sea fisheries and marine aquaculture. To allow for a complete
and comparable representation of Ireland’s ocean economy across all sectors, the report presents
estimates based on economic projections of Ireland’s ocean economy up to 2018. These estimates
are based on a forecasting exercise of the economic performance of a number of industries. The
methodology used combines the latest published economic data from the CSO, government
economic forecasts and expert judgment information obtained from interviews with marine-related
businesses and relevant government departments and agencies. Details on the methodologies used
for the economic projections are presented in the Appendix.

Figures presented in Table 2 suggest that Ireland’s ocean economy continues to perform better,
on average, than the general economy. While growth in the Irish economy from 2014 to 2016 was
approximately 16%, the ocean economy grew by 33% in the same period. This was mainly driven
by an upsurge in shipping and marine tourism activity and the coming on line of the Corrib Gas
terminal. Estimates suggest that GVA growth rates in Ireland’s ocean economy for the 2016-2018
period was approximately 11%, which is now just marginally above the recent increase of 10% in
Ireland’s GDP for the same period4.

Table 2: The Irish Ocean Economy key figures and trends, 2014, 2016 and 2018

                                                                    % Change                               % Change
                                     2014             2016                                   2018
                                                                   2014-2016                              2016-2018
                  GVA        €1.49 billion €2.00 billion                    33%      €2.23 billion                  11%
               % GDP           0.9% GDP         0.9% GDP                                1.1% GDP
            Turnover         €4.65 billion    €5.52 billion                 18%      €6.23 billion                  13%
       Employment            27,391 FTEs 30,208 FTEs                        10%       34,132 FTEs                   13%

4
  Modified GNI at current market prices (GNI*) from the CSO was used as the measure of economic growth year on year. GNI*
is an indicator that was recommended by the Economic Statistics Review Group and is designed to exclude globalisation
effects that are disproportionally impacting the measurement of the size of the Irish economy when using standard GDP.
Ireland’s Ocean Economy 11
Indirect Gross Value Added
The production economy can be viewed as a cyclical system of product and
services flows between producers and consumers. Industries utilize factors of
production (inputs), such as labour, capital, natural resources, and technology to
produce goods and services that can be directly sold to consumers as final products
(outputs) or sold to other industries where they will be further used as inputs for the
production of other products.
These economic/production flows are recorded in input-output tables according to product
and industry classifications. Input-output tables are often used to understand the structural
interdependencies between industries, tracing input requirements for each product back through
the production cycle. Moreover, input-output tables are used to calculate output, employer and GVA
multipliers.
SEMRU in collaboration with Teagasc (Agriculture and Food Development Authority) developed
a Bio-Economy Input-Output (BIO) model for Ireland. The BIO model allows for the analysis of
linkages between the bio-economy industries and industries within the wider economy. Marine-
related industries represent a vital element of the bio-economy. The BIO model encompasses
established and emerging marine industries allowing for the assessment of impacts of economic
activities involving marine resources on the wider economy.
Table 3: Direct and Indirect GVA, 2018
Direct and
Direct GVA Indirect GVA
Sector Indirect GVA
(€’000) (€’000)
(€’000)
Shipping & Maritime Transport 697,210 990,038 1,687,249
Tourism and leisure in Marine and Coastal Areas 648,440 382,580 1,031,020
International Cruise 20,339 11,999 32,338
Marine Retail Services 74,534 32,795 107,329
Sea Fisheries 173,000 53,630 226,630
Marine Aquaculture 100,320 39,125 139,445
Seafood Processing 161,129 203,022 364,151
Oil and Gas Exploration and Production 106,470 56,429 162,899
Marine Manufacturing, Construction and
67,888 69,925 137,812
Engineering
Marine Advanced Technology Products and
41,868 43,124 84,991
Services
Maritime Commerce 67,704 29,790 97,494
Marine Biotechnology and Bio-products 29,767 30,660 60,427
Marine Renewable Energy 37,187 19,709 56,896
Total 2,225,856 1,962,826 4,188,68112 Ireland’s Ocean Economy
The BIO model is used to examine the direct and indirect effects of a change in the final demand for
the output of a marine industry on GVA. The direct effect captures the change in GVA of the marine
industry of interest due to a change in the final demand for its output. The indirect effect captures
the change in GVA in the entire production chain required to support the production of an additional
unit of final output of the marine industry of interest and its suppliers of intermediate inputs.
As shown in Table 3, Ireland’s estimated total direct GVA in 2018 was €2.23 billion, indirect GVA
was €1.96 billion and total GVA (direct and indirect) was more than €4.19 billion. Harnessing Our
Ocean Wealth (HOOW) - An Integrated Marine Plan for Ireland set out a target to double the value of
Ireland’s ocean economy (both direct and indirect) to 2.4% of GDP by 2030. The estimated direct and
indirect GVA of €4.19 billion represents 2% of GDP. This has increased only very marginally in the last
number of years. The fact that it is increasing is noteworthy as GDP in the wider economy has also
been growing strongly albeit at a slightly slower pace than the ocean economy.
€Ireland’s Ocean Economy 13
A Profile of Ireland’s Ocean Economy
Ireland’s ocean economy had a turnover5 of €5.5 billion in 2016, of which €2 billion
was direct gross value added (GVA)6. The Irish marine sector employed 30,208 FTEs.
Ireland’s total output, as measured by Modified Gross National Income, in 2016
was approximately €189 billion. The direct GVA from marine economic activity is
therefore approximately 1% of national output. In 2018 Ireland’s ocean economy
had an estimated turnover of €6.2 billion and provided estimated employment to
34,132 FTEs.
The established industries in Ireland’s ocean economy account for 93% of total marine turnover.
This category is dominated by both shipping and maritime transport, as well as tourism and leisure in
marine and coastal areas (Table 4). As observed in previous reporting periods, shipping and maritime
transport continue to be the largest contributor in terms of turnover and value added in 2016.
Tourism and leisure in marine and coastal areas is the next largest category overall and is the largest
contributor with regards to employment.
Within the emerging marine industries, marine advanced technology and marine commerce
make the largest contribution in terms of turnover and value added in 2016. The marine advanced
technology products and services category along with the marine biotechnology sector is also an
important category in terms of employment. The spatial distribution of enterprises and employment
in Ireland’s ocean economy is shown in Figure 1.
Overall the top three performing industries in Ireland’s ocean economy in terms of value and
employment are shipping and maritime transport, tourism and leisure in marine and coastal areas,
and seafood (fisheries, aquaculture and processing combined).
Table 4: Direct Turnover, GVA and Employment by industry, 2016
Direct Direct
Direct GVA €
2016 Turnover € Employment
Millions
Millions (FTEs)
Established Industries
Shipping and Maritime Transport 2,095.58 638.47 4,629
Marine Tourism and Leisure 1077.98 557.54 15,905
International Cruise Industry 25.94 9.76 …
Marine Retail Services 159.02 70.96 810
Sea Fisheries 303.67 164.50 2,536
Marine Aquaculture 167.17 98.40 1,030
Seafood Processing 602.29 172.15 2,429
Oil and Gas Exploration and Production 597.28 71.67 145
Marine Manufacturing, Construction and
107.61 60.98 779
Engineering
Established Markets Sub-Total 5,136.53 1,844.44 28,263
5
Turnover is the value of sales
6
GVA refers to a sector’s turnover (output) minus intermediate consumption (the inputs into the production process). It is
measured at basic prices, excluding taxes less subsidies on products.14 Ireland’s Ocean Economy
Table 4: Direct Turnover, GVA and Employment by industry, 2016 (continued)
Direct Direct
Direct GVA €
2016 Turnover € Employment
Millions
Millions (FTEs)
Emerging Industries
Advanced Marine Technology Products and
139.68 60.63 695
Services
Marine Commerce 140.73 41.76 342
Marine Biotechnology and Bio-products 43.61 16.99 453
Marine Renewable Energy 59.00 38.10 454
Emerging Markets Sub-Total 383.02 157.48 1945
Total 5,519.55 2,001.20 30,208
The overall turnover of Ireland’s ocean economy in 2016 was €5.5 billion, an increase of 18% on
2014. GVA and employment increased by 33% and 10%, respectively, over the same period. Tables
5-7 show the direct turnover, GVA and employment by sector from 2010 to 2018. Estimates for the
2016-2018 period suggest an overall increase in turnover of 13% to €6.2 billion, with a comparable
increase in GVA and employment of 11% and 13% respectively over the same period.
Turnover in the traditional, established
Figure 1: Spatial distribution of marine industries increased from €4.4 billion
enterprises and employment in to €5.1 billion in the 2014-2016 period. This
Ireland’s Ocean Economy
represented a 17% increase, and was mainly
driven by significant increases in shipping and
maritime transport, marine tourism, oil and
gas production and exploration, and marine
aquaculture. Employment in the established
industries category rose from 25,670 FTEs in
2014 to 28,263 in 2016, an increase of 10%.
Estimates for the established marine industries
suggest that in 2018, turnover increased to €5.8
billion, an increase of 12% on 2016. Estimates
show an increase of 11% in GVA to €2.05
billion and an increase of approximately 13% in
employment to 32,048 FTEs in the established
industries in the 2016-2018 period (See Tables
5-7).
Turnover of firms in the emerging marine
industries also increased from €275 million
to €383 million in the 2014-2016 period, an
increase of 39%. GVA in the emerging industries
category experienced an increase of 60%, while
employment increased by 13%. Estimates for
the 2016-2018 period suggest that growth in
the emerging industries has continued with
an estimated increase in turnover, GVA and
employment, of 19% to €458 million, 12% to
€177 million and 7% to 2,084 FTEs, respectively.Ireland’s Ocean Economy 15
In 2018
Ireland’s ocean
economy had
an estimated
turnover of
€6.2
bn16 Ireland’s Ocean Economy
Table 5: Direct Turnover by sector (Euro Million), 2010-2018
Direct Turnover (€ millions) % Change
2014- 2016-
2010 2011 2012 2013 2014 2015 2016 2017 2018
2016 2018
Established Markets
Shipping and
Maritime 1,684.81 1,722.46 2,247.40 1,636.86 1,945.46 1,887.46 2,095.58 2,200.36 2,288.37 8% 9%
Transport
Marine
Tourism and 1,003.38 864.47 775.75 890.83 984.58 852.95 1,077.98 1,150.21 1,253.73 9% 16%
Leisure
International
21.66 21.44 20.83 25.72 24.30 27.00 25.94 36.63 51.44 7% 98%
Cruise Industry
Marine Retail
57.69 … 119.23 109.50 152.63 136.35 159.02 149.20 167.03 4% 5%
Services
Sea Fisheries 187.80 235.30 268.90 276.40 311.90 244.17 303.67 309.00 315.39 -3% 4%
Marine
122.50 128.50 130.30 117.72 116.30 148.66 167.17 208.00 176.00 44% 5%
Aquaculture
Seafood
470.22 530.69 535.49 576.84 517.05 563.14 602.29 626.38 563.74 16.5% -6.5%
Processing
Oil and Gas
Exploration
212.59 205.11 229.88 215.73 199.64 139.25 597.28 632.76 819.00 199% 37%
and
Production
Marine
Manufacturing,
Construction 110.81 … 199.08 164.91 121.00 120.35 107.61 121.61 136.78 -11% 27%
and
Engineering
Established
Markets Sub- 3,871.46 3,707.97 4,526.86 4,014.51 4,372.86 4,119.34 5,136.52 5,434.14 5,771.47 17% 12%
Total
Emerging Markets
Advanced
Marine
Technology 55.92 71.28 74.03 80.07 90.94 139.68 98.29 96.45 74.5% -31%
Products and
Services
Marine
53.60 86.56 108.18 138.45 134.55 140.73 179.19 228.15 1.65% 62%
Commerce
Marine
Biotechnology
29.87 44.51 46.40 29.51 39.61 43.61 67.07 76.41 48% 75%
and Bio-
products
Marine
Renewable 11.54 15.83 18.75 26.89 29.03 59.00 58.29 57.59 119% -2%
Energy
Emerging
Markets Sub- 150.93 218.17 247.35 274.92 294.13 383.02 402.83 458.60 39% 20%
Total
Total 4,022.39 3,707.97 4,745.03 4,261.85 4,647.77 4,413.47 5,519.55 5,836.97 6,230.07 18% 13%Ireland’s Ocean Economy 17
Table 6: Direct GVA by sector (Euro Millions), 2010-2018
Direct GVA (€ millions) % Change
2014- 2016-
2010 2011 2012 2013 2014 2015 2016 2017 2018
2016 2018
Established Markets
Shipping and
Maritime 416.25 433.97 374.59 467.31 488.50 577.56 638.47 670.39 697.21 31% 9%
Transport
Marine
Tourism and 289.52 316.06 329.92 357.49 396.53 433.30 557.54 594.89 648.44 40% 16%
Leisure
International
6.25 7.84 8.86 10.32 9.79 10.14 9.76 14.33 20.34 -0.2% 108%
Cruise Industry
Marine Retail
33.91 … 34.56 33.37 60.05 68.52 70.96 66.58 74.53 18% 5%
Services
Sea Fisheries 65.00 105.10 142.60 134.70 168.10 114.00 164.50 166.00 173.00 -2% 5%
Marine
46.20 53.30 60.60 31.19 49.16 81.85 98.40 118.56 100.32 100% 2%
Aquaculture
Seafood
121.36 140.23 126.71 127.86 135.21 131.41 172.15 179.03 161.13 27% -6.5%
Processing
Oil and Gas
Exploration
25.80 24.89 27.89 26.18 23.96 22.33 71.67 82.26 106.47 199% 48.5%
and
Production
Marine
Manufacturing,
Construction 44.00 … 32.83 46.72 64.96 65.43 60.98 63.11 67.89 -6% 11%
and
Engineering
Established
Markets Sub- 1,048.28 1,081.39 1,138.57 1,235.12 1,396.26 1,504.52 1,844.43 1,955.14 2,049.33 32% 11%
Total
Emerging Markets
Advanced
Marine
Technology 20.81 38.61 43.55 36.11 38.11 60.63 42.66 41.87 68% -31%
Products and
Services
Marine
31.81 49.17 49.91 42.17 41.63 41.76 53.17 67.70 -1% 61%
Commerce
Marine
Biotechnology
12.99 18.76 19.67 4.62 13.91 16.99 26.13 29.77 267% 75%
and Bio-
products
Marine
Renewable 3.65 8.65 11.95 15.40 18.68 38.10 37.64 37.19 147% -2%
Energy
Emerging
Markets Sub- 69.26 115.18 125.07 98.30 112.33 157.48 159.61 176.52 60% 12%
Total
Total 1,117.53 1,081.39 1,253.75 1,360.19 1,494.56 1,616.86 2,001.92 2,114.76 2,225.85 33% 11%18 Ireland’s Ocean Economy
Table 7: Direct Employment by sector, 2010-2018
Direct Employment (FTEs) % Change
2014- 2016-
2010 2011 2012 2013 2014 2015 2016 2017 2018
2016 2018
Established Markets
Shipping and
Maritime 4,092 3,684 3,933 4,336 4,375 4,553 4,629 4,860 5,055 6% 9%
Transport
Marine
Tourism and 12,562 12,753 13,003 13,439 13,865 13,946 15,905 16,970 18,107 15% 14%
Leisure
International
… … … … … … … … … … …
Cruise Industry
Marine Retail
252 … 590 613 743 755 810 831 927 9% 14.5%
Services
Sea Fisheries 3,479 2,688 2,709 2,717 2,395 2,522 2,536 2,660 2,663 6% 5%
Marine
952 958 956 956 941 988 1,030 1,912 1,925 9.5% 87%
Aquaculture
Seafood
1,975 2,013 2,174 2,226 2,360 2,284 2,429 2,526 2,383 3% -2%
Processing
Oil and Gas
Exploration
57 64 84 83 85 90 145 149 154 70.5% 6%
and
Production
Marine
Manufacturing,
Construction 726 … 875 953 906 860 779 806 834 -14% 7%
and
Engineering
Established
Markets Sub- 24,094 22,160 24,324 25,323 25,670 25,998 28,263 30,715 32,048 10% 13%
Total
Emerging Markets
Advanced
Marine
Technology 391 420 437 561 574 695 608 683 24% -2%
Products and
Services
Marine
110 161 165 322 339 342 365 389 6% 13.5%
Commerce
Marine
Biotechnology
304 373 406 436 482 453 345 545 4% 20%
and Bio-
products
Marine
Renewable 216 245 276 401 432 454 461 467 13% 3%
Energy
Emerging
Markets Sub- 1,021 1,199 1,284 1,720 1827 1945 1779 2084 13% 7%
Total
Total 25,115 22,160 25,523 26,607 27,391 27,825 30,208 32,494 34,132 10% 13%Ireland’s Ocean Economy 19
Figures 2 and 3 show the general trend in direct turnover, GVA and employment for established and
emerging marine industries in the 2008-2018 period, respectively. Overall the established industries
experienced a fall in activity between 2009 and 2012, a reflection of the economic downturn during
the great recession. Between 2013 and 2018, there has been a steady increase in economic activity,
as measured by GVA, which in some industries has been significant. The general trend in direct
turnover, GVA and employment in emerging marine industries for the period 2010-2018 is also
upwards, particularly with regards to turnover and employment. Individual industry details on these
trends are shown in the following sections of the report.
Figure 2: Direct Turnover, GVA and Employment; Established Marine Industries,
2008-2018
Figure 3: Direct Turnover, GVA and Employment; Emerging Marine Industries,
2010, 2012-201820 Ireland’s Ocean Economy
Established Marine Industries
Established marine industries refer to the traditional sectors that are usually
associated with marine activity. Established marine industries had a turnover of
€5.14 billion in 2016 and provided employment of 28,263 FTEs, representing 94% of
the turnover and employment in Ireland’s ocean economy.
In 2018 the established marine Industries had an estimated turnover of €5.77 billion and provided
estimated employment to 32,048 FTEs. The established industries include shipping and maritime
transport, tourism and leisure in marine and coastal areas, international cruise, sea fisheries, marine
aquaculture, seafood processing, oil and gas exploration and production, marine manufacturing,
construction and engineering and marine retail services. The relative contribution of each of these
sectors to the overall turnover, employment and GVA of the established marine industries are shown
in Figure 4 for 2016.
Figure 4: Relative contribution (%) of each subsector within the Established Irish
Marine Industries to turnover, GVA and employment, 2016Ireland’s Ocean Economy 21
The shipping and maritime transport sector was the largest contributor to established marine
industries in terms of turnover, followed by tourism and leisure in marine and coastal areas, seafood
processing, sea fisheries and oil and gas exploration and production, respectively.
Tourism and leisure in marine and coastal areas was the largest contributor to employment across
the established marine industries, followed by shipping and maritime transport, seafood processing
and sea fisheries, respectively. Indeed tourism and leisure in marine and coastal areas accounts for
57% of all employment in the Irish ocean economy. This share is even higher in other European
member state’s ocean economies.
In terms of GVA, again shipping and maritime transport is the largest contributor to Ireland’s
established marine industries, followed by tourism and leisure in marine and coastal areas, sea
fisheries and seafood processing, respectively.
Figure 5 shows the rate of change in turnover, GVA and employment for the established industries
in the 2016-2018 period. International cruise has experienced the largest increase in turnover and
GVA. Oil and gas exploration and production also show significant increases in value over this period
while, according to BIM statistics, aquaculture experienced a large increase in employment. The
majority of this expansion in employment occurred in 2017 while there was actually only a 0.5%
increase in numbers employed in the industry, year on year, in 2018. In contrast, seafood processing
shows a slight decline in turnover and GVA. Details on economic trends by sector are presented in
the following sections, as well as the economic projections out to 2018.
Figure 5: Rates of change (%) in turnover, GVA and employment. Established
Industries, 2016-201822 Ireland’s Ocean Economy €2.1 bn Economic contribution of the shipping and maritime transport services and operations in 2016
Ireland’s Ocean Economy 23
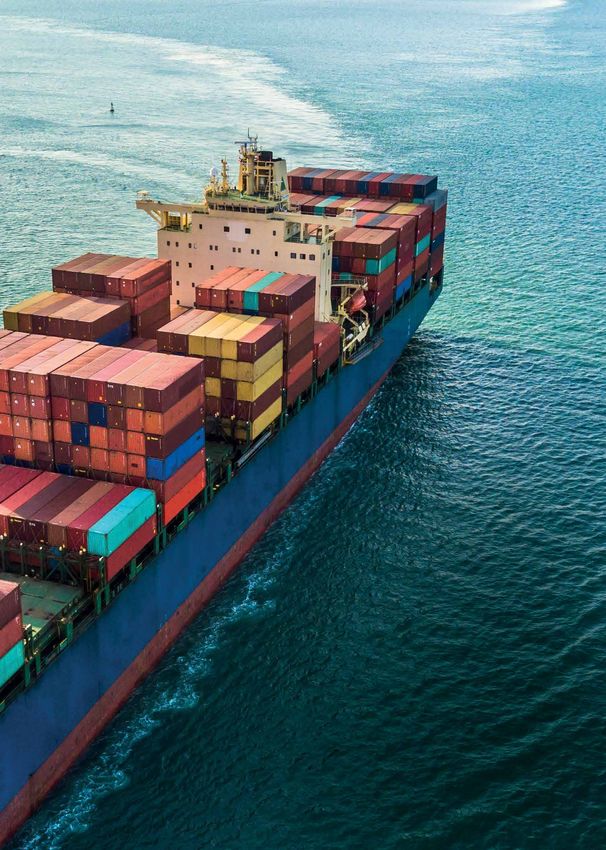
Shipping and Maritime Transport
Shipping and maritime transport provides supply chain integration and international
trade connectivity for Ireland to the main global trade routes and markets. Marine
trade is the most cost efficient and sustainable way of trade, especially for cargoes
with relatively high volume and long origin-destination distances. The maritime
transport industry represented approximately 85% of the total volume, and 56% of
the total value7 of the cargoes transported for export and import in Ireland in 20168.
The shipping and maritime transport sector consists of waterborne transport activities including
both freight and passenger transport, as well as many related services, including ship chartering and
brokering, equipment leasing, stevedoring etc. Table 8 illustrates the turnover, GVA, and employment
rates for the industry for 2014, 2016 and 2018, as well as the % change between 2014 and 2016 and
2016 and 2018. Figure 6 indicates the numbers for both the turnover and employment rates between
2008 and 2018.
PROFILE
• Sea and coastal passenger water • Cargo handling
transport
• Renting and leasing of water transport
• Sea and coastal freight water transport equipment
• Services incidental to water transport • Other transportation support activities
Note marine commerce and cruise tourism are covered elsewhere in the report.
Table 8: Shipping and Maritime Transport turnover, GVA, employment, 2014, 2016 and 2018(e)
Shipping and Maritime 2014-2016 2016-2018
2014 2016 2018
Transport (% change) (% change)
Turnover €000’s 1,945,455 2,095,577 2,288,370 8% 9%
GVA €000's 488,502 638,471 697,210 31% 9%
Employment FTEs 4,375 4,629 5,055 6% 9%
The majority of shipping and maritime operations and services
occur around commercial ports along the coast of Ireland: Cork,
Location of activity
Drogheda, Dublin, Waterford, Dundalk, Dun Laoghaire, Galway,
New Ross, Shannon Foynes and Wicklow
Source: CSO – Annual Services Inquiry (ASI), NACE Four-Digit Codes: 50.10, 50.20, 52.22, 52.24, 52.29, 77.34; IMDO iShip
Index; CSO Quarterly National Household Survey; Figures for 2017 and 2018 are estimates9
The economic contribution of the shipping and maritime transport services and operations to the
Irish economy reached €2.1 billion in 2016. In total €638 million was generated in GVA. Turnover
of the industry increased from 2014 to 2016 by 8%, with 31% growth in GVA observed in the same
period.
7
44 million tonnes and €68 billion
8
CSO Trade Statistics – INTRASTAT, 2017
9
See Appendix 1 for details on the methodology.24 Ireland’s Ocean Economy
Approximately €2.3 billion was generated in turnover by the industry in 2018. It is estimated
that 5,055 FTEs were employed in the industry in 2018, which indicates a 4% annual increase in
employment. In 2018, GVA was estimated to have been €697.2 million.
Even though turnover is still estimated here to be below the highest level recorded in 2009, the
industry has been in a relatively slow but steady recovery period. This is closely associated with
global supply-demand imbalance in the global shipping and maritime transport industry and a
deceleration of international trade growth in recent years. Recent figures from the IMDO suggest
however that total port volumes reached record levels in 2018, exceeding those set in 200810. Figure
6 illustrates the recorded and estimated data trends for both the turnover and employment rates
between 2008 and 2018.
Figure 6: Shipping and Maritime Transport turnover and employment trends,
2008 – 2018
Source: CSO – Annual Services Inquiry (ASI), NACE Four-Digit Codes: 50.10, 50.20, 52.22, 52.24, 52.29, 77.34; IMDO iShip
Index; CSO Quarterly National Household Survey; Figures for 2017 and 2018 are estimates11
Based on data provided by the IMDO a 3% increase in dry bulk port traffic, a 2% increase in liquid bulk
port traffic and a 4% increase in lo-lo/container traffic was recorded in 2018, in comparison to 2017
data. While these figures indicate clear evidence of growing international trade activity in Ireland,
uncertainties around Brexit remain a concern and are creating continuing operational unknowns in
the shipping and maritime transport industry. Both freight and passenger transport are likely to be
affected. Another recent IMDO study12 concluded that the Irish economy is also significantly reliant
on the landbridge route, the commonly used freight transportation route between Ireland and
continental Europe via Britain. It found that 38% of Irish unitised exports (RoRo and LoLo traffic) to
EU continental ports ship via the landbridge and that certain sectors such as agri-food, seafood, and
other sectors trading in time sensitive produce could be adversely affected by any deterioration in
transit times or increases in costs that may result once the UK leaves the EU.
Irish Maritime Development Office (2019), Maritime Transport Economist 15th Edition, The Irish Maritime Development
10
Office, IMDO Publication
11
See Appendix for details on the methodology.
12
Breen, B., Brewster, P., O’ Driscoll, C., Tsakiridis, A., (2018). The Implications of Brexit on the Use of the Landbridge, Dublin:
Irish Maritime Development Office.Ireland’s Ocean Economy 25
Tourism and Leisure in
Marine and Coastal Areas
One of the key industries contributing to Ireland’s ocean and coastal economies is
tourism and leisure. Tourism and leisure in marine and coastal areas13 continues to
provide the highest employment numbers in Ireland’s ocean economy. Excluding
coastal accommodation, an estimated 260 enterprises are also involved in the
delivery of marine leisure activities around the coast of Ireland.
The overall tourism industry contributed an estimated €8.4 billion in 2017 to the Irish economy and
overseas tourist visits to Ireland in 2018 grew by 6% (9.5 million visitors) relative to 201714. Tourism
and leisure in coastal areas is a significant component of this overall market.
Marine-based tourism and leisure activity demand consists of both a domestic and an international
market. Fáilte Ireland figures indicate that approximately 135,000 tourists participated in angling in
2017. Marine activities such as surfing, windsurfing, kite surfing, sailing and sea kayaking are also very
popular among domestic tourists. Tourist attractions in coastal areas, for instance the Cliffs of Moher
and Dun Aengus on the Aran Islands, continue to be popular destinations for international tourists.
The Cliffs of Moher visitor centre was recorded as the second most visited tourism destination in
Ireland in 2018, hosting 1.58 million tourists, with a 3.8% growth in comparison to 2017.
Figure 7 shows the most popular coastal county destinations by marine activity for a sample of 600
overseas visitors as recorded in a recent SEMRU overseas tourism survey15. The west coast dominates
in terms of marine-related activity demand amongst our overseas visitors. This may reflect in part the
success of the Fáilte Ireland Wild Atlantic Way initiative.
The turnover, GVA, and employment for 2014, 2016 and 2018, as well as the % change between 2014
and 2016 and between 2016 and 2018, are illustrated in Table 9. Figure 8 presents the trends for both
turnover and employment rates between 2010 and 2018.
PROFILE
Watersports Seaside/Resort Trips Angling
• Sailing at sea • Swimming in the sea • Sea angling from boats
• Boating at sea • Bird watching in coastal • Sea angling from the
• Water skiing/Jet skiing areas shore
• Surfing, sail boarding • Whale/dolphin watching
• Sea kayaking • Visiting coastal natural
reserves
• Scuba diving/snorkeling
• Other trips to the beach
• Other sea sports seaside and islands
• Coastal accommodation
13
For the purpose of this study, tourism is defined as tourism in coastal areas. Coastal areas are defined as municipalities (LAU-
2) that either border on the sea or have 50% of their surface within a distance of 10 km from the sea).
14
Fáilte Ireland Tourism Facts, 2017 and Preliminary 2018
15
A full report on the overseas tourism survey is currently will be published in 2019.26 Ireland’s Ocean Economy
Figure 7: Overseas tourist marine and coastal activity by coastal county, 2018.
Results of SEMRU visitor survey
Table 9: Tourism and Leisure in Marine and Coastal Areas; turnover, GVA, employment, 2014,
2016 and 2018
2014-2016 2016-2018
Tourism 2014 2016 2018
(% change) (% change)
Turnover €’000 984,580 1,077,985 1,253,729 9% 16%
GVA €000's 396,528 557,543 648,440 40% 16%
Employment FTEs 13,865 15,905 18,107 15% 14%
Tourism and leisure in marine and coastal areas are offered all
Location of activity
along the coast of Ireland
Source: CSO – Annual Service Inquiry (ASI); NACE Four-Digit Code: 5510, 5520, 5530, 9312, 9319, 9321, 9329; Fáilte Ireland
statistics.
Following the drop in tourism activity during the great recession, the industry has been on a
reasonably steady growth path since 2012. The turnover generated by the sector in 2016 was €1,078
million. GVA was €558 million in 2016 representing an increase in activity of 40% between 2014 and
2016. In the same period, employment also increased to 15,905 FTEs, an increase of 15%. Estimated
figures for 2017 and 2018 suggest that turnover, GVA and employment have all increased in line
with Fáilte Ireland’s observed growth in tourism numbers for this period. Turnover from the sector is
estimated to have reached €1.25 billion in 2018.Ireland’s Ocean Economy 27
Figure 8: Tourism and Leisure in Marine and Coastal Areas; turnover and
employment trends, 2008 – 2018
Source: CSO – Census of Industrial Production (CIP) NACE Four-Digit Code: 5510, 5520, 5530, 9312, 9319, 9321, 9329. Fáilte
Ireland statistics.
Tourism Ireland has presented an optimistic view for tourism in Ireland for the 2019 season and the
expectations are, that if Ireland can remain competitive, visitor numbers will continue to grow16.
Brexit continues to create uncertainties in terms of demand from our largest overseas market, Britain.
A recent SEMRU overseas coastal and marine tourism survey showed that 17% of British tourists
believed that Brexit would be a barrier to making future visits to Ireland with a further 30% unsure if
it would impact on their future travel plans to Ireland or not. Despite the Brexit uncertainties, Fáilte
Ireland figures indicate that the number of British tourists that visited Ireland in 2018 increased
marginally by 0.8% on the previous year.
16
Tourism Ireland, Situation and Outlook Analysis Report, February 201928 Ireland’s Ocean Economy In 2017 the overall tourism industry contributed to the Irish economy an estimated €8.4 bn
Ireland’s Ocean Economy 29

International Cruise Industry
Visiting Ireland via cruise ships is becoming increasingly popular amongst tourists.
According to the Cruise Lines International Association (CLIA) there was a 6.7%
increase in cruise passenger numbers globally from 2017 to 2018 with a total of
28.5 million passengers traveling on board cruise ships in 201817. Approximately
14.2 million of those were from North America, representing 49.9 percent of global
ocean passengers. In addition, 25.1 percent of total passengers came from Europe,
followed by Asia-Pacific and South America.

Global growth of the industry has increased the demand for new cruise line itineraries and Ireland
continued to capitalise on this with some of its most popular tourist attractions in close proximity to
the cruise ships main ports of call.

Table 10 indicates the total expenditure by disembarking cruise passengers at Irish ports and GVA for
2014, 2016 and 2018, as well as the percentage change in the 2014-2016 and 2016-2018 periods.
Figure 9 illustrates the number of passenger and cruise ship visits to Irish ports from 2010 to 2018.

     PROFILE

     The main ports of call for cruise liners
     include:                                                   •   Waterford
     •   Dublin                                                 •   Galway
     •   Cork                                                   •   Dun Laoghaire

Table 10: International Cruise passengers, calls, expenditure, GVA, 2014, 2016 and 2018

                                                                                           2014-2016         2016-2018
 International Cruise Industry                  2014           2016           2018
                                                                                           (% change)        (% change)
 Average passengers per port call              1,068            947           1,362            -11%              43%
 Number of calls Irish ports                     177            209            301              18%              44%
 Total expenditure by
 disembarking cruise passengers                24,296         25,937          51,440             7%              98%
 €000’s
 Estimated Gross Value Added
                                                9,785          9,765         20,339            -0.2%            108%
 €000’s
Source: IMDO - The Irish Maritime Transport Economist

17
  CLIA, “The Cruise Industry: Contribution of Cruise Tourism to the Economies of Europe”, 2019. 2018 Cruise Trends &
Industry Outlook, available at: https://cruising.org/-/media/research-updates/research/clia-2019-state-of-the-industry-
presentation-(1).pdf
30 Ireland’s Ocean Economy
In 2018, 301 cruise ships berthed at Irish ports, indicating a 44% increase from 2016 figures. The total
expenditure by disembarking cruise passengers is estimated at €51.4 million in 2018, indicating a 95%
increase, in comparison to 2016. According to estimates, the GVA from cruise tourism expenditure
generated by the sector in 2018 was €20.3 million, which represents a doubling of the contribution
of the industry to the Irish economy since 2016.
Figure 9: Passenger and Cruise Ship visits to Irish Ports (Number) 2010 –
2018
Source: IMDO
The international cruise industry remains one of the fastest growing travel markets in the world
and strong growth is continuing to be projected for the global cruise industry in the coming years.
However Dublin port has recently announced plans to reduce the number of berths available to
cruise ships from 160 in 2019 to 80 in 2021. The port has indicated that this is necessary in order to
generate increased berthing capacity for container traffic post Brexit. This decision could have major
implications for cruise liner tourism not just in Dublin but across all of Ireland. For some cruise ship
operators Dublin is the key destination on their Irish itinerary. The possible unavailability of Dublin
port as a destination could mean that booking agencies will move cruise trips from here to other EU
destinations. The Dublin port decision could have a significantly negative impact for cruise tourism
growth in the coming years.Ireland’s Ocean Economy 31
Marine Retail Services
Marine Retail Services consist of various small and medium sized enterprises dealing
with different marine retail services, including the sale of marine equipment, boat
sales, chandlery, and the retail of seafood in fishmonger shops. Table 11 illustrates
the turnover, GVA, and employment for 2014, 2016 and 2018 (estimated) as well as
the % change for each period. Figure 10 also indicates the trends for both turnover
and employment over the 2010-2018 period.
PROFILE
• Chandlery
• Boat sales
• Marine equipment sales
• Retail of seafood in fishmonger specialised stores
Table 11: Marine Retail Services turnover, GVA, employment, 2014, 2016 and 2018
2014-2016 2016-2018
Marine Retail Services 2014 2016 2018
(% change) (% change)
Turnover €000’s 152,626 159,019 167,029 4% 5%
GVA €000's 60,050 70,960 74,534 18% 5%
Employment FTEs 743 810 927 9% 14.5%
Marine Retail Services are located throughout Ireland, both
along the coast and inland, (the boat sales and seafood retail
Location of activity categories particularly relates to the latter). The majority of the
technology-related marine service companies are located within
the larger cities, primarily Galway, Cork and Dublin
Source: SEMRU Company Survey, CSO – Annual Services Inquiry (ASI) NACE Four-Digit Code 47.23; CSO – Retail Services
Inquiry; CSO – National Household Survey; Figures for turnover and GVA for 2018 are estimates.
The turnover generated by marine retail services in 2016 was €159 million. Total GVA generated was
€71 million. Turnover increased between 2014 and 2016 by 4%, with an 18% increase in GVA in the
same period. Employment in marine retail services was 810 FTES in 2016, which shows an increase
of 9% with respect to 2014. Estimates suggest that the turnover generated by the sector in 2018 was
€167 million, representing again an increase in activity of 5% between 2016 and 2018. Estimated GVA
and employment increased again by approximately 5% to €74 million and 7927 FTEs respectively in
the same period.
Figure 10 shows the trends in turnover and employment over the 2010-2018 period. Turnover and
employment have seen steady growth since 2010.32 Ireland’s Ocean Economy
Figure 10: Marine Retail Services turnover and employment trends, 2010 and
2012-2018
Source: SEMRU Company Survey, CSO – Annual Services Inquiry (ASI) NACE Four-Digit Code 47.23; CSO – Retail Services
Inquiry; CSO – National Household Survey; Figures for turnover and GVA for 2017 and 2018 are estimates.
The marine retail sector is subject to similar challenges and opportunities as the overall retail sector
in Ireland. According to Trading Economics, Ireland’s retail sales increased by 3.7% year on year, in
2018. This trend is expected to continue at a projected growth rate of around 2.5% until 2020. The
industry however remains vulnerable to movements in the sterling exchange rate on the back of
Brexit uncertainty, particularly in the area of boat sales and marine equipment sales.Ireland’s Ocean Economy 33
34 Ireland’s Ocean Economy

Sea Fisheries
Sea fisheries represent an important component of the ocean economy in Ireland
in terms of revenue and employment. According to the latest EU economic report
on the EU fishing fleet (STECF 18-07), the Irish fishing fleet was comprised of 1953
registered vessels, with a total capacity of 60.5 thousand Gross Tonnes (GT) in 2017.
Table 12 shows turnover, GVA, and employment levels for 2014, 2016 and 2018, as
well as the percentage changes between 2014 and 2016 and between 2016 and
2018.

Figure 11 presents the trends for turnover and employment in the sea fisheries sector over the period
2008-2018. Turnover in 2018 exceeded €315 million, whilst GVA was estimated at €173 million.
Turnover generated by the sector in 2016 was €304 million, representing a decrease in activity of
3% between 2014 and 2016. GVA also decreased by 2%, however employment increased by 6%. The
economic performance of sea fisheries improved in the following two years, with turnover, GVA and
employment increasing by 4%, 5% and 5% respectively, from 2016 to 2018.

   PROFILE
   Fishing Segments                          Main Target Species                      •   Cod
   •   Pelagic                               Fin Fish                                 •   Sole
   •   Polyvalent                            •    Mackerel                            •   Plaice
   •   Beam-trawl                            •    Herring                             Shellfish
   •   Specific                              •    Horse Mackerel                      •   Lobster
                                             •    Blue Whiting                        •   Dublin Bay prawns
                                             •    Monkfish                            •   Mussels
                                             •    Megrim                              •   Scallops
                                             •    Haddock                             •   Razor Clams
                                             •    Whiting

Table 12: Sea Fisheries turnover, GVA, employment, 2014, 2016 and 2018

                                                                                          2014-2016        2016-2018
 Sea Fisheries                                   2014         2016           2018
                                                                                          (% change)       (% change)
 Turnover €000’s                             311,900         303,670        315,390           -3%               4%
 GVA €000's                                  168,100         164,500        173,000           -2%               5%
 Employment FTEs                                 2,395        2,536          2,663             6%               5%
                                            Fishing communities are distributed around the coast of Ireland,
                                            centred particularly on the fishing harbours of Killybegs (Co.
 Location of activity                       Donegal), Ros an Mhil (Co. Galway), An Daingean (Co. Kerry),
                                            Castletownbere (Co. Cork), Dunmore East (Co. Waterford) and
                                            Howth (Co. Dublin).
Source: Bord Iascaigh Mhara (BIM); Scientific, Technical and Economic Committee for Fisheries (STECF) – The Annual
Economic Report on the EU Fishing Fleet, 2018
Ireland’s Ocean Economy 35
Growth in the sea fisheries sector and the wider seafood economy between 2016 and 2018 was
partially influenced by an increase in the price for key species such as nephrops, substantial
government investment in fishing ports and harbours with support directed through the European
Maritime and Fisheries Fund (EMFF) and private investment driven by changes in lending practices by
financial institutions and growing optimism in the catching sector.18
Brexit continues to cause concern in the industry. While transitional arrangements for fisheries have
been provisionally agreed between the UK and the EU in the draft withdrawal agreement, until the
negotiations actually conclude concerns remain surrounding access to fish in the UK zone, potential
loss of quota share and the potential increase in activity by other EU vessels in Irish waters.
Figure 11: Sea Fisheries turnover and employment trends, 2008 – 2018
Source: EU Scientific, Technical and Economic Committee for Fisheries (STECF) – The Economic Performance of the EU
Aquaculture Sector; Bord Iascaigh Mhara (BIM);
Fluctuations in quota share remain as always a key influence on the economic prospects of the fleet.
Quotas are determined at the December meeting of the Council of Ministers held in Brussels each
year. The 2019 Annual Fisheries Negotiations concluded with an overall increase of 30% in whitefish
quota for the Irish fleet. The quota for mackerel and nephrops, two of the top earning species for the
Irish fleet did however see a reduction in quota in certain areas.
An important policy development for the fishing sector in February 2019 was the launch of Ireland’s
first industry-led strategy for inshore fisheries which is aiming to maximise the economic potential
of the sector and support Ireland’s coastal communities. The Irish Inshore Fisheries Sector Strategy
2019-2023 sets out the vision for the future of the sector which comprises of small fishing vessels
(up to 12 metres overall length). The EU economic report on the EU fishing fleet (STECF 18-07)
indicates that there were 908 active vessels registered in the small-scale coastal fleet in 2016.
18
The Business of Seafood 2018. Bord Iascaigh Mhara. Available at: http://www.bim.ie/media/bim/content/publications/
corporate-other-publications/BIM-Business-of-Seafood-2018.pdf36 Ireland’s Ocean Economy
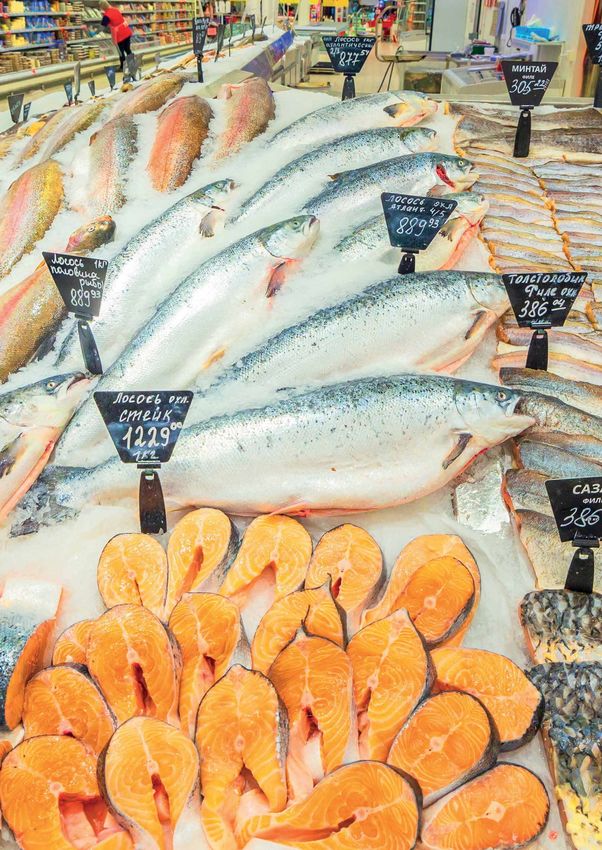
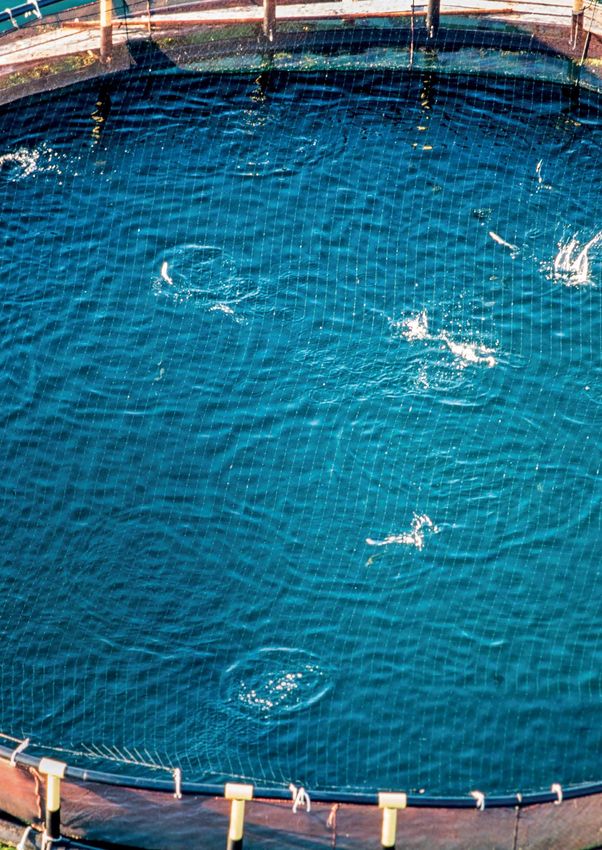
Marine Aquaculture
In 2018, the total production of the industry was 37,000 tonnes with 288 production
units engaged in the sector. Farmed shellfish and farmed finfish production
accounted for 65% and 35% of overall aquaculture production volume respectively.
Salmon continued to be the most valuable seafood export in 2018 with a total
produce of 12,200 tonnes, whilst the value of shellfish grew, mainly driven by the
high demand for shellfish in the Chinese market.19
Table 13 shows turnover, GVA, and employment for 2014, 2016 and 2018, as well as the percentage
changes between 2014 and 2016 and between 2016 and 2018. Figure 12 illustrates the trends for
both turnover and employment over the 2008-2018 period.
PROFILE
Finfish Shellfish • Gigas Oysters
• Salmon • Rope Mussels • Abalone
• Seawater Trout • Clams • Edulis Oysters
• Bottom Mussels • Sea Urchins
• Scallops
Table 13: Marine Aquaculture turnover, GVA, employment, 2014, 2016 and 2018
2014-2016 2016-2018
Marine Aquaculture 2014 2016 2018
(% change) (% change)
Turnover €000’s 116,299 167,166 176,000 44% 5%
GVA €000's 49,163 98,400 100,320 100% 2%
Employment FTEs 941 1,030 1,925 9.5% 87%
Shellfish aquaculture activities are widely distributed across the
coast of Ireland, with particular concentrations in Co. Donegal,
Connemara, Co. Galway, West Cork, Co. Waterford, Co.
Location of activity
Wexford, and Carlingford Lough, Co. Louth. Finfish aquaculture
is mainly restricted to the Western seaboard in counties Donegal,
Mayo, Galway, Kerry and Cork.
Source: Scientific, Technical and Economic Committee for Fisheries (STECF) Economic Report of EU aquaculture sector
(STECF-18-19); Bord Iascaigh Mhara (BIM) Aquaculture survey; BIM data on behalf of the JRC (European Joint Research
Centre).
The turnover generated by marine aquaculture in 2018 was estimated at €176 million. Total GVA
generated was estimated at more than €100 million. Although turnover increased between 2016 and
2018 by 5% with a smaller increase of 2% in GVA in the same period, aquaculture output fell post
2017, driven mainly by a reduction in finfish production. As can be seen from Table 13, the value of
19
The Business of Seafood 2018. Bord Iascaigh Mhara. Available at: http://www.bim.ie/media/bim/content/publications/
corporate-other-publications/BIM-Business-of-Seafood-2018.pdfYou can also read