2021 Economic Contribution Study of South Dakota Agriculture, Ethanol and Forestry - Prepared For: Prepared By
←
→
Page content transcription
If your browser does not render page correctly, please read the page content below
2021 Economic Contribution Study of South
 Dakota Agriculture, Ethanol and Forestry
                July 2021

                Prepared For:

                 Prepared By:

                     1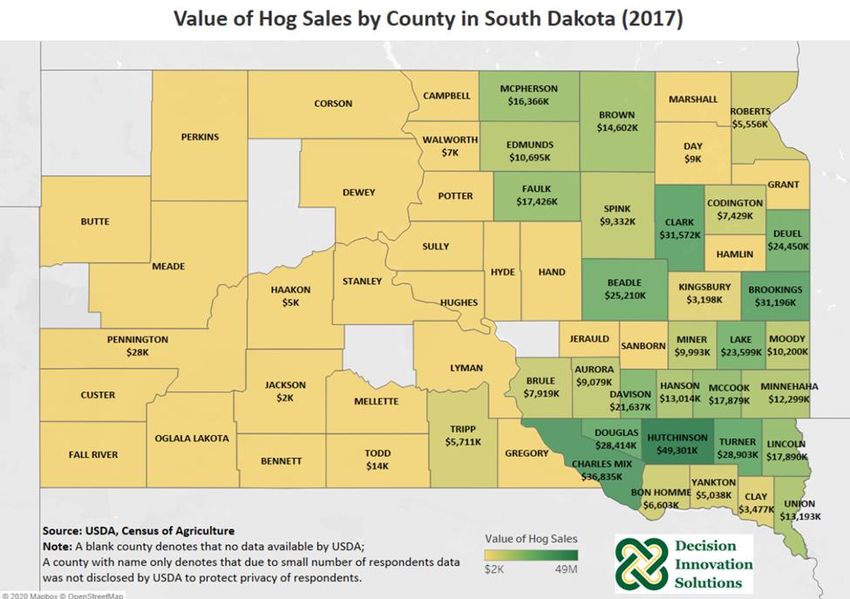
Contents
    Contents .................................................................................................................................................... 2
    List of Figures ............................................................................................................................................ 4
    List of Tables ............................................................................................................................................. 7
1      Executive Summary ................................................................................................................. 8
    Key Findings .............................................................................................................................................. 8
2      Background .............................................................................................................................. 9
    2.1        South Dakota Agriculture .............................................................................................................. 9
    2.2        South Dakota Cash Receipts ......................................................................................................... 9
    2.3        South Dakota Farm Demographics ............................................................................................. 11
    2.4        Forestry ....................................................................................................................................... 15
3      Economic Contribution Methodology ................................................................................... 16
    3.1        Defining Agriculture and Forestry ............................................................................................... 16
    3.2        Economic Impact Study versus Economic Contribution Study ................................................... 17
4      Economic Contribution Study Results ................................................................................... 17
    4.1        State Level Results ...................................................................................................................... 17
       4.1.1           State Value Added............................................................................................................... 18
       4.1.2           State Jobs ............................................................................................................................ 19
       4.1.3           State Output........................................................................................................................ 19
       4.1.4           State Household Income ..................................................................................................... 20
       4.1.5           Comparability to 2019 Report............................................................................................. 21
    4.2        Detailed Results .......................................................................................................................... 23
       4.2.1           Crops ................................................................................................................................... 23
       4.2.2           Livestock.............................................................................................................................. 24
       4.2.3           Other Agriculture ................................................................................................................ 26
    4.3        County Level Results ................................................................................................................... 27
       4.3.1           County Value Added ........................................................................................................... 27
       4.3.2           County Jobs ......................................................................................................................... 30
       4.3.3           County Output .................................................................................................................... 33
       4.3.4           County Household Income .................................................................................................. 35
       4.3.5           South Dakota Ethanol Industry Breakout ........................................................................... 36
5      Focus Industry Background and Economic Impact Studies ................................................... 39
    5.1        South Dakota Ethanol Industry ................................................................................................... 39

                                                                                2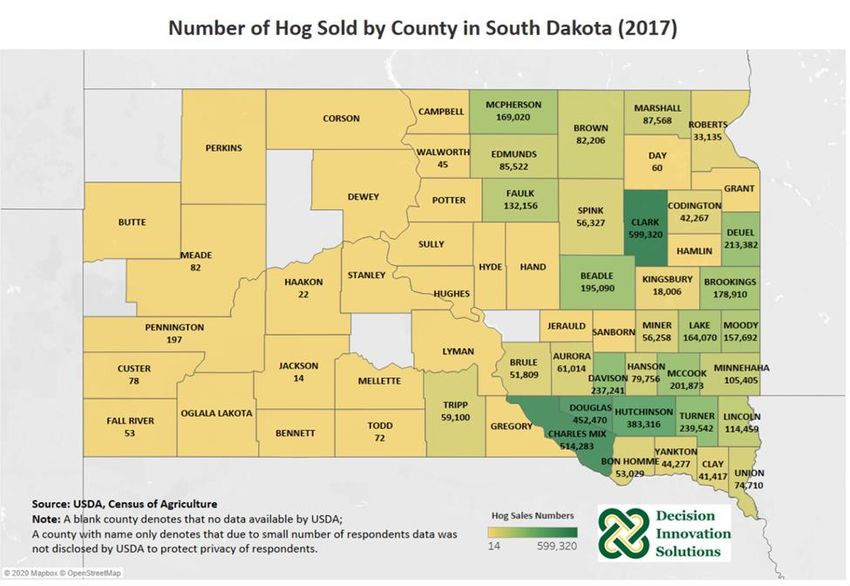
5.1.1        South Dakota Ethanol Production Capacity ........................................................................ 39
      5.1.2        South Dakota Ethanol Production....................................................................................... 39
      5.1.3        South Dakota Ethanol Gross Production Margin (Corn Crush Spread) ............................... 41
      5.1.4        South Dakota Ethanol Consumption ................................................................................... 44
    5.2     South Dakota Hog Industry ......................................................................................................... 45
      5.2.1        Hog Inventory Trend and Hog Inventory by Weight Category ........................................... 45
      5.2.2        South Dakota Hog Inventory and Farm Distribution .......................................................... 47
      5.2.3        Hog Farms by Type & Size ................................................................................................... 53
      5.2.4        Number of Hog Farms by Size; State Share of U.S. Hog Inventory by Size of Operation ... 56
      5.2.5        Hog Slaughter Facility Capacity ........................................................................................... 57
    5.3     South Dakota Dairy Industry ....................................................................................................... 59
      5.3.1        South Dakota Milk Cow Inventory Trend ............................................................................ 59
      5.3.2        South Dakota Milk Cow Inventory and Farm Distribution .................................................. 60
      5.3.3        South Dakota Dairy Farms per County ................................................................................ 63
      5.3.4        South Dakota Milk Production ............................................................................................ 66
    5.4     Farm Level Economic Impact Studies ......................................................................................... 69
      5.4.1        Economic Impact Study Methodology ................................................................................ 69
      5.4.2        Economic Impact Study– Wean to Finish Hog Farm ........................................................... 69
      5.4.3        Economic Impact Study – 5,000 Head Rotary Dairy Farm .................................................. 70
      5.4.4        Economic Impact Study – 1,600 Head Robotic Dairy Farm................................................. 71
6     Looking Ahead ....................................................................................................................... 73
    6.1     Forestry ....................................................................................................................................... 73
    6.2     Trends in Consumer Preferences ................................................................................................ 73
    6.3     Technology Use and Access ........................................................................................................ 73
    6.4     COVID-19 ..................................................................................................................................... 74
7     Conclusions ............................................................................................................................ 75
8     Appendix A, IMPLAN Aggregation Scheme ........................................................................... 76
    8.1     All Industries Aggregation Scheme ............................................................................................. 76
    8.2     Detailed Agriculture and Forestry Aggregation Scheme ............................................................ 84
9     Appendix B, Detailed County Level Results ........................................................................... 86
    9.1     Value Added ................................................................................................................................ 86
    9.2     Jobs ............................................................................................................................................. 91

                                                                             3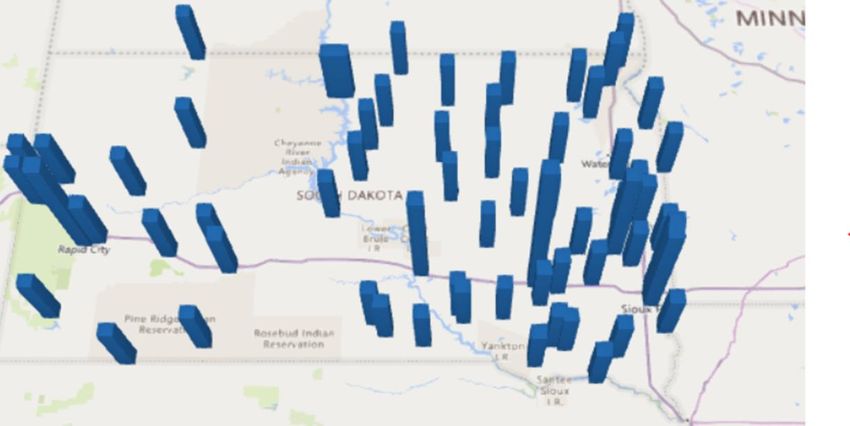
List of Figures
Figure 1. South Dakota Cash Receipts: Top Five Commodities (Billion Dollars, 2012-2020*) ..... 10
Figure 2. South Dakota Cash Receipts: Shares of State Cash Receipts from All Agricultural
Commodities ................................................................................................................................. 10
Figure 3. 2019 South Dakota Cash Receipts from Animals and Products .................................... 11
Figure 4. Number of South Dakota Farm Farms by Size (2017).................................................... 12
Figure 5. Number of South Dakota Farm Farms by Type (2017) .................................................. 12
Figure 6. South Dakota Principal Producers by Age Group (2017) ............................................... 13
Figure 7. Number of South Dakota Farms per Economic Class .................................................... 14
Figure 8. South Dakota Agriculture and Forestry Total Value Added........................................... 18
Figure 9. South Dakota Agriculture and Forestry Total Jobs ........................................................ 19
Figure 10. South Dakota Agriculture and Forestry Total Output.................................................. 20
Figure 11. South Dakota Agriculture & Forestry Household Income ........................................... 21
Figure 12. Economic Contribution of South Dakota’s Crop Industries - Value Added ................. 24
Figure 13. Economic Contribution of South Dakota’s Crop Industries – Jobs .............................. 24
Figure 14. Economic Contribution of South Dakota’s Livestock Industries - Value Added .......... 25
Figure 15. Economic Contribution of South Dakota’s Livestock Industries - Jobs........................ 25
Figure 16. Economic Contribution of South Dakota’s Other Agriculture Industries - Value Added
....................................................................................................................................................... 26
Figure 17. Economic Contribution of South Dakota’s Other Agriculture Industries – Jobs ......... 27
Figure 18. South Dakota Top 10 Counties, Value Added from Agriculture and Forestry Industries
....................................................................................................................................................... 28
Figure 19. South Dakota Top 10 Counties, Percent Value Added from Agriculture and Forestry
Industries ...................................................................................................................................... 28
Figure 20. Percent of Value Added Derived from Agriculture and Forestry Industries ............... 29
Figure 21. Value Added Derived from All Agriculture & Forestry (by County) ($M) .................... 29
Figure 22. Percent of Value Added Derived from All Agriculture & Forestry (by County) ........... 30
Figure 23. South Dakota Top 10 Counties, Jobs from Agriculture and Forestry Industries ......... 30
Figure 24. South Dakota Top 10 Counties, Percent of Jobs from Agriculture and Forestry
Industries ...................................................................................................................................... 31
Figure 25. Percent of Jobs Derived from Agriculture and Forestry Industries ............................. 31
Figure 26. Jobs Derived from Total Agriculture and Forestry (by County) ................................... 32
Figure 27. Percent of Jobs Derived from All Agriculture and Forestry (by County) ..................... 32
Figure 28. South Dakota Top 10 Counties, Output from Agriculture and Forestry Industries ..... 33
Figure 29. South Dakota Top 10 Counties, Percent of Output from Agriculture and Forestry
Industries ...................................................................................................................................... 33
Figure 30. Percent of Output Derived from Agriculture and Forestry Industries ........................ 34
Figure 31, Output Derived from All Agriculture & Forestry (by County) ($M) ............................. 34
Figure 32, Percent of Output Derived from All Agriculture & Forestry (by County) .................... 35

                                                                            4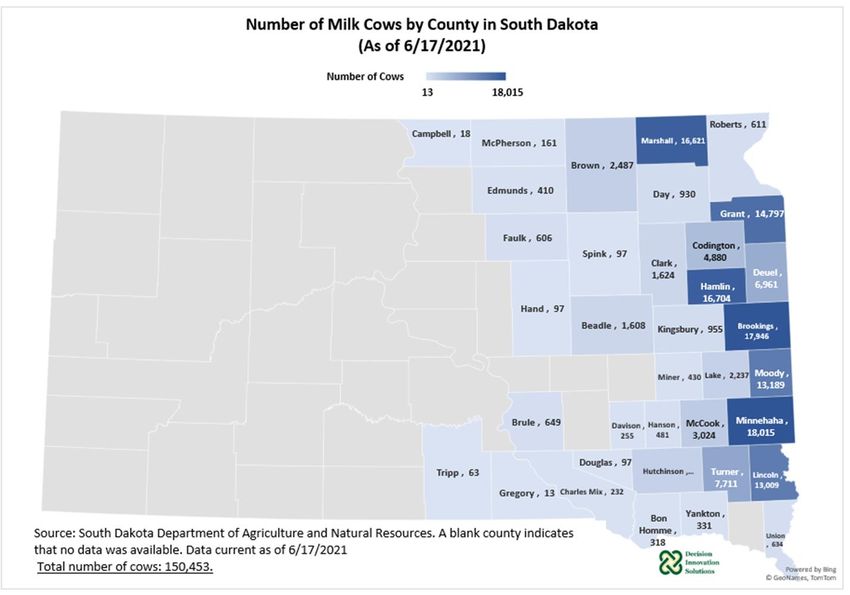
Figure 33. South Dakota Top 10 Counties, Household Income from Agriculture and Forestry
Industries ...................................................................................................................................... 35
Figure 34, South Dakota Top 10 Counties, Percent of Household Income from Agriculture and
Forestry Industries ........................................................................................................................ 36
Figure 35, South Dakota Counties, Value Added from Ethanol Industry ..................................... 37
Figure 36, South Dakota Counties, Percent of Total Value Added from Ethanol Industry .......... 37
Figure 37, South Dakota Counties, Jobs from Ethanol Industry ................................................... 38
Figure 38, South Dakota Counties, Percent of Total Jobs from Ethanol Industry ........................ 38
Figure 39. South Dakota Ethanol Production Capacity and Location ........................................... 39
Figure 40. South Dakota Ethanol Production and Share of U.S. Production ................................ 40
Figure 41. South Dakota Ethanol, DDGs, and DCO Sales Values per Bushel of Corn and Corn Cost
....................................................................................................................................................... 43
Figure 42. South Dakota Weekly Ethanol Production Margin (Corn Crush Spread) ($/Bushel) ... 43
Figure 43. South Dakota Ethanol Consumption by the Transportation Sector and Share of State
Ethanol Production ....................................................................................................................... 44
Figure 44. South Dakota Hog Inventory and Share of U.S. Hogs .................................................. 45
Figure 45. South Dakota Hog December 1 Inventory by Class ..................................................... 46
Figure 46. Top U.S. States by Total Hog Inventory (December 1, 2020, Head) ............................ 46
Figure 47. South Dakota Hog Inventory by Selected Size (End of December) ............................. 47
Figure 48. Share of South Dakota Hog Inventory by Selected Size of State Total Inventory (End of
December) .................................................................................................................................... 48
Figure 49. South Dakota Number of Farms with Hog Inventories by Selected Size (End of
December) .................................................................................................................................... 49
Figure 50. South Dakota Number of Farms with Hog Inventories by Selected Size (End of
December) .................................................................................................................................... 49
Figure 51. Number of Hog Farms by County in South Dakota (2017) .......................................... 50
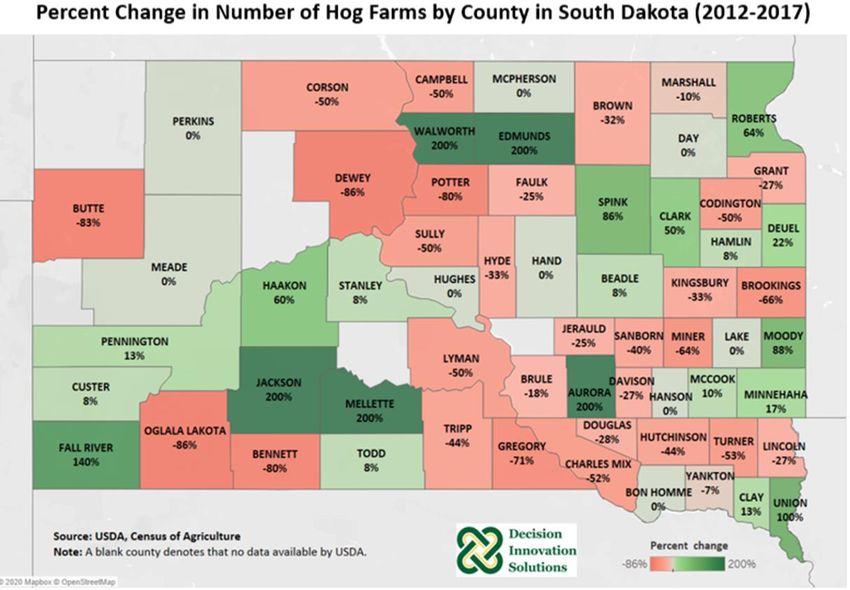
Figure 52. Percent Change in Number of Hog Farms by Country in South Dakota (2012-2017) . 51
Figure 53. Value of Hog Sales by County in South Dakota (2017) ................................................ 52
Figure 54. Number of Hog Sold by County in South Dakota (2017) ............................................. 53
Figure 55. South Dakota Hog Farms by Type & Size (Farrow to Feeder, 2017) ........................... 54
Figure 56. South Dakota Hog Farms by Type & Size (Farrow to Finish, 2017) ............................. 54
Figure 57. South Dakota Hog Farms by Type & Size (Farrow to Wean, 2017) ............................. 55
Figure 58. South Dakota Hog Farms by Type & Size (Independent Grower, 2017) ..................... 55
Figure 59. South Dakota Hog Farms by Type & Size (Nursery Farms, 2017) ................................ 56
Figure 60. South Dakota Number of Hog Farms by Size (1997-2017) .......................................... 57
Figure 61. South Dakota State-Inspected and Custom Livestock Slaughter (2020) ..................... 58
Figure 62. South Dakota Milk Cow Inventory and Share of U.S. Milk Cow Inventory .................. 59
Figure 63. Milk Cow Inventory, Selected States (January 1) ........................................................ 60
Figure 64. South Dakota Milk Cow Inventory by Selected Size (End of December) ..................... 61
5
Figure 65. South Dakota Milk Cow Inventory by Selected Size as a share of State Total Milk Cow
Inventories (End of December) ..................................................................................................... 61
Figure 66. South Dakota Number of Farms with Milk Cow Inventory by Selected Size (End of
December) .................................................................................................................................... 62
Figure 67. South Dakota Number of Farms with Milk Cow Inventory by Selected Size as a Share
of South Dakota Total Dairy Farms (End of December)................................................................ 63
Figure 68. Number of Dairy Farms by County in South Dakota (As of 6/17/2021) ...................... 64
Figure 69. Number of Milk Cows by County in South Dakota (As of 6/17/2021) ......................... 65
Figure 70. Value of Milk Sales by County in South Dakota (2017, Million USD) .......................... 66
Figure 71. South Dakota Annual Milk Production and Share of U.S. Production (2000- 2020) ... 67
Figure 72. South Dakota Annual Milk Production per Cow (2000- 2020) .................................... 67
Figure 73. South Dakota Cheese Production ................................................................................ 68
Figure 74. Forest Land, South Dakota, 2016 ................................................................................. 73
Figure 75. Agriculture, Forestry, and Related Industries Share of South Dakota's Total ............. 75
Figure 76. Value Added Derived from Crops (by County) ($M) .................................................... 86
Figure 77. Percent of Value Added Derived from Crops (by County) ........................................... 86
Figure 78. Value Added Derived from Forestry (by County) ($M) ................................................ 87
Figure 79. Percent of Value Added Derived from Forestry (by County) ....................................... 87
Figure 80. Value Added Derived from Livestock (by County) ($M) .............................................. 88
Figure 81. Percent of Value Added Derived from Livestock (by County) ..................................... 88
Figure 82. Value Added Derived from Other Agriculture (by County) ($M) ................................. 89
Figure 83. Percent of Value Added Derived from Other Agriculture (by County) ........................ 89
Figure 84, Value Added Derived from All Agriculture (by County) ............................................... 90
Figure 85, Percent of Value Added Derived from All Agriculture (by County) ............................. 90
Figure 86. Jobs Derived from Crops (by County) .......................................................................... 91
Figure 87. Percent of Jobs Derived from Crops (by County) ........................................................ 91
Figure 88. Jobs Derived from Forestry (by County) ...................................................................... 92
Figure 89. Percent of Jobs Derived from Forestry (by County) .................................................... 92
Figure 90. Jobs Derived from Livestock (by County) .................................................................... 93
Figure 91. Percent of Jobs Derived from Livestock (by County) ................................................... 93
Figure 92. Jobs Derived from Processing and Other Agriculture (by County) .............................. 94
Figure 93, Percent of Jobs Derived from Processing and Other Agriculture (by County) ............ 94
Figure 94, Jobs Derived from All Agriculture (by County) ............................................................ 95
Figure 95, Percent of Jobs Derived from All Agriculture (by County) ........................................... 95

                                                                       6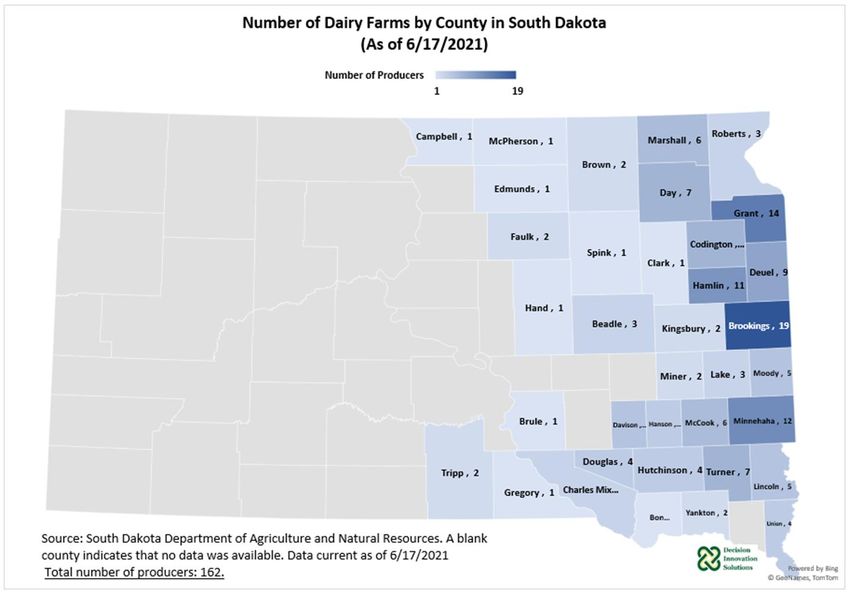
List of Tables
Table 1. Selected Historical South Dakota USDA Census of Agriculture Data .............................. 14
Table 2. Selected South Dakota Farm Sales by Source ................................................................. 15
Table 3. South Dakota Forestry Acres ........................................................................................... 15
Table 4, Comparison to 2019 Economic Contribution Study........................................................ 21
Table 5, Commodity Prices, 2017 and 2019 Marketing Years ...................................................... 22
Table 6, South Dakota Crop Production, 2017 and 2019 ............................................................. 22
Table 7, South Dakota Commodity Sales, 2017 and 2019 ............................................................ 23
Table 8. South Dakota Weekly Ethanol and Co-Products Sales Values per Bushel of Corn, Corn
Cost, and Gross Production Margin in Mid-April 2017-2021 ....................................................... 42
Table 9. South Dakota Hog Inventory Share of U.S. Hog Inventory by Size of Farm (1997, 2002,
2012, 2017) ................................................................................................................................... 57
Table 10. Total Impact Results, Construction Impact of New Wean to Finish Hog Farm............. 70
Table 11. Total Impact Results, Operations for First Year Impact of New Wean to Finish Hog
Farm .............................................................................................................................................. 70
Table 12. Total Impact Results, Construction Impact of New Rotary Dairy Farm ........................ 71
Table 13. Total Impact Results, Operations for First Year Impact of New Rotary Dairy Farm ..... 71
Table 14, Total Impact Results, Construction Impact of New Robotic Dairy Farm ...................... 72
Table 15, Total Impact Results, Farms for First Year Impact of New Robotic Dairy Farm ............ 72

                                                                          7
1 Executive Summary
The results of this study indicate that although there have been challenging times in agriculture,
forestry, and related industries, they are still a significant part of South Dakota’s economy, supporting
about 1 in every 5 jobs across South Dakota.
This study is based on a combination of the USDA 2017 Census of Agriculture, USDA/NASS datasets, and
the IMPLAN modeling system and data (2019). This analysis is patterned after other Agriculture and
Forestry Economic Contribution Studies completed by Decision Innovation Solutions (DIS) for the states
of Alabama, Illinois, Iowa, Missouri, and Minnesota.

Key Findings1
In 2021, agriculture, forestry, and related industries in South Dakota are estimated to contribute:
     •    $11.7 billion in total value added
     •    129,753 jobs
     •    $32.1 billion in output (sales)
     •    $11.6 billion in household income

Of the $11.7 billion in total value added and 129,753 jobs from agriculture, agri-food, forestry, and
related economic activity:
    • Crop production and related industries contributed:
            o $3.3 billion in value added
            o 30,817 jobs
    • Livestock production and related industries contributed:
            o $5.6 billion in value added
            o 64,459 jobs
    • Other agriculture industries contributed:
            o $2.0 billion in value added
            o 23,983 jobs
    • Forestry production and related industries contributed:
            o $860 million in value added
            o 10,493 jobs

1
 For additional visualizations of the data please view https://tinyurl.com/2021-SD-AFECS. Dollar denominated 2019 IMPLAN results have been
adjusted to 2021 values.

                                                                    8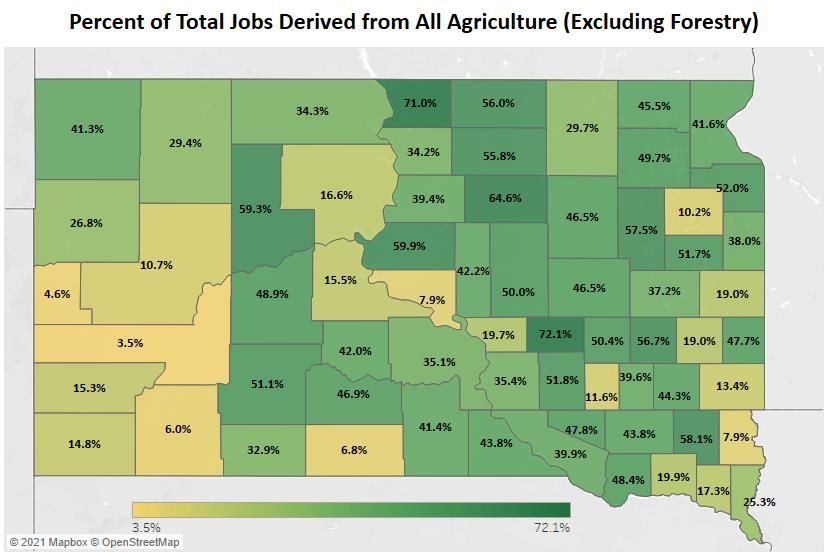
2 Background
This South Dakota Agriculture Economic Contribution Study quantifies agriculture and its related
industries’ contribution to the economy. This study relies heavily on the 2019 data from the IMPLAN
modeling system, the USDA 2017 Census of Agriculture, and other USDA/NASS datasets. This study is
patterned after similar studies completed by DIS for Iowa in 2009, 2014, and 2019, South Dakota in 2014
and 2019, Illinois in 2015 and 2019, Missouri in 2016, Alabama in 2016 and Minnesota in 2020.

2.1 South Dakota Agriculture
As of 2020, South Dakota was ranked among the top five states in the nation for2:

    •   Bison (#1) (2017)                                         •    Beef Cows (#5)
    •   Oats (#1)                                                 •    Calf Crop (#5)
    •   Honey (#2)                                                •    Alfalfa Hay Production (#5)
    •   Sunflower Production (#2)                                 •    Lamb Crop (#5)
    •   Sunflower for Oil Production (#2)                         •    Land in Farms (#5)
    •   Proso Millet Production (#3)                              •    Safflower Production (#5)
    •   Sorghum for Silage Production (#3)                        •    Spring Wheat Production (#5)
    •   Sorghum for Grain Production (#4)                         •    Wool Production (#5)

According to the same 2020 data above from the USDA National Statistics Service, South Dakota is
currently ranked among the top ten states for:

    •   Dry Edible Pea Production                                 •    Principle Crops Harvested
    •   Sheep and Lamb Inventory                                  •    Total Cropland Acres (2017)
    •   Sheep and Lamb Market Inventory                           •    Pig Crop
    •   Cattle and Calves Inventory                               •    Principle Crops Planted
    •   Cattle on Feed Inventory                                  •    Soybean Production
    •   Corn for Grain Production                                 •    Wheat Production (All)
    •   Corn for Silage Production                                •    Off Farm Grain Storage Capacity
    •   On Farm Grain Storage Capacity                            •    Winter Wheat Production
    •   Hay Production (All)

The rankings above show South Dakota’s ability to be a leading producer of various crops and livestock
and demonstrate the importance of South Dakota to help feed, clothe, and fuel those beyond South
Dakota and the U.S.

2.2 South Dakota Cash Receipts3
Cattle & calves, corn, soybeans, hogs, and dairy products are the top five South Dakota agricultural
commodities in terms of agricultural cash generated (see Figure 1). In 2019, cattle receipts were $2.73

2
  https://www.nass.usda.gov/Statistics_by_State/South_Dakota/Publications/Economic_Releases/Rank/SD-
rank21.pdf
3
  Note to this section: State agricultural cash receipts for 2020 have not yet been published by USDA; therefore,
calendar year 2020 cash receipts for the commodities presented in this section for South Dakota were estimated

                                                         9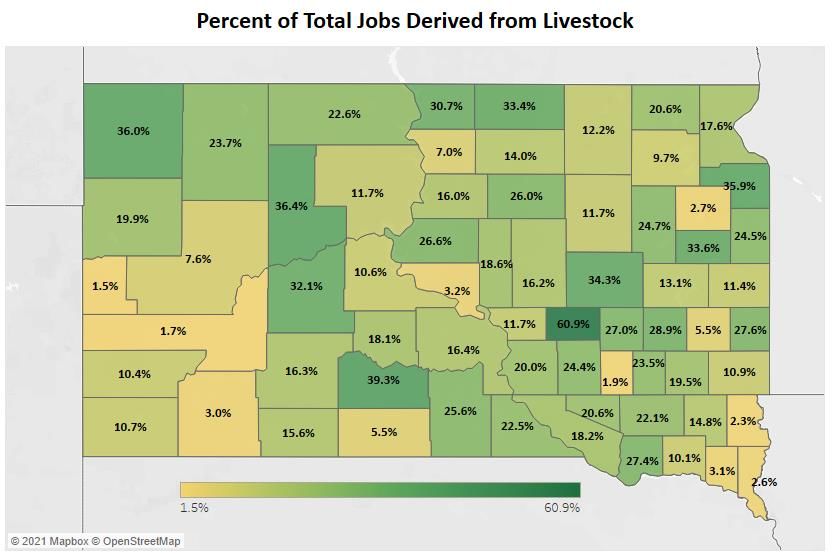
billion, followed by corn receipts of $2.14 billion, soybean receipts of $1.64 billion, hog receipts of $730
million, and dairy product receipts of $563 million.

Figure 1. South Dakota Cash Receipts: Top Five Commodities (Billion Dollars, 2012-2020*)

Figure 2. South Dakota Cash Receipts: Shares of State Cash Receipts from All Agricultural Commodities

2019 hog sales represented 8.2% of cash receipts from all South Dakota agricultural commodities ($8.95
billion) and 16.9% of total sales from all animals and animal products. Hog cash receipts in South Dakota
were up 24.9% from 2018. The value of hog sales in South Dakota in 2020 is estimated to be down to

by using the state five-year average share of U.S. cash receipts for the corresponding commodities and applied
those shares to USDA 2020 cash receipts for each of those commodities.

                                                            10
$556.1 million from 2019. The 2020 share of hog sales would be about 6.1% of all agricultural
commodities in the state (see Figure 2).
Cash receipts from dairy products are the fifth largest source of agricultural income in South Dakota. In
2019, cash receipts from dairy products reached a total of $563 million and represented 6.3% of all cash
receipts from agricultural commodities ($8.95 billion) in the state and 13.0% of total sales from all
animals and products ($4.32 billion), making dairy products cash receipts the third largest component of
the state’s animals and products cash receipts after cattle & calves and hogs cash receipts (see Figure 3).
South Dakota 2019 cash receipts from dairy products grew 21% year-over-year (see Figure 3) from 2018.
The value of dairy products in South Dakota in 2020 was estimated at $530 million (see Figure 2). Note
that South Dakota dairy cash receipts might be underestimated considering that both the state share of
milk production and the state share of cheese production relative to the U.S. production of these two
products increased in 2020 relative to 2019, and that the value of 2020 U.S. dairy cash receipts
increased 0.3% from the previous year.
Figure 3. 2019 South Dakota Cash Receipts from Animals and Products
2.3 South Dakota Farm Demographics
The Census of Agriculture defines a ‘farm’ as any operation that produces for sale at least $1,000 worth
of agricultural commodities or would produce $1,000 worth of primary agricultural commodities for sale
11in a normal year. The definition is based on expected sales rather than ownership or various operating
characteristics.
Figure 4 displays the breakdown of South Dakota farms by size, according to the 2017 Census of
Agriculture. The smaller size farms are generally hobby or specialty farms, while the farm farms larger in
size typically make up the majority of farm sales. There are 5,847 farms in South Dakota in the largest
size category of 2,000 or more acres.
Figure 4. Number of South Dakota Farm Farms by Size (2017)4
According to the 2017 Census of Agriculture (see Figure 5), of the 29,968 farms in South Dakota, 83% of
farms are owned by families or individuals, 8% are in partnerships, and 6% are in family held
corporations. Only 1% are in corporations that are non-family held.
Figure 5. Number of South Dakota Farm Farms by Type (2017)
There are 39,136 principal producers in South Dakota (see Figure 6). 63% of the principal5 producers are
age 55 and older, with only 1% under age 25, 8% between the ages of 25 and 34, 12% from 35-44, and
4
https://quickstats.nass.usda.gov
5
Principal producers are the primary decision makers for each farm operation.
1217% from 45-54 years. Of the 39,136 principal producers in South Dakota, about 56% of them consider
farming their primary occupation, while the other 44% have another job as their primary occupation.
Figure 6. South Dakota Principal Producers by Age Group (2017)
According to 2020 survey data (see Figure 7), total number of South Dakota farms is at 29,600 – a
decrease of 368 since the 2017 census. Along with this, the distribution of economic classes across these
farms has changed vastly during the 2002-2020 time period. There has been a decrease in the number
of farms within or below the $100,000 to $249,999 economic class: The $1,000 to $9,999 economic class
has decreased by 21%, the $10,000 to $99,999 economic class has decreased by 27%, and the $100,000
to $249,999 economic class has decreased by 29%. On the other hand, there has been an increase in the
number of farms within or above the $250,000 to $499,999 economic class: The $250,000 to $499,999
economic class has increased by 46%, the $500,000 to $999,999 economic class has increased by 100%,
and the number of farms within the $1,000,000 or more economic class has increased from zero to
2,300.
13Figure 7. Number of South Dakota Farms per Economic Class6
The average South Dakota farm size in 2017 was 1,443 acres, which is up from 1,330 acres in 1997, and
well above the U.S. average of 441 acres. The 2017 average market value of all machinery and
equipment per farm is $282,162, which is a 163% increase from the value of $107,376 in 1997.
Additionally, the average market value of land and buildings per farm in 2017 was $2,984,426, which is
nearly four times greater than the average value in 2002.
Table 1. Selected Historical South Dakota USDA Census of Agriculture Data
Historical South Dakota USDA Census of Agriculture Data 2017 2012 2007 2002
Number of South Dakota Farms 29,968 31,989 31,169 31,736
Average South Dakota Farm Size 1,443 1,352 1,401 1,380
Market Value ($ Per Farm)
Land and Buildings $ 2,984,426 $ 2,281,026 $ 1,255,332 $ 618,651
Machinery and Buildings $ 282,162 $ 241,388 $ 155,652 $ 107,376
Farm Products Sold $ 324,397 $ 317,929 $ 210,801 $ 120,829
Livestock Inventory (head)
Cattle and Calves $ 3,988,183 $ 3,893,251 $ 3,687,728 $ 3,695,877
Beef Cows $ 1,799,801 $ 1,610,559 $ 1,649,492 $ 1,694,091
Milk Cows $ 127,325 $ 91,831 $ 86,243 $ 84,080
Hogs and Pigs $ 1,560,522 $ 1,191,162 $ 1,490,034 $ 1,375,506
Laying Chickens $ 2,708,331 $ 2,450,780 $ 2,920,799 $ 2,226,368
Broiler Chickens $ 146,197 $ 144,015 $ 272,986 $ 321,260
Cattle and Calves Sold $ 2,752,025 $ 2,567,027 $ 2,745,227 $ 2,707,872
Hogs and Pigs Sold $ 5,359,357 $ 3,914,312 $ 4,487,708 $ 3,773,503
Production (bushels)
Corn for Grain $ 768,250,076 $ 480,330,680 $ 518,552,101 $ 295,166,830
Wheat for Grain $ 45,137,278 $ 100,675,153 $ 141,003,068 $ 42,413,607
Oats for Grain $ 4,474,218 $ 4,525,084 $ 8,758,284 $ 5,717,330
Soybeans $ 240,114,687 $ 130,534,273 $ 130,377,538 $ 126,607,265
6
https://quickstats.nass.usda.gov
14The grains and oilseeds category, along with cattle production, make up the majority of farm sales for
primary agricultural commodities. Table 2 shows that all crops (including nursery and greenhouse crops)
were estimated to comprise about 53.1% of total farm sales in 2017, while “Livestock, Poultry, and their
Products” comprised 46.9% in 2017.
Table 2. Selected South Dakota Farm Sales by Source7
% of 2017 % of 2012 % of 2007 % of 2002
South Dakota Farm Sales by Source 2017 2012 2007 2002
Total Total Total Total
Total Sales ($1000) $ 9,721,522 100.0% $ 10,170,227 100.0% $ 6,570,450 100.0% $ 3,834,625 100.0%
Average Per Farm $ 324,397 $ 317,929 $ 210,801 $ 120,829
Crops, including nursery and greenhouse crops $ 5,166,557 53.1% $ 6,072,922 59.7% $ 3,383,497 51.5% $ 1,575,910 41.1%
Corn ($1000) $ 2,383,397 24.5% $ 3,063,457 30.1% $ 1,412,488 21.5% N/A N/A
Wheat ($1000) $ 219,026 2.3% $ 755,870 7.4% $ 713,110 10.9% N/A N/A
Soybeans ($1000) $ 2,126,083 21.9% $ 1,692,677 16.6% $ 949,942 14.5% N/A N/A
Sorghum ($1000) $ 49,319 0.5% $ 39,738 0.4% $ 19,786 0.3% N/A N/A
Barley ($1000) $ 2,020 0.0% $ 3,844 0.0% $ 3,795 0.1% N/A N/A
Other ($1000) $ 386,712 4.0% $ 517,336 5.1% $ 284,376 4.3% N/A N/A
Livestock, Poultry, and Their Products ($1000) $ 4,554,966 46.9% $ 4,097,304 40.3% $ 3,186,953 48.5% $ 2,258,715 58.9%
Poultry and Eggs ($1000) $ 166,997 1.7% $ 182,076 1.8% $ 140,798 2.1% $ 70,820 1.8%
Cattle and Calves ($1000) $ 3,191,493 32.8% $ 2,968,996 29.2% $ 2,307,618 35.1% $ 1,693,838 44.2%
Milk and Other Dairy Products from Cows ($1000) $ 495,112 5.1% $ 374,490 3.7% $ 279,765 4.3% $ 156,498 4.1%
Hogs and Pigs ($1000) $ 577,034 5.9% $ 446,756 4.4% $ 381,360 5.8% $ 227,794 5.9%
Sheep, Goats, and Their Products ($1000) $ 41,972 0.4% $ 43,636 0.4% $ 36,697 0.6% $ 31,285 0.8%
Other Animals and Their Products ($1000) $ 82,358 0.8% $ 81,350 0.8% $ 40,715 0.6% $ 78,480 2.0%
2.4 Forestry
According to the most recent (2017) USDA Forest Resources of the United States report8, forest land is
estimated to make up about 4% (nearly 2 million acres) of South Dakota’s land area. About 60% of the
estimated forest land in South Dakota is publicly held, while the other 40% is privately held. South
Dakota saw a very slight increase in forest land from 2012, increasing from an estimated 1.911 million
acres in 2012 to 1.949 million acres in 2017. Since 1997 there has been a 19% increase in total forest
land.
Table 3. South Dakota Forestry Acres9
Land Area (thousand acres)
Total Land Area 48,519
Total Forest Land 1,949
Total Timberland 1,799
Timberland - Planted 36
Timberland - Natural Origin 1,763
Forest Land - Reserved 47
Forest Land - Other 103
Other Land 46,570
7
https://quickstats.nass.usda.gov
8
https://www.fs.fed.us/research/publications/gtr/gtr_wo97.pdf (pg. 72)
9
https://www.fs.fed.us/research/publications/gtr/gtr_wo97.pdf (pg. 72)
153 Economic Contribution Methodology
The 2021 Economic Contribution Study of South Dakota Agriculture, Ethanol and Forestry was
completed with a combination of the 2019 South Dakota IMPLAN dataset, data from the USDA 2017
Census of Agriculture and other USDA/National Agricultural Statistics Service (USDA/NASS) sources. The
IMPLAN modeling system and Microsoft Excel were used for calculating and tabulating the results of this
analysis. Results, shown as 2020 values throughout this report, are presented using these common
economic modeling terms:
• Value Added
o Sales (output) minus the cost of inputs. Value Added is a component Output.
• Sales (Output)
o The broadest measure of economic activity – sometimes referred to as “output”.
Includes Value Added, which in turn includes Household Income.
• Employment (Jobs)
o A measure of job positions without regard to whether they are full-time equivalents
• Household Income
o Income from all sources that accrues to individuals as payment for personal
employment (earnings or labor income), payment for ownership interests or capital
provision (dividends, interest and rents), or as transfer payments (payments to
individuals for which nothing is offered in return). Household income is a component of
Value Added.
3.1 Defining Agriculture and Forestry
When completing an economic contribution study, there are generally questions as to what economic
activity up and down the value chain should be included for a particular industry. Outlined below is the
process used in this study for defining agriculture, and the same guidelines have been applied to the
forestry industry.
There is usually considerable discussion regarding the blurred lines between production agriculture,
processing and retail, and how agriculture should be defined. Agriculture can be defined as: 1) including
only farm-level production, 2) including farm-level production, input manufacturing, and food
processing, or 3) from the “farm to fork” perspective, which would also include distribution, restaurants
and retail.
To strike middle (and defensible) ground between including more than just farm level production and
seeking to attribute excess economic activity to the agriculture industry, this analysis includes
production agriculture plus the first round of value added to the process. For example, in addition to the
production of livestock and poultry, we have also included the industries that process them (i.e.,
production, processing, slaughtering, and rendering). As mentioned, we have followed this same pattern
of analyzing other agricultural industries (e.g., crops), forestry production and further processing
(sawmills, etc.)
Using the above rationale as a guide, the IMPLAN models were created and analyzed using the
recommended methodology for a Multi-Industry Contribution Analysis. The IMPLAN modeling system
16uses more than 20,000 industries and classifies them according to the North American Industry
Classification System (NAICS) and groups them into 546 industries. There were 103 IMPLAN sectors
identified for this analysis to represent agriculture, forestry and related economic activities in the State
of South Dakota (see Appendix A, IMPLAN Aggregation Scheme).
3.2 Economic Impact Study versus Economic Contribution Study
The term “Economic Impact Study” implies a change has taken place within a local economy. The change
in a local economy typically comes from one of the following sources:
• Entrance/departure of a new business or industry
• Expansion/contraction of an existing business or industry
While estimating a change (economic impact study) such as the entrance or departure of industry
activity is a worthwhile endeavor in many instances, this is not how the contribution of the agriculture
and forestry sectors in this analysis were estimated. This analysis is an effort to evaluate the structure of
existing industries within an existing economy. As a result, shocking the economy to create or eliminate
parts of the industry is not appropriate. For that reason, this study is called an “economic contribution
analysis”; in other words, we are interested in understanding what South Dakota agriculture currently
contributes to the overall economy. This is a key difference from what is traditionally termed an
“economic impact study”. With a contribution analysis, the sum of individual industry estimates will
never differ from the total of what actually exists in a given study area.
4 Economic Contribution Study Results10
4.1 State Level Results
The 103 IMPLAN sectors identified for this study were aggregated into four main categories to provide
an overview of the economic contribution of these industries. These aggregated industries are:
• Crops
• Livestock
• Other Agriculture
• Forestry
Further details on the industries included in each of these categories are shown in the ‘Detailed Results’
section of the report and also in Appendix A, IMPLAN Aggregation Scheme.
10
For additional, customized visualization of the results please visit https://tinyurl.com/2021-SD-AFECS .
174.1.1 State Value Added
Total value added refers to the portion of total sales that actually created additional value from the
economic activity in an area and/or industry and is an accurate indicator of the ability of an industry to
improve economic prospects in a given area. Total value added for an industry represents the value of
the industry’s total sales minus the value of any inputs used in the production process from other
industries. Key components of value added are employee compensation (hired labor) and proprietor’s
income (self-employed), which is collectively known as ‘household income’.
Figure 8 shows the value added contribution of South Dakota broken out by industry. The agriculture
and forestry industries and related economic activity add a significant contribution to the South Dakota
economy with about $11.711 billion in value added, which is 21% of the state’s total value added. Of this
amount, $3.3 billion (6%) from Crops, $5.6 billion (10%) comes from Livestock, $2 billion (4%) from
Other Agriculture, and $860 million (2%) from Forestry.
Figure 8. South Dakota Agriculture and Forestry Total Value Added
11
Totals throughout the report may not sum due to rounding.
184.1.2 State Jobs
Job numbers represent an estimate of the number of positions (jobs) currently filled in an area or
industry. The estimates provided here originate from the state level IMPLAN input-output model. Jobs
include positions whether they are full or part-time, so care must be used in making comparisons. “Jobs”
does not count positions that are unfilled.
As shown in Figure 9, South Dakota’s agriculture and forestry industries and related economic activities
contribute a large number of jobs to the economy with nearly 130,000 jobs, which amounts to more
than 1 in 5 of the state’s total jobs. Of this amount, 30,817 from Crops, 64,459 jobs come from Livestock,
23,983 from Other Agriculture, and 10,493 from Forestry.
Figure 9. South Dakota Agriculture and Forestry Total Jobs
4.1.3 State Output
Total output (sales) refers to the total value of all production or sales of the identified industries within a
study area. This is a total number that does not make deductions for the cost or origination of inputs
that were used in the production process, which means that there is some double counting that occurs
with this measure of economic activity.
Figure 10 illustrates the contribution of all industries to South Dakota’s economy. As shown, South
Dakota’s agriculture and forestry industries and related economic activities are the largest contributor
to the state economy with more than $32 billion in total output, which is approximately 29% of the
state’s total output. Of this amount, $7.9 billion (7%) from Crops, $16.1 billion (15%) comes from
Livestock, $6.0 billion (5%) from Other Agriculture, and $2.1 billion (2%) from Forestry. Other major
19contributors include the manufacturing, financial, and services industries, contributing 15%, 13%, and
12% of total output, respectively.
Figure 10. South Dakota Agriculture and Forestry Total Output
4.1.4 State Household Income
Household income is defined as income from all sources that accrues to individuals as payment for
personal employment (earnings or labor income), payment for ownership interests or capital provision
(dividends, interest and rents), or as transfer payments (payments to individuals for which nothing is
offered in return).
Figure 11 illustrates the contribution of each industry to South Dakota’s total household income. As
shown, South Dakota’s agriculture and forestry industries and related economic activities contribute
about $11.6 billion in household income to the economy. Of this amount, $3.3 billion from Crops, $5.3
billion comes from Livestock, $2.1 billion from Other Agriculture, and $850 million from Forestry.
20Figure 11. South Dakota Agriculture & Forestry Household Income
4.1.5 Comparability to 2019 Report
Given that Decision Innovation Solutions completed a similar economic contribution study in 201912,
readers will naturally want to compare results from this analysis to the prior one. A comparison of the
top-level results can be seen in the table below.
Table 4, Comparison to 2019 Economic Contribution Study
2019 Study 2021 Study
Value Added $11.2 Billion $11.7 Billion
Jobs 132,105 129,753
Output $32.5 Billion $32.1 Billion
It is important to note that the results of the two studies are not exactly comparable, particularly at a
more detailed level. The 2019 study includes some forestry sectors in the crops category. In this study,
forestry has been made into its own category, and some additional forestry-related sectors have been
included. The result is that while the total figures presented in this report are slightly larger than they
would be if the 2019 study’s aggregation scheme were used, it is also not appropriate to compare the
results after discarding the forestry results from this study. The 2017 IMPLAN data (used in the 2019
study) uses a 536-sector scheme, while the 2019 IMPLAN data (used in this study) uses a 546-sector
12
http://www.decision-innovation.com/webres/File/2019_FinalSD_AECS.pdf
21scheme. However, the agriculture, forestry, and related industries analyzed in the two studies were not
directly affected by this change.
To the extent that the results can be compared, the value added contribution from agriculture, forestry,
and related industries increased, while the jobs and output contribution of these industries slightly
decreased. There are many possible explanations for these results; some of the more likely causes are
discussed here.
There was a significant decrease in crop and livestock prices between 2017 (the data year for the 2019
study) and 2019 (the data year for this study). As shown in Table 5, only corn saw a price increase
between these two years. Meanwhile, the price of soybeans decreased by 8%, the price of wheat
decreased by 18%, and livestock prices also saw a significant drop.
Table 5, Commodity Prices, 2017 and 2019 Marketing Years13
2017 Marketing Year 2019 Marketing Year Percent Change
Wheat ($/bu.) $ 5.52 $ 4.53 (17.9%)
Corn, Grain ($/bu.) $ 3.09 $ 3.32 7.4%
Soybeans ($/bu.) $ 8.94 $ 8.22 (8.1%)
Cattle, Cows ($/cwt) $ 69.10 $ 62.00 (10.3%)
Cattle, Calves ($/cwt) $ 168 $ 159 (5.4%)
Hogs ($/cwt) $ 53.1 $ 51.4 (3.2%)
In addition to prices being lower, crop production was also down overall from 2017 to 2019. Corn
production in South Dakota decreased by 180,000 bushels, and soybean production decreased by nearly
100,000 bushels, which can be seen in Table 6 below. While wheat production did increase, this increase
was small in absolute terms compared to the decrease in the other two major crops.
Table 6, South Dakota Crop Production, 2017 and 201914
Production
2017 2019 Change
(1,000 bu.)
Wheat 41,678 65,410 23,732
Corn,
736,600 557,280 (179,320)
Grain
Soybeans 241,230 146,200 (95,030)
Combining the above facts, the result is that overall sales were lower in 2019 than in 2017. As shown in
Table 7, of the five commodities listed, only sales for wheat and hogs were higher in 2019. Cattle, corn,
and soybean sales were all significantly lower in 2019 than in 2017. Since output in IMPLAN is equal to
13
Source: USDA NASS. Crop prices are shown at the state level, state data is unavailable for livestock prices, so
national data is used
14
Source: USDA NASS
22sales plus net inventory change15, this reduction in sales would lead to a decrease in the total output
contribution of the IMPLAN results.
Table 7, South Dakota Commodity Sales, 2017 and 201916
Sales ($1,000) 2017 2019 Change
Wheat $ 233,427 $ 295,269 $ 61,842
Corn, Grain $ 2,278,094 $ 1,850,170 $ (425,924)
Soybeans $ 2,156,596 $ 1,201,764 $ (954,832)
Cattle and Calves $ 2,219,240 $ 2,102,918 $ (116,322)
Hogs $ 490,270 $ 653,448 $ 163,178
Total $ 7,375,627 $ 6,103,569 $ (1,272,058)
Consistent with the above data is the fact that total cash receipts decreased from $7.94 billion to $7.8
billion, which is a 1.8 percent decrease. This is shown in Figure 1 in Section 2.2.
4.2 Detailed Results
The previous section showed the state level results by the four major categories: 1) Crops, 2) Livestock
3) Other Agriculture and 4) Forestry. The following section shows the results by industry within each of
the three major agriculture categories to show which specific industries are major contributors. Please
note that goods and services used by the agriculture industry to operate (i.e., banking and insurance)
are not specifically shown, but they are embedded as required inputs for the agriculture industry and
related economic activities.
4.2.1 Crops
The Crops category includes industries such as grain and oilseed farming, as well as crop food processing
industries. Total value added contributed to the South Dakota economy from crops was $3.27 billion
(Figure 12). Grain and oilseed farming together make up 86% of this contribution at $1.46 billion and
$1.34 billion in value added, respectively. Crop production and related economic activity in South
Dakota also accounted for 30,817 jobs (Figure 13), $7.91 billion in output, and $3.34 billion in household
income. In addition to crop production, the ‘Primary Food Processing – Crops’ category was a major
contributor in this area. This category includes items such as wet corn milling, flour milling, and soybean
processing.
15
https://support.implan.com/hc/en-us/articles/115009668388-Output
16
Source: USDA NASS
23Figure 12. Economic Contribution of South Dakota’ I d - Value Added
Figure 13. Economic Contribution of South Dakota’ I d – Jobs
4.2.2 Livestock
The Livestock category includes industries such as beef cattle production, hog production, dairy cattle,
poultry production (layers (egg production), broilers and turkeys), meat/poultry processing rendering,
24and more. Total value added contributed to the economy from livestock and related economic activity in
South Dakota was about $5.57 billion (see Figure 14).
Livestock production and related economic activity in South Dakota also accounted for 64,459 jobs (see
Figure 15), $16.1 billion in output, and about $5.32 billion in household income. In all of these indicators,
meat processing is the largest subcategory, which shows the importance of processing to the value
chain.
Figure 14. Economic Contribution of South Dakota’ L v I d - Value Added
Figure 15. Economic Contribution of South Dakota’ L v I d - Jobs
254.2.3 Other Agriculture
The Other Agriculture category includes industries such as animal feed production, farm machinery and
equipment manufacturing, custom farming services, and aerial crop spraying, ethanol production, dog
and cat food manufacturing, veterinary services, many food manufacturing industries and more (see
Appendix A, IMPLAN Aggregation Scheme). Total value- added contributed to the economy from Other
Agriculture industries was $1.98 billion (see Figure 16).
The industries in the Other Agriculture category in South Dakota also accounted for 23,983 jobs (see
Figure 17), nearly $6.0 billion in output, and about $2.1 billion in household income. Other food
processing and animal and pet food industries were major contributors to the Other Ag category.
Ethanol contributes significantly to the Other Agriculture sector (30% of Other Agriculture; 5% of total
South Dakota) with a value added contribution of $590 million and 5,334 jobs. Agriculture support also
contributed significantly with nearly 8,100 jobs and a value added contribution of $430 million.
Figure 16. Economic Contribution of South Dakota’ Ag I d - Value Added
26Figure 17. Economic Contribution of South Dakota’ Ag I d – Jobs
4.3 County Level Results
The results presented so far in this report have been focused on the state level; however similar
analyses have been performed for all of South Dakota’s sixty-six counties. As one would expect, the
contribution of agriculture varies widely, not just in terms of total contribution, but the degree to which
some counties are more or less reliant upon agriculture in terms of the four primary measures of
economic activity (value added, jobs, output, and household income). While there is variation across
counties, a county that is very reliant upon agriculture in terms of value added is also more likely to be
reliant upon agriculture in terms of jobs, output, and household income.
4.3.1 County Value Added
Figure 18 shows the ten counties with the greatest value added contributions from agriculture, forestry,
and related industries. Minnehaha County is by far the largest with over $2.3 billion in value added
contribution. The primary contributing industry is Meat Primary Food Processing with $1.64 billion in
value added. Brown, Beadle, and Brookings counties all have value added contributions from agriculture
and forestry industries of over $500 million.
27Figure 18. South Dakota Top 10 Counties, Value Added from Agriculture and Forestry Industries
The counties that derive the largest share of their total value added from agriculture, forestry, and
related industries include Faulk, McPherson, Campbell, Clark, and Jerauld. These counties tend to be
more rural in nature (less than 10,000 in population). All of these counties derive at least 70% of their
total value added from agriculture and forestry, as shown in Figure 19 below.
Figure 19. South Dakota Top 10 Counties, Percent Value Added from Agriculture and Forestry Industries
Using a histogram, Figure 20 shows the number of counties that derive certain ranges of shares of value
added in a local economy from agriculture and forestry activity. As shown below, 44 counties in South
28Dakota derive more than 30% of value added from agriculture, forestry, and related industries. In
addition, 25 counties derive more than half of their value added from these industries. More than 20%
of the State of South Dakota’s value added activity is derived from agriculture and forestry.
Figure 20. Percent of Value Added Derived from Agriculture and Forestry Industries
Figure 21 shows the amount of value added derived from agriculture, forestry, and related industries for
all of South Dakota’s counties. On a percentage basis, the value added from the ag and forestry and
related industries for each of South Dakota’s counties are shown in Figure 22. See Section 9.1 for
detailed value added county maps for crops, livestock, forestry, and other agriculture.
Figure 21. Value Added Derived from All Agriculture & Forestry (by County) ($M)
29You can also read