WACO-MCLENNAN COUNTY COMMUNITY HEALTH NEEDS ASSESSMENT 2018-2019 - CENTER FOR COMMUNITY RESEARCH AND DEVELOPMENT - PROSPER WACO
←
→
Page content transcription
If your browser does not render page correctly, please read the page content below

Waco-McLennan County
         Community Health
         Needs Assessment
            2018-2019

Center for Community Research and Development
                  baylor.edu/ccrd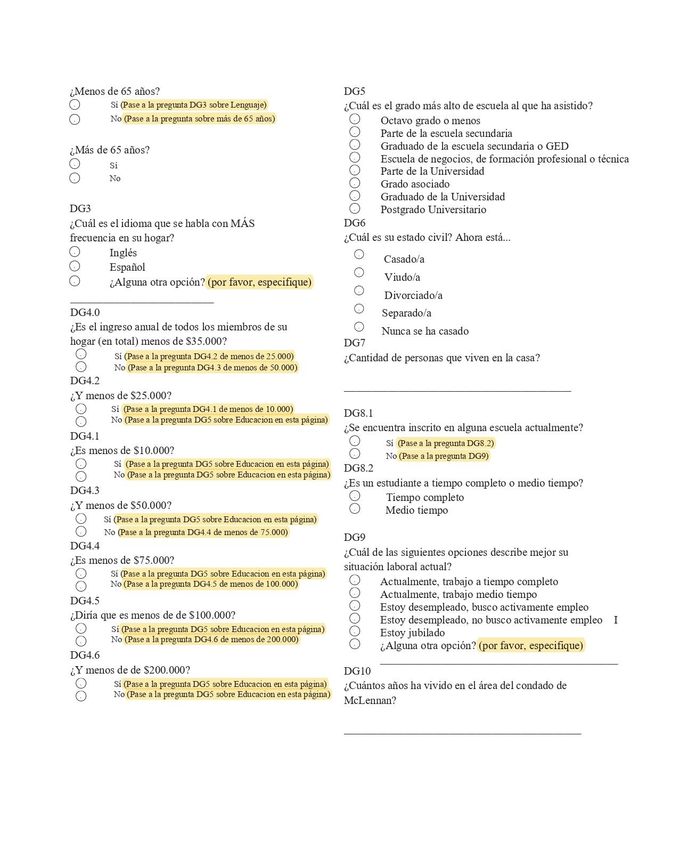
CHNA Report—2018-2019 i
Executive Summary
The Center for Community Research and Development (CCRD) conducted the 2018-2019
Community Health Needs Assessment (CHNA) of Waco-McLennan County residents using
mixed-mode survey (web, telephone, paper) and comparing the results with local health
measures and a recent health needs focus group. Based on these comparison, three broad needs
were identified as consistently appearing in our data.

Access to Healthcare
Nearly 8 percent of respondents indicated that they had had a problem accessing a health care
professional in the past 12 months. Those between the ages 25 and 44 or living in the east or
central portions of the county were most likely to have indicated such a problem. Consistent health
insurance coverage was also an issue. About 7 percent of respondents indicated not having
health insurance at the time they took the survey. Those reporting health insurance coverage
disruption were also more likely to have indicated trouble in accessing a health care professional
and were less likely to seek help from a Mental Health Practitioner. Access also emerged in the
focus groups as a major need. County health data showed high rates of uninsured and over-
reliance on emergency rooms for healthcare.

Lifestyle and Healthy Behaviors
Physical health measurements showed that respondent’s overall health was
negatively associated with health insurance disruption. Findings on physical activity among
respondents showed that more than 20 percent do no physical activity during a typical
week. Findings for healthy eating habits were also pertinent, as 54 percent of respondents
reported they consume less than the federally recommended minimum amount of fruit per
day. In addition, 73 percent reported they consume less than the federally recommended
minimum amount of vegetables per day. Only 13 percent of respondents indicated that they
are smokers. Of those who do smoke, most smoke between 1 and 11 cigarettes per day.
Lower income levels were associated with a greater likelihood of smoking. Focus group
participants mentioned the local challenges of ensuring an adequate diet (suggesting
grocery delivery for food stamp purchases) and a need to focus more on “behavioral healthcare.”
Local health data show an obesity rate of 30% and a “Food Environment Index” lower than the
state average.

Women’s Health
Survey responses showed that insurance possession and education level are relevant
indicators for having had a well-woman exam in the past 12 months. Consistently insured
respondents were more than twice as likely as the uninsured to have received a well-woman
exam in the last 12 months. Those with a college degree or higher were also twice as likely as
those with less than a high school degree to have received a well-woman exam in the last
12 months. Age at first pregnancy was shown to differ by race/ethnicity. The focus
groups identified insufficient healthcare for pregnant teens. Local health statistics confirm
women’s health as a need, including high proportions of births to teens compounded by racial
and ethnic disparities.

 CHNA Report—2018-2019                                                                          ii
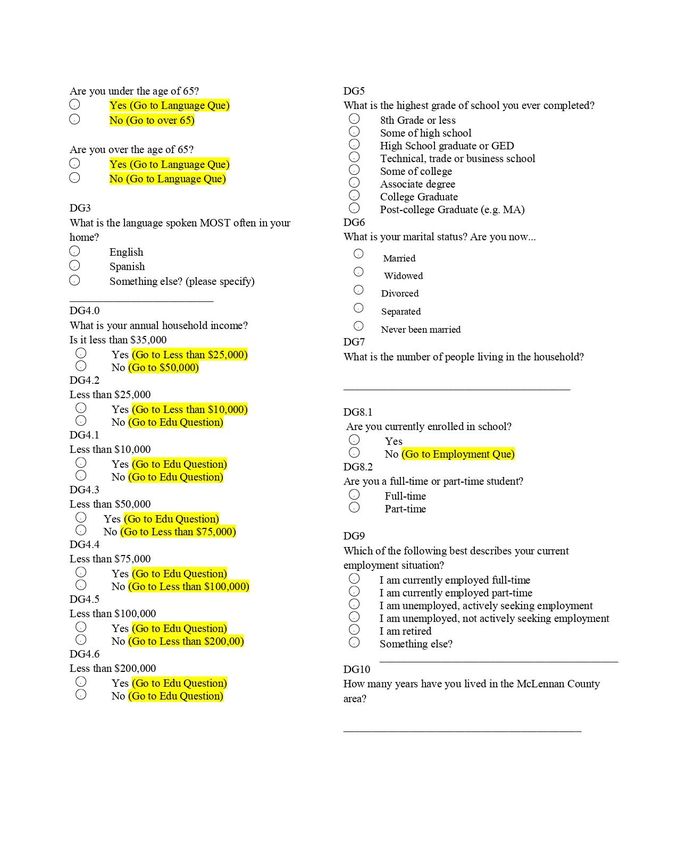
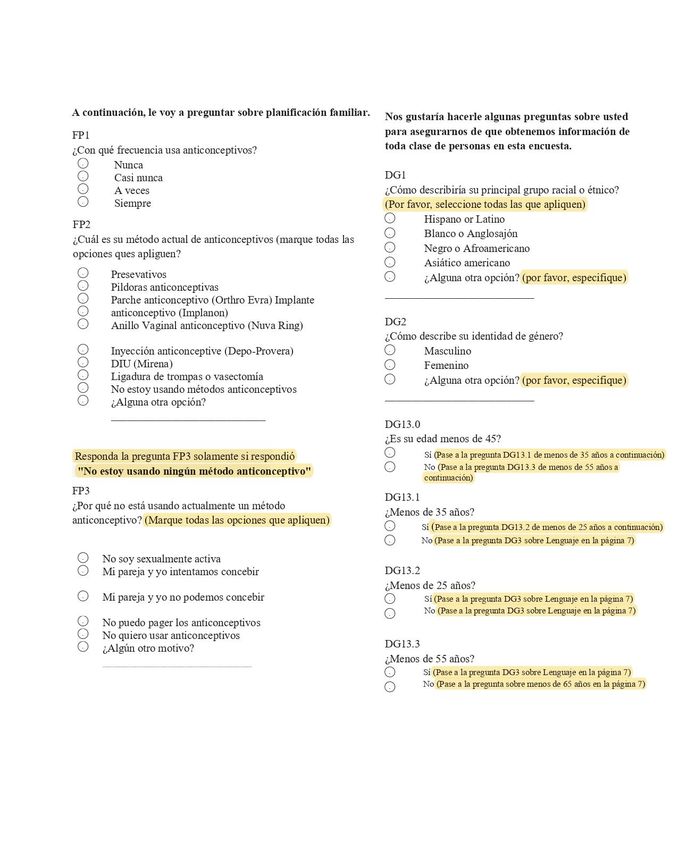
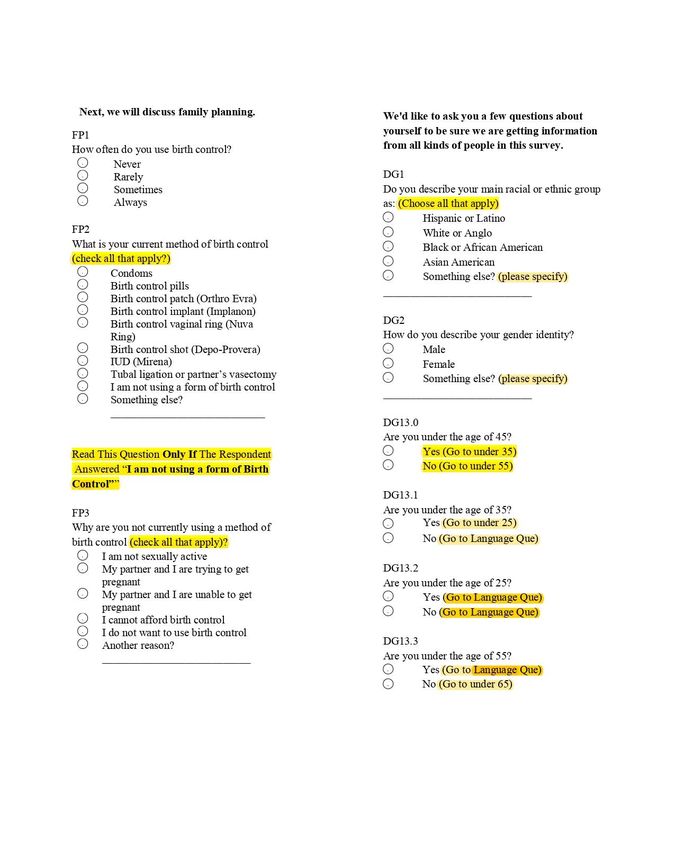
Table of Contents

Executive Summary .................................................................................................................... ii
List of Tables ............................................................................................................................. iv
List of Figures ............................................................................................................................. v
Background of the Community Health Needs Assessment......................................................... 1
   I. History of CHNA in McLennan County ................................................................................. 1
   II. McLennan County Health Indicators ................................................................................... 4
   III. Focus Group Summary...................................................................................................... 5
   IV. Demographic Data for McLennan County.......................................................................... 7
Data Collection for the 2018-19 CHNA Survey ........................................................................... 9
   I. Rationale for Data Collection Methods................................................................................. 9
   II. Description of Data Collection Process ..............................................................................10
   III. Demographic Description of the Sample ...........................................................................12
Main Findings of the CHNA Survey ...........................................................................................14
   I. Access to Healthcare and Services ....................................................................................14
   II. Lifestyle and Healthy Behavior ..........................................................................................23
   III. Women’s Health ...............................................................................................................30
A Prioritized List of Waco/McLennan County Health Care Needs..............................................34
References ...............................................................................................................................35
CCRD Description and Services ...............................................................................................37
Appendix 1: Frequency Tables..................................................................................................38
Appendix 2: Open-ended Questions .........................................................................................58
Appendix 3: Confidentiality Agreement .....................................................................................61
Appendix 4: Postcard Sent to Sample .......................................................................................62
Appendix 5: Web Invitation for WAC .........................................................................................63
Appendix 6: Copy of the Instrument’s English Version ..............................................................64
Appendix 7: Copy of the Instrument’s Spanish Version .............................................................73
Appendix 8: Focus Group Summary .........................................................................................84

  CHNA Report—2018-2019                                                                                                                   iii
List of Tables

Table 1. Zip Code Distribution of Respondents .........................................................................12
Table 2. Problem accessing health care professional................................................................14
Table 3. Problem accessing health care professional by age ....................................................14
Table 4. Health Insurance source and coverage .......................................................................16
Table 5. Self-reported Health ....................................................................................................23
Table 6. Physical activity in the previous week ..........................................................................24
Table 7. Physical activity in a typical week ................................................................................25
Table 8. Type of physical activity performed .............................................................................26
Table 9. Location for usual exercise ..........................................................................................26
Table 10. Daily consumption of fruit ..........................................................................................26
Table 11. Daily consumption of vegetables ...............................................................................27
Table 12. Daily Consumption of cigarettes ................................................................................29
Table 13. Well-woman exam in previous year ...........................................................................30
Table 14. Preferred Sources for Female Health Services ..........................................................31
Table 15. Current source of information about well-woman exams ...........................................32
Table 16. Preferred source of information about well-woman exams ........................................32
Table 17. Mean Age of First Pregnancy for main Racial/Ethnic categories according to Age
    Group ................................................................................................................................33

  CHNA Report—2018-2019                                                                                                                iv
List of Figures

Figure 1. Emergency Department visit rate by race for McLennan County and at the State level 2
Figure 2. Inhabitants of East and Central McLennan County experience the most problems
    accessing health care ........................................................................................................15
Figure 3. NE McLennan County experienced the most health insurance interruptions ..............17
Figure 4. Younger Respondents have More Disruption in Health Insurance Coverage .............18
Figure 5. Hispanic and African American respondents are 3 times more likely to experience a
    disruption in health insurance ............................................................................................18
Figure 6. Respondents with lower income levels have greater disruptions in health insurance
    coverage ............................................................................................................................19
Figure 7. Lower Levels of Formal Education are Associated with Disruption in Health Insurance
    Coverage ...........................................................................................................................19
Figure 8. Marital Status is a Key Predictor of Insurance Disruption ...........................................20
Figure 9. Insurance disruption is associated with difficulties in accessing a health care
    professional .......................................................................................................................21
Figure 10. Insurance disruption is associated with ER Visits for mental health issues ...............21
Figure 11. Worse Self-reported Health is associated with experiencing Insurance Disruption
    over the previous 12 months ..............................................................................................23
Figure 12. Physical activity rates do not vary widely by zip code ...............................................25
Figure 13. Highest percentages of smokers are in N and W parts of McLennan County ...........27
Figure 14. Higher Income Levels are Associated with Less Smoking ........................................29
Figure 15. Distribution of women who received a well-woman exam in the previous 12 months,
    according to their insurance disruption in the same period .................................................30
Figure 16. Higher Levels of Formal Education are Associated with Greater Likelihood of Well-
    Woman Exams ..................................................................................................................31
Figure 17. Age at First Pregnancy .............................................................................................33

  CHNA Report—2018-2019                                                                                                               v
Background of the Community Health Needs Assessment

Partners in McLennan County have a tradition of collecting data and information from the
community to help determine what is needed and what will work best to address specific needs
dating back to 2001. The purpose and goal of each assessment is to provide partner agencies
and community members a comprehensive and unbiased assessment of McLennan County
regarding health risk factors, issues in accessing care, and insight for future programming. The
2018-19 Community Health Needs Assessment was conducted within the context of prior CHNA
survey findings, current McLennan County health indicators, recent insights from Baylor Scott and
White Focus Groups, and recent demographic data from the U.S. Census Bureau.

 I. History of CHNA in McLennan County

The Center for Community Research and Development (CCRD) partnered with the community to
conduct the last CHNA in 2016. The report discovered three major health needs addressing:
access to health coverage/care; obesity and lifestyle issues; and women’s health.

 I.I Access to Health Coverage/Care

Access to affordable health care is a core focus of all stakeholders in the health care industry. In
2016, a number of issues were discovered that limit the residents of McLennan County to
affordable health care. First, it was found that county residents had a higher uninsured rate,
compared to the nation and the state of Texas. The 2016 report also found that county residents
were more likely to have lost their health care in the previous year, compared to national data
(Berchick, Hood, and Barnett, 2018).

Second, McLennan County has a higher than average reliance on government assistance for
health care. Most notable was that 41 percent of county children were covered by CHIP or
Medicaid. While more than 1 in 10 residents reported problems with access to health care, cost
and transportation were the most frequently reported barriers. This would also explain why the
county had a higher than average routine check-up rate; 30 percent of county residents had not
had a regular check-up in the previous 12 months. County residents also use the ER with great
frequency—25 percent of county residents had been to the ER at least once in the prior year, and
5 percent reported using the ER as their primary care outlet. Significant racial/ethnic disparities
were also found in the previous report regarding certain access measures. For example, African
American residents were 160 percent less likely to have health insurance compared to White
residents. Moreover, Hispanic residents were 460 percent less likely to have health insurance
than White residents.

Additional data from CMS support the findings. Figure 1 shows that compared to White residents,
ER visits are twice as likely among African Americans in McLennan County, and 50 percent more
likely among Hispanics.

 CHNA Report—2018-2019                                                                          1

Figure 1. Emergency Department visit rate by race for McLennan County and at the State level

                                     1200
 Per 1,000 beneficiaries, per year

                                     1000

                                     800

                                     600

                                     400

                                     200

                                        0
                                            2012       2013    2014        2015     2016        2017
                                            McLennan White    McLennan Hispanic   McLennan Black
                                            McLennan Total    Texas Total

 I.II Unhealthy Lifestyles

While Americans are a relatively unhealthy population, the situation is more pronounced in
McLennan County where 2011 community level data showed that 29 percent of residents were
officially obese, as reported by the University of Madison Wisconsin (2015) in the County Health
Rankings & Roadmaps.

The data also show that McLennan County residents have a premature death rate (before age
75) 15 percent higher than the Texas state rate, and 47 percent higher than the top performing
counties in the nation. In the 2016 CHNA, it was found that nearly half of county residents reported
0 physical activity in a typical week. Only 16 percent of McLennan County residents reported
getting the Health and Human Services weekly recommended amount of exercise (180+minutes
moderate exercise), compared to 23 percent of all Americans (Blackwell and Clarke, 2018). In
addition, 18 percent of McLennan County residents are completely sedentary (do not walk at least
10 minutes per day). Half of county residents reported eating less than half a cup of fruits and
vegetables per day (daily recommendation is 2.5 cups). Moreover, an estimated 6 percent of
McLennan County residents eat the daily recommendation of fruits and vegetables, compared to
11 percent of all Americans. About 20 percent of county residents reported daily cigarette smoking
activity. This rate is 50 percent higher than the top performing ‘low smoking counties’ in the United
States (14 percent smokers), according to the University of Wisconsin’s Population Health
Institute.

    CHNA Report—2018-2019                                                                              2
I.III Women’s Health

The final area where a significant need for improvement was identified was women’s health. In
McLennan County, 26 percent of women had never had a well-woman exam, including an
estimated half of Hispanic women in the county. Women in the county reported a dearth of
information about well-woman needs. Only 56 percent of women in the county report that they
have received well-woman information from a health care provider, while many others looked to
other sources, such as the internet. An alarming 25 percent of McLennan County women reported
having no information or knowledge about well-woman exams.

In the study, only 36 percent of women had a mammogram in the previous year, and 10 percent
of women over 40 had a 5-year gap since their last mammogram. Significantly, less than half of
Hispanic women in the county have ever had a mammogram. Of McLennan County women who
have had children, 26 percent were pregnant before their 18th birthday. Moreover, community-
level data show that in 2015 the birth rate for teenage mothers (15-19) was 43 percent greater for
McLennan County (53 per 1,000 live births) than for the state of Texas, and that this disparity is
race/ethnic specific. The teen birth rate was 22 per 1,000 for White women, 53 per 1,000 for
African American women and 54 per 1,000 for Hispanic women, according to the University of
Wisconsin Population Health Institute. Access to prenatal care and teen pregnancy are predictors
of low birth babies (under 2,500 grams). The community-level data show that the low birth rate in
McLennan County is 8 percent, but very race specific. Low birth weight for White and Hispanic
babies was 7 percent, while for African Americans the rate was 14 percent, twice the national
average.

Teams of health professionals and community members reacted to the 2016 information and
coordinate programming and activities in an effort to impact the three areas outlined above.

 CHNA Report—2018-2019                                                                        3
II. McLennan County Health Indicators

In accord with the 2016 CHNA findings for McLennan County, recent government data indicate
that the county lags behind the rest of the country in healthcare access, health behaviors, and
women’s health measures. Moreover, compared to white Americans residing in McLennan
County, racial minorities tend to fare worse on these measures. These findings are detailed below.

 II.I Access to Health Care

According to the data collected by the Centers for Medicare & Medicaid Services, many
emergency room visits occur due to lack of health insurance coverage or inability to access a
primary care physician for medical treatment and preventative care. While McLennan County’s
overall rate of ER visits is comparable to that of the state and country, the rate among Black and
Hispanic residents is substantially higher. In 2017, the county rate was 692 ER visits per 1,000
Medicare recipients, compared to 700 for the state of Texas and 691 for the country as a whole.
However, the rates for black and Hispanic recipients in McLennan County were 1050 and 757,
respectively.

These gaps have been consistent for several years, going back to 2012. While the rates for all
groups were on the rise during this period, it is worth noting that there was a slight decline between
2016 and 2017, with the sharpest drop occurring among Hispanics. It is not yet clear whether this
trend will continue into the future. What is clear from the data at this time is that the ER visit rate
in McLennan County is slightly higher than both the state and country averages and that racial
minorities have the highest rates. This could indicate decreased access to health care among
non-white populations.

 II.II Unhealthy Lifestyles

McLennan County residents rank poorly on a number of individual health measures as well. For
the past eight years (since 2012), the county adult obesity rate has consistently hovered around
30 percent, never rising or falling more than one percentage point. The city of Waco has an even
higher rate at 37 percent. McLennan County’s poor record in the area of healthy lifestyles is also
reflective in its physical activity rate. In 2019, 24 percent of adults did not report any engagement
in leisure-time physical activity, which is the lowest rate in eight years. Furthermore, residents of
McLennan County may also experience limited access to healthy foods.

In 2019, the county’s Food Environment Index score was only 5.5, according to the University of
Wisconsin Population Health Institute, a figure that is smaller than in Texas overall and
substantially smaller than the top-performing counties in the United States (8.7). The Food
Environment Index is a score ranging from 0 to 10 and measures several different factors related
to food choices, health and well-being and community characteristics. Other food-related metrics

 CHNA Report—2018-2019                                                                             4
tell a similar story. Estimates for the city of Waco indicate that as many as 91 percent of residents
had limited access to healthy foods, according to New York University’s City Health Dashboard.

 II.III Women’s Health

McLennan County pregnancy and childbirth-related measures indicate that women face particular
health and healthcare challenges and that non-white women may be especially vulnerable. There
is some good news in this area as well, as the teen birth rate decreased from about 49 teen births
per 1,000 teen girls in 2010 to 33 in 2015. However, while this decrease was seen across all racial
groups, a substantial gap remains between white and non-white teen mothers. The most recent
data indicates that the birth rate for white teen girls between the ages of 15 and 19 is about 21
births per 1,000 teens. This rate is more than twice as high for both black and Hispanic teens, at
52 and 48, respectively. Racial disparities also exist among adult mothers in McLennan County.
About 67 percent of white mothers who gave birth in 2015 had received prenatal care in their first
trimester, compared to only 49 percent of black mothers and 54 percent of Hispanic mothers.

Newborn birthweight rates in McLennan County also reflect racial disparity. These rates have
been decreasing in recent years, but a substantial racial gap remains, particularly between white
and black mothers. In 2015, about 63 out of 1,000 white newborns had low birthweights compared
to 150 out of 1,000 black newborns. From 2011 to 2014, low birthweights occurred among
Hispanic newborns at a rate in between those of white and black babies, but then dropped
substantially in 2015. This is the most recent available data at this time, so it remains to be seen
if this positive trend will continue. What is clear is that several measures of maternal and neonatal
health are improving, but persistent gaps remain between whites and racial minorities in
McLennan County.

 III. Focus Group Summary

The Baylor Scott and White focus groups, undertaken with key stakeholders, reinforce both the
findings of the 2016 CHNA survey and recent McLennan County Health Indicators, especially in
regard to health care access. The full report is available for reference in Appendix 8. When focus
group participants were asked about health barriers in McLennan County, several themes related
to healthcare access emerged. These include language and cultural barriers, education-related
barriers, costs, availability, and transportation.

 III.I Language/Culture barriers

On problems in McLennan County, one stakeholder noted the “lack of education/information and
being able to understand it; cultural barriers; language issues.” Another noted that health issues
were, “Poverty driven-lack of trust in African American communities.” The undocumented
population is also seen as a community health issue because many providers will not see them,

 CHNA Report—2018-2019                                                                           5
Medicaid expansion has not been brought to Texas, and that there is limited availability at the
free clinics who will see undocumented.

 III.II Education-related barriers

Another community health barrier is McLennan County’s lower level of post-secondary education.
This creates several problems, including poor diet, living in deteriorated housing and
neighborhoods (which are food deserts), misunderstanding and mistrusting the health system,
and poor health literacy (i.e. importance of diet, exercise, annual check-ups, etc.). When asked
about important health concerns, one participant replied, “Diet. Education and people not
understanding what a healthy diet is. Affordability; [people don’t know that] healthy food is cheaper
than frozen or canned.” Another participant said, “Health education. In poor [neighborhoods]
health is not valued.” Some also identified a technology gap that frustrates the older generation.
“[Too much emphasis on] social media hasn't reached a lot of the population; the older population
is still leery. The younger population use[s] portals and online access.”

 III.III Costs

In regard to costs and access to medication, clinic fees and insurance are common themes. One
participant said that a major frustration was medication. “[There is] no source for affordable
supplies. Not [many] resources…Insulin for diabetics is very expensive. [Also], inhalers for COPD
patients. A lot of people just can't afford it.” Another cost issue was raised in reference to after
hour clinics: “There are [clinics], but [they are] not open 24 hours [and] they don't cover [the]
uninsured or [those who] don't have payment.” Another commented that, ‘Copays deter
utilization.”

 III.IV Availability

Some participants were displeased with the health resources available in the county. One
participant noted, “There are several clinics, but there's not enough. [They are] full when trying to
schedule appointments…New patients can be [made to] wait up to a month.” Another commented
that there is a “lack of trust for the medical profession.” One participant noted, “[We need a]
hospital-based food pantry to help receive healthy foods.”

 III.V Transportation

Finally, transportation concerns were also raised. As one respondent noted, “[The] African
American and Hispanic populations [are] impacted more due to lack of public transportation.”
Another touched on the same issue: “Transportation. Patients can't get to their appointments…A
few agencies [are] working to provide it, but [are] not there yet. Public transportation only covers
Waco proper; the outer areas have no access.”

 CHNA Report—2018-2019                                                                           6
The question of healthcare access is in many ways a question that hinges on race/ethnicity, socio-
economic status, and education. In the end, as one respondent said, an underlying issue is that
every member of the community needs, “To be seen as a person, regardless of economic status
or ethnic group. To be treated from an equitable standpoint; make sure providers are providing
quality care to everyone.”

 IV. Demographic Data for McLennan County

As a final source of background information for the 2018-19 CHNA, demographic data on
McLennan County from the U.S. Census Bureau was examined. According to the data, McLennan
County lies near the Texas state average for percent male/female and high school degree
attainment among adults. However, compared with state averages, bachelor’s degree attainment
and income levels in the county are lower and the unemployment rate and poverty rate are higher.
The county also contains greater percentages of White and African American/Black residents
(and lower percentages of Hispanic/Latino residents) than the state of Texas as a whole. When
considering the city of Waco, many of the state comparisons are starker. More detail is given to
each area below. All data was taken from the U.S. Census Bureau.

 IV.I Education

McLennan County is slightly above the state average for high school educational attainment but
below the state average for bachelor's degree attainment. In McLennan County, 84 percent of
adults have received a high school degree (compared to 83 percent of all Texans). The figure is
lower for the city of Waco; only 80 percent have a high school degree. Only 23 percent of
McLennan County and Waco residents have a bachelor’s degree. In contrast, 29 percent of adult
Texans have obtained a bachelor's degree.

 IV.II Race/Ethnicity

Approximately 57 percent of McLennan County residents identify as White, compared to the state
average of 43 percent. The city of Waco has a significantly higher proportion of African
American/Black residents (21 percent) when compared to McLennan County as a whole (14
percent). Both the county and city averages are above the state average of African
American/Black residents, which is 12 percent. McLennan County and Waco also have an
average Hispanic/Latino population below the state average of 39 percent. In McLennan County,
the average percentage of Hispanic/Latino residents is 26 percent. As for Waco, the average
percent of Hispanic/Latino residents is 32 percent.

 IV.III Gender and Age

 CHNA Report—2018-2019                                                                        7
The Texas state average by gender according to the U.S. Census is approximately 50 percent for
males, and 50 percent for females. McLennan County is slightly below the state average for
males, at 49 percent, and slightly above the state average for females, at 51 percent. The City of
Waco’s median age is 29. This figure is below both the median age in McLennan County and the
median age in Texas, which are 33 and 34, respectively.

 IV.IV Household Income, Unemployment Rate, and Poverty Level

McLennan County’s medium household income of $46,262 is below the state average of $57,051.
The City of Waco’s median household income of $36,004 is below both the state and the county’s
median income. The unemployment rate for the City of Waco is higher than that of the county and
state. Waco’s unemployment rate is 6 percent, while the county rate of unemployment is 5 percent
and the state unemployment rate is 6 percent. Only 16 percent of Texas residents are below the
poverty level, according to the U.S. Census. About 19 percent of McLennan County’s residents
are below the poverty level, and nearly 27 percent of Waco residents are below the poverty level.

 CHNA Report—2018-2019                                                                        8
Data Collection for the 2018-19 CHNA Survey

Because of the findings outlined above, and the availability of reliable secondary sources, the
CCRD set out to assess the overall health practices and health care needs of Waco-McLennan
County residents with a focus on access, healthy lifestyles, and women’s health concerns. The
questions in the 2018-19 CHNA survey were developed using prior survey models and through
dialogue between CCRD researchers and the CHNA team, made up of administrators from the
Waco-McLennan County Public Health District, Family Health Center, Ascension Providence
Healthcare Network, Baylor Scott & White Hillcrest Medical Center, and the collective impact
initiative Prosper Waco. The rationale for the methods used to conduct the 2018-19 CHNA survey,
a description of the data collection process, and a demographic description of the sample follow.

 I. Rationale for Data Collection Methods

In prior CHNA surveys, the sole or primary means of data collection was accomplished through
Random Digit Dial (RDD) telephone surveys. However, in recent years, the effectiveness of RDD
has been challenged (Steeh et al. 2001; Curtin, Pressor, & Singer 2005; Kohut et al. 2012; Fowler
et al. 2016; Williams & Brick 2018), especially in relation to issues surrounding survey bias and
non-response. RDD tends to under-sample the young and persons of color. Call-screening has
also proliferated (both among land-line and cell-phone users), due in part to the erosion of public
trust and more sophisticated caller identification technology (Dillman, Smyth, & Christian 2014;
Singer 2016; Tourangeau 2017). Public distrust affects nearly all types of surveying, but other
survey methods also pose their own unique challenges. For example, web-based surveys tend to
under sample the elderly, the less-educated, persons of color, and respondents from low-income
households (Mariano & Lewis 2017). In sum, no single survey method is without its challenges.
Utilizing mixed-method surveying is ultimately advantageous because it can minimize or offset
the weaknesses inherent within a single survey method.

These factors have caused survey method researchers to become proponents of mixed-mode
surveying (Dillman et al. 2014; Battaglia et al. 2016; Biemer et al. 2018; Patrick et al. 2018). Within
this framework, address-based sampling has become more common, especially surveying in
which initial contact with a potential respondent is made by mail. The physical aspect of a mail
request serves as a first step to legitimize a survey in the eyes of a potential respondent.
Subsequent requests for survey completion can then be made by mail, phone, or web, capitalizing
on the need for survey completion convenience. Address-based sampling also allows for
responses to be geographically linked to a place, which enables more robust final analyses by zip
code, school zones, Census tracts, etc.

With these considerations as a backdrop, CCRD researchers conducted a mixed-mode survey in
2018 for the CHNA. While overall survey response was lower than in previous iterations,
demographic characteristics show close alignment with U.S. Census Bureau data for McLennan
County. In addition to the mixed-mode surveys, the identification of local healthcare needs also
relied on other quantitative available measure described on pages 4 and 5 as well as qualitative
response to a series of focus groups described on page 5 and summarized in Appendix 8.

 CHNA Report—2018-2019                                                                             9
II. Description of Data Collection Process

 II.I Questionnaire

Stakeholders and healthcare professionals began meeting in February of 2018 to discuss the
content of the survey instrument. Question selection was based on three criteria:

       (1) if the question was asked in a previous CHNA, changes were minimal to allow
           for accurate comparison;

       (2) new questions were modelled after the Behavior Risk Factor Surveillance
           System Questionnaire as well as other questionnaire sources;

       (3) if reliable secondary data sources were available in a timely manner, the
           decision was made to probe further into the topic rather than ask the surface-
           level question.

Respondents were asked questions pertaining to access to healthcare, wellness practices, risks
and diagnoses, as well as a variety of standard health indicators. The survey contained 78
questions and the average completion time was approximately 10-12 minutes. Each question in
the survey is actionable, meaning that there is an organization, city department, or working group
that will use the information to improve health outcomes in the Waco-McLennan County area.

The instrument was created using the Qualtrics software and designed to be administered by
telephone and self-completion over the web. A print version was created to assist in face-to-face
interviewing. Care was taken to incorporate the Spanish-speaking population in McLennan
County by ensuring a Spanish translation of the survey was available as well as Spanish speaking
interviewers. The instrument was translated by Welocalize from Maryland and reviewed by local
Spanish speakers to ensure the correct dialect was used.

 II.II Sample and Phone Interviews

Data were collected from September 1, 2018 to November 23, 2018. An original address- based
sample of over 15,000 potential respondents was obtained through the Marketing Systems Group,
in coordination with Prosper Waco. Respondents were contacted by mail, web, phone, and in
person.

A first wave of post cards introducing the survey was sent to the entire sample on September 1,
2019. Respondents were directed to take the survey on the web (using a unique identifier) or over
the phone by calling the CCRD during regular business hours. Instructions in Spanish were also
included. Follow-up postcards were sent to those who did not respond on October 26, 2019 and
again on November 6, 2019. Paper copies of the survey were not sent by mail, primarily due to
cost constraints. Web contact was also made with respondents via multiple emails and web
advertising. Facebook advertising yielded 25 engagements, 23 engagements came from the
search bar on Android cell phones, three engagements came from a CHNA article on the KXXV
site, and 2 engagements came from a link on Instagram. As with the postcards, web

 CHNA Report—2018-2019                                                                        10
communication directed respondents to either complete the online version of the survey using a unique identifier or to call the CCRD and complete the survey with staff over the phone. Respondents were contacted by phone using a Computer Assisted Telephone Interviewing (CATI) system. The CATI technology, when linked to the Qualtrics software, allowed for automated data entry directly upon completion of a phone interview. The CCRD call center was utilized by interviewers for survey administration on the dates of September 17-20, 24-27, 29, October 1-4, 8-11, 29-30, and November 5-8. Several steps were taken to ensure the quality of the phone interviews and included (1) intensive training sessions completed by each interviewer; (2) continual monitoring of phone interviews by CCRD research analysts; (3) daily review of work, interviewing procedures, and results by the CCRD staff; and (4) calling during times established in previous studies to minimize non-response. The final means used to contact respondents in this mixed-mode survey was door-to-door interviewing, which took place on October 13, 2018 and October 27, 2018. II.III Fieldwork While many of the interviewers had previously participated in administrating the survey by phone, a separate training was still required for all those going into the field. Groups of approximately 6- 10 interviewers were paired with at least one CCRD research analyst and were assigned routes in various neighborhoods. The County’s Community Health Workers (CHW) also participated in the training, and accompanied the interviewers during the face-to-face sessions, in order to establish a better rapport with the individuals that were being interviewed. A total of 884 homes were visited. CCRD staff were all equipped with proper knowledge on appropriate safety procedures and maintained frequent cell phone communication with all involved during the duration of the interviews. The neighborhoods and streets chosen for surveying were determined, with the aid of Prosper Waco, by under-represented zip codes within the greater Waco area and McLennan County. An effort at probability sampling was made by identifying “seed households”—obtained through the initial address-based sample—and then assigning interviewers systematic routes around these seed households whereby every third household was contacted. II.IV Reporting The report analyzes the responses of collected from McLennan County adult residents who completed the survey. The dataset contains 1,004 cases, which were completed by web, phone, and face-to-face. Demographic characteristics of this sample closely resemble those available through external sources such as the United States Census. The CHNA survey questions have been analyzed based on standard demographic variables, which include age, gender, race, marital status, household size, number of children, level of education, and household income. Questions within each section of this report are presented as they were read to the respondents by the interviewers. Overall frequencies and cross-tabulations, as necessary, are provided for each question, and question summaries discuss factors that are significantly related to each individual question. CHNA Report—2018-2019 11
III. Demographic Description of the Sample

The characteristics of the sample closely resemble the McLennan County population in numerous
ways. Characteristics of interest include age, race/ethnicity, income, education, marital status,
household structure, and employment. These variables are used analytically in subsequent
sections. Additionally, the sample included respondents from all geographic regions of McLennan
County. Zip code distribution of respondents is outline in Table 1 below. Notably, 35 percent of
survey responses came from zip codes identified in previous CHNA reports as “highest need”
areas (76704, 76705, 76706, 76707).

 Table 1. Zip Code Distribution of Respondents
                                       Zip
  City                                Code          Percentage
     Eddy, TX                        76524               0.6
     Moody/Lorena, TX                76557               0.8
     Oglesby, TX                     76561               0.1
     Axtell, TX                      76624               0.6
     Bruceville, TX                  76630               0.2
     China Springs, TX               76633               2.3
     Crawford, TX                    76638               0.7
     Elm Mott, TX                    76640               1.4
     Hewitt, TX                      76643               6.6
     Lorena, TX                      76655               3.6
     McGregor, TX                    76657               4.2
     Mart, TX                        76664               1.6
     Riesel, TX                      76682               1.2
     Valley Mills, TX                76689               1.0
     Waco/West, TX                   76691               3.4
     Waco, TX                        76701               0.3
     Waco, TX                        76704               4.3
     Waco/Lacy Lakeview, TX          76705               9.5
     Waco/Robinson, TX               76706             12.1
     Waco, TX                        76707               9.1
     Waco, TX                        76708               9.3
     Waco, TX                        76710             11.5
     Waco, TX                        76711               1.8
     Waco/Woodway, TX                76712             13.5
     Waco/Baylor, TX                 76798               0.1
In regard to race and ethnicity, the 2018 CHNA asked “Do you describe your main racial or ethnic
group as: (choose all that apply)”, and the categories were “Hispanic or Latino”, “White or Anglo”,
“Black or African American”, “Asian American” or “Something else?”. Thus, respondents were
able to select more than one option. To recode this into one variable, all respondents who selected
“Hispanic/Latino” as at least one of their options were coded as Hispanic. This group included 92

 CHNA Report—2018-2019                                                                         12
respondents, seven of whom also chose “White/Anglo” and one of whom also chose “Something else.” Respondents who only selected White/Anglo, Black/African American and Asian American were coded as White (73 percent), Black (11 percent), and Asian American (1 percent) respectively. The final race/ethnicity category used in the 2018 CHNA analysis was “Other race or multiracial” (3 percent). Respondents who chose multiple non-Hispanic options or who selected “Something else” were coded in this category. This group also included those who chose both Black and White, or both Asian American and White, among others. The most common volunteered response from those who chose “Something else” was American Indian or Native American. In terms of the respondents’ gender identity, 39 percent of respondents identified as male, 61 percent as female and less than 1 percent as “Something else.” Regarding their age, the sample had a higher concentration of older adults, as 39 percent of the respondents were 65 years old or older. Almost one quarter of the respondents (23 percent) were between the ages of 55 and 64. Conversely, only 3 percent of the sample were less than 25 years old. As for income, 20 percent of the people had a household income between $50,000 and $75,000, which is the highest concentration of respondents in any income bracket. The second highest concentration was in the $100,000 to $200,000 income category (18 percent). For education, only 7 percent of respondents answered that they were currently enrolled in school. Within this group, 35 percent were enrolled part-time and 65 percent were enrolled full-time. Another question inquired about the highest grade of school that respondents had completed. The highest concentration of respondents in any education bracket indicated they were a “College Graduate” with 25 percent. The second highest was “Post-college Graduate” with 19 percent. In terms of marital status, 59 percent of respondents reported being married, 14 percent reported being widowed and 13 percent said they had never been married. In terms of the composition of households, 41 percent of respondents said they lived in households with two people. Another 22 percent responded that they lived in households with one person and 22 percent said that they lived alone in their households. Regarding employment, the highest concentration of responses was in the category of “Retired” (39 percent). Nearly the same number of respondents (38 percent) indicated that they were currently employed full-time and 9 percent indicated that they were employed part-time. Unemployed participants represent 7 percent of the sample, divided between 3 percent who were actively seeking employment and 4 percent who were not actively seeking employment. CHNA Report—2018-2019 13
Main Findings of the CHNA Survey
After compiling the data from the 2018-19 survey, researchers at the CCRD grouped the main
findings under the following three categories: access to health care and services, lifestyle and
healthy behavior, and women’s health. While the survey included some new questions, as
explained above, these categories are grouped this way to enable comparisons and cross-
analysis, both to previous CHNA reports and to other health indicators for McLennan County.

 I. Access to Healthcare and Services

As reflected in the focus group summary, access to health care and services remains a concern
for the Waco-McLennan County area. Three main findings were evident in this area and include
access to health care professionals generally, inconsistent health insurance coverage (or lack
thereof), and some implications of health insurance disruption.

 I.I Access to Health Care Professionals

Easy access to health care professionals was identified as a need in prior iterations of the CHNA
and in the focus groups. Survey respondents also reported having problems accessing health
care professionals. While the majority of respondents in the survey indicated no problems in this
area, about 8 percent of respondents did report having a problem accessing a health care
professional in the past 12 months.

Table 2. Problem accessing health care professional
In the past 12 months, have you had a problem accessing a health care professional?
 Response                       N                          Percentage
     Yes                        61                              7.9
     No                         707                           92.1

This question was broken down further by age and geographic location. The most defining
characteristic of respondents who reported problems accessing health care professionals was the
age of the respondent. Among those who answered “Yes” to having a problem accessing a health
care professional in the past 12 months, the age group most affected was between 35 and 44
years old (15 percent), followed by the group between 25 and 34 years old (13 percent).

Table 3. Problem accessing health care professional by age
In the past 12 months, have you had a problem accessing a health care professional?

 CHNA Report—2018-2019                                                                       14
Yes No
N Percentage N Percentage
Age Less than 25 1 5.9 16 94.1
25-34 7 13.2 46 86.8
35-44 11 15.1 62 84.9
45-54 6 7.2 77 92.8
55-64 11 7.8 130 82.2
65+ 14 5.9 222 94.1
The following map of McLennan County shows a geographical distribution of those who answered
“Yes” to the question of having had a problem accessing a health care professional in the past 12
months, defined by zip code. The east and central portions of the county showed the highest rates
of experiencing problems accessing health care.
Figure 2. Inhabitants of East and Central McLennan County experience the most problems
accessing health care
During the past 12 months, have you had a problem accessing a health care professional?
I.II Health Insurance Coverage
CHNA Report—2018-2019 15Health care access often hinges on possession of health insurance. In the U.S., health insurance
is most often provided through an employer or union. Table 4 shows that this bears out in
McLennan County as well, as 40 percent of survey respondents listed this as their primary means
of health insurance. The second highest form of health insurance among respondents was
Medicare (35 percent). About 7 percent of respondents reported not having health insurance.
Table 4. Health Insurance source and coverage
Is your health insurance primarily…
Response N Percentage
Through your or someone’s work or union (including HMO) 306 40.1
Bought directly by yourself or a family member 76 9.9
Medicare 268 35.1
Medicaid or public aid 27 3.5
Other source 33 4.3
I do not currently have health insurance 54 7.1
While having insurance is important, it is also necessary to understand the portion of the
population that experiences inconsistent access to health insurance or interruptions in insurance
coverage. Out of all respondents, 11 percent reported having some type of insurance interruption
in the last 12 months. Figure 3 shows the geographical distribution within McLennan County.
Respondents who had experienced a health insurance disruption over the previous 12 months
tend to cluster in socioeconomically disadvantaged areas of the Waco-McLennan County. This
can be observed in the northeastern part of the county, especially in zip code 76624. The area
includes the city of Axtell and is adjacent to zip codes 76640 and 76705, both of which report
moderate levels of health care interruption. Important landmarks in those zip codes include the
cities of Lacy Lakeview and Bellmead as well as Texas State Technical College’s Waco Campus.
Another zip code where respondents report high levels of health insurance interruption is 76657
and includes the cities of McGregor and Moody.
CHNA Report—2018-2019 16Figure 3. NE McLennan County experienced the most health insurance interruptions During the past 12 months, was there any time that you did not have health insurance? In addition to geography, other respondent characteristics are associated with lack of health insurance and interruptions in coverage. These include age, race/ethnicity, socio-economic status, education level, and marital status. If found to be relevant, statistical significance is noted in each case. I.II.I Health Insurance Disruption according to Age Respondents who experienced health insurance disruption in the previous 12 months tend to be younger in age. Among the respondents who are 65 or older, only 3 percent reported health insurance disruption. In comparison, 35 percent among those who are 25 years old or younger experience health insurance disruption. CHNA Report—2018-2019 17
Figure 4. Younger Respondents have More Disruption in Health Insurance
   Coverage
   During the past 12 months, was there any time that you did not have health insurance?

          35%
                            30%

                                       15%              14%
                                                                   10%

                                                                                  3%
         18 - 24           25 - 34   35 - 44         45 - 54      55 - 64     65 or over

 I.II.II Health Insurance Disruption according to Race/Ethnicity

Another disparity exists when examining the responses by race. Between a fifth and a quarter of
Hispanics and African Americans did not have health insurance over the past 12 months (26
percent and 21 percent, respectively). Among White respondents, only 7 percent went without
health insurance, as shown in Figure 4. A subsequent statistical analysis shows that there is a
significant difference in experiencing health insurance disruptions between the White and
Hispanic respondents (p
I.II.III Health Insurance Disruption according to Socio-Economic Status The median earnings for full-time, year-round workers in McLennan County is $37,419 according to the most recent U.S. Census 5-year estimates. About 17 percent of CHNA survey respondents who reported an average income of less than $35,000 reported a disruption in the coverage as compared to 3 percent of respondents with an average income over $75,000, as reflected in Figure 6. A subsequent statistical analysis illustrates a significant difference (p
25%

                                  13%                 14%

                                                                             6%

        Less than High        High School       Some College or       College Graduate or
           School           Graduate or GED      Trade School               Above

 I.II.V Health Insurance Disruption according to Marital Status

Among married respondents, only 9 percent reported health insurance disruption during the
previous 12 months. In comparison, 12 percent of divorced respondents, 21 percent of
respondents who had never been married, and 30 percent of separated respondents reported
insurance disruptions.

   Figure 8. Marital Status is a Key Predictor of Insurance Disruption
   During the past 12 months, was there any time that you did not have health insurance?

           30%

                            21%

                                            12%
                                                             9%                8%

        Separated        Never Been       Divorced          Married          Widowed
                          Married

 I.III Implications of Health Insurance Disruption

CHNA Report—2018-2019                                                                       20
Disruption in health insurance coverage is further correlated with health care access and with
Emergency Room (ER) visits. Respondents who experienced an insurance disruption were
approximately five times more likely to report a problem accessing a health care professional, as
shown in Figure 9. Of those who had experienced an insurance disruption, 28 percent had
problems accessing a health care professional in the previous 12 months. Among the consistently
insured respondents, only 5 percent had problems accessing a health care professional.
Figure 9. Insurance disruption is associated with difficulties in accessing a health care
professional
Percent of respondents who had problems accessing health care professionals
28%
5%
Insurance Disruption Consistently Insured
Another comparison concerns the likelihood of respondents to seek out specialized help for
mental health issues. Among the individuals who answered the question about mental health, it
is possible to observe in Figure 10 that those who have experienced an insurance disruption over
the past 12 months are less likely to seek help from a Mental Health Practitioner (only 37 percent)
than those who have not experienced an insurance disruption (50 percent).
Figure 10. Insurance disruption is associated with a lower likelihood of seeking help from
a Mental Health Practitioner
Have you ever sought treatment for behavioral or emotional health at the following...?
CHNA Report—2018-2019 2150.2%
36.8%
Insurance Disruption Consistently Insured
CHNA Report—2018-2019 22II. Lifestyle and Healthy Behavior
Following access to health care and services, the second main category of findings relate to the
lifestyles and healthy behaviors of McLennan County residents. In concert with prior CHNA data
and current health indicators for the county, this area continues to be of importance. The 2018-
19 CHNA survey results are sub-divided below into findings related to overall quality of health,
physical activity, healthy eating habits, and smoking habits.
II.I. Overall Quality of Health
Self-reported health has been recognized as the best indicator to predict overall quality of health
(Idler & Benyamini, 1997). Following international and national guidelines, respondents were
asked to define their general health within one of five categories. In the table 5, the majority of
respondents self-reported their health as “Very Good” (33 percent) or “Good” (32 percent). Only
about 15 percent respondents reported their health as “Fair” and about 4 percent reported their
health as “Poor.”
Table 5. Self-reported Health
Would you say that in general your health is...?
Response N Percentage
Excellent 118 15.4
Very Good 253 33.1
Good 250 32.7
Fair 114 14.9
Poor 30 3.9
However, among respondents who reported their health as either “Fair” or “Poor”, there was a
higher likelihood of having suffered insurance disruption. This was the case for approximately 20
percent in each of those two groups. Contrarily, less than 10 percent of those who rated their
health as “very good” or “excellent” had experienced insurance disruption. This highlights an
unfortunate truth in the community, namely that those with the greatest needs tend to have the
fewest resources.
Figure 11. Worse Self-reported Health is associated with experiencing Insurance Disruption
over the previous 12 months
CHNA Report—2018-2019 23You can also read