Jessiman, P. E., Powell, K., Williams, P., Fairbrother, H., Crowder, M., Williams, J. G., & Kipping, R. (2021). A systems map of the determinants ...
←
→
Page content transcription
If your browser does not render page correctly, please read the page content below
Jessiman, P. E., Powell, K., Williams, P., Fairbrother, H., Crowder, M.,
Williams, J. G., & Kipping, R. (2021). A systems map of the
determinants of child health inequalities in England at the local level.
PLoS ONE, 16(2), [e0245577].
https://doi.org/10.1371/journal.pone.0245577

Publisher's PDF, also known as Version of record
License (if available):
CC BY
Link to published version (if available):
10.1371/journal.pone.0245577

Link to publication record in Explore Bristol Research
PDF-document

This is the final published version of the article (version of record). It first appeared online via Public Library of
Science at https://journals.plos.org/plosone/article?id=10.1371/journal.pone.0245577#sec027 . Please refer to
any applicable terms of use of the publisher.

University of Bristol - Explore Bristol Research
General rights

This document is made available in accordance with publisher policies. Please cite only the
published version using the reference above. Full terms of use are available:
http://www.bristol.ac.uk/red/research-policy/pure/user-guides/ebr-terms/
PLOS ONE

                                                       RESEARCH ARTICLE

                                                       A systems map of the determinants of child
                                                       health inequalities in England at the local level
                                                       Patricia E. Jessiman ID1☯*, Katie Powell2☯, Philippa Williams ID1, Hannah Fairbrother3,
                                                       Mary Crowder2, Joanna G. Williams1, Ruth Kipping1
                                                       1 Department of Population Health Sciences, University of Bristol, Bristol, United Kingdom, 2 School of
                                                       Health and Related Research, University of Sheffield, Sheffield, United Kingdom, 3 Health Sciences School,
                                                       University of Sheffield, Sheffield, United Kingdom

                                                       ☯ These authors contributed equally to this work.
a1111111111                                            * Tricia.Jessiman@bristol.ac.uk
a1111111111
a1111111111
a1111111111
a1111111111
                                                       Abstract
                                                       Children and young people in the UK have worse health outcomes than in many similar
                                                       western countries and child health inequalities are persistent and increasing. Systems think-
                                                       ing has emerged as a promising approach to addressing complex public health issues. We
    OPEN ACCESS                                        report on a systems approach to mapping the determinants of child health inequalities at the
Citation: Jessiman PE, Powell K, Williams P,           local level in England for young people aged 0–25, and describe the resulting map. Qualita-
Fairbrother H, Crowder M, Williams JG, et al.          tive group concept mapping workshops were held in two contrasting English local authorities
(2021) A systems map of the determinants of child
                                                       with a range of stakeholders: professionals (N = 35); children and young people (N = 33)
health inequalities in England at the local level.
PLoS ONE 16(2): e0245577. https://doi.org/             and carers (N = 5). Initial area maps were developed, and augmented using data from quali-
10.1371/journal.pone.0245577                           tative interviews with professionals (N = 16). The resulting local maps were reviewed and
Editor: Fiona Cuthill, University of Edinburgh,        validated by expert stakeholders in each area (N = 9; N = 35). Commonalities between two
UNITED KINGDOM                                         area-specific system maps (and removal of locality-specific factors) were used to develop a
Received: July 13, 2020                                map that could be applied in any English local area. Two rounds of online survey (N = 21; N
                                                       = 8) experts in public health, local governance and systems science refined the final system
Accepted: January 5, 2021
                                                       map displaying the determinants of child health inequalities. The process created a map of
Published: February 12, 2021
                                                       over 150 factors influencing inequalities in health outcomes for children aged 0–25 years at
Peer Review History: PLOS recognizes the               the local area level. The system map has six domains; physical environment, governance,
benefits of transparency in the peer review
                                                       economic, social, service, and personal. To our knowledge this is the first study taking a sys-
process; therefore, we enable the publication of
all of the content of peer review and author           tems approach to addressing inequalities across all aspects of child health. The study
responses alongside final, published articles. The     shows how group concept mapping can support systems thinking at the local level. The
editorial history of this article is available here:   resulting system map illustrates the complexity of factors influencing child health inequali-
https://doi.org/10.1371/journal.pone.0245577
                                                       ties, and it may be a useful tool in demonstrating to stakeholders the importance of policies
Copyright: © 2021 Jessiman et al. This is an open      that tackle the systemic drivers of child health inequalities beyond those traditionally associ-
access article distributed under the terms of the
                                                       ated with public health.
Creative Commons Attribution License, which
permits unrestricted use, distribution, and
reproduction in any medium, provided the original
author and source are credited.

Data Availability Statement: The data for this         Introduction
study is now available in the data repository
ReShare http://doi.org/10.5255/UKDA-SN-854532          Children and young people’s health in the UK is in crisis, with worse outcomes than in many
https://reshare.ukdataservice.ac.uk/854532/.           similar Western countries and increasing health inequalities between children and young

PLOS ONE | https://doi.org/10.1371/journal.pone.0245577 February 12, 2021                                                                                    1 / 25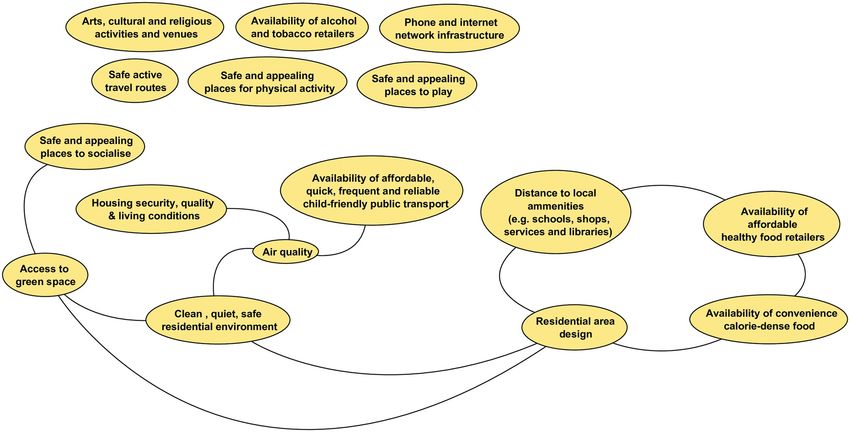
PLOS ONE                                                                                                   Mapping the determinants of child health inequalities

Funding: This study is funded by the National          people (CYP) from the least and most deprived areas of the UK [1,2]. The situation is exempli-
Institute for Health Research (NIHR) School for        fied by the infant mortality rate (IMR), one of the most important indicators of overall popula-
Public Health Research (Grant Reference Number
                                                       tion health, which had been improving steadily in the UK up to 2014 but has since stagnated,
PD-SPH-2015). The award went to RK, HF and KP.
https://sphr.nihr.ac.uk/. The views expressed are      and in England the IMR has increased [3]. This stagnation in IMR has not been seen in com-
those of the authors and not necessarily those of      parable European countries and the UK now has one of the worst IMRs in Europe [4].
the National Institute of Health Research or the       Highlighting the rising inequalities, an analysis of the increase in IMR in England from 2014–
Department of Health and Social Care. The funders      2017 found that it disproportionality affected the poorest areas of the country, while many
had no role in study design, data collection and
                                                       affluent areas saw the IMR unaffected [5]. This trend is echoed across many health outcomes
analysis, decision to publish, or preparation of the
manuscript.
                                                       for CYP, including mental health, obesity and oral health [6–8]. Child health outcomes also
                                                       vary across ethnicity, with CYP from Black and Minority Ethnic groups consistently at a disad-
Competing interests: The authors have declared
                                                       vantage [9]. These inequalities are persistent and increasing.
that no competing interests exist.
                                                           These trends are of public health concern, not only for their impact on CYP’s present health
                                                       but also for their future health status, with CYP who experience disadvantage in the early years
                                                       having a higher risk of premature death in adulthood [10]. Over the last 20 years evidence
                                                       reviews have repeatedly emphasised the need to provide better support at an early stage in chil-
                                                       dren’s lives if we are to have any chance of significantly reducing the inequalities in life chances
                                                       experienced by people in England [11–13]. Despite this, essential services for child health are
                                                       being cut, with disadvantaged areas often seeing the steepest cuts [14,15]. The health and social
                                                       care reforms in 2013 transferred responsibility for public health services to local government
                                                       authorities, and presented an opportunity for them to align the commissioning of preventative
                                                       health services, for example health visiting, with their existing responsibilities including in spa-
                                                       tial planning, licensing, environmental health, early years’ education provision and early inter-
                                                       vention work with children and families. However, emerging evidence suggests that while
                                                       some alignment of public health priorities is being achieved at a local authority level, commis-
                                                       sioning and decision-making relating to the health of CYP has become increasingly frag-
                                                       mented [16]. In England all NHS organisations are working closely with local authorities to
                                                       coordinate public sector services with the perspective of working together as a system. The
                                                       aspiration is that by 2021 all areas will have formed an Integrated Care System (ICS) [17]. The
                                                       landscape for CYP health policy locally is complex, comprising a large number of organisa-
                                                       tions with different organisational structures, professional cultures and priorities. Such a land-
                                                       scape is particularly challenging when seeking to improve and reduce inequalities in children
                                                       and young people’s health. Child health inequalities are complex; they are created, maintained
                                                       and exacerbated through multiple, related pathways [10]. One way to understand and work
                                                       with this complexity and address the fragmentation of child health policy and practice is to
                                                       apply a systems-based approach to identifying child health inequalities at the local level.
                                                           Systems thinking has emerged as a promising approach to addressing complex public
                                                       health issues in recent years. It conceptualises poor health and health inequalities as outcomes
                                                       of a multitude of interdependent elements within a connected whole (a system] [18]. Systems
                                                       thinking encourages the consideration of how different actors (individuals, populations, or
                                                       organisations) relate to one another and how activities in one part of a system may affect
                                                       another. Applying a systems lens to thinking about public health challenges can support the
                                                       evaluation of policy and programmes, and the development of interventions which recognise
                                                       wider system influences [19–21]. Within public health, systems thinking has often been
                                                       applied through taking a ‘whole-system approach’, conceptualised in a recent systematic
                                                       review as those approaches that “consider the multifactorial drivers of public health or the
                                                       social determinants of health, that also involve transformative co-ordinated action (including
                                                       policies, strategies, practices) across a broad range of disciplines and stakeholders, including
                                                       partners outside traditional health sectors” [22]. One tool to aid systems thinking is the systems
                                                       map. The Foresight Obesity map [23], for example, has facilitated systems thinking and the

PLOS ONE | https://doi.org/10.1371/journal.pone.0245577 February 12, 2021                                                                                 2 / 25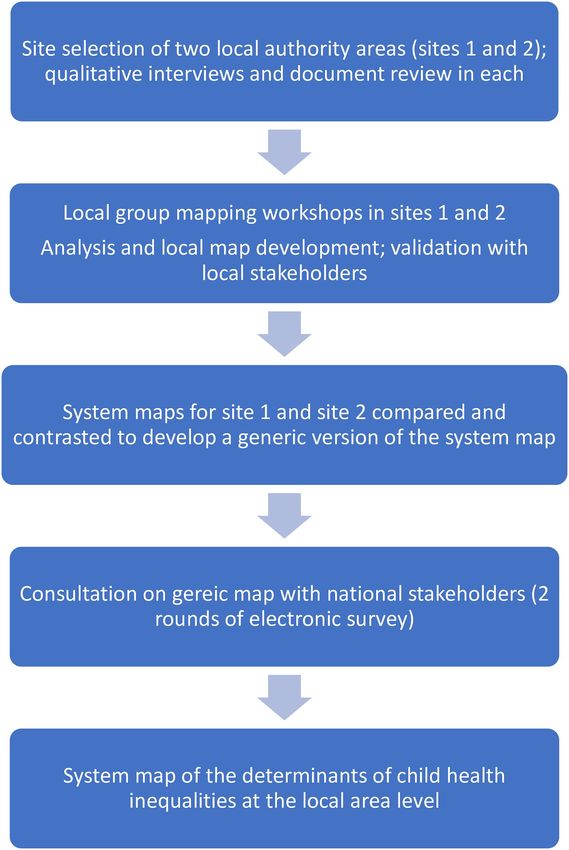
PLOS ONE                                                                                      Mapping the determinants of child health inequalities

                                           hypotheses of solutions to rising obesity trends which range from individual behavioural
                                           change through to population-level policy approaches [24]. System mapping draws on concept
                                           mapping techniques [25] and other qualitative research methods such as reviewing the litera-
                                           ture, interviews with specialists, and workshops with stakeholders.
                                              The majority of published studies using system approaches to address child health have
                                           focused on healthy eating and obesity, with a paucity of studies using systems approaches to
                                           other child health outcomes [19,21,26–29]. The current study seeks to extend the scope of a
                                           systems mapping approach beyond single child health outcomes to address inequalities in
                                           child health more broadly. In defining child health, we followed the example of the National
                                           Health Service (NHS) by including all children and young people aged 0–25 years [30]. The
                                           overall aim of the current study was to scope and create a child health system map for use at a
                                           local level in order to inform opportunities for effective interventions at a systems level to
                                           reduce child health inequalities. It sought to capitalise on the public health remit of local gov-
                                           ernment in England, and the need to address persistent and increasing child health inequality
                                           through partnerships between a range of local organisations with responsibility for child
                                           health. The purpose of this paper is to describe a systems approach to mapping the determi-
                                           nants of child health inequalities at the local level in England for young people aged 0–25, and
                                           present and describe the resulting map.

                                           Method
                                           This study used qualitative methods and we have followed the Consolidated Criteria for
                                           Reporting Qualitative Research (COREQ) checklist [31]. All participants were sent detailed
                                           information leaflets about the study and had the opportunity to ask the research team ques-
                                           tions about participation. All provided written informed consent prior to participation in the
                                           interviews, workshops (signed consent form), or online survey (online consent form). Where
                                           participants were under 16 years of age, parents/carers were also sent study information and
                                           had the opportunity to decline consent for their child to participate (the child also had to give
                                           written consent prior to participation). The study received ethical approval from the Univer-
                                           sity of Sheffield School of Health and Related Research Ethics Committee on 16th March 2019
                                           (ref 025460).

                                           Research team
                                           The research team comprised academics from public health centres at two English universities.
                                           They are experienced in the application of qualitative methods (PJ, KP, HF, MC) and public
                                           health research (RK, KP, HF, PW, JW). PJ and KP are joint senior authors of this paper.

                                           Study design
                                           We used a qualitative soft systems method, based on group concept mapping [25] to develop a
                                           system map of child health inequalities at the local level. Group concept mapping is a partici-
                                           patory method that takes a staged approach to the development of a conceptual framework for
                                           how a group views a topic [32–34]. The approach was chosen to enable us to develop consen-
                                           sus regarding depiction of the child health system, which is important in the development of a
                                           shared understanding of the problem of child health inequalities among people working to
                                           address them. Initial fieldwork was undertaken in two contrasting local areas to develop local-
                                           ity-specific maps, which were then used by the research team to develop a single generic ver-
                                           sion that was reviewed and amended through online consultation with academics policy and
                                           practice experts. A flowchart depicting the main stages of the study methods is shown in Fig 1,
                                           and each stage of the methodology is described in detail below.

PLOS ONE | https://doi.org/10.1371/journal.pone.0245577 February 12, 2021                                                                    3 / 25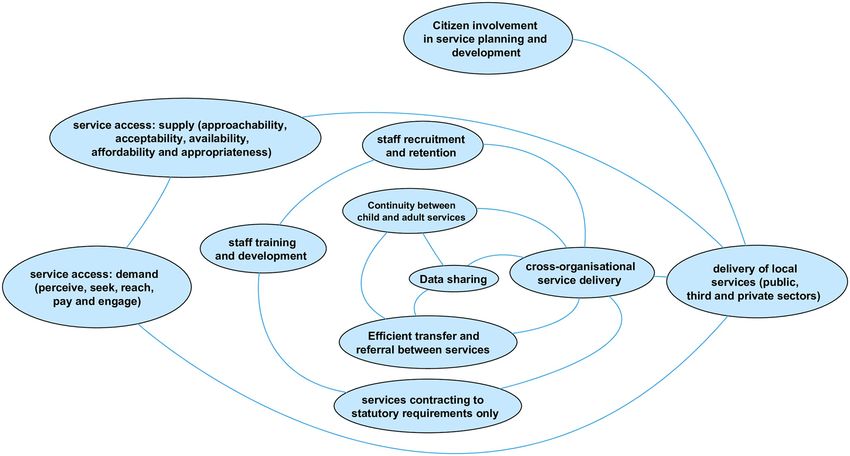
PLOS ONE                                                                                       Mapping the determinants of child health inequalities

                                           Fig 1. Overview of methods.
                                           https://doi.org/10.1371/journal.pone.0245577.g001

                                           Site selection
                                           Two local authority areas were selected for the development of locality-specific system maps.
                                           These areas were chosen for their contrasting geography, local governance arrangements and

PLOS ONE | https://doi.org/10.1371/journal.pone.0245577 February 12, 2021                                                                     4 / 25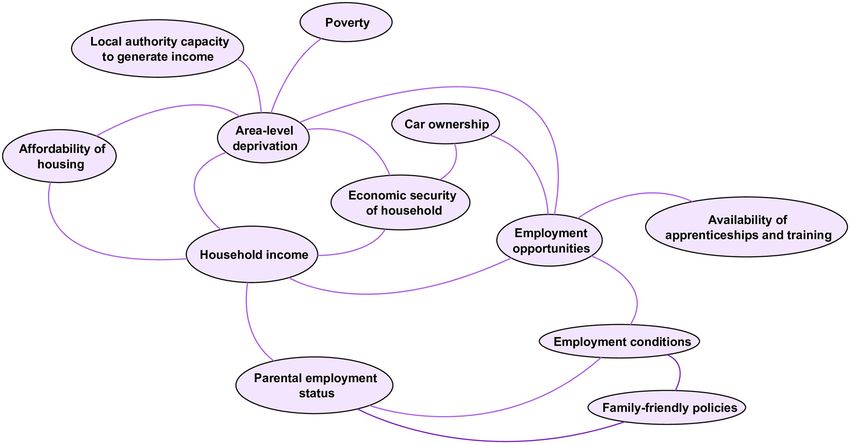
PLOS ONE                                                                                      Mapping the determinants of child health inequalities

                                           population demographics (to help ensure that subsequent development of a generic version of
                                           the system map was informed by contrasting locality-specific maps). Site 1 was a city in the
                                           North of England, Site 2 was a rural county in the South West. The sites also vary in gover-
                                           nance (unitary and two-tier authority), level of deprivation according to the Indices of Multi-
                                           ple Deprivation for local authorities [35], and proportion of Black and Ethnic Minority
                                           residents [36].
                                              Sites were approached early Spring 2019. Approval for participation in the study was
                                           granted by the local authority Director of Public Health in each area and by Directors in the
                                           Clinical Commissioning Group (CCG) for each area. Fieldwork was undertaken between May
                                           2019 and February 2020.

                                           Qualitative interviews and document review
                                           Face to face, in-depth qualitative interviews were held in each local area with senior decision
                                           makers with responsibility for child health. Participants were recruited through our lead con-
                                           tacts in the public health departments and local CCG. Participants were sent an information
                                           sheet about the study by email in advance of the interview and gave written consent to partici-
                                           pate. A topic guide was developed for the interviews that covered the local context, key chal-
                                           lenges, priorities and recent key initiatives in relation to child health outcomes and inequalities
                                           for CYP aged 0–25, and experience of whole-system approaches to child health (generally, and
                                           specific to the local area). The interviews were also used to identify key local documentation
                                           (policy and strategy documents), and further participants for both interviews, and involvement
                                           in mapping workshops. Interviews lasted between 30–60 minutes and were digitally recorded
                                           and transcribed verbatim. The transcripts were reviewed for key information related to the
                                           local child health context; and for sections of data that provided additional information on the
                                           local determinants of child health inequalities (described below).
                                              Local documents (e.g. Children and Young People Plan; Health and Wellbeing Strategy;
                                           Clinical Commissioning Group strategy) were reviewed to support the researchers’ under-
                                           standing of the local context to enable facilitation of the mapping workshops and interpreta-
                                           tion of results.

                                           Group mapping workshops
                                           Group concept mapping has long been used in public health to address issues with a range of
                                           divergent stakeholders who have an interest in a particular topic, or are affected by an outcome
                                           [25,37]. It is valued as a tool for strategic planning, breaking down broad issues into their com-
                                           ponent parts [38] and has the advantages of eliciting and integrating tacit knowledge from a
                                           broad range of stakeholder-types (including policy makers, practitioners and commissioners),
                                           can be used with the community to support their involvement in decision-making, and can act
                                           as a basis for practical decision making in a public health context [39].
                                               Group concept mapping typically involves the following steps: agreeing the focus and the
                                           primary question(s) of interest; individual brainstorming and generation of statements; group
                                           structuring of statements; rating and sorting using multidimensional scaling and cluster analy-
                                           sis; and final development of the map [33]. However the method can be successfully adapted
                                           from the original approach to include data generated through face to face brainstorming, qual-
                                           itative interviews, and published literature; adapting or omitting the rating phase, and use of
                                           surveys and interviews to gain structured feedback. These adaptions allow for greater accom-
                                           modation of diverse perspectives, the inclusion of data from multiple modalities, and addi-
                                           tional input from experts, end users and the public during more than one step in the
                                           traditional group concept mapping approach [37]. Accordingly, we adapted Kane and

PLOS ONE | https://doi.org/10.1371/journal.pone.0245577 February 12, 2021                                                                    5 / 25
PLOS ONE Mapping the determinants of child health inequalities
Trochim’s [25] group concept mapping approach by supplementing the early stages with qual-
itative data from interviews with expert stakeholders, and a documentary review of key policies
and strategies related to child health in each local site. These informed recruitment to, and
facilitation of, group mapping workshops in each site. We structured the maps using qualita-
tive thematic analysis, informed by an established framework from published literature. The
initial structures of the local site maps were refined by local stakeholders at later meetings.
Group mapping workshops were held in each site with different stakeholder groups: profes-
sional staff from the local authority, NHS and CCG, third sector organisations, and elected
members with responsibility and expertise in child health; children and young people recruited
through local youth voice and empowerment organisations; and parents/carers. A framework
and guidance document for the group concept mapping workshops was developed by PW and
PJ and included guidance on workshop facilitation (informed by Hovmand et al’s group
model building facilitation handbook [40]); pre-workshop preparation including recruitment
and information for participants; and workshop tasks and timings. A separate workshop guid-
ance document for mapping workshops with children and young people was developed by KP
and MC in consultation with our community advisor, and tested and refined through public
involvement and engagement activities with children and young people.
One week prior to the professionals’ workshops, participants were sent an email with basic
information about whole systems approaches in public health, and asked to consider the fol-
lowing two questions:
a. What factors drive child health and wellbeing in [Site name]?
b. What factors drive health inequalities between different groups of children and young people
in [Site name]?
The process for CYP workshops differed slightly, in that questions were reworded to be
more age-appropriate and were not shared in advance with participants. Instead CYP work-
shops included an initial ‘warm-up question’ (“What does good health and well-being mean to
you”) to encourage participants to think broadly about the meaning of health and well-being
before addressing the main workshop questions: ‘What influences good health and wellbeing
for children and young people in [Site name]?’; and ‘Why do some children and young people in
[Site name] have better health and wellbeing than others?’
Participants were encouraged to consider as a factor anything that could be a determinant
of child health outcomes. Examples provided to participants included services (health, educa-
tion, transport etc.; local environmental factors (green space, air quality); behaviours (activity
level, diet), and influences (peers, family, community etc), but participants were not con-
strained to these and encouraged to think broadly at this stage. Workshops lasted for between
one to two hours and involved the following steps:
1. An introduction to the research team members present; overview of the workshop includ-
ing timings and collecting consent forms.
2. A short presentation led by the research team that included an introduction to systems
thinking and its application in public health, and the group concept mapping process.
3. Generating influencing factors: Individual generation of factors in response to questions a)
and b) above. Participants worked individually, and were encouraged to write each factor
on a blank index card. Facilitator prompts during this task included:
• Generate as many as factors as you can think of
PLOS ONE | https://doi.org/10.1371/journal.pone.0245577 February 12, 2021 6 / 25PLOS ONE Mapping the determinants of child health inequalities
• Factors should be within the control or influence of agencies at the local level (e.g. the local
authority, NHS, CCG, third sector organisations)
• Think specifically about [Site name]; not any local area
• There are no bad ideas, write down anything you feel is important
• The factors need to be dynamic (variables that are capable of change)
• Consider all aspects of health
• Include all aspects of inequalities
• Consider all children and young people in (Site name) aged 0–25 years
4. Sharing and clustering: Participants worked in small groups facilitated by one of the
researchers. They were invited in turn to share a single factor and explain why they had
written it and its relationship to questions a) and b) above. Participants were also invited to
consider the relationship with other factors already discussed. For each factor, facilitators
prompted participants to be clear on i) what aspect of health is affected? How? Why? ii) what
are the relationships with other factors on the table and iii) What element of inequality is
affected? At the end of each explanation the participant was invited to place the index card
on the table, and if appropriate, place the card next to other factors they considered closely
related. Participants took turns to share factors until they were all complete (or time ran
out). They were encouraged to discard index cards which duplicated factors already dis-
cussed, and to write down new factors that occurred to them during this sharing and clus-
tering process. This stage was the longest and took the majority of workshop time.
5. Sharing discussions: Where time allowed, group facilitators gave a brief summary of the factors
on the table and any clusters or groupings that emerged, the main issues relating to inequali-
ties, and how much consensus or differences in perspective there was in the group discussion.
The group discussions were audio recorded and augmented with detailed notes made dur-
ing the sharing and clustering stage by a researcher not involved in facilitating the groups, to
ensure the narrative around each factor was captured, including links to child health out-
comes, inequalities, and to other factors already on the table.
Analysis and local map development
Following the initial group mapping workshop with professionals in each site, the index cards
with factors, group transcripts and detailed notes of the narrative around each one as described
by participants were carefully tabulated by at least two members of the research team (MC, KP
and HF Site 1; PJ and PW in Site 2). We used a systematic method to tabulate, for each factor,
the factor name (copied verbatim at this stage), its effect(s) on a child health outcome or
behaviour, links or relationship with other factors, and a summary of the narrative, all as
described by workshop participants. In this initial stage, factors were frequently linked by par-
ticipants to several effects and other factors, all of which were captured and tabulated. Exam-
ples are shown in Table 1 below.
This process was continued for all factors raised by participants during the group mapping
workshops. As participants worked in small groups during the sharing and clustering stage,
there was some inevitable duplication of factors. Each duplicate -pair was compared to review
the narrative, effect(s) and link(s) to other factors to ensure that no data was lost as duplicate
factors were removed. The same process was followed for workshops held with other stake-
holder groups in each site (children and young people, and carers).
PLOS ONE | https://doi.org/10.1371/journal.pone.0245577 February 12, 2021 7 / 25PLOS ONE Mapping the determinants of child health inequalities
Table 1. Examples of factors provided by workshop participants.
Factor name (as Narrative (from workshop participants) Effect Links to other factors
written on card)
Availability of calorie- In the most deprived communities there is more likely to be a higher number of fast food Poor diet Neighbourhood deprivation
dense food joints–a neighbourhood with high deprivation is less likely to have healthy food choices. Obesity Number of fast food outlets in
Leads to poor diet and obesity. residential areas
Availability of healthy food
Education about Poor education about the importance of cleaning teeth leads to poor dental carer and oral Oral health Access to NHS dentists
cleaning teeth health. This is also not helped by limited access to NHS dentists in some areas, and very Emotional Access to orthodontal care
limited access to orthodontists. Young people end up with poor teeth, which is embarrassing wellbeing
and upsetting
Housing quotas The district council has a lot pressure to meet UK government housing quotas, which results Housing quality
in limited housing types. Land for building is difficult to acquire, so builders want to Limited access to amenities
maximise return. We have a lot of a very specific type of housing here, is crammed in,
usually very small—lack of local amenities and recreational and around it
https://doi.org/10.1371/journal.pone.0245577.t001
Data from the workshops was augmented with data from the initial interviews with senior
decision makers with responsibility for child health, and additional factors and relationships
were identified in the transcripts of these interviews.
In each of the two sites, once the data from group mapping workshop, and qualitative inter-
views had been tabulated, further thematic analysis of the factor lists with their associated nar-
rative and links was undertaken to consolidate factors. Guided by a commitment to privileging
our participants’ perspectives, we sought to ensure our analysis was data-driven (an inductive
approach). However, following a review of existing frameworks of the determinants of child
health inequalities and expert consultation, we used Goldfeld et al’s conceptual model of
neighbourhood effects influencing early childhood development to organise the factors identi-
fied by participants and ‘clustered’ them into meaningful sub-systems or ‘domains’ [41]. Our
approach therefore cohered with an appreciation that thematic analysis is ‘actively constructed’
by the researcher and that ‘analysis lays over bits of data to give them shape without doing vio-
lence to them’ [42]. Goldfeld’s conceptual model offered the ‘best fit’ for working with our data
as the domains echoed our data to a large extent.
Factors were entered as nodes on the mapping software VUE, a free concept and content
mapping tool developed by Tufts University [43], and links drawn where indicated by the data
analysis. An initial, locality-specific system map of the determinants of child health inequalities
was developed for each site.
Validation with professional staff in local areas
These initial locality-specific maps were presented back to professional staff in each site at a
subsequent meeting. During these meetings, the researchers explained the map structure
(domains) and consolidation of factors. Participants were invited to review the map and com-
ment on factor names, whether they had been grouped in the correct domain, and any missing
factors within each domain. Participants could also amend links between factors, and com-
ment on the map as a whole. Detailed notes were taken from each group, and the map refined
by the research team to reflect the comments.
Development of a generic version from site-specific maps
At the end of the stages described above we had final versions of two locality-specific system
maps of the determinants of child health inequalities at the local area level. The two maps were
PLOS ONE | https://doi.org/10.1371/journal.pone.0245577 February 12, 2021 8 / 25PLOS ONE Mapping the determinants of child health inequalities
compared by researchers who had led fieldwork and map development in each site (PJ, MC,
PW and KP) to determine commonalities and discrepancies between factors. The aim of this
was to remove any area-specific factors and combine the remaining factors to develop a more
‘generic’ version of the child health system map that may be applied to any English local
authority area. This was done alongside the tables of factors, narratives and links described
above. A comparison of the two area maps revealed four categories:
Same: where factors had the same name and meaning (derived from the narrative), and were
placed within the same domain on both site maps.
Similar-Extension: where factors fell into the same domain, but where one site had consoli-
dated factors differently compared to the other. This meant that one map showed more
detail expressed as a greater number of factors, than the other. Most factors across the two
maps fell into this category.
Different: The factor only appeared in one site.
Conflict: The factor appeared in both sites, but had been assigned to different domains.
Where factors fell into the similar-extension category, in most cases the decision was taken
to use the greater number of factors so that more detail was shown on the generic map. Factors
under the ‘different’ category were examined to determine whether they were site-specific (i.e.
factors driven by very localised circumstances and unlikely to be generalisable to other areas)
or simply ones that had not emerged during data collection in one of the sites but may likely
apply. Only the latter were included in the generic map. Where factors had been assigned to
different domains, the team reviewed the narrative and links associated with it to determine
the ‘best fitting’ domain for the generic map. Once the final list of factors had been agreed,
links and effects for all were consolidated from the area-specific maps and an initial version of
the generic map developed in VUE.
Online survey
The first version of this generic map was shared with national experts in child health, health
inequalities and system mapping through two rounds of an online survey using the Jisc Online
Surveys platform [44]. The survey questions were developed by the research team and piloted
with academic colleagues (the questions were qualitative). Seventy-two participants were
directly invited by email to take part, and encouraged to forward survey details to colleagues
not on the original invitation. Invited participants included experts in child health, health
inequalities, and system mapping from academia; national leaders and decision makers in
child health from Public Health England, the Department of Health, the NHS, the Local Gov-
ernment Association, and leading children’s charities; local policy makers commissioners and
practice collaborators including Directors of Public Health, and practice collaborators working
in child health settings.
The first survey was open between December 2019 and January 2020 and provided an over-
view of systems thinking in public health and the study aims, and explained the methods used
to develop the generic map. Participants were shown the whole map and invited to comment
on individual domains. For each domain, participants were asked a) whether any factors were
missing b) if so, how these new factors linked to others already on the map and c) if any factors
or links were incorrect. Based on the feedback received, further refinements were made to the
generic map and a second version sent to the same group of participants in a second online
survey in January and February 2020. Changes to the first version were outlined in detail and
respondents asked to indicate their agreement (or not). In addition, participants were asked a
PLOS ONE | https://doi.org/10.1371/journal.pone.0245577 February 12, 2021 9 / 25PLOS ONE Mapping the determinants of child health inequalities
series of open questions about the utility of the map, including its capacity to represent the
needs of subpopulations of children and young people; its potential use at the local level,
including informing discourse and identifying potential strategies to address child health
inequalities.
Details of both surveys are in included in S1 Appendix.
Results
Participants
Local area qualitative interviews. A total of 16 professional staff across the two local sites
participated in qualitative interviews prior to mapping workshops. In site 1, eight interviews
were conducted with professionals, including one from the NHS (acute hospital Chief Execu-
tive) and seven from the local authority (Director of Public Health, two Health Improvement
Principals, three Heads of Commissioning and one Commissioning Manager). In Site 2, eight
participants were recruited, including three from the local authority (Deputy Director of Chil-
dren’s Services, Consultant in Public Health, and the Early years and Primary Adviser); three
from the Clinical Commissioning Group (senior managers and Directors with responsibility
for quality, nursing, mental health, learning disabilities and women and children’s health) as
well as a Police Superintendent (also a member of the local Child Partnership Board), and the
Chief Executive of a third sector organisation delivering mental health services to CYP across
the county.
Group concept mapping workshops. Three mapping workshops were held in each site,
with 73 participants in total. In Site 1, one workshop was held with professional staff and two
with children and young people; in Site 2, one workshop was held with professional staff, one
with children and young people, and one with parents/carers. A diverse sample of senior deci-
sion makers with responsibility for child health from across the local authority (LA), Clinical
Commissioning Group (CCG) and NHS, third sector organisations, police and fire service,
schools, and elected officials was achieved in both sites. The sample of CYP and carer partici-
pants achieved across the two sites represented children of different ages and ethnic back-
grounds. Details of participants in each workshop are shown in Table 2.
Table 2. Workshop participants.
Group concept mapping Site 1 Site 2
workshops -participant
type
Professional staff N = 22 N = 13
(N = 35) (Includes professional staff from the local (Includes professional staff from the local
authority, CCG, NHS, elected councillors, authority, CCG, NHS, elected councillors,
third sector and police) third sector, and fire service)
Children and Young N = 19 (across 2 workshops) N = 14
People (N = 33) (Age range 12–24 years; 7 female, 1 non- (Age range 10–20 years; 9 female; 3 from
binary; 8 from Black and Minority Black and Minority ethnicity background)
ethnicity background (1 undeclared
ethnicity)
Parents/Carers N = 5 - N=5
(3 female; all white British; All parent/
carers of children with special educational
needs and disabilities aged between 7–22
years)
Total participants N = 41 N = 32
https://doi.org/10.1371/journal.pone.0245577.t002
PLOS ONE | https://doi.org/10.1371/journal.pone.0245577 February 12, 2021 10 / 25PLOS ONE Mapping the determinants of child health inequalities
Validation with professional staff in local areas. Initial maps were presented back to
professional staff in each site. In Site 1, this happened over a series of four meetings, the first a
large group of stakeholders, most of whom had been involved in map development (N = 26)
and the later three with a smaller working group (N = 6). At each meeting the latest version of
the local map was presented for discussion on its accuracy and potential local utility. In site 2,
a single validation meeting was held with nine professional staff who had been involved in
map development.
Online survey. There were 21 participants in the first round of the online survey. Nine of
these were public health academics from English universities (one was also a General Practi-
tioner); 5 from directors or consultants in public health working in English local authorities; 4
national and regional programme leaders from Public Health England (an executive agency of
the Department of Health and Social Care with responsibility for population health and well-
being, and reducing health inequalities); 2 commissioning leads for children and maternity
from CCGs; and one from a director of an independent third sector research organisation.
The second round of the survey had eight respondents, three of whom had also responded
to round one. One was a public health academic; 3 directors or consultants in public health
working in English local authorities; 1 programme leader from Public Health England; 2
commissioning leads for children and maternity from CCGs; and a community paediatrician.
The system map of the determinants of child health inequalities at the local
area level in England
The final map of the determinants of child health inequalities at the local area level, developed
through comparison of the two final locality-specific maps and online consultation with
national experts, has 125 factors arranged across six domains (see S2 Appendix). The map also
shows over 300 links between individual factors that have been made by participants in local
areas or online consultations. The links are made both within and across domains, indicating
the complex interaction of factors across the map. The use of domains is intended to support
understanding of the whole system, and the cross-domain links between factors indicate the
interdependency between those domains.
Goldfield et al’s conceptual model of neighbourhood effects influencing early childhood
development, used to organise the factors identified by participants, has five interconnected
domains: physical, social, service, socio-economic, and governance [41]. Following analysis of
our data from the two sites, we adapted this model by amending the socio-economic domain to
just economic, and moving socio-demographic factors into the social domain to capture the
separate influences of the social world (family, peers and community) within one domain. In
addition, a number of factors did not fit into any of these five domain areas. Some of these
referred to children and young people’s outcomes and behaviours that may be influenced by
factors in other domains, but also may interact and influence each other; a sixth, personal
domain, was added to capture these. The use of this amended framework was accepted by par-
ticipants during validation meetings in both sites, and by participants in the online consulta-
tion of the generic version of the map.
This is a qualitative map. Factors are not weighted by impact on child health inequalities,
and links between them are non-directional and do not attempt to capture causality (i.e. we do
not attempt to indicate whether an increase or decrease in factor A would result in an
increase/decrease in any linked factor B, only that some change will occur). This is due to the
nature of the raw data used to develop the map; while participants in mapping workshops
were asked to indicate links between factors they mostly did so without indicating direction of
PLOS ONE | https://doi.org/10.1371/journal.pone.0245577 February 12, 2021 11 / 25PLOS ONE Mapping the determinants of child health inequalities
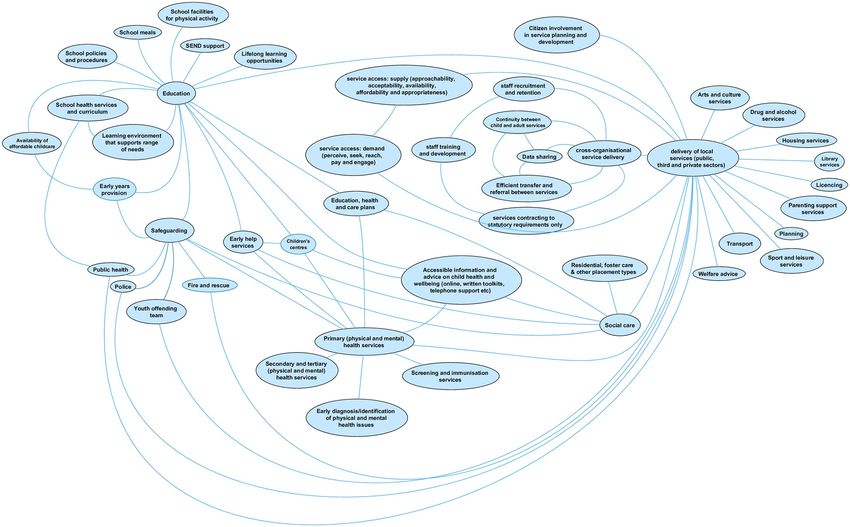
Fig 2. The service domain.
https://doi.org/10.1371/journal.pone.0245577.g002
effects (unless explicitly prompted) and we did not have sufficient data to add directionality to
the links.
The service domain. The service domain (Fig 2) comprises 46 factors and represents the
availability and delivery of services (provided by the public, private and third sectors) at the
local area level that impact on child health outcomes. The raw data that emerged from group
concept mapping workshops produced numerous factors influencing the quality, quantity,
accessibility and/or coordination of individual service types. These were consolidated during
the analysis into factors including staff training and recruitment, data sharing and efficient
transfer and referral between services (including between child and adult services), citizen
involvement, and service accessibility (see Fig 3 below) and linked to the delivery of all local ser-
vices. Service accessibility was a particularly strong concern. In Site 2, this was often in relation
to the rurality of much of the county and the physical distance to services; concerns about
accessibility for differencing subpopulations of children and young people emerged in both
sites. To capture over 30 initial factors that emerged, we applied the conceptualisation of access
to health care developed by Levesque et al [45] to describe both demand- and supply-side fac-
tors of accessibility, again adapting the framework to apply to all services. Supply-side dimen-
sions of accessibility include approachability (transparency, outreach, information and
screening); acceptability (professional values, norms, culture and gender); availability and
accommodation (location, accommodation, opening hours, appointment mechanisms); afford-
ability (direct, indirect and opportunity costs) and appropriateness (quality, adequacy,
PLOS ONE | https://doi.org/10.1371/journal.pone.0245577 February 12, 2021 12 / 25PLOS ONE Mapping the determinants of child health inequalities
Fig 3. Factors influencing the quality, quantity, accessibility and/or coordination of all services.
https://doi.org/10.1371/journal.pone.0245577.g003
coordination and continuity). Demand-side dimensions of accessibility include ability to per-
ceive (literacy, beliefs, trust and expectations); ability to seek (personal and social values; cul-
ture, gender, autonomy); ability to reach (living environment, transport, mobility, social
support); ability to pay; and ability to engage (information, adherence, caregiver support).
The three factors with most links to those in other domains are unsurprisingly health, social
care, and education. The decision to represent all health services by only three separate factors
on the map (primary, secondary and tertiary, and public health) was often commented on by
respondents to the online survey. Several respondents wanted to add more specific health ser-
vice provision into this domain, in particular health visitors and school nurses (perhaps reflect-
ing the number of respondents working in public health). This was a deliberate decision by the
research team, in order to balance specificity with usability of an already complex visualisation.
It will likely also help with generalisability to local areas given that service provision varies by
locality. Further, health, education and social care have joint responsibility (with other ser-
vices) for provision that also emerged as determinants of child health, including safeguarding,
early help services, education, health and care plans (for children and young people with spe-
cial educational needs and disabilities (SEND)). However, the range of service types emerging
from the workshops was much wider than these core three, indicating the wide array of service
provision in the local area perceived to impact on child health outcomes (and inequality of
outcomes). Service types were also added as a result of the online consultation (e.g. library ser-
vices, and children’s centres).
The economic domain. The economic domain (Fig 4) comprises 12 factors associated
with the economic resources available to children and young people, at both the household-
and local area-level. Given what is known about the associations between household income
PLOS ONE | https://doi.org/10.1371/journal.pone.0245577 February 12, 2021 13 / 25PLOS ONE Mapping the determinants of child health inequalities
Fig 4. The economic domain.
https://doi.org/10.1371/journal.pone.0245577.g004
[46] and area deprivation [7,12] with child health inequalities, it is unsurprising that workshop
participants identified area level deprivation and household income as the two factors in the
economic domain with the most links to factors in other domains, particularly health behav-
iours and outcomes in the personal domain. Household income is linked with parental employ-
ment status, but these are themselves influenced by area-level factors including employment
opportunities and conditions. Local authority capacity to generate income relates to the powers
local authorities have to raise additional revenue beyond national Government grants
(national funding grants are considered outside this system given the limited capacity for
change or influence at the local level). It includes measures local areas can take to raise revenue
including the Adult Social Care levy on council tax; the Community Infrastructure Levy; rents,
fees and charges, sales, investments and other contributions.
The governance domain. The governance domain (Fig 5) is concerned with the condi-
tions associated with effective development and implementation of policy to support child
health and reduce inequalities at the local area level. Participants identified that local gover-
nance and leadership will be influenced by factors outside the boundaries of the local system,
in particular by policy and statutory requirements set by national government. Factors
emerged that are associated with people involved in shaping local policy; the prioritisation of
children and health in policy, and alignment of policy across local agencies. Key stakeholders
include locally elected councillors (and in Site 2, cooperation across members elected to two
tiers of local governance was especially salient); those responsible for local leadership of child
health policy (and accountability for this was added during the online survey) and citizens
(including children and young people). The prioritisation of children’s health in local areas is
linked with this leadership, as is allocation of local funds. The array of services identified as
PLOS ONE | https://doi.org/10.1371/journal.pone.0245577 February 12, 2021 14 / 25PLOS ONE Mapping the determinants of child health inequalities
Fig 5. The governance domain.
https://doi.org/10.1371/journal.pone.0245577.g005
important to child health outcomes in the service domain is reflected in the governance
domain by the factors associated with the alignment of policy and strategy across all responsi-
ble local agencies, including those in the public, private, and third sectors (referred to here as
the community and voluntary sector). This is supported by the availability, and sharing, of
data to support this. The key factor at the heart of the governance domain, local policy develop-
ment and implementation, is linked to delivery of local services in the service domain.
The physical domain. The physical domain (Fig 6) includes factors related to the physical
environment in which children and young people live which are broadly split across those
related to safe spaces for social activity, housing, transport and physical infrastructure, and
local amenities. Safety emerged as a key quality for many factors in this domain, and what is
‘safe’ will differ across subpopulations of young people (e.g. different age groups; children with
disabilities). Workshop participants emphasised the importance of local access for play, social
and physical activity, and green space for children and young people’s wellbeing. Online par-
ticipants added arts, cultural and religious activities. Accessible public transport, and safe active
travel routes, are necessary to support CYP access to these spaces. Infrastructure to support
PLOS ONE | https://doi.org/10.1371/journal.pone.0245577 February 12, 2021 15 / 25PLOS ONE Mapping the determinants of child health inequalities
Fig 6. The physical domain.
https://doi.org/10.1371/journal.pone.0245577.g006
mobile telephone and internet access was perceived as crucial to support CYP access to online
social networking and, for residents of all ages, information and communication. Factors con-
cerned with living conditions, not least secure, quality homes and residential area design that
supports a clean, safe living environment, are also prominent. Finally, there are a group of fac-
tors concerned with retailers of healthy (and unhealthy) consumables including healthy food,
fast food, alcohol and tobacco. Unlike Goldfield et al’s conceptual model, levels of crime and
disorder are not included within this domain. Factors related to these were moved into the
social domain in response to feedback from the online survey that suggested these belonged
alongside community-level social influences.
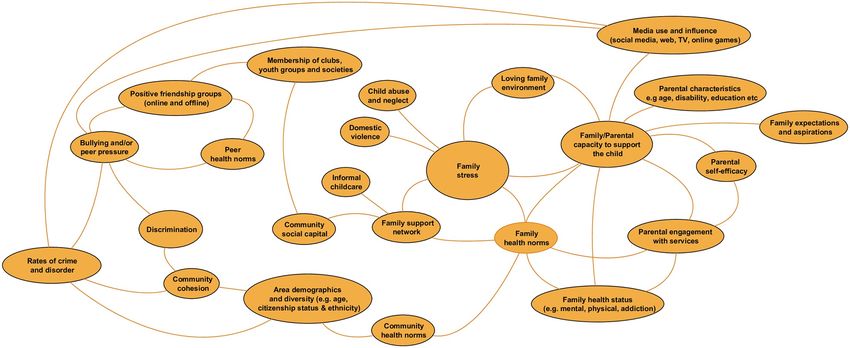
The social domain. Factors in the social domain (Fig 7) are related to the people around
CYP who influence their health behaviours and outcomes, including parents and families, peer
groups, and local communities. It also includes the influences of people CYP encounter online
and in the media, including social media. Most factors emerging from the workshops in this
domain are related to families, in particular parents and caregivers. There were over 40 factors
that related to parent’s status, including their health, education, employment, culture and eth-
nicity, beliefs and values, drug and alcohol use, disability, and more. We have consolidated
these into the factor family/parental capacity to support the child. Other important factors
include family stress (linked to presence of abuse, wider family support and availability of
informal childcare), parental engagement with services, and more simply, the availability of a
loving family environment. At the community level, local area demographics, community cohe-
sion, social capital, and rates of crime and disorder are included. Factors involving peers include
online and offline friendship groups, memberships of clubs, youth groups and societies, and bully-
ing and/or peer pressure.
PLOS ONE | https://doi.org/10.1371/journal.pone.0245577 February 12, 2021 16 / 25PLOS ONE Mapping the determinants of child health inequalities
Fig 7. The social domain.
https://doi.org/10.1371/journal.pone.0245577.g007
Health norms were also perceived as key influencing factors on children and young people’s
behaviours and outcomes and these are included as separate factors (or domains of influence)
for peers, families, and communities.
The personal domain. The personal domain was added to the Goldfield et al model to
capture the factors emerging from workshops that refer to CYP behaviours and outcomes. The
personal domain factors are included on the whole system map (in green), and as most links to
them are cross domain, they are listed in Table 3 (although some inter-domain links were
identified and shown on the whole map).
Some factors in the personal domain are health outcomes e.g. mental health; some are beha-
vioural outcomes with implications for health e.g. diet, alcohol use. Other outcome-types are
developmental and/or educational e.g. achievement/employability, speech and language skill,
reflecting known links between these and later life health inequalities [12].
The factor ‘capacity to get from A to B’ is included as participants in both sites indicated this
was key to accessing services, social spaces, and other amenities. For both young children
Table 3. Personal domain factors.
Safe-sex/contraception use Cooking skills/food knowledge Criminal and/or antisocial behaviour
Alcohol use Diet Risk of victimisation/exploitation
Smoking Physical activity Risk of accident/injury
Gambling Oral hygiene Exclusion/attendance rates (school)
Substance use Medication use Educational achievement/employability
Mental health Vaccination status Speech and language skill
Resilience Sleep
Exam-related stress CYP capacity to get from A-B
Self-esteem Engagement with health services
Self harm
Social contact/isolation
https://doi.org/10.1371/journal.pone.0245577.t003
PLOS ONE | https://doi.org/10.1371/journal.pone.0245577 February 12, 2021 17 / 25PLOS ONE Mapping the determinants of child health inequalities
reliant on caregivers, or older more independent young people, public transport, active travel
routes, and car ownership are the main influencing factors on this.
Online survey respondents noted that many of the factors in the personal domain are out-
side the immediate influence of agencies at the local level. However we include them in the sys-
tem map to illustrate how they have been linked to influencing factors on the map by
respondents in the two local authorities. For example, self-esteem in the personal domain has
been linked to school learning environments, and CYP engagement in governance. Just as paren-
tal engagement with services has been included in the social domain, online respondents also
added that, for older children, their own engagement with services was a key determinant of
health outcomes.
Influences outside the boundaries of the local area system. Two further clusters of fac-
tors emerged during the analysis of local site data that were considered important determi-
nants of inequitable health outcomes by participants, but were not amenable to local influence
and therefore outside the boundaries of the system. The first of these referred to sub-
populations of children and young people defined by personal characteristics and/or
circumstances not amenable to local influence (e.g. gender, ethnicity, children in state care)
but which heightened their risk of poor health and wellbeing outcomes. We consulted with
participants present at the validation and feedback workshops in each local site on how best to
represent these groups. Participants suggested that the map should be viewed through an
‘inequality lens’ according to these different population groups of children and young people.
As an example, factors in the service domain of the map concerned with service accessibility
will have varying importance for CYP of different genders and (dis)abilities. The final list of
subpopulations, including amendments and additions from online survey respondents, is
shown in Table 4 and on the final map as a means of encouraging local decision-makers to
review the differential effects of the child health system on these subpopulation groups. This
list is similar to that presented in recent work by the Children’s Commissioner for England on
identifying and mapping vulnerable groups of children in England [47].
The second emergent cluster referred to societal or global influences, such as climate
change, national government policies (in particular austerity-related measures including wel-
fare reform and cuts to local government grants), which are not amenable to change at the
local level. Local site participants felt strongly that these should be included on the local system
maps to reflect the context in which local agencies are working. There was disagreement
between the two sites about how best to do this, in particular on whether or not links should
be present, to show how societal or global influences impact on factors that are also within the
local area system (e.g. national government grants to local authorities will influence local deci-
sion-making and allocation of spend; austerity measures and welfare reform will influence
household income). Consultation with respondents to the online survey also revealed a mixed
view on this. Disagreements about the boundaries of a system, and whether and how factors
should be included, are common in system approaches [48,49]. We have not included the
links to factors within the local system, but listed them alongside the map as “determinants of
child health inequalities outside of the immediate influence of agencies at the local level” (see
Table 4).
Discussion
This paper presents the results of a qualitative study conducted with a wide range of stakehold-
ers (children and young people, carers, professional staff from the local authority, NHS and
CCG, third sector organisations, and elected members with responsibility and expertise in
child health) from two contrasting English local areas. A group concept mapping approach has
PLOS ONE | https://doi.org/10.1371/journal.pone.0245577 February 12, 2021 18 / 25You can also read