Local Development Strategy 2016 - Fisheries Local Action Group - Bord Iascaigh Mhara
←
→
Page content transcription
If your browser does not render page correctly, please read the page content below
Fisheries Local Action Group
Local Development
     Strategy 2016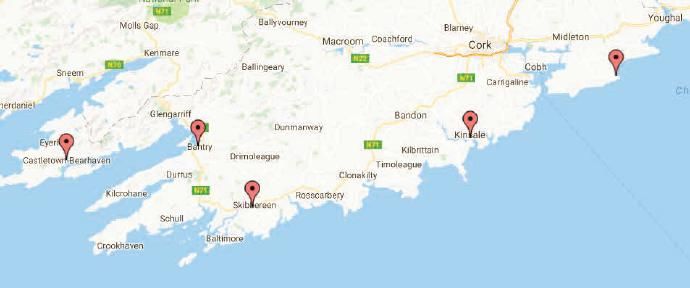
This an edited version of the full FLAG South Local Development Strategy produced to inform
potential project applicants of the themes and priorities contained therein. The full text of all
FLAG strategies and their appendices may be found on www.bim.ie. E & O E.

The development of this Local Development Strategy by FLAG South was facilitated through the
provision of preparatory support as part of Ireland’s European Maritime and Fisheries Fund
Operational Programme 2014-2020, co-funded by the Exchequer and European Union. This
Strategy was 100% funded under that Programme. This Strategy covers the period of the
Programme and is intended to guide FLAG South in prioritising, selecting and supporting projects
with EMFF funds in its FLAG territory.
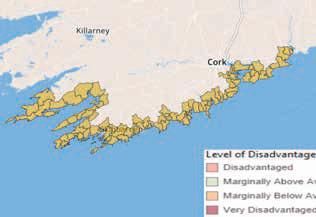
Table of Contents

1   THE DEFINITION OF THE STRATEGY AREA2
    1.1   Introduction                                                                      2
    1.2   Description of the FLAG Area                                                      2
    1.3   Confirmation of Compliance of FLAG Area                                           3
    1.4   Coherent Sub-Areas                                                                3

2   ANALYSIS OF THE DEVELOPMENT NEEDS                                                       4
    2.1   Introduction                                                                      4
    2.2   Summary of Socio-Economic Review                                                  4
    2.3   Summary - Infographic                                                             6
    2.4   Overview of the Consultation Process                                              8
    2.5   Feedback from Consultation                                                        9
    2.6   Summary                                                                          13

3   STRATEGY AND OBJECTIVES                                                                20
    3.1   Introduction                                                                     20
    3.2   Consistency with the Overarching Strategy set out in the Operational Programme   20
    3.3   Level of Change Required                                                         20
    3.4   Prioritisation of Identified Areas of Activity                                   20
    3.5   Intervention Logic of the FLAG South Strategy                                    22

4   COMMUNITY INVOLVEMENT IN THE DEVELOPMENT OF THE STRATEGY                               34
    4.1   Introduction                                                                     34
    4.2   Overview of Public Consultation Events                                           34
    4.3   Categories of Stakeholders                                                       35

5   ACTION PLAN                                                                            36
    5.1   Introduction                                                                     36

6   FINANCIAL PLAN                                                                         39
    6.1   Total budget                                                                     39
    6.2   Rationale for Spend                                                              39
    6.3   Allocation of total budget between Project and Administration Spend              39
    6.4   Project Spend by Theme, Objective and Year                                       41
    6.5   Administration Spend                                                             42
    6.6   Mobilisation of Other Resources                                                  43

7   THE FISHERIES LOCAL ACTION GROUP45
    7.1   Organisation Details                                                             45
    7.2   FLAG Composition and Decision Making                                             45
1 The Definition of the Strategy Area 1.1 Introduction This section describes the FLAG area and sets out confirmation that the FLAG area meets the criteria set out in the European Maritime Fisheries Fund 2014 – 2020 (Section 5.1.2). 1.2 Description of the FLAG Area The FLAG South area comprises the coastal zones of County Cork including West Cork Islands. In order to provide a snapshot of the nature of this area the 78 District Electoral Divisions have been used to provide aggregate statistics. The area of operation will typically be the 10 km coastal strip however should projects further inland positively impact the coastal strip they will be considered on a case by case basis. The FLAG South also consists of seven inhabited islands, one of which is a registered Gaeltacht area – Oileán Chléire. The scale and distribution of fishing and aquaculture dependent businesses along the coast of Cork has led to the area being chosen. The fishery and aquaculture activity that authenticates that dependence is described in detail below. The area also coincides with local governance and development infrastructure, allowing greater synergies to be achieved without creating structures too unwieldy to function at the scale appropriate for the communities of fisheries and aquaculture dependent areas. According to the national fleet register in May 2016 the fleet in this area represents 411 vessels included in the polyvalent general, specific, aquaculture and potting sectors. Fifty–three of these vessels are over 18m. There are a further twenty-five vessels, between 12 and 18 metres, while 333 or 81% of vessels are under 12m showing the dependence of Cork’s coastal communities on inshore fishing. The majority of the inshore vessels are distributed across the smaller harbours and piers in the region prosecuting a variety of fish and shellfish species by a range of gear types as described later. An estimate of employment from the fishing sector in Cork is 752 jobs. The BIM data regarding Aquaculture in 2015 puts employment from aquaculture at 265 jobs. There were 69 production units across Rope Mussel, Salmon, Gigas oyster, native oyster, scallop, Abalone, urchins, trout, Smolts parr ova and seaweed with a total volume of 10,590 tonnes and a value of €30.9 million. Circa 28 companies provide 737 jobs in Cork. There is no account of ancillary jobs supply and support services. It is estimated that the population in the 10km strip of Coastal Electoral Districts is approximately 107,000. This figure excludes the ED of Cork urban centre. The main fishing ports in county Cork include Castletownbere, a National Fisheries Harbour Centre, along with Cobh, Ballycotton, Kinsale and Union Hall in Cork. Elsewhere fishing and tourism activities occur at a relatively large number of smaller harbours and piers along the coastline. Piers with three or more fishing vessels operating out of the Beara Peninsula include Ardgroom/Cuas, Ballycovane, Garnish, and Ardrigole up to Bantry. Along the south coast of Cork, the busiest piers for fishing and recreational activities are Crookhaven, Schull, Cunnamore, Turkhead, Baltimore, Castletownsend, Ring, Oysterhaven, Crosshaven and Knockadoon. Many of these piers service the West Cork islands many of which are populated year round. These include the islands of Heir, Bere, Sherkin, Whiddy, The fisheries in the FLAG South Region include area include: Lobster pot fisheries from the all along the Cork coast and islands. There is a Brown Crab pot fishery all along the south coast. The Shrimp pot fishery is particularly significant in the South from Kenmare River around into Castletownbere and east to Roaringwater Bay and over to Ballycotton. Spider crab is potted seasonally in some areas. Crayfish are caught mainly by tangle-netting. Scalloping occurs Bere Island Harbour and Bantry Bay, also a limited dredge fishery on the south coast in the Stag rocks and in Roaringwater Bay. Shading/poling harvest of scallop also occurs. There is a Nephrops pot fishery in Bantry Bay and Kenmare River. Green crab fishery particularly in Roaringwater and Bantry Bays. Whelk pot fishery – Roaringwater Bay. In Cork inshore trawling occurs along the south coast from Bantry Bay to Youghal, – Nephrops and mixed demersal fishery. Hook & line fisheries including trolling and jigging for whitefish occur all along the coast. There is a unique Mackerel gillnet fishery around Garnish. The south coast depends heavily on Gillnetting for demersal species. Corks Licensed Charter fleet is distributed as follows: Cork Harbour Area (Youghal to Kinsale), ten 10 metre boats plus five smaller vessels, with 5 vessels from the Old Head of Kinsale to Castletownbere. In Cork, (from Youghal Eastwards) there are 24 licensed passenger 10-11 metre vessels boats. In addition, there are 5 licensed boats for charter mostly RIBs or boats doing harbour tours etc. 2 | FLAG SOUTH FISHERIES LOCAL ACTION GROUP
The activities covered include sea angling, whale watching and sight-seeing tours. The islands are also serviced by
ferries except Dursey which is accessed by Cable car.
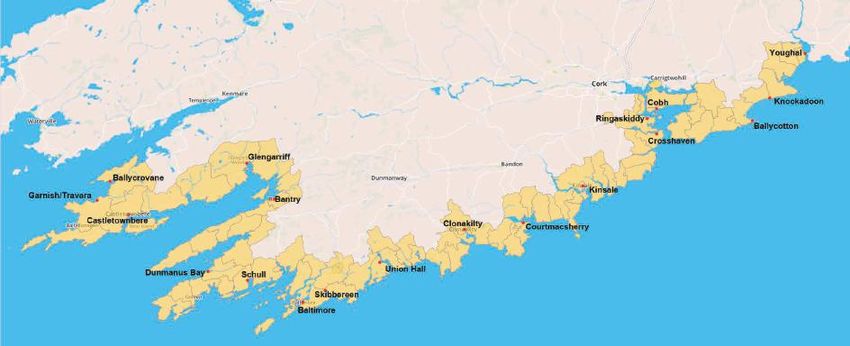
1.2.1 Map of the FLAG Area
Figure 1.1: Map of FLAG South area
Source: PACEC, 2016
1.3 Confirmation of Compliance of FLAG Area
Confirmation of compliance of the FLAG South with the following criteria was addressed by the FLAG selection
committee.
Table 1.1: FLAG Area – Compliance with Criteria1
Criteria1 Compliant
(✔ / ✘)
The area proposed must have at least one boundary comprising the coastline ✔
The area must have a significant level of employment in fisheries or aquaculture ✔
The population of Coastal Electoral Districts for proposed area must be over 70,000 ✔
The area must have a minimum of 150 vessels in all fleet segments of the fleet ✔
register and preferably not more than 400
The area proposed must have no more than one National Fisheries Harbour Centre ✔
1.4 Coherent Sub-Areas
As part of the development of the strategy the differing needs and priorities of differing areas of the FLAG were
considered.
The differing needs of areas were identified through the socio-economic review, the needs identified were further
explored through meetings with key stakeholders representing differing areas of the FLAG as well as public
consultations in 5 areas including a number of coastal islands. The needs and priorities of the areas were identified
through this process and there was found to be little need to establish a coherent sub-area as part of the FLAG
strategy but rather any varying needs have been acknowledged and addressed as part of the main strategy.
1 In accordance with Article 33 of Common Provisions Regulation 1303/2013 – December 2013.
LOCAL DEVELOPMENT STRATEGY 2016 |32 ANALYSIS OF THE DEVELOPMENT NEEDS
2.1 Introduction
This section sets out the summary of the analysis of the development needs and potential of the FLAG Area. This
includes an analysis of the strengths, weaknesses, opportunities and threats. It has been developed based on
desk-based research along with consultation findings.
2.2 Summary of Socio-Economic Review
l Preliminary Census 2016 statistics suggest that population is increasing in the Cork area and therefore, also
within the FLAG South area.
l There is a slightly older population (over-65) in the FLAG South area (12.6% of the population) than across
Ireland (11.7%), resulting in public services implications for the communities. However, there is also a slightly
larger proportion of persons aged under 15 in the FLAG South (22.5%) in comparison to Ireland (21.3%).
l The FLAG South has a higher rate of owner occupancy (72.3%) compared to other the Irish average (69.8%).
l There is a strong sense of cultural awareness within the area as 45.1% of residents can speak Irish, with three
times as many persons likely to use it within daily life particularly in Gaeltacht areas.
l With regard to education attainment, there is a low level of FLAG South residents with no formal qualifications
(1.2%) compared to other FLAGs (1.7%) and the national figure (1.4%). Educational attainment is slightly higher
within the FLAG South region with 38.1% of people having third level education compared to 35.8% across all
FLAGs and 34.8% nationally. This indicates the presence of a well skilled workforce which may provide
opportunities for development for the FLAG.
l PACEC estimates for Q1 2016 highlight unemployment within the FLAG South (7%) to be lower than the
national average (8.3%). Economic inactivity is also lower within the FLAG South.
l The FLAG South area would not be considered a highly deprived area within Ireland and certainly compared to
other FLAG Regions it is significantly more affluent. Only 4% of the EDs in the FLAG South Area would be
considered to be within the top 30% most deprived areas in Ireland.
l The FLAG South area has the 2nd highest percentage of total gross tonnage (18.9%) of fishing vessels out of
all FLAGS.
l The fishing industry in the FLAG South area is substantial and provides significant employment opportunities
due to the existing infrastructure in the area to support the industry
l The FLAG South’s activity is heavily concentrated within Castletownbere, which represents 12% of all Irish
tonnes landed, and 25% of the total value representing the significance of Castletownbere to the sector and
for the local economy and employment opportunities, and its national impact to the Irish Sea fisheries industry.
Furthermore, Union Hall, Cobh, Ballycotton, Kinsale and Baltimore in Cork are also part of the FLAG South and
top twenty ports by value.
l Almost one in three workers in the Agriculture, Forestry and Fishing sector are over the age of 65, compared to
25% across all sectors suggesting potential longer term supply issues.
l There are significant tourism opportunities for the area due to the scenic landscape and key tourism projects;
4 | FLAG SOUTH FISHERIES LOCAL ACTION GROUPl Information is not available at a FLAG level regarding exporting, however the points below summarise the
general picture.
- The overall value of Irish seafood exports was €564 million in 2015. The largest Irish seafood export by
value is pelagic (€204m, 36%), followed by crustaceans (€113m, 20%), freshwater fish (€85m, 15%),
molluscs (€82m, 15%), whitefish (€53m, 9%) and fish meat and oil (€26m, 5%). Sectorally, shellfish led the
way – rising 12% to €195 million; followed by salmon – where exports increased to an impressive €75
million; and whitefish – where exports grew by 7% to €53 million. The only decline in 2015 was seen in
pelagics, where exports fell 7% to €204 million as a result of falling trade and market prices.
- 70% of the seafood industry exports are as a bulk commodity, it is anticipated that this needs to be
reduced to 50% by 2025 to meet increasing market demands, with seafood demand expected to increase
by 50% by 2030.
- Looking at aquaculture specifically, France remains the main market for Irish oysters accounting for over
76% of all exports, however this has decreased by 10% in 2015 identifying the need for oyster produces to
diversify outside the French market. France and The Netherlands are the primary markets for rope mussels
with demand from The Netherlands increasing as processors there have developed techniques for handling
and packaging of rope mussels.
- Over two thirds of Irish seafood exports in 2015 were to EU countries (€388m, 69%), while just under a fifth
of exports were to Nigeria and North Africa (€98m, 17%), (€47m, 8%) were to Asia which is seen as an
expanding export market for certain species and the remaining €31m was to Non-EU countries (6%).
LOCAL DEVELOPMENT STRATEGY 2016 |52.3 Summary - Infographic ( FLAG National)
POPULATION POPULATION CHANGE IN GENDER
CORK (2011-2016) 50.3% 49.7%
107,169 4,588,252 49.5% 50.5%
DEMOGRAPHY
Cork +4.5%
Ireland +3.7%
2.3% of the population The population has
increased in Cork There is a lower proportion of
live in the FLAG
women
NO. OF COMPANIES COMPANIES BY TYPE NUMBER OF VESSELS
ENGAGED IN MARINE AND OF BUSINESS
SEAFOOD SECTOR
1. Fishing (n=33)
411
2. Processing (n=10)
54 3. Aquaculture (n=6) 2,196
4. Wholesale (n=5)
This represents 14% of 18% of vessels are in the
companies engaged in Ireland FLAG South
FISHING FLEET GROSS VOLUME OF FISH LANDED VALUE OF FISH LANDED
MARINE & SEAFOOD SECTOR
TONNAGE (‘000)
33,329 €61.5m
tonnes
203,423
12.2 tonnes
tonnes €219.3m
64.5 tonnes
Representing 16.4% of the Representing 28.1% of the
The gross tonnage is 19% of volume of landings across all value of landings across all
the national figure FLAGs FLAGs
TOTAL SECTORAL PERCENTAGE OF VISITORS VISITOR EXPENDITURE (2015)
EMPLOYMENT (TOURISTS)
1,340 6,424
Cork Average €357
Ireland Average €306
Cork Total €550m
13%
Avg. Total per county €128m
Representing 21% of Seafood 13% of overseas visitors to
employment across all FLAGs Ireland visit the County Cork
6 | FLAG SOUTH FISHERIES LOCAL ACTION GROUPEMPLOYMENT MALE UNEMPLOYMENT FEMALE UNEMPLOYMENT
8.0% 9.9% 5.2% 6.4%
ECONOMY
55.3%
54.5%
There is a higher proportion
of people in employment than The male unemployment rate is The female unemployment rate is
the national figure lower than the national figure lower than the national figure
SOCIAL CLASS DEPRIVATION
1. Managerial and Technical
28%/27%
4% of FLAG South EDs are
DEPRIVATION
2. Non-manual within the top 30% most
18%/18% deprived in Ireland while
1% are within the top
3. Skilled Manual
20% most deprived
16%/15%
4. Semi-Skilled
12%/11%
AGE PROFILE % OF POP. WITH PRIMARY % OF POP. WITH THIRD LEVEL
EDUCATION ONLY QUAL. OR ABOVE
PROFILE & EDUCATION
13% 65+ 12% 12% 14%
38% 35%
65% 15-64 67%
88% 86% 62% 65%
23% 0-14 21%
Higher portion of population
The population is in line Over one in ten people with
with Third Level qualifications
with national statistics a primary education only
or higher
ONE PERSON HOUSEHOLDS ACCESS TO BROADBAND % OF POPULATION UNABLE
HOUSEHOLDS, ACCESS & HEALTH
TO WORK DUE TO HEALTH
PROBLEMS
65% 63%
23% 24% 4.2% 4.4%
Higher proportion of the
There is a lower proportion of A lower proportion of FLAG
population have access
one person households than population are unable to work
to broadband than the
nationally due to health problems
national figure
LOCAL DEVELOPMENT STRATEGY 2016 |72.4 Overview of the Consultation Process
The FLAG South recognises the importance of the active engagement and participation of Cork citizens in the
sustainable development of their coastal communities and the opportunity for them to input meaningfully into the
design, development and implementation of the FLAG South Strategy. The FLAG Board has supported and
appreciates the efforts of Public and Corporate Economic Consultants (PACEC) in the comprehensive public
consultation process undertaken.
In keeping with the Community Led Local Development (CLLD) approach of FLAG, the FLAG Board undertook a
comprehensive consultation process at a local level to ensure the local development strategy was informed by the
active engagement and participation of those directly involved in fishing and aquaculture, those involved in the
development and maintenance of coastal communities, those involved in marine tourism and promoting coastal
areas and many others. The table below sets out the consultation activity undertaken by PACEC on behalf of the
FLAG Board.
Table 2.1: Overview of the Consultation Process
Consultation Activity
Public Meetings
5 public meetings carried out in the FLAG South region (Ballycotton, Kinsale, Bantry, Skibbereen and
Castletownbere). Over the 5 public meetings there were approximately 50 attendees. Representation of the
attendees in the FLAG South was:
l Representatives from local authorities made up 18% of attendees;
l Economic and social partners made up 51% of attendees; and
l Other relevant bodies that represent civil society made up 31% of attendees.
Meetings with Relevant Stakeholders
As part of the strategy development process, interviews were held with a range of stakeholders2 including
those from the statutory sector as well as industry representatives. In addition, FLAG board members had the
opportunity to identify relevant stakeholders who were to be included in the consultation process.
In some instances despite attempts3 to gain input from stakeholders, some were unavailable to feed into
the development process. These consultees were encouraged to make written submissions to the strategy
development process.
The format of the community consultation events was participatory in nature to promote meaningful engagement
and to ensure the active participation of the local community in identifying the challenges and opportunities
present in their local areas.
2.4.1 Inclusive Process that involved key stakeholders
All consultation events were promoted and well publicised to raise awareness of the process amongst all key
stakeholders. The meetings held were publicised locally using a variety of different means including
advertisements in local and trade press, notices on local and regional radio, signage and posters and word of
mouth. The inclusive nature of these events can be witnessed from the diverse representation amongst the
attendees.
2 West Cork Lobster Co-op; Cork Harbour Lobster V notching; Ballycotton Fisherman’s association, Roaringwater Bay islands;
Castletownbere Fisherman’s Co-op; Beara Tourism; Castletownbere V notching group; West Cork Islands Community Council;
BIM; South and East Cork Area Development Partnership Limited; Bere Island projects group; Údarás na Gaeltachta; Irish
Sailing Association; Irish Charter Skipper Association; Taste of Cork; Migrant Rights Centre Ireland (Migrant Fishermen’s
representative body).
3 All consultees were emailed three times seeking a meeting or telephone consultation. Each consultee was also contracted
three time by telephone. This is standard practice.
8 | FLAG SOUTH FISHERIES LOCAL ACTION GROUP2.4.2 Multi-Sector Approach that involves co-ordination with relevant sectors
The consultation processes directly engaged with various sectoral groups covering a very broad remit of different
population cohorts, activity and geographic areas of coverage. The different sectoral group interests were
captured from a combination of the public consultation events, stakeholder meetings and telephone
consultations.
2.4.3 Specific Methodologies for engaging with more difficult to reach groups
A number of specific methodologies were adopted to ensure the engagement of more difficult to reach groups.
Consultation meetings were held within local communities, the timing of the meetings (i.e. during the day or early
evening) tried to accommodate those who may be at sea and unable to attend meetings during the day. This
outreach approach through which communities were directly engaged in their own areas (avoiding the need for
them travel long distances) was important in ensuring that more remote, peripheral and isolated communities
were afforded the opportunity to actively participate in the preparation of the Local Development Strategy.
In addition, efforts were made to include Islands and other isolated communities. In particular meetings and
consultation events were held on islands and specific travel and meeting arrangements were made to ensure that
these important areas of the FLAG were included in the process.
Other specific actions were taken including meeting with organisations that represent migrant workers, who have
a key role to play in the fishery, aquaculture and seafood processing industries. These stakeholders may have been
restricted from participating in consultation events due to issues related to language etc.
2.5 Feedback from Consultation
2.5.1 Introduction and Methodology
The public consultation and the engagement with local stakeholders is the most important element in the
development of the strategy. Given this the meetings were designed such that pertinent information, that would
clearly inform the strategy, was collected at each.
The engagement had three main components which are described in the diagram below.
Figure 2.1: Consultation Methodology
Opportunities and
SWOT and Needs Ranking
Project Ideas
This element Using seven areas of Using the highest
asked consultees activity, developed ranked areas of
to consider the from the Union activity, attendees
information Priority 4 of the were asked to
gathered by PACEC EMFF Regulation, consider the
in relation to the Article 63 of the opportunities and
Socio-Economic Common Provision project ideas that
Review and discuss Regulation and the may be supported
the Strengths, European Maritime through the
Weaknesses, Fisheries Fund, we programme to
Opportunities and asked attendees to address some of the
Threats within their rank the areas of weaknesses and
local area activity in order of threats identified
important to them
and to their local
area
Source: PACEC, 2016
LOCAL DEVELOPMENT STRATEGY 2016 |9The outworking was a bank of information which we have used to inform the development of the strategy in
constant liaison with the FLAG South Board. A summary of the information gathered through the public
consultation process is included in the sections that follow.
2.5.2 SWOT and Needs
The consultation exercise undertaken included a discussion of the needs of the local area and through this a SWOT
analysis was developed. The key findings from this analysis are presented in Figure 2.2.
Table 2.2: SWOT Analysis – South Fisheries Local Action Group
Strengths Weaknesses
l There is a larger proportion of persons aged l Despite a National Fisheries College in the FLAG
under 15 in the FLAG South in comparison to South region courses are limited and only at a
Ireland (22.5%, 21.3%) beginner/intermediate level;
l The National Fisheries College of Ireland is in l The FLAG South region has a poor broadband
Castletownbere that gives access to people in infrastructure making it difficult for fishermen to
the FLAG South region to develop their skills in access training courses online;
fishing, fish farming and seafood processing; l With an older population in the Cork area (12.6%
l With a high proportion of workforce in the compared to the national figure of 11.7%) and
Agriculture, Forestry and Fishing Sector (34.9% lack of support fishermen (for instance, welfare
aged 65+ compared to 25.1% across all sectors) benefits) receive it is difficult for older fishermen
experienced fishermen’s knowledge should to retire (8.3% of residents are retired compared
be utilised to help provide training (fishing to 12.7% nationally) and with a lack of young
and aquaculture) and/or contribute to policy/ people coming through to work in the industry
legislation; forces the older population to continue working;
l The FLAG South area has the 2nd highest l Piers are in poor condition and access to the
percentage of total gross tonnage of fishing piers are restricted, however funding for piers is
vessels out of all FLAGS (18.9%) determined on council funding;
l There is an established marine infrastructure l There is a competition for resources / usage for
around the FLAG South region with many piers putting the marine infrastructure under
harbours in the Cork area classified as Class 1 and pressure from fisherman, tourism and leisure
many others as Class 2 which has led to fishermen having difficulty gain
l There is a strong sense of cultural awareness access to slipways, equipment and facilities.
within the area as 45.1% of residents speak Irish,
compared to 40.6% nationally
l Large Charter Boat and Passenger Boat Fleet
which is a growth sector in County Cork.
10 | FLAG SOUTH FISHERIES LOCAL ACTION GROUPOpportunities Threats
l Increasing the level of training to encourage the l Lack of young workers in the Agriculture, Forestry
development of the fishing industry. There is and Fishing sector (only 12% aged under 35); The
an opportunity to look at the training needs of working age population in the FLAG South area
fishermen and tailor courses to suit their needs; is smaller than the average for other FLAG areas
l There is a large supply of raw materials such and Ireland (64.8% compared to 67% nationally)
as seaweed in the FLAG South region which which can limit economic growth in the area;
can open up more opportunities to diversify for l The young population are moving to more built
fishermen; up areas such as Cork and Dublin due to better
l There are significant tourism opportunities for prospects/opportunities in these areas;
the area due to the scenic landscape and wildlife; l The curriculum for young people does not feature
l Opportunity to develop seafood trails / food any maritime based qualifications and regulations
tours whilst teaming up with local restaurants prevent young people from experiencing
and pubs to promote local produce and provide a maritime based activities making it difficult for
tourist attraction; young people to get involved in the sector initially;
l Bantry Bay has the potential reinforced by l Increase in the number of marine predators (e.g.
statistics to be used as a tourism hub for the Seals) in the FLAG South region has depleting fish
neighbouring peninsula in the FLAG South region stocks making it difficult for fishermen to catch
to also encourage tourists to not only visit the fish;
region but stay; l Regulation / legislation threatens the
l There are further opportunities that lie outside development of the sector and fishermen’s
tourism such as watersports; livelihood through quotas, licensing restrictions
limiting fishermen’s opportunities to diversify
l Harnessing the success of the O’Donovan into tourism, health and safety, environmental
brothers from Skibbereen in the 2016 Olympics protection accessing the supplies (e.g. Seaweed)
to promote the FLAG South region and interest / and training limited until individuals have reached
involvement in rowing and sailing; the age of 18;
l The fishing industry in the FLAG South area is l Lack of representation / consultation within the
substantial and provides significant employment fishing and aquaculture sector.
opportunities due to the existing infrastructure in
the area to support the industry;
l The large proportion of the population aged
under 15 provides an opportunity for new
employment coming through which could help to
diversify employment opportunities;
l Improvements can be made to piers to help
manage regulation/legislation such as pier valves,
the provision of ice and storage facilities adding
value to landing fish.
Source: PACEC, 2016
2.5.3 Ranking
A key element of the consultation exercise was the ranking of the Areas of Activity in order of importance and
priority for the FLAG. The Areas of Activity are taken from Article 63 Implementation of Community Led Local
Development of the Common Provision Regulations. The table below details the out workings of this process
including the overall assessment of the ranking of areas based on feedback from the consultation process.
LOCAL DEVELOPMENT STRATEGY 2016 | 11Table 2.3: Ranking of Areas of Activities
Area of Activity Overall Ranking
1. Adding Value to Fishery and Aquaculture Products 3.1
2. Job Creation/Maintenance 1.5
3. Supporting Innovation and Diversification 2.4
4. Lifelong Learning & Attracting Young People 3.1
5. Promoting Environmental Assets 4.2
6. Promoting Social Wellbeing and Cultural Heritage 4.2
7. Strengthening Role and Governance 2.5
Source: PACEC, 2016
Table 2.3 indicates that across all of the consultation activity:
l Job creation and maintenance was identified as the highest ranked priority area;
l Supporting innovation and diversification was identified as the 2nd most important areas for the FLAG;
l Strengthening the role and governance of fisheries was identified as the 3rd most important area;
l Lifelong learning and attracting young people and adding value to fisheries and aquaculture products were
identified as the 4th most important areas; and
l Promoting social well-being and cultural heritage and Promoting environmental assets were identified as the
least important areas.
After the consultation exercise and taking into account feedback from the consultation meetings the areas of
activity were refined and remodelled to better reflect the framework of activities. The main change in the
framework is that ‘creating and maintain jobs in coastal areas’ was seen as an overarching goal and that all of the
other Areas of Activity could contribute to. In addition, another area was added in relation to the development of
marine tourism and diversification. The outcome of this process is displayed below.
Figure 2.2: Refinement of the Areas of Activity
Creating and maintaining jobs in coastal areas
Adding value Promoting Marine Tourism Lifelong Promoting Strengthening Promoting the
to fisheries & innovation in Development learning and social well the role and environmental
aquaculture fisheries and and attracting being and governance assets of the
products aquaculture diversification young people cultural of fisheries fisheries and
and supporting in fisheries and heritage in communities aquaculture
diversification aquaculture fisheries and in local areas and the
inside and areas aquaculture development mitigation of
outside od areas climate change
commercial
fisheries
Source: PACEC, 2016
Continuing the development of the framework it was acknowledged that some of the areas above were
overlapping and could be grouped together to streamline the focus of the strategy to be developed. PACEC, in
consultation with the FLAG Board, developed five themes for which the prioritised areas of activity would fit. The
breakdown of these themes is detailed in figure 2.3.
12 | FLAG SOUTH FISHERIES LOCAL ACTION GROUPFigure 2.3: Areas of Activity to Themes
Promoting
innovation in Promoting Promoting the
Lifelong Strengthening
fisheries and social well environmental
learning and the role and
Adding value aquaculture Marine Tourism being and assets of the
Revised attracting governance
to fisheries & and supporting Development cultural fisheries and
areas of young people of fisheries
aquaculture diversification and heritage in aquaculture
activity in fisheries and communities
products inside and diversification fisheries and areas and the
aquaculture in local
outside od aquaculture mitigation of
areas development
commercial areas climate change
fisheries
Harnessing and
developing the Promoting
Enabling more
skills, talent social well
Economic Development of participative Protecting and
and local being and
Themes involvement promoting the
Coastal Areas cultural
knowledge of in local environment
local coastal heritage in
development
communities coastal areas
Source: PACEC, 2016
The five themes detailed above are the bedrock on which the strategy is built. All of the proceeding sections of
the strategy use the themes detailed.
2.6 Project Ideas / Opportunities
The final element of the consultation work considered the opportunities and project ideas that attendees had in
relation to the areas of activity. Using the themes detailed above we have included the tables below a summary of
the key needs and project concepts against each theme.
Whilst the tables below set out all the project concepts / needs identified through the consultation the
FLAG Board have assessed this feedback and have identified areas that are ineligible or illegal for FLAG
support according to State Aid rules. There are also issues arising which are the core remit of other
agencies or the state or that are better supported through other programmes or funding streams.
Therefore, not all the areas detailed below have been progressed in to the intervention logic for the
strategy.
LOCAL DEVELOPMENT STRATEGY 2016 | 13Table 2.4: Economic Development of Coastal Areas
Economic Development of Coastal Areas
County Cork’s coastal areas are made up of a series of peninsula and islands. These areas are sustained
predominantly through a strong fishing and aquaculture sector and a seasonal tourism sector. The strength
of the fishing and aquaculture sector in the region particularly in Castletownbere, which is now the most
valuable harbour in Ireland, means that through the consultation exercise many of the proposals in relation
to the economic development of the coastal regions was centred around the development of the fisheries
and aquaculture sector. Whilst the FLAG programme cannot increase the effort in terms of the volume landed
there were needs / opportunities identified in relation to the development of the industry. Some of these
included:
Diversification and Innovation
Through the consultation exercise if was clear that the economic development of the region and importantly
the creation and maintenance of jobs in the coastal areas required a concerted effort from the sector to
diversify and innovate. Some of the key ideas included:
l Support for fishermen and the seafood industry to start new micro-enterprises
- Need to support business start-up through pilot projects and seed funding
- Need to support new product ideas through improved incubation facilities
- Need to support new product ideas through market testing and product development support;
l Support for the sector to explore new functional foods
- Need to support the sector in relation to innovation regarding seaweed and marine products including
ideas generation, market information, business mentoring and feasibility studies.
- Need support to test the viability of alternative products to sustain the industry in the winter season
when the fishing and aquaculture season is largely inactive.
- Need support for local business which aim to sell local seafood whether that be a new fresh fish van
to travel around the restaurants and chip shops or a more permanent shop front so that people can
buy local produce.
l Support for the sector in adopt and utilise new technology
- Need to support the aquaculture sector in adopting new technology in relation to: small modifications
that improve the growth and survival rates of the target species, e.g. improving food, seeds, oxygen
levels and protection from predators; Ecosystem based technology in relation to the nutrients,
bacteria and cultured organisms, together with advances in hydrodynamics to minimising the risk of
disease or genetic impacts.
- Need to support the development of new technologies for example apps for phones to assist in
selling, ‘e-selling’ which would link producers directly with supply chains locally and national in a way
never done before.
14 | FLAG SOUTH FISHERIES LOCAL ACTION GROUPEconomic Development of Coastal Areas
Developing the Marine Tourism Product
The introduction of the Wild Atlantic Way in County Cork has contributed to the development of a large, yet
seasonal, tourism industry. County Cork has benefitted significantly from this boosting one of the highest
visitor expenditure figures of any county in Ireland. However, this is a rapidly developing market and one
that will invariable encourage the economic development of coastal areas. Whilst this provides significant
opportunities it also creates challenges. Some of the needs / opportunities identified have been detailed
below.
l Supporting the development of the Co. Cork tourism product
- Support to develop existing tourism driven industries related to the marine including rowing (building
on recent Olympic successes), canoeing and kayaking, sailing and other water based activities;
- Support to utilise the existing natural infrastructure including improving access to Islands and
encouraging tourist to include them as part of the visitor experience;
- Support to develop other tourism products such as wildlife based excursion including Whales, Dolphins
and Seals as well as food tours promoting local seafood building on the work done by Taste of Cork.
- Support for the establishment of regional tourism hubs e.g. Bantry so that visitor stay and support
local businesses.
l Supporting the shared use of marine infrastructure and improving health and safety
- The increase in visitors has led to access issues therefore support is needed to improve the marine
infrastructure for multi-sectoral use;
- Supporting the development of feasibility studies in relation to health and safety improvements to
piers and harbours, installation of new pontoons and marines, dredging and other activities to improve
infrastructure;
l Support to improve the visibility and co-ordination of the marine tourism industry
- Support to improve the marketing and advertising of the marine tourism product;
- Support to improve the linkages between existing and new marine tourism based organisations i.e.
links between hotels and tour or activity operators.
Adding Value to the Fish and Shellfish Landed
The consultation exercise revealed that adding value to the existing products was not viewed with the same
level of importance compare the diversification and job maintenance, however it was still identified as an
area that FLAG should support particularly in relation to the sustainability. Some of the areas that consultees
identified in relation to adding value were as follows:
l Adding value to shellfish
- The aquaculture sector in Co. Cork is dominated by oysters and mussels and as such it is important to
gain the highest value for the quality product that is produced. For example, oysters need depuration
to achieve better market value for grade b and c oysters. Therefore, support should be provided to
conduct feasibility studies into the development of Depuration facilities to enable more of the product
value to be retained locally.
l Improving shore side fishing facilities and practices
- Support to improve the ability to land product and keep it fresh including the need for ladders, cranes,
storage facilities, bait stores, ice plants etc.
- Support the safety and security of harbours and piers through support for appropriate storage and
lock up facilities for gear and equipment to reduce theft.
LOCAL DEVELOPMENT STRATEGY 2016 | 15Table 2.5: Enabling more Participative Involvement in the Governance of Fisheries
Enabling more Participative Involvement in the Governance of Fisheries
Except for a small number of large commercial operators with relatively modern facilities, the fisheries
sector in County Cork comprises of mostly small-scale operators. Governing fisheries involves much more
than applying fisheries laws and policies. A fishery system is governed by factors affecting the rights and
livelihoods of the people who fish, the trade in fishery products and services, the environment the fish live in
and the national economic and political context within which the sector operates.
Throughout the consultation process activities which would support the strengthening of the local
governance of fisheries as well as activities which would enable the fishing community to play a more active
and constructive role in the development and implementation of good governance practices was deemed as
significant need for the industry.
Some of the project ideas and opportunities identified included:
l Improving the understanding of fisheries and coastal issues and how peripheral coastal communities
(including fishing communities, aquaculture communities, others) can better represent themselves in
relation to these issues.
- Authorities and agencies need to work in partnership with fishery sector organisations to inform
peripheral coastal communities (including fishing communities, aquaculture communities, others)
better in relation to regulations so that they can run their businesses more effectively / efficiently;
- Provide capacity-building and training programmes designed to enable peripheral coastal communities
(including fishing communities, aquaculture communities, others) to educate themselves on fishery
matters or organise themselves so that they can represent themselves in relation to fisheries and
coastal matters.
l Empowering peripheral coastal communities (including fishing communities, aquaculture communities,
others) to educate and organise themselves to better represent themselves in relation to fisheries and
coastal matters.
- Work with fishing communities and local government to empower coastal organisations to better
represent the interests of peripheral coastal communities (including fishing communities, aquaculture
communities, others);
- To support the inshore sector through their work with the Inshore Forums to better protect and
regulate the fisheries on which their livelihoods depend ensuring their long term sustainability.
16 | FLAG SOUTH FISHERIES LOCAL ACTION GROUPTable 2.6: Harnessing the Skills, Talent and Knowledge of Local Coastal Communities
Harnessing and Developing the Skills, Talent and Knowledge of Local Coastal Communities
Attracting Young People to Fisheries and Coastal Areas
Many coastal areas in County Cork have suffered as a result of the migration of young people who leave the
predominantly rural coastal areas seeking initially education and then employment opportunities. During the
consultation process it was clear that one of the main priorities for coastal areas and one key to the long term
survival of the regions was to promote the marine sector to young people. Some of the areas of need and
opportunity identified included:
l Enhancing the training opportunities for young people
- Need to support the introduction of apprenticeship schemes for young people in a range of sectors
including fishing and aquaculture as well as marine tourism and scientific pursuits;
- Need to find a mechanism or forum so that the fishery people’s traditional skills and knowledge could
be passed down to the next generation of young people.
l Making the marine environment real to young people
- Need to utilise and promote the National Fisheries College further as a hub for training in the region;
- Need to promote young people at school age in interacting with and experiencing the marine
environment;
- Need to support the development of information on the career opportunities related to the marine
sector (e.g. fishing, aquaculture, tourism, scientific roles i.e. marine biologist etc.)
- Need to support young entrepreneurs who have business ideas for coastal areas.
Developing Skills in Local Coastal Communities
The consultation highlighted a number of areas in which the programme may wish to support the
development of skills and life-long learning. In particular there was feedback gathered in relation to the need
for the development and improvement of fisheries skills and those specific training course related to those
who operate in the sector as well as wider skills development.
l Developing Skills in Fisheries and Aquaculture Areas
- Need to support those involved in fishing and aquaculture in training and upskilling;
- Need to support those involved in fishing and aquaculture in advanced training and courses;
- Need to support the development of basic skills including governance, business management
- Need to develop training and support for fishery people in relation to new technologies and ICT.
- Need to develop training in relation to the maritime environment providing designated areas to
facilitate this.
LOCAL DEVELOPMENT STRATEGY 2016 | 17Table 2.7: Promoting Social Well-Being and Cultural Heritage in Coastal Areas
Promoting Social Well-Being and Cultural Heritage in Coastal Areas
Improving the Local Heritage Offering in the FLAG South
The consultation exercise indicated that there could be more done to promote the local heritage of the region
and provided an extended and interactive tourism element which would improve the sustainability of the
coastal regions. In particular the following opportunities were identified.
l Developing the heritage infrastructure
- Need to develop new and refurbish existing heritage centres to improve their capacity to deal with
increasing visitor numbers
- Need to support the research of the local area so that content at heritage centres can be updated
and also the enable special events and exhibitions;
l Support the fishing industry through heritage
- Need to develop a fisheries food trail which is an experience driven product which perhaps fishermen
could be trained to deliver. In particular it should take in local products, local traditional fishing
methods, changes in the region and the sampling of high quality seafood products;
- Need to develop strong links between the mainland and island communities promoting the shared
history and cultural links as well as their uniqueness.
Supporting Fisheries and Fishing Families
Issues related to social isolation and access to service came up during the consultation process. In particular
there were issues raised in relation isolation amongst older single men in coastal areas as well as access to
services for fishing families. Some of the needs highlighted included:
l Improving quality of life in coastal areas
- Support for the development and sustainability of existing coastal community assets;
- Targeted initiatives to address isolation such as fishermen living alone e.g. Men’s Sheds type initiatives;
- Supported needed for vulnerable people in coastal communities.
Table 2.8: Protecting and Promoting the Environment
Protecting and Promoting the Environment
There was limited support for actions under this area as it was deemed to be largely the responsibility of
other bodies rather than of the FLAG Programme, however there were a number of opportunities / projects
identified throughout the consultation which are detailed below.
l Developing the environmental based tourism product
- There is a need to develop nature trails that have signage to indicate scenic areas and areas of
environmental important as well as providing information on wildlife.
- There is need to ensure the quality beaches in the area are maintained through efforts to collect litter
and plastics from the shore.
l Renewable Energy
- Need to promote the use of renewable energy in coastal communities and within the seafood sector.
In particular the energy management plans or feasibility studies would support companies and others
who are seeking to explore this area.
18 | FLAG SOUTH FISHERIES LOCAL ACTION GROUP2.7 Summary
This chapter presents all of the desk based and consultation data collected which will form the basis of the
strategy going forward. The socio-economic review considered the data and statistical evidence in relation to the
FLAG region. In addition, the consultation work including the public consultation and stakeholder meetings
collected the views of over 60 (over 50 in public meetings and over 10 in stakeholder consultation) people in
relation to the challenges, weakness and strengthens of the region, their priorities for the FLAG Programme and
the project ideas that they had.
Using this information, the next chapter of the strategy now considers the overall prioritisation of areas to be
supported under the FLAG South Programme based on a number of components. The intervention logic is then
progressed with the development of objectives and actions.
LOCAL DEVELOPMENT STRATEGY 2016 | 193 STRATEGY AND OBJECTIVES
3.1 Introduction
The following section uses the findings from the needs analysis and using the findings from a prioritisation exercise
during the public consultations develops a set of strategic objectives to guide the strategy.
3.2 Consistency with the Overarching Strategy set out in the Operational
Programme
As per section 5.1.1 of the European Maritime Fisheries Fund Operational Programme this strategy has been
developed to be consistent with the overarching strategy set out in the operational programme. In particular the
strategy has been developed to meet the requirements that the evaluation committee will assess the strategy
against.
More over the strategy has been developed recognising the aims of the overarching strategy in relation to Union
Priority 4, namely in relation to the employment created and maintained, and will seek through all actions to
promote these outcomes so as they may be achieved by 2023.
3.3 Level of Change Required
The FLAG South Region is has a strong history of fishing and aquaculture and of having a strong coastal
community. This is being threatened by a number of issues including:
l A decline in fisheries;
l Limitations on licensing for aquaculture sites;
l Population migration away from coastal areas to urban centres for opportunities in education and employment;
and
l An aging population.
However, there are also areas which are once again promoting coastal areas these include tourism, the revival of
food tourism and artisan products and crafts.
The FLAG South Programme aims to support fishing dependent coastal communities. The programme aims to
support the development of coastal areas by supporting the fishing and aquaculture industry as well as coastal
community groups to upskill, diversify, innovate regenerate and exploit the opportunities that are available.
The overall aim of the strategy is to see the rejuvenation of coastal communities.
3.4 Prioritisation of Identified Areas of Activity
3.4.1 Introduction
The process for prioritising the areas of activity was an iterative one ensuring that all views elicited were heard and
that relevant internal and external documents were objectively examined. It was also evident from this process
that the local knowledge on the ground and in all the relevant organisations and agencies was consistent with the
comprehensive statistical information available and analysed.
The FLAG Board were heavily involved in the prioritisation, receiving all information from the public consultation
meetings and having workshops with the consultants.
20 | FLAG SOUTH FISHERIES LOCAL ACTION GROUP3.4.2 Prioritisation
The following section considers the prioritisation of the areas of activity which were developed from the following
sources:
l Union Priority 4 of the European Maritime and Fisheries Fund Regulations;
l Article 63 of the Common Provision Regulation; and
l The European Maritime Fisheries Fund Priorities.
The prioritisation exercise was carried out by examining the following four criteria:
l Strength of support for the need (using information from ranking exercises carried out within the public
meetings);
l Strength of the evidence of need (using information gathered through the socio-economic review of the FLAG
Region);
l Fit with the European Maritime Fisheries Fund 2014 – 2020 – Union Priority 4; and
l Opportunities/Project Pipeline.
Each of these criteria were assigned a weighting and a score between 1 and 5. The details of the scoring are
included in the table below.
Table 3.1: Scoring Methodology
Criteria Weighting Scoring Rationale
Weighting Rationale
Strength of 25 l This weighting reflects the l A stronger score will be awarded
support for the importance attributed to the for this criterion if the findings
need information provided through from the public consultation
the public engagement. have highlighted this area of
activity as a key priority.
Strength of 30 l This criterion has been awarded l A stronger score will be awarded
evidence of the the highest weighting as it is for this criterion if the findings
need based on the socio-economic from the socio-economic review
review of the FLAG region have highlighted this area of
which supports the need for activity as a key priority.
intervention under certain areas
of activity.
Fit with European 20 l Given that the areas of activity l A stronger score will be awarded
Maritime are derived from the EMFF for this criterion if the area of
Fisheries Fund Regulations all of them fit with activity fits with the priorities
2014 – 2020 the EMFF to a certain degree. and objectives of the EMFF.
This criterion has been allocated The highest score is awarded
the lowest weighting for this to those which will directly
reason. contribute to UP4.
Opportunities/ 25 l The project pipeline is an l A stronger score will be awarded
Project Pipeline indication of the opportunities for this criterion if through
that the FLAG will have to spend the stakeholder engagement
money on a projects under a larger pipeline of potential
a particular area of activity. projects has been identified.
Therefore, a weighting of 25 has
been attributed to this criterion.
Source: PACEC, 2016
LOCAL DEVELOPMENT STRATEGY 2016 | 21The prioritisation of the areas of activity has led to the following summary.
Table 3.2: Summary of Prioritisation
Area of Activity Score Ranking
Adding value to fisheries and aquaculture products 350 4th =
Creating and maintaining jobs in coastal areas 475 1st
Promoting innovation in fisheries and aquaculture and supporting 400 2nd
diversification inside and outside commercial fisheries
Lifelong learning and attracting young people in fisheries and aquaculture 350 4th =
areas
Promoting the environmental assets of the fisheries and aquaculture areas 225 6th =
and mitigation of climate change
Promoting social well-being and cultural heritage in fisheries and 225 6th =
aquaculture areas
Strengthening the role and governance of fisheries communities in local 355 3rd
development
Source: PACEC, 2016
The prioritisation exercise has established a ranking for all of the seven areas of activity. This is broadly in line with
the findings from the consultation exercise.
The FLAG Board considered that the interlinkages between adding value, job creation and maintenance and
innovation and diversification meant that these would work best in co-ordination and therefore collected then
under one thematic heading of Economic Development in Coastal Areas.
In consultation with the FLAG Board it was agreed that the strategy would pursue the five thematic areas as
detailed in figure 3.2. The next sections of this Chapter set out the development of the intervention logic.
3.5 Intervention Logic of the FLAG South Strategy
3.5.1 Components of the Intervention Logic
The components of the intervention logic have been developed using the latest guidance from FARNET “Results
Orientated Community Led Local Development”4.
4 https://webgate.ec.europa.eu/fpfis/cms/farnet/publications/guides
22 | FLAG SOUTH FISHERIES LOCAL ACTION GROUPTable 3.3: Components of the Intervention Logic
Component Description
Vision The vision describes the overall goal of the entire programme. This is a high level,
often qualitative metric.
Theme The theme in this instance sets out a group of areas of activity which are similar in
nature and which can lead or support the achievement of joint goals.
Area of Activity The areas of activity are the areas which the FLAG programme can legally support and
are based on the EMFF and Common Provision Regulation documents as well as the
Irish EMFF.
Objective The objectives are high level outcomes which intervention under a particular theme
aims to achieve. These are often macro-level and qualitative.
Action The actions are the direct supports that will be provided to applicants in order to
enable them to complete project which will contribute to the achievement of the
earlier components of the intervention logic.
Output The outputs describe the tangible impact of the programme and are often specific to
individual projects. These are quantified and used to assess the performance of the
programme overall.
Source: PACEC, 2016
The remainder of Chapter 4 sets out the components above for the FLAG South Strategy.
3.5.2 Strategy Vision
The FLAG South will have sustainable fishing and aquaculture dependent communities, through
tourism and enterprise.
3.5.3 Objectives and Supporting Actions
3.5.3.1 Introduction to Indicators
An indicator is a tool that defines, measures and values progress in the implementation of the local strategy. This
information will help the FLAG to determine whether and to what extent the objectives are being reached and to
review and update the local strategy5. There are a number of different types of indicators including impact6, result
and output indicators. The types most relevant to the FLAG programme are:
l Result Indicators – these measure products or services delivered as a consequence of implementing a set of
activities. These have been defined as per the overall European Maritime Fisheries Fund 2014 – 2020.
l Output Indicators – these measure the immediate tangible product of support. These have been defined for
each objective and action of the FLAG Local Development Strategy.
3.5.3.2 Result Indicators
Result indicators measure the products or services delivered as a consequence of implementing the set of actions
that are outlined in this strategy. The FLAG Programme is funded under Union Priority 4 of the European Maritime
Fisheries Fund and therefore must report against a set of targets at both the mid-point of the programme (2019)
and the ex-post evaluation (2023). All FLAGs must contribute to these overall objectives and therefore they are
standard across all FLAG Regions. The value of the indicators however are dependent on the allocations to each
FLAG region and therefore these vary between FLAG Regions.
5 FARNET Factsheet 2 – Results Orientated CLLD in Fisheries Areas – Selecting the Indicators and Setting Targets.
6 these measure the effect of the intervention on the wider environment and its contribution to wider policy objectives.
LOCAL DEVELOPMENT STRATEGY 2016 | 23You can also read