Access to Affordable Houses for the Low-Income Urban Dwellers in Kigali: Analysis Based on Sale Prices - MDPI
←
→
Page content transcription
If your browser does not render page correctly, please read the page content below
land
Article
Access to Affordable Houses for the Low-Income
Urban Dwellers in Kigali: Analysis Based on
Sale Prices
Ernest Uwayezu 1,2, * and Walter T. de Vries 1
 1   Lehrstuhl für Bodenordnung und Landentwicklung, Ingenieurfakultät Bau Geo Umwelt,
     Technische Universität München, Arcisstrasse 21, 80333 München, Germany; wt.de-vries@tum.de
 2   Centre for Geographic Information Systems and Remote Sensing (CGIS-UR),
     College of Science and Technology, University of Rwanda, P.O. Box 3900 Kigali, Rwanda
 *   Correspondence: ernest.uwayezu@tum.de; Tel.: +49-151-4243-7013

 Received: 18 February 2020; Accepted: 13 March 2020; Published: 16 March 2020

 Abstract: The government of Rwanda recently passed housing development regulations and funding
 schemes which aim at promoting access to affordable houses for the low- and middle-income Kigali
 city inhabitants. The existing studies on housing affordability in this city did not yet discuss whether
 this government-supported programme is likely to promote access to housing for these target
 beneficiaries. This study applies the price-to-income ratio (PIR) approach and the 30-percent of
 household income standard through the bank loan to assess whether housing units developed in the
 framework of affordable housing schemes are, for the target recipients, affordable at all. It relies mainly
 on housing prices schemes held by real estate developers, data on households’ incomes collected
 through the household survey and a review of the existing studies and socio-economic censuses
 reports. Findings reveal that the developed housing units are seriously and severely unaffordable for
 most of the target beneficiaries, especially the lowest-income urban dwellers, due to the high costs of
 housing development, combined with the high profits expected by real estate developers. The study
 suggests policy and practical options for promoting inclusive urban (re)development and housing
 affordability for various categories of Kigali city inhabitants. These options include upgrading the
 existing informal settlements, combined with their conversion into shared apartments through the
 collaboration between property owners and real estate developers, the development of affordable
 rental housing for the low-income tenants, tax exemption on construction materials, progressive
 housing ownership through a rent-to-own approach, and incremental self-help housing development
 using the low-cost local materials.

 Keywords: housing development schemes; affordable housing; Kigali city; low- and middle-income
 groups; price-to-income ratio

1. Introduction
     Access to housing has been on the sustainable development agenda at the global level. It has
also been envisioned among the key factors for promoting inclusive urban development, which
embrace the right to inhabit well for all urban dwellers [1–3]. To promote this right, proponents of the
rights to the city have largely reiterated the urgent need for the real estate agencies, government and
municipal leaders to advance the habitability of the urban space through the inclusive approach of
housing development schemes providing affordable houses for the low-income urban dwellers [2,4].
Following this claim, the provision of affordable housing has been the crux of many contemporary
urban (re)development schemes in various world cities [5]. The housing literature defines an ‘affordable
house’ as a house at or below a specified price threshold, whose price is relatively aligned with the

Land 2020, 9, 85; doi:10.3390/land9030085                                         www.mdpi.com/journal/land
Land 2020, 9, 85                                                                                     2 of 32

household’s income and permits the beneficiaries of the affordable housing programmes to meet
other basic needs required for sustaining their livelihoods [6]. Balancing housing prices with income
is an important approach to promote the living conditions of all urban dwellers. It allows for the
preservation of affordability proportional to household income and advances the integration of various
categories of urban dwellers into urban development processes [7]. Apart from being a basic human
right, access to affordable housing has been introduced in the contemporary urban development
programmes as a strategy for redressing the exclusion of the poor and low-income groups from the
cities due to high cost of housing [8]. This is operationalised when the developed housing units,
which are the products of any spatial re-organisation processes, and primary spatial goods are equally
distributed among all urban dwellers, especially the low-income group [9]. Thus, the development of
affordable housing for this category of people can counteract the competitive housing market from
which they are excluded [10,11]. This problem is more crucial in African cities, where most dwellers
are very poor and low-income people.
      In Kigali, the capital city of Rwanda (located in Eastern Africa), around 54% of inhabitants are poor
and low-income people who earn between 38.0 and 225.0 US dollars per month. Around 13% of them
are very poor and earn less than 38 US dollars per month. The middle-income group represents 21%
of inhabitants whose monthly incomes range between 225.0 and 678.0 US dollars [12,13]. Generally,
the housing market has largely targeted high-income households, which represent less than 12% of
all urban dwellers. They earn more than 678.0 US dollars and can afford housing prices which are
greater than the purchasing capacities of other categories of urban dwellers [13,14]. Access to decent
houses has therefore been a pressing issue for the poor, low- and middle-income people in this city.
As a consequence, most of the Kigali city inhabitants who cannot afford formal housing prices have
informally self-developed their dwellings in unplanned areas, which occupy the majority (60%) of
residential neighbourhoods in this city [15]. However, this trend of informal settlements’ development
is highly discouraged by the current urban development regulations. Recent studies mention that there
is a dire need to produce 20,000 housing units every year to subvert to the current needs for decent
housing in Kigali city [16]. To promote access to decent housing in this city, the government of Rwanda
encourages real estate agencies to invest in low-cost housing units which are affordable for low- and
middle-income urban dwellers, through different incentives [17]. In this perspective, the law n◦ 06/2015
related to the investment promotion and facilitation in Rwanda entitles a preferential corporate income
tax rate of zero per cent (0%) to real estate agencies whose investment capital is equal to or greater than
10,000,000 US dollars [18]. In addition, the government of Rwanda established an affordable housing
fund within the commercial banks which entitle both affordable housing developers and buyers to apply
for the low interest rates and bank loans [19]. Real estate developers can also be assisted by government
agencies in the acquisition of land through the expropriation process [20]. This process consist of
the compulsory acquisition of private real properties, including the land and various assets thereon
attached, subject to payment of a fair compensation [21]. In Rwanda, the state has supreme powers to
manage all the national land and it is its sole authority to allocate rights of occupation and use of land
to Rwandan people [22]. Actually, land is held by individuals through a renewable emphyteutic lease
contract, issued to every landowner, following the process of systematic land registration completed
over the whole country in 2015 [23]. Prior to this process, in 2004, the Government of Rwanda
undertook a land reform process which resulted in the institutionalisation of a unique statutory land
tenure system [24]. This system distinguishes two main categories of land: the state and individual
private land. The state land includes vacant lands, forest, wetland, parks, water reserves, land occupied
by infrastructure and land used by public institutions, while individual private land is owned by
ordinary citizens through the ling lease contracts. On this note, expropriation is carried out when the
development of affordable housing is planned on private land whose main use is residential housing
development [25,26]. Apart from the facilitation of the expropriation process, government agencies are
also responsible for the provision of basic infrastructure such as roads, electricity and water networks,
waste water drainage and treatment systems in affordable housing sites [26]. The key aim is to set
Land 2020, 9, 85                                                                                                 3 of 32

housing prices within the reach of the overwhelming number of Kigali city inhabitants and curb the
problem of unplanned settlements. As stated in the current Rwandan affordable housing scheme, the
beneficiaries of these affordable houses should not spend more than 30% of their monthly income to
purchase them [27]. The beneficiaries include low- and middle-income households whose monthly
income range is between 220.63 US dollars1 (equivalent to 200,000 Rwandan Francs) and 1,323.78 US
dollars (equivalent to 1,200,000 Rwandan Francs), and who do not own any dwelling2 place [27]. They
are also eligible to apply for low and long-term loans at 11 percent interest rates (compared to 18
percent for normal bank loans, for 20 years) through the affordable housing fund, established by the
Government of Rwanda in collaboration with the World Bank [28].
     In the existing studies, the Centre for Affordable Housing Finance in Africa [29], Gardner,
Lockwood [14], Manirakiza and Ansoms [30] discuss the issues of access to housing, based on housing
demand, delivery and affordability at the general housing market. Some of these studies allude to the
prohibitive prices of most affordable housing units developed by the real estate developers in Kigali
city and suggest detailed studies ascertaining whether Kigali city inhabitants can really afford these
houses [14,29]. Therefore, this study builds upon this call for evaluating whether the various housing
packages under development in Kigali city, within the framework of developing affordable houses,
are affordable for the prospective beneficiaries. More specifically, this study was motivated by the
knowledge gap about the contribution of the affordable housing developments schemes in curbing the
problem of access to housing in Kigali city, regarding the affordability of the developed housing units
and monthly incomes of various categories of the target beneficiaries. In this fashion, this study is
guided by the following research questions: To what extent can low- and middle-income Kigali city
inhabitants afford the housing units developed under the affordable housing schemes? Which strategies
can be adopted for promoting housing affordability for all categories of Kigali city inhabitants?
     The findings to these questions will shed light on the current trends in housing affordability,
following the adoption of the above-mentioned housing schemes, which are expected to make housing
affordable for a large number of Kigali city inhabitants. This paper draws also from its findings to
suggest practical and policy strategies that may be applied towards improving the implementation of
these affordable housing schemes and enhancing access to housing for various categories of urban
dwellers in Kigali city. Before the presentation of the analytical approach applied in this assessment of
housing affordability and data sources, we discuss the relevance of affordable housing schemes, within
the broad contours of the current Kigali city (re)development processes with respect to socio-economic
situations of its inhabitants.

2. The Income-housing Affordability Nexus in Kigali City Zoning Regulations
     From the perspective of inclusive urban re-development, affordable housing schemes have been
conceived from the perspective of government obligation to promote access to decent houses for the
poor and low-income urban dwellers who cannot afford a decent house in the general housing market.
Generally, the economic situation of the country is among the determinants of household income,
which can also be a catalyst to afford such a house [31]. To grasp the relevance of these housing
schemes in the Rwandan context, this section briefly presents the main sources of income in Rwanda,
housing development options, and related regulations which are among the factors influencing access
to housing for Kigali city inhabitants [29].

1   1 US dollar was equivalent to 906.6 Rwandan Francs on 04 September 2019. See https://www.bnr.rw/index.php?id=23.
2   Access to housing for people whose monthly income is less than 220.63 US dollars will be promoted through the social
    housing schemes that the government has recently started to implement across Kigali city.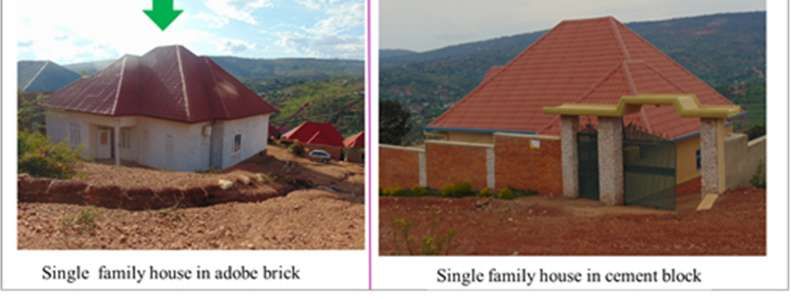
Land 2020, 9, 85                                                                                     4 of 32

2.1. Households Income Sources in Rwanda
     Kigali city has experienced a rapid population growth in the last 20 years. In the 1960s, the city was
a small center which acted as the political administration point for the country [25]. The built-up area
increased from 3 km2 in 1962 to 15 km2 in 1984, and reached 93 km2 in 2012 [15]. Its population also
increased from 6000 inhabitants in 1962 to 235,664 inhabitants in 1991 and reached 1,135,428 inhabitants
in 2012. This population growth results from an increasing annual growth rate of 9%, combining the
mean birth rate of 2.6% and rural–urban migration rate of 10% [32]. This high rural–urban migration
rate results in a high urban growth rate in Kigali city, whose inhabitants represent 48% of the total
Rwanda urban population. At the national level, the average urban growth rate was 4.5% in 2012 [33].
The main factor for rural–urban migration is the lack of job opportunities in Rwandan rural areas,
where subsistence agriculture is the main source of income for about 70% of the population [34]. At the
national level, the percentage of active population employed in the agriculture sector is 67.3%. Among
them, self-employed famers represent 43.6%, compared to 23.7% in the farm wage employment. The
non-farm sector employs 32.7% of the active population. They include 20.0% who are formally and
informally employed in industry and services, 0.7% who are formally employed in the public sector
and 1.82% in the private. In the non-farming sector, 12.7% of the active population is self-employed,
with 10.9% and 1.8% in the informal and formal sectors, respectively [35].
     In Kigali city, the main sources of income for its active population are threefold: 17.4% of this
population rely on wage and non-wage farming, 79.9 % of the population are employed in industry
and services, while 2.7% are self-employed in the non-farming sector [36]. Just like other low-income
countries, the Rwandan Gross Domestic Product (GDP) per capita is low, estimated at 774.00 US
dollars in 2017 [37]. Generally, the farming sector contributes 31.5% to the national, GPD, against 17.6%
from the industry and 50.8% from services [38]. Generally, the incomes of most of Rwandans, as well
as Kigali city inhabitants, are very low. Studies on housing demand have shown that the monthly
salary of about 61% of people who have wage-employment is less than 110.00 US dollars, and ranges
between 110.00 and 220.00 US dollars per month for 13.5% of people. These figures show that it is a
challenge for most Kigali city inhabitants to have access to decent housing through the formal real
estate market [39]. The next section describes the current trends of this market and modes of access to
housing in Kigali city.

2.2. Housing Development and Market Trends in Kigali City
      Two main modes of access to housing exist in Kigali City: formal and informal development.
      Formal housing development: the formal sector housing in Kigali is typically made of real
estate agencies or individuals who buy land plots from the private landowners in different planned
residential neighbourhoods and develop various housing units (villa, single family houses or residential
apartments), which are then sold to the public. Main developers include public agencies such as
the Rwanda Social Security Board (RSSB) and la Banque Rwandaise de Développement (BRD) or the
Development Bank of Rwanda (DBR), and various local and foreign private registered real estate
agencies. These include Urukumbuzi, Abadahigwa ku Ntego, the Ultimate Developers Ltd (UDL), the
Millennial Development Ltd, and the Remote Estates, among others. However, they supply a small
number of houses: from 800.00 to 1,000.00 dwelling units per year [12], which can be affordable for
the high-income groups only [29]. This formal market can barely meet 3% of the annual housing
demand in Kigali city. Due to this limited supply, a large number of households from the middle- and
high-income groups (representing 21% of Kigali city inhabitants) use the formal process to develop their
houses (single-family houses) through self-help, using their incomes or loans provided by financial
institutions. Since some of them do not own land or do not have land plots in the planned residential
neighbourhoods, they acquire them from other property owners through the formal land transaction
process [39,40]. Thereafter, they request construction permits from Kigali city and develop their
houses according to zoning regulations [40]. However, this formal process has not been used by the
overwhelming number of Kigali city inhabitants, mainly poor and low-income groups due to the high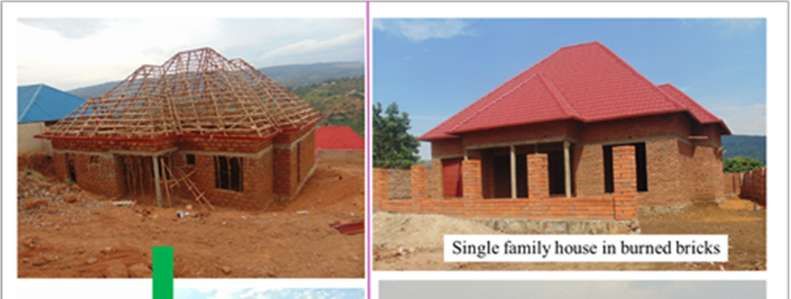
Land 2020, 9, 85                                                                                       5 of 32

cost of formal housing development. Therefore, these urban dwellers have been accessing housing
through informal housing development.
      Informal housing development: this housing development option, through self-help construction,
is applied by around 40.00% of the poor and low-income Kigali city inhabitants whose monthly income
is less than 380.00 US dollars [40,41]. Therefore, they do not have the capacity to buy or build a house
in Kigali city through the formal process. Most of them are the original inhabitants who own land
through the traditional processes of inheritance. Others include rural–urban migrants who, until
2008 when land rights were not yet registered in Rwanda, had been acquiring land from the original
landowners through the informal land market, whose records were maintained through the process of
private conveyancing. From 1980, when the first masterplans in Kigali city (covering a small part of
the administrative boundary of the city) were crafted, these poor and low-income groups have been
informally developing their houses in unplanned areas [42]. Under this informal housing development
arrangement, the mean cost for the development of a housing unit is 2757.50 US dollars for low-income
groups and less than 552.00 US dollars for poor urban dwellers. The cost of land is not counted,
since most of them are the original landowners. The middle-income groups have also been applying
the informal housing development option to build-up their houses, which they use for their own
residences or rent to tenants. Tenants represent around 53.00% of Kigali city inhabitants [43]. This
percentage can increase up to 80.00% in the old informal settlements which are close to the Central
Business District (CBD) and service centers where most of the poor and low-income groups can find
wage employment [40].
      This practice of informal housing development resulted in the escalation of informal settlements
until 2013, when the new masterplan that covers the whole administrative boundaries of Kigali city,
which was adopted in 2008, was not yet enforced [25,39]. Since these houses were developed using
low-cost local materials, they exhibit appalling housing conditions, so that the current Kigali city
masterplan recommends that they should be demolished, especially those located in high-slope or
flood-prone areas [44,45]. Their demolition can result in very high demand for low-cost housing, which
has never been met by the real estate developers and government agencies. Nevertheless, some of
these informal settlements can be upgraded or converted into modern residential apartments and
green spaces with respect to the land slope and current zoning regulations [45]. Table 1 shows the
demand in various housing categories for Kigali city urban dwellers, until 2020.

      Table 1. Housing demand in Kigali city from 2012 to 2020. Data source: adapted from City of Kigali
      and Nkubito [25,41].

          Housing Category                    Number of Unit                         Percentage
             Social housing                       43,436.00                             12.62
          Affordable housing                      186,163.00                            54.11
          Mid-range housing                       112,867.00                            32.80
           Premium housing                         1601.00                               0.47
                   Total                          344,068.00                            100.00

•     Social housing: A housing typology that is affordable by households below the poverty line,
      earning less than 120.00 US dollars per month. This is under-development by the government
      through a subsidy system;
•     Affordable housing: This is demand for households earning between 120.00 and 772.00 US dollars
      per month. This is the largest segment of the housing market. These households have some
      payment capacity and could access a special rental market which may include the rent-to-own
      leasing mechanisms, etc.;
•     Mid-range housing: Targets households whose incomes vary from 772.00 to 4110.00 US dollars
      per month. Households whose income is less than 1320. 00 US dollars can also buy these dwellings
Land 2020, 9, 85                                                                                                                                        6 of 32

        under the affordable housing scheme and apply for the related bank loan, as stated in the current
        affordable housing schemes. Others can use their income or apply for mortgage financing to fund
        their houses;
•       Premium housing: This addresses housing demand from the high-income group whose monthly
        income is greater than 4110.00 US dollars per month.

Table 1 shows that there is need to produce about 39,000.00 housing units every year. However,
production has remained a crucial concern, as revealed by the increasing deficit in housing supply by
the general formal market since 2012. They can supply less than 1000.00 housing units every year,
as previously mentioned [25,41]. In addition, the development of social housing is also very low,
since, each year, Kigali city, in collaboration with other government agencies, can develop around 200
housing units for the poor urban dwellers [25,46].

2.3. Regulatory Framework for Housing Development in Kigali City
      Different legal instruments and tools, including policies, laws, and strategic development plans
related to land management and socio-economic development in Rwanda, significantly support
the current programme of promoting access to decent housing for Kigali city inhabitants. Table 2
summarises their provisions or principles in relation to the promotion of access to housing in different
ways. They also reiterate different aspects pertaining to affordable housing development. In Table 2,
the first column indicates the related document and the year of publication in brackets. The second
column summarises these ideas relating to housing development.

        Table 2.     Overview of regulations related to housing development in Rwanda.                                                           Data
        source: [17,22,24,28,47–49].
             Instruments and Tools                                        Indicative Provisions Related to Housing Development
                                                                      Section 5.5 promotes the good management of urban land through:
                                                     - Densification in the planned residential areas through the development of high-rise buildings and
                                                                                        horizontal semi-detached houses;
                                                  - Restructuration of informal settlements, including the expropriation of land rights, clearance of houses
                                                      located in public areas, provision of basic infrastructure and services and resettlement of displaced
                   Land policy
                                                                                                   communities;
                     (2004)
                                                  - Real estate development through the sale of state land to individuals or real estate agencies in order to
                                                              replace existing buildings with new ones that are bigger, taller, and more luxurious;
                                                  - Production of a high number of buildable plots and their diversification, so that they can accommodate
                                                                                     the highest number of settlement units;
                                                                               - Promotion of access to housing funding schemes.
                                                  Principle 3.1: The Government of Rwanda recognizes the fundamental right to housing for every citizen.
                                                  It is determined to provide the population with easy access to decent housing and improve their housing
     National human settlement policy (2009)
                                                                                                 conditions.
                                                  Strategy 2.2: Rehabilitation of residential areas should give priority to home security for their residents,
                                                                             by means of various solutions including rehousing.
       Organic law repealing organic law n◦
                                                  Article 2 allows for the expropriation of the private land for public interest, including the development of
     08/2005 of 14/07/2005 determining the use
                                                                                         social and affordable housing.
    and management of land in Rwanda (2015)
     Law N◦ 32/2015 of 11/06/2015 relating to      Article 7 grants the public agencies or private investors the rights to carry out the expropriation for the
    expropriation in the public interest (2015)   implementation of various urban development projects, including the construction of affordable houses.
                                                     The densification pillar promotes urban compactness, including the development of high building
       National Urbanisation Policy (2015)
                                                                              densities for different categories of income group.
                                                                            Section 3.2 promotes access to housing for all people;
                                                  Housing development options include: private urban rental housing; shared condominium ownership;
                                                      rent-to-own; owner mortgage; self-construction with local materials mainly sourced on site; and
          National housing policy (2015)
                                                                            incremental housing development and improvement;
                                                  Section 3.3 supports affordable housing development: a housing unit whose cost is around a third of the
                                                                                            household’s income.
    Law n◦ 15/2010 of 07/05/2010 creating and
                                                  Article 3 and 4 allow different property owners to own and develop a land plot, like the construction of
    organizing condominiums and setting up
                                                                                shared apartments in a condominium tenure.
        procedures for their registration
                                                     The priority area 5 of the social transformation pillar promotes the improvement of household living
                                                                                                conditions through:
    7 Year Government Programme: National
                                                    - The relocation of households living in in high-risk zones through the development of affordable and
           Strategy for Transformation
                                                                              sustainable housing models for urban and rural areas;
                2017–2024 (2017).
                                                  - Operationalization of the affordable housing fund to facilitate citizens to acquire affordable and decent
                                                         housing. The fund will offer affordable interest rates to both private sector and beneficiaries.
Land 2020, 9, 85                                                                                               7 of 32

     As Table 2 shows, these regulations and strategic development plans stipulate the government’s
commitment to promote a rational use of land resource, increase production of housing units through
densification and improve housing conditions in the existing informal settlements. They also spur the
development of mixed-income housing typologies, comprising social, affordable housing units for poor
and low-income groups and other housing units which can be sold at the general market rates [17,49].
Regarding the promotion of housing development, the implementation of these regulations and
strategic development plans in Kigali city abides by zoning regulations. These regulations are
stipulated in the Kigali Conceptual Master Plan (KCMP) adopted in 2008 [50] and the related detailed
masterplans regulating land use and the development of land in three districts, namely Gasabo,
Kicukiro and Nyarugenge, constituents of Kigali city. By 2013, these detailed masterplans were
approved and their implementation became effective [25]. Their objectives include the control and
regulation of land use through spatial planning, and the provision of modern and comprehensive
housing solutions for all urban dwellers [50]. Therefore, these zoning regulations indicate different
residential land use typologies that landowners and real estate developers should comply to if they
intend to use the land for residential purposes.
     Table 3 shows various types of residential houses which can be developed in Kigali city. It also
shows the zoning categories, like R3 and R4, where affordable housing can be developed. As stated
in the land law and Kigali zoning regulations, each landowner has the right to develop his/her land
plot according to the related zoning category [22,45]. However, existing studies have demonstrated
that most landowners in Kigali city do not have sufficient financial capacity to comply by these
regulations. The most coping strategy that they adopt consists of selling their land plots and leave
the city, which unfortunately becomes the driver for land tenure insecurity [30,39]. Another possible
option for the landowners to comply by these regulations would consist of collaborating with other
people or real estate agencies who have the financial means to develop these plots and share the
developed houses in the form of condominium tenure. However, this option might not have been
attempted. As for the development of affordable housing, the most applied approach to acquire land is
the expropriation, carried out by government agencies or private real estate developers [26,51]. As
stated in the introduction, the key question is whether the developed affordable housing units are
affordable for Kigali city inhabitants. The next section discusses the approaches applied in assessing
their affordability, in relation to the incomes of Kigali city households.

      Table 3. Zoning regulations in Kigali city according to the masterplan for the period 2019–2040. Data
      source: [45].

                                                                             Maximum Number of     Total Areas in
      Zoning Category            Types of Residential Housing Unit
                                                                                   Floors          Km2 by 2040
      R1: Single-family       All types of single-family houses in form of
                                                                                   G3 + 1              17.23
         residential                         a detached villa
                                All types of single-family houses and
        R1A: Mixed
                                 low-rise apartments: detached and                  G+1                57.73
  single-family residential
                                        semi-detached Villas
                              All types of single-family houses: detached
   R1B: Rural residential4                                                          G+1                18.66
                                       and semi-detached villas
                                All types of single-family houses and
  R2: Low-rise residential       low-rise apartments: detached and            G + 3 (apartments)       35.48
                                        semi-detached villas
      R3: Medium-rise            Low- and medium-rise apartments,
                                                                              G + 7 (apartments)       38.45
         residential             detached and semi-detached villas.
                               Low- and medium-rise multifamily and
  R4: High-rise residential                                                   G+15 (apartments)         1.53
                                       high-rise apartments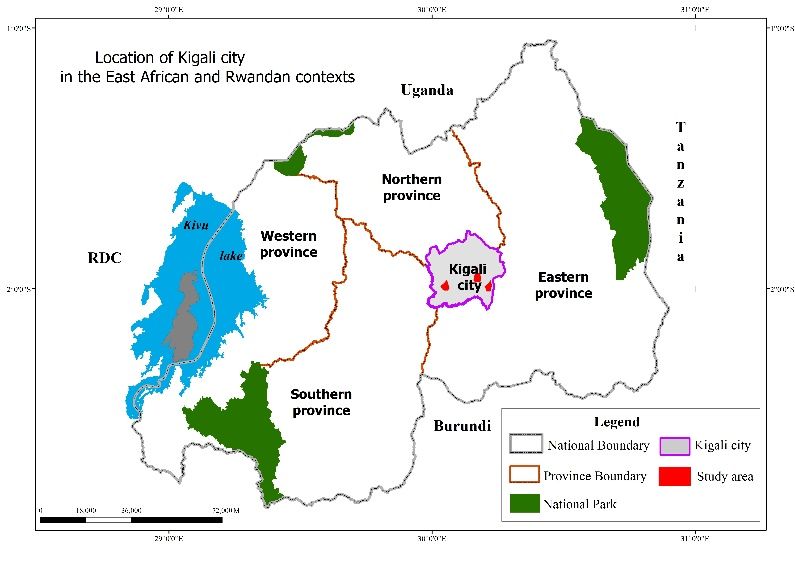
Land 2020, 9, 85                                                                                        8 of 32

3. Analytical Approach to the Housing Affordability
      This study uses income and housing price, which is largely termed housing price-to-income
ratio [52], suggested in most of the literature for the analysis of housing affordability [53,54]. The PIR is
applied when analysing trends in housing affordability and housing cost burdens for households based
on the share of income spent on housing [55]. The affordability is referred to as “purchase affordability”
when the assessment consists of measuring if the households can bear the cost for their houses using
their incomes [56]. The evaluation approach is tailored to the housing cost index developed by the
United Nations Human Settlements Programme (UN-Habitat) in its urban indicators tool kit guide [57].
This index is also applied by the Organization for Economic Cooperation and Development (OECD),
the International Monetary Fund (IMF) and different international financial agencies when they carry
out studies on housing affordability for low- and middle-income urban dwellers in various countries,
in order to reflect on changes in households’ living conditions over time and in a comparative way [58].
The affordability is calculated using the following formula

                                                                                     HP
                                        ousing Price to income Ratio (PIR) =                               (1)
                                                                                     HI
      In this Equation (1), the HP refers to the total sale price of each housing unit, while HI refers
to the annual household income. This equation is commonly used in assessing the household’s
ability to afford the available housing units within an area, based on the purchase affordability [59].
In this analytical approach, the low PIR index reflects good housing affordability, while the high index
portrays a high degree of unaffordability [57,60]. Generally, the affordability rates have been identified
as follows:

1.     The PIR below 3 reveals the general situation of “affordability” in which the household is sufficiently
       able to purchase the house, without difficulties in covering other basic needs;
2.     The PIR beyond 3.0 to 4.0 shows that the house is “moderately unaffordable”, but its cost does not
       have much negative impact on further household consumption;
3.     The PIR beyond 4.0 to 5.0 shows that the house is “seriously unaffordable”. Households must adjust
       the housing type to their income levels, otherwise the cost for housing can seriously affect their
       living conditions;
4.     The PIR beyond 5.0 portrays a situation where the housing is “severely unaffordable”, even if the
       household may extend the loan period.

Since affordable housing programmes address the question of access to housing for low-income people,
the affordability trends are ascertained by referring to 30% of the household monthly income that
should be spent on housing. This standard is applied in assessing housing affordability from the
perspective of public policy on housing to estimate the housing cost burden in the case the monthly
carrying costs of a home exceeds the 30% of the household’s income [61]. It is also a threshold suggested
by the Rwandan affordable housing scheme for assessing if a housing unit is affordable or not [26,27].
In addition, it is the benchmark that banks consider when approving the mortgage capacity of people
who apply for housing loans [29,62]. Still, most households rely on a bank loan which involves a
regular repayment until the end of the loan term. In this case, the calculation of affordability includes
the loan dimension and the related variables [63]. Therefore, it is assessed based on the cost repayment,
using the following formula
                                                                         i
                                                           P∗ i+      (1+i)n −1
                                                    AI =                                                   (2)
                                                                     I

4    This type of zoning is applied in urban fringes, which are still rural areas.
3    Ground floor.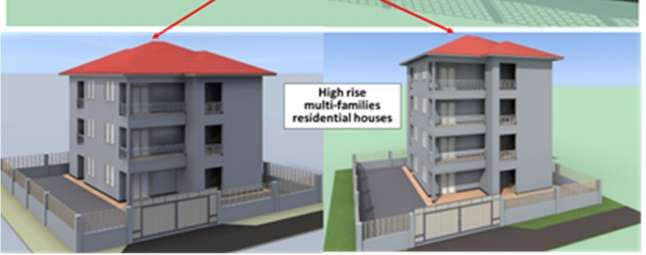
Land 2020, 9, 85 9 of 32
In the Equation (2), AI is the affordability index (which is also the monthly repayment amount),
P the housing price (which is equal to the mortgage amount), i is the bank loan interest rate, n is the
loan term (or duration in months) and I the monthly income [59,64]. In applying this formula, we used
the down-payment ratio 30% of the household income, the loan term or repayment period of 20 years,
and the loan interest rate of 10%, as set in the current affordable housing schemes of Rwanda [26].
In this model, the affordability is judged good if the households can spend less than 30% of their
monthly income to buy the house. It is moderate if they pay between 30% and 40%, and severely
unfordable if they pay more than 50% [65]. Households that pay more than that share are said to be
“cost-burdened.” Families that spend more than 50 percent of their household income on housing are
considered “severely cost-burdened” [55]. Beside these indices, the analysis of housing affordability is
largely extended to its redistributive equality which requires balancing the affordability rates among
the target beneficiaries, based on their income ranges, to decrease the affordability gap among all
categories of people who are in need of decent houses [66]. In this case study, the redistribution
equality is assessed based on the percentage of low-income households who can afford the available
housing units produced under the affordable housing schemes which are supported through public
funds [8,57,67,68]. In the next section, we present the sources of data used for this study.
4. Data Sources
This study is based on the exploratory approach to ascertain trends in housing affordability
in Kigali city, following the adoption of government-supported affordable housing programmes to
promote access to low- and middle-income people and understand whether the housing affordability
burden for these urban dwellers is really being mitigated. Primary data for this paper were collected
during two periods: from July to September 2018 and from January to March 2019, on the ongoing three
projects of affordable housing development in Kigali city. During the first period, some projects had not
yet been approved, and their proposal and related data could not be disseminated. We, therefore, had
a second field work to collect these data. These projects are equally distributed in the three constituent
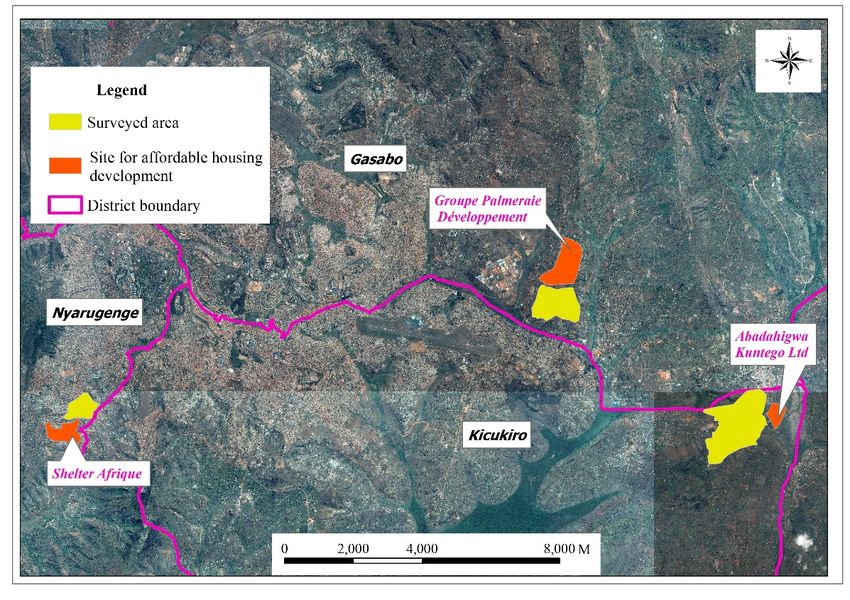
districts of Kigali city, as shown in Figure 1.
Figure 1 shows the spatial distribution of the sites for the affordable housing projects approved in
the last three years, on which this study is grounded. The identification of these projects was based on
the reports, accessed from Rwanda Housing Authority (RHA), which foresees the implementation of
all activities related to affordable housing development in Rwanda. These three projects are owned by
different real estate developers, namely Abadahigwa Kuntego Ltd (in Kicukiro district), Groupe Palmeraie
Développement (in Gasabo district) and Shelter Afrique (in Nyarugenge district). The Abadahigwa Kuntego
Ltd is a local real estate developer which operates in this project of affordable housing. Other agencies
are foreign firms which collaborate with the BRD, one of the leading commercial banks that support
the development of affordable houses in Rwanda. It is worth noting that, at the time of our survey,
the projects were under development in two sites and some houses were already sold to the public
(this applies for the Abadahigwa Kuntego Ltd). The Groupe Palmeraie Développement had not yet started
construction works, although its project was approved by RHA and the site was already cleared after
the expropriation of the former landowners. To assess housing affordability for Kigali city inhabitants,
we conducted household surveys in three low- and middle-income residential neighbourhoods, close
to these project sites. We believed that their inhabitants were aware of these projects and could respond
to questions related to the type, price and affordability of housing units delivered to the public by the
projects’ owners. In addition, these residential neighbourhoods were the targets for our survey because
their inhabitants comprise two income categories: the tenants (who live in rented houses) and landlords
who reside in their own houses, mostly developed through self-constructions [69]. The former are
among the targets for the affordable housing projects as prospective buyers [26,27]. The survey was
administered to 196 heads of households. They represent the population of 214 households counted
in the neighbourhood of Shelter Africa, 187 households recorded in the neighbourhood of Groupe
Palmeraie Développement and 193 households recorded in the neighbourhood of Abadahigwa Kuntego Ltd,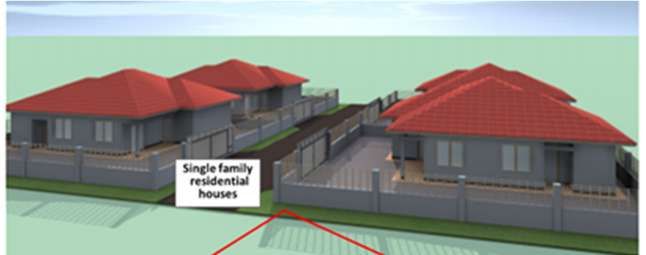
Land 2020, 9, 85                                                                                                  10 of 32

as Figure 1 shows. The sample population was randomly selected using sampling formula applied
to selecting the sample from the finite population as suggested by Krishnaswamy, Sivakumar [70],
as follows
                                             z2 ∗ p(1 − p)/e2
                                   n=                                                        (3)
                                        1 + (z2 ∗ p(1 − p))/ z2 ∗ N
     In Equation
     Land 2020, 9, x FOR     Z =REVIEW
                       (3),PEER  is the value
                                        assigned for the confidence level of 95%, with 1.96 as a10confidence
                                                                                                        of 33
level score; p is the desired proportion for the sample size n, which is 0.5; e is the tolerable error (10% in
     therefore,
this study); andhadNathe
                      second field work
                         population     to (for
                                     size  collect
                                                thethese data.
                                                     whole     These
                                                            study    projects are equally distributed in the
                                                                   area).
     three constituent districts of Kigali city, as shown in Figure 1.

      Figure 1. Location
          Figure            of of
                  1. Location  thethe
                                    study
                                      studyarea.
                                            area.Data
                                                  Data source:  Fieldsurvey,
                                                       source: Field   survey, July
                                                                             July    to September
                                                                                  to September 20182018  and January
                                                                                                    and January
      to March  2019,
          to March       andand
                      2019,   proposals
                                  proposalsfor
                                            forhousing
                                                 housing development      projects
                                                         development projects       approved
                                                                                 approved      by Rwanda
                                                                                           by Rwanda        Housing
                                                                                                       Housing
      Authority  (RHA).
          Authority   (RHA).

           Figure
      In this       1 shows
                study        the spatial
                        we used          distributionquestionnaire
                                   the face-to-face    of the sites for the
                                                                         to affordable  housing data
                                                                            collect empirical     projects
                                                                                                       on approved
                                                                                                            housing costs
     in the  last three years, on which  this study is grounded.    The  identification of
(through self-help development and purchase from the real estate developers), households’  these projects  was based
                                                                                                                 incomes,
     on  the  reports, accessed  from  Rwanda   Housing    Authority  (RHA),   which  foresees  the implementation
access to bank loans and the different options that Kigali city inhabitants apply for to have access to
     of all activities related to affordable housing development in Rwanda. These three projects are owned
housing    and various strategies that have the potential to promote housing affordability in this city.
     by different real estate developers, namely Abadahigwa Kuntego Ltd (in Kicukiro district), Groupe
Other data were collected through the interviews conducted with 23 key informants from public and
     Palmeraie Développement (in Gasabo district) and Shelter Afrique (in Nyarugenge district). The
private   agencies intervening in affordable housing development in Kigali city. These interviewees
     Abadahigwa Kuntego Ltd is a local real estate developer which operates in this project of affordable
     housing. Other agencies are foreign firms which collaborate with the BRD, one of the leading
     commercial banks that support the development of affordable houses in Rwanda. It is worth noting
     that, at the time of our survey, the projects were under development in two sites and some houses
     were already sold to the public (this applies for the Abadahigwa Kuntego Ltd). The Groupe Palmeraie
     Land 2020, 9, x; doi: FOR PEER REVIEW                                               www.mdpi.com/journal/land
Land 2020, 9, 85 11 of 32
include urban planners, civil engineers, architects, and heads of units and their collaborative officers
from RHA, Rwanda Development Board (RDB) and Kigali city who approve different proposals
related to affordable housing development presented by different investors. Other interviewees
include civil engineers and marketing officers and managers from the real estate developers, and loan
agents from different banks who finance the affordable housing projects. The interviews covered the
following topics: (i) goals of affordable housing projects, (ii) cooperation between the government
and housing developers, (iii) target beneficiaries of affordable houses, (iv) housing packages under
development, (v) housing prices and the payment models, (vi) access to bank loans for housing
purchase, (vii) affordability of housing units developed under the affordable housing schemes, and
(viii) possible options to promote housing affordability for Kigali city inhabitants. Data on housing
prices were compiled through the review of the existing studies on housing market and finance in
Kigali city, different housing designs and price lists held by engineers and architects, affordable housing
development proposals held by the real estate developers, and some government agencies such as
RHA, RDB and Kigali city, which approve (or monitor the implementation of) different proposals
related to affordable housing development, presented by private investors in the real estate sector.
Other agencies include Banque Rwandaise de Développement (BRD) or the Development Bank of Rwanda
(DBR), which are among the loan providers for affordable housing development, and Rwanda Social
Security Board (RSSB), which is the frontrunner in real estate development. Through the triangulation
approach, we also reviewed socio-economic census reports and government reports to validate the data
on households’ incomes collected during the household surveys. The assessment of the affordability
was undertaken based on the affordability indices generated through an analysis of collected data
that consisted of calculating the ratio between each housing unit price and household income, by
applying the formulae presented in Section 3. Qualitative data compiled through the household survey,
interviews and literature review were analysed using the content analysis approach. Our findings are
presented and discussed in the section that follows.
5. Results Presentation and Discussion
In this section, we first present and discuss the main findings in the analysis of housing affordability
in Kigali city. Thereafter, the different options which can be adopted to promote housing affordability
for all categories of dwellers in this city is discussed. As for housing affordability, our results reveal
that the housing units which are being developed alongside the affordable housing schemes are
not affordable for the overwhelming number of target beneficiaries. Table 4 shows the distribution
(in percentage) of households which can afford a housing unit from the different packages proposed by
the three real estate developers which constitute the unit of analysis in this study.
As stated in Section 3, the affordability index which is equal to or below 3 (PIR ≤ 3) exhibits a good
situation, in which the different housing units available on the market are affordable for the buyers.
The PIR between 3.0 and 4.0 shows a situation where households can moderately afford these housing
units, without compromising other needs required for their daily livelihood. A PIR which is above
4.0 shows an alarming situation where the households cannot afford the housing units proposed by
the real estate developers. These results presented in Table 4 portray very low trends in affordability,
since less than 30% of households can afford a house from the housing packages proposed by the real
estate developers in Kigali city. In contrast, these results show a drastic increase in the percentage
of the households which cannot afford these houses, with a drop from 15.32% for the situation of
serious unaffordability to 60.54% of severe unaffordability. These findings show that the affordable
housing schemes under-implementation Kigali city hardly address the needs in decent houses for the
low-income urban dwellers who should be the main recipients. In the next sub-section, we discuss in
detail these trends of housing affordability and factors associated with the unaffordability for most
target beneficiaries.Land 2020, 9, 85 12 of 32
Table 4. Trends in housing affordability based on the housing-price-to-income ratio. Data source: field survey (July to September 2018 and January to March 2019) and
review of housing price lists held by real estate developers.
Housing PIR: ≤3.0 PIR: >3.0 ≤ 4.0 PIR: >4.0 ≤ 5.0 PIR: > 5.0
Real Estate Housing Price in US (Affordable) (Moderately Unaffordable) (Seriously Unaffordable) (Severely Unaffordable)
Developer Package Dollars % of % of % of % of Income
Income Range Income Range Income Range
Households Households Households Households Ranges
Abadahigwa 3-bedroom
30,535 19.62 902.93–1354.41 15.89 677.20– 846.50 9.35 564.33–620.77 55.14 225.73–507.90
Kuntego Ltd. house
2-bedroom, 1st
32,500 19.62 902.93–1354.402 15.89 677.2–846.5 9.35 564.33–620.77 55.14 225.73–507.9
Groupe and 2nd floor
Palmeraie
2-bedroom, 2nd
Développement 36,500 15.17 1015.8–1354.402 12.15 790.07–959.37 13.54 620.77–733.63 60.75 225.73–564.33
and 3rd floor
2-bedroom,
39,000 10.28 1128.67–1354.402 13.08 846.5–1072.23 12.15 677.2–790.07 64.49 225.73–620.77
ground floor
3-bedroom, 1st,
42,500 8.41 1185.11–1354.41 11.21 902.93–1128.67 12.15 733.63–846.50 68.23 225.73–677.20
2nd & 3rd floor
1-bedroom 22,953 35.51 677.20–1354.41 14.02 507.90–620.77 14.02 395.03–451.47 36.45 225.73–338.60
Shelter Afrique 2-bedroom 42,627 8.41 1185.11–1354.41 11.21 902.93–1128.67 12.15 733.63–846.50 68.23 225.73–677.20
3-bedroom 55,743 0.00 - 8.41 1185.11–1354.41 23.36 733.63–1128.67 68.23 225.73–677.20
4-bedroom 68,859 0.00 - 0.00 - 31.77 1185.102–1354.41 68.23 225.73–1,128.67
Mean 16.7 12.73 15.32 60.54
(Un)Affordability trends Affordable Moderately unaffordable Seriously unaffordable Severely unaffordableLand 2020, 9, 85 13 of 32
5.1. Trends in Housing (Un)Affordability Based on Households’ Incomes
The results summarised in Table 4 are presented in detail in Table 5 below. These detailed results
reveal that a good affordability index, which is equal to or less than 3.0, starts from households which
earn 902.9 US dollars per month. It shows that only 19.62 % of the low- and middle-income people who
participated in our survey can afford the three-bedroom house developed by the Abadahigwa Kuntego
Ltd or a two-bedroom on the 1st or 2nd floor among the housing units proposed by Groupe Palmeraie
Développement. This percentage falls to 15.17% of households whose monthly income of is greater
than 1000.00 US dollars. They can afford the two-bedroom house proposed by the same investors.
For the remaining housing units (two- and three-bedroom apartments), proposed by Groupe Palmeraie
Développement and Shelter Afrique, the percentage of households which can afford them falls between
8% and 10%. They are households whose monthly income is relatively high, ranging between 1015.8
and 1354.41 US dollars. However, 38% of households whose monthly incomes vary between 677.20
and 1354.41 US dollars can afford a one-bedroom housing unit. Although this percentage seems to
be higher than the percentage of households which can afford a two- or three-bedroom house, most
surveyed households, representing 50%, cannot afford a one-bedroom housing unit. Even if a large
number of people can afford the one-bedroom house, it is not attractive to most Kigali households
(more than 85%), whose family size varies between four and five people on average [43,71]. During
the discussion on the affordability of this type of housing unit, 87% of our respondents argued that it is
attractive for single tenants only. These people generally earn less than 450.0 US dollars and therefore
cannot even afford a one-bedroom housing unit, as revealed by this study. This imbalance between the
number of rooms in a housing unit on sale and the household size has been largely mentioned in housing
studies among the factors which preclude the attractiveness of various houses for the low-income families,
even if these houses are affordable [72]. Therefore, most large families are much interested in purchasing
housing units whose bedroom number is proportional to the family size. Unfortunately, between 64.49%
and 80.38% of them can afford neither a two- nor a three-bedroom housing unit. They are among the
households with a monthly income ranging between 225 and 900 US dollars, as Tables 4 and 5 show.
Table 5 shows that a high percentage of households which cannot afford the housing units
proposed by real estate developers in Kigali city have low incomes, compared to the small percentage
of households which can afford these houses: more than 70% of households in our case study are in the
situation of serious and severe unaffordability, with an unaffordability index which is greater than 5.0. The
results presented in Tables 4 and 5 reveal a significant degree of unevenness across the income ranges.
A great proportion of developed affordable housing units are not affordable for most of the target
beneficiaries. As stated previously, people who cannot afford them are the lowest-income groups (47%),
whose income is below 400 US dollars per month. Consequently, these people do not benefit from
the current affordable housing schemes, because their incomes are incommensurate with the prices
of all housing units developed under these schemes. This unveils some trends of inequity in access to
housing for Kigali city inhabitants. Inequity issues related to the limited access to affordable houses for the
low-income groups, when the development of these houses is legally backed by the government, through
various funding schemes and public policy [73]. In a Kigali city development context, these trends show
that the national aspirations of promoting inclusive city through the development of mixed-income urban
neighbourhoods as stated in the national urbanisation policy [17,49] may hardly be attained. The reason
for this is that most of the low-income people in need of decent housing cannot afford decent houses
in the planned residential neighbourhoods from this perspective of affordable housing schemes which
are supported through public funds. As Table 5 shows, these people cannot afford any of the one- to
three-bedroom housing units. Our results also reveal that the four-bedroom houses proposed by Shelter
Afrique are not affordable for all low- and middle-income households. However, such a housing unit is
suggested among the affordable houses in the current affordable housing packages under development.
Though it represents 2.6% in these packages in our unit of analysis, it should not be out of reach for these
categories of urban dwellers, since its accessibility can help in curbing the problem of housing for parent
families whose household size can reach up to six people or more [43,71].Land 2020, 9, 85 14 of 32
Table 5. Housing affordability indices based on housing price and gross annual household income. Data source: Field survey (July–September, 2018 and January–March,
2019) and review of housing price lists held by real estate developers.
Housing Developer
Household Details Abadahigwa
Groupe Palmeraie Développement Shelter Afrique
Kuntego Ltd.
2 bedroom, 2-bedroom 2nd and 2-bedroom 3-bedroom
Cumulative 3 bedroom 1st and 2nd 3rd floor and Ground floor 1st, 2nd & 1-bedroom 2-bedroom 3-bedroom 4-bedroom
Percentage of Monthly Annual
percentage of floor Parking and parking 3rd floor
surveyed income in income in
surveyed Number of Units and Unit Price
households $ $
households
54 264 246 234 566 866 982 719 107
30,535 32,500 36,500 39,000 42,500 22,953 42,627 55,743 68,859
15.89 225.73 2,708.80 100.00 11.27 12.00 13.47 14.40 15.69 8.47 15.74 20.58 25.42
11.21 282.17 3,386.00 84.11 9.02 9.60 10.78 11.52 12.55 6.78 12.59 16.46 20.34
9.35 338.60 4,063.21 72.9 7.51 8.00 8.98 9.60 10.46 5.65 10.49 13.72 16.95
7.48 395.03 4,740.41 63.55 6.44 6.86 7.70 8.23 8.97 4.84 8.99 11.76 14.53
6.54 451.47 5,417.61 56.07 5.64 6.00 6.74 7.20 7.84 4.24 7.87 10.29 12.71
4.67 507.90 6,094.81 49.53 5.01 5.33 5.99 6.40 6.97 3.77 6.99 9.15 11.30
5.61 564.33 6,772.01 44.86 4.51 4.80 5.39 5.76 6.28 3.39 6.29 8.23 10.17
3.74 620.77 7,449.21 39.25 4.10 4.36 4.90 5.24 5.71 3.08 5.72 7.48 9.24
3.74 677.20 8,126.41 35.51 3.76 4.00 4.49 4.80 5.23 2.82 5.25 6.86 8.47
4.67 733.63 8,803.61 31.77 3.47 3.69 4.15 4.43 4.83 2.61 4.84 6.33 7.82
3.74 790.07 9,480.81 27.10 3.22 3.43 3.85 4.11 4.48 2.42 4.50 5.88 7.26
3.74 846.50 10,158.01 23.36 3.01 3.20 3.59 3.84 4.18 2.26 4.20 5.49 6.78
2.80 902.93 10,835.21 19.62 2.82 3.00 3.37 3.60 3.92 2.12 3.93 5.14 6.36
1.87 959.37 11,512.42 16.82 2.65 2.82 3.17 3.39 3.69 1.99 3.70 4.84 5.98
2.80 1015.80 12,189.62 14.95 2.51 2.67 2.99 3.20 3.49 1.88 3.50 4.57 5.65
1.87 1072.23 12,866.82 12.15 2.37 2.53 2.84 3.03 3.30 1.78 3.31 4.33 5.35
1.87 1128.67 13,544.02 10.28 2.25 2.40 2.69 2.88 3.14 1.69 3.15 4.12 5.08
1.87 1,185.102 14,221.22 8.41 2.15 2.29 2.57 2.74 2.99 1.61 3.00 3.92 4.84
2.80 1,241.535 14,898.42 6.54 2.05 2.18 2.45 2.62 2.85 1.54 2.86 3.74 4.62
1.87 1,297.968 15,575.62 3.74 1.96 2.09 2.34 2.50 2.73 1.47 2.74 3.58 4.42
1.87 1,354.402 16,252.82 1.87 1.88 2.00 2.25 2.40 2.61 1.41 2.62 3.43 4.24
(Un)Affordability trends Affordable Moderately unaffordable Seriously unaffordable Severely unaffordableLand 2020, 9, 85 15 of 32
In the analysis of affordability, the discussed results were obtained using the housing-price-to-
income ratio, based on the total prices of a house unit and the median household annual income. Since
most of the households in Kigali city use bank loans to fund and purchase their houses, as confirmed by
73% of our respondents and the existing studies [29], we undertook an in-depth analysis on affordability,
using the bank loan at 30% of the household incomes and for 20 years as the bank loan term, as stated
in the current Rwandan affordable housing schemes [74]. The results of the analysis reveal similar
trends, portraying a high degree of unaffordability indices, as presented in Table 6. As suggested in
this analytical approach, a good affordability index should be equal to or below 30%. However, our
results show that the percentage of households which can afford any housing unit among the house
proposed by all real estate developers is very low. In the housing package of the Abadahigwa Kuntego
Ltd, this percentage is less than 15%. These households earn more than 1000 US dollars per month.
The percentage of people who can enjoy the moderate affordability index is 12.15 % only. Generally,
these figures show that less than 28% of households in Kigali city, which earn more than 790.07 US
dollars per month, can afford the housing units proposed by Abadahigwa Kuntego Ltd. This percentage
is even lower than the percentage of households (35.51%) which can afford these housing units using
the gross annual income, as shown in Table 4. This is linked with an increase in each housing unit
price, driven by the loan interest rate and various transaction costs associated with the bank loans.
Thus, the number of people who can afford the housing unit in this case decreases [13]. These trends of
housing unaffordability for a large number of Kigali city inhabitants is observed through the housing
units proposed by Groupe Palmeraie Développement and Shelter Afrique, as Table 6 shows.
As Table 6 shows, the percentage of households which can afford the housing units proposed
by Groupe Palmeraie Développement varies between 12.15% and 27.1%, if we consider the good and
moderate affordability indices. As for Shelter Afrique, its housing units are mostly not affordable for
Kigali city dwellers, except for the one-bedroom house, which can be afforded by 44.86% of the city
households. Nevertheless, this type of housing unit does not attract buyers, since it cannot fit a large
family size, as mentioned previously. Generally, these figures demonstrate that the percentage of
households which can afford the housing units developed under the affordable houses schemes is
very low. They also show that the very-low-income households cannot afford any housing unit, since
this requires that they pay more than 100% of their income for all housing units proposed by the
real estate developers. Therefore, the affordable housing schemes under implementation in Kigali
city do not solve the problem of housing for the people who should be the beneficiaries of these
schemes. Our findings concur with the opinions of most participants in this study. They contend that
the total cost of most of housing units developed under the affordable housing schemes is very high
and this makes them unaffordable. This was stated by our key interviewees and 76% of the heads of
households who participated in the survey. In commenting on these costs (and by referring to the
use of bank loans), they argued that the high price of each housing unit is driven by the loan interest
rate and other bank charges paid by the buyers. As they stated, they find the price of any unit of the
so-called affordable houses very prohibitive when compared to the cost of a housing unit developed
through the self-help construction approach. In criticising the costs of these affordable houses, some
of our respondents maintained that “it is surprising to hear that a 4-bedroom house is being sold at the
price of 68,000 US dollars or more, while it may cost less than 40,000 US dollars, land price included, through
self-help construction”. Departing from this argument, 100% of the respondents stated that “besides being
unaffordable for most of Kigali city inhabitants, these houses are very expensive, when compared to the costs of
housing units built-up using similar material and which are on sale on the general local market”. Based on this
trend of unaffordability, participants in our household survey have suggested that the government
and the real estate developers should find another term to use, instead of calling it “affordable”. These
respondents stated that “the prices for most of these houses are very high, if one could relate these prices to
what affordability really means.” They went on to assert that “affordability means that someone can purchase
a housing unit, using part of his/her income and reserve another part for other needs. However, even if most of
Kigali city inhabitants should use their entire income, they cannot afford these houses. They are being developedYou can also read