EAGLE COUNTY SCHOOLS EARLY CHILDHOOD DEPARTMENT HEAD START COMMUNITY ASSESSMENT FEBRUARY 2021 - Presented by Beth Reilly MPH - BoardDocs
←
→
Page content transcription
If your browser does not render page correctly, please read the page content below

EAGLE COUNTY SCHOOLS
  EARLY CHILDHOOD DEPARTMENT
HEAD START COMMUNITY ASSESSMENT
          FEBRUARY 2021

       Presented by Beth Reilly MPH
HEAD START COMMUNITY ASSESSMENT 2021
Acknowledgements: Special thanks to Jill Hunsaker Ryan & Silver Street Consulting. Portions of the Program
Service Area description in this report were replicated courtesy of the 2012 Head Start Community Assessment.
Table of Contents:
*Standard numbers refer to citations in the Head Start Performance Standards.
• Acknowledgements and Table of Contents Page 2
• Introduction and Program Service Area *1302.11a Page 3
o Prevalent economic factors Page 4
• Demographic make-up of Head Start eligible children and families *1302.11b1i
o Number Page 6
o Geographic Location Page 9
o Racial and Ethnic Composition Page 11
o Housing Crisis Page 11
o Foster Care Page 12
o Disabilities- Types and Services/ Resources Page 12
• Data Regarding the Needs of Head Start Eligible Families *1302.11b1ii
o Education Page 14
o Health Page 17
o Nutrition Page 23
o Social Services Page 26
Typical work, school, & training schedules of parents with eligible
children *1302.11 b1iii Page 28
o Community Goals Identified by Parents Page 30
o Additional prevalent social factors Page 35
• Child Development and Child Care programs serving Head Start eligible *1302.11b1iv
Page 36
• Community Strengths, Resources, Availability and Accessibility *1302.11b1v &
1302.11bvi Page 39
• Significant Changes *1302.11b2
o Availability of publicly funded preschool services Page 45
o Discussion of demographic shifts & availability of resources Page 45
• Opportunities to serve diverse economic backgrounds *1302.11b3 Page 46
• Conclusion and Additional Community Assessment Resources Page 47
o Appendix A: Selection Criteria; Appendix B: 90 Day Report;
o Appendix C: Satisfaction Survey; Appendix D: Strategic Plan
Page 2 of 48
Introduction:

The Federal Head Start Performance Standards requires the grantee agency to conduct a
Community Assessment every five years and annually review and update. The Head
Start Community Assessment includes the collection of specifically required information
in order to promote thoughtful analysis to improve services and address the needs of
Head Start eligible children and their families. The Head Start Community Assessment
requires both the review of data and the input of families as they self-identify their
education, health, nutrition and social service needs.

Other Eagle County organizations also conduct community assessments that include a
broader array of information such as specific workforce data, community-wide health
information, occupied housing information, etc. Some of these assessments are
referenced at the end of this document for those looking for a larger picture of
community-wide strengths and needs. This document means to complement, not
duplicate, these other efforts.

Program Service Area 1302.11 a

Eagle County is a mountainous, rural community
known for the world-class resorts of Vail and Beaver
Creek. The county is located in the heart of the
Rocky Mountains on Colorado’s Western Slope,
almost equidistant from the two major metropolitan
centers of Denver and Grand Junction. Denver is
approximately two hours and two mountain passes
east. Grand Junction is two hours west, through the
Glenwood Canyon in Garfield County. Eagle County
has an elevation high of 10,603 ft. at the top of Vail
Pass, which drops to a low of 6,150 ft. at the west end
of the county. More than 80 percent of Eagle County
is public land, including 930 square miles of the
White River National Forest.

                                                                                   Page 3 of 48
Most of the county’s population resides along the I-70 corridor. The county seat is the
town of Eagle, which is also located along I-70. Eagle County has two towns in its
southwest corner, El Jebel and Basalt, which are approximately a one-hour drive from
the county seat and are significant population centers. These towns border Garfield
County to the west and Pitkin County to the south; in fact, the town of Basalt is partially
located in Pitkin County. This geographic separation creates unique service challenges
for the southwest corner of the county. The county has a Health & Human Services
satellite office that serves this area.

Prevalent Economic Factors 1302.11b1ii

Tourism is one of the county’s main industries with visitors attracted to the area’s snow
sports, rivers, golfing, hiking, biking and other outdoor activities. Second homes are
another unique feature and an economic driver. These industries create the demand for
a large workforce in the areas of service, maintenance and construction.

The top employment sector in Eagle County is in the area of Tourism and Outdoor
Recreation at 53%. (Data Center Economic Development District NWCCOG 2/18/2021) In 2019 the top
employment sectors for employees were Accommodations and Food Service (29%;
10,419 jobs); Retail Trade (11%; 3856 jobs); Real Estate and Rentals (8%; 2832 jobs)

                                                                                           Page 4 of 48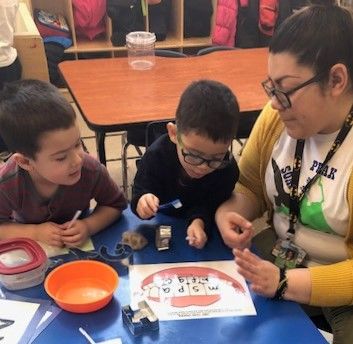
and Health Care and Social Services (10%; 3525 jobs). Approximately 36% are
employed in blue-collar work and 63% are employed in white-collar work. The average
commute time to work is 20 minutes.          (http://vailvalleymeansbusiness.com/data-center 2/10/2021)

Eagle County Government’s sale tax collection data is an indicator for reviewing
consumer spending and predicting revenue for government agencies. Eagle County
Government’s sales tax collections were at a low in 2010 at $9,916,522 and in 2019
reached at high of $18,247,380. Through November 2020 sales tax revenue was 15.7
million, 3% over budget. Voters approved sales and excise taxes for marijuana in
November 2017 in order to support mental health and substance abuse prevention and
intervention services. In 2019, $658,354 was raised for this purpose. Through
November 2020 sales and excise taxes for marijuana, raised $696,903, 36% over
budget. In 2019 Eagle County voters approved new taxes on the sale of cigarette and
tobacco products. Tax revenues support an Eagle County Public Health Fund for youth
substance abuse programs and health education. Through November 2020, tobacco tax
collected was $1.8 million, 112% over budget. (https://www.eaglecounty.us/finance/salestaxinformation)

The Colorado Department of Labor and Employment posts economic information on
their Labor Market Gateway system.          (www.colmigateway.com 2/10/2021)   They report that the top
growing occupations in northwest Colorado are for waiters and waitresses with a
median annual wage of $22,305; retail salespersons with a median annual wage of
$34,037; food preparation including fast food (no medium annual wage identified);
cashiers with a median annual wage of $30,859; and maids and housekeepers with a
median annual wage of $31,138. The average hourly wage is $25.23 and the weekly
wage in Eagle County is $1009. Eagle County average annual wages are $11,336 less
than the Colorado average annual wage. The Eagle County unemployment rate is 7.4%,
an increase of 5.6% from the prior year.

The economic data shows the largest and growing employment sectors are in middle to
low paying jobs.

                                                                                                    Page 5 of 48
Demographic Make-up of Head Start Eligible Children and Families 1302.11bii
Number

The Head Start program is operated through the Eagle County RE-50 School District,
which serves the Eagle River Valley, from Vail west to Dotsero. The Head Start program
provides comprehensive child development services to economically disadvantaged
children and their families, from age three to five. The program follows a center-based
model and each child receives four days of center-based early education services. In
addition, a Family Services Coordinator serves each family, assuring all ancillary and
support services are received.

During the 2020/2021 school year, the program enrolled 69 children into Head Start;
with 7 Head Start eligible children with complete applications currently unserved by
Head Start and on the wait list. Of the 7 unserved, 4 on the waitlist are below Federal
Poverty guidelines. Four live west of Wolcott and 3 live east of Wolcott. Four of the
unserved are eligible due to a housing crisis, and one of these also meets income
guidelines. In addition, there are 21 incomplete applications with missing information.
Of these incomplete applications, 8 are currently enrolled through tuition or IEP
programs.
                                                      East of Wolcott       West of Wolcott
 Total Applications                                          23                   42
 Applications missing information                            13                   8
 New unprocessed applications                                0                    0
 Completed applications ineligible for Head Start            15                   34
                                                     (8 served by tuition     (20 served by
                                                           or IEP)           tuition or IEP)
 Completed applications eligible for Head Start               2                    2
 based on income
 Applicants eligible for Head Start based on                  2                    3
 homeless status
 Applicants eligible for Head Start based on both             1                    0
 homeless status and income
 Applicant eligible for Head Start based on child             0                    0
 enrolled in Foster Care
 Total Head Start eligible applicants                         3                    5
 Total Head Start eligible currently unserved by              3                    4
 other ECE programs

                                                                                    Page 6 of 48
Head Start eligible applicants on the waitlist that 0 1
are already served through other ECE
programming (IEP or Tuition)
According to the US Census Bureau “American Community Survey 5 Year Estimates” for
2019, Eagle County’s population was 55,127, with 5.6% (3087) under the age of 5.
(https://data.census.gov/cedsci/all?q=Eagle%20County,%20Colorado 2/10/2021) In 2019, 537 children were born
in the county. The 5-year average of births is 596 with a range of 537-675.
(http://www.cohid.dphe.state.co.us/ 2/10/2021)
Head Start enrollment eligibility is based primarily on income levels. Since there are
more applications than enrollment spaces, other risk factor criteria are also considered
for weighting applicants, such as parental educational level, age of the parent at the time
of birth, and being a single parent. (See Appendix A: Selection Criteria) In Eagle County
teen births to moms at 17 years or younger remain low at 6 in 2019. Births to women
without a high school diploma represented 14.7% of births in 2019. The percent of
births to unmarried women decreased from 19.5% in 2018 to 17.3% in 2019. The
maternal annual household income for 68 of the births (13%) is less than $15,000.
(http://www.cohid.dphe.state.co.us 2/10/2021)
Eagle County births to foreign-born women increased from 27.8% in 2018 to 35.8% in
2019. Although births to foreign-born women is not noted specifically on the selection
criteria as a risk, foreign-born parents do have additional challenges accessing resources
and supports for their families due to eligibility barriers associated with many programs.
(http://www.cohid.dphe.state.co.us 2/10/2021)
800
727
700 662 678 BIRTHS with MATERNAL RISKS
610 620 675
665 584
600
500 564 537 Births
400 Births to Moms age 10-17
Mother's Ed Level < 12 years
300
216 Births to unmarried women
200
138 138 116 118 140 130 120 114
100 127 132 93
104 103 116 127 110
22 11 9 5 86 5 79
6 5 8 4 6
0
2010 2011 2012 2013 2014 2015 2016 2017 2018 2019
Page 7 of 48Beginning in 2015, the percent of children under 18 living in poverty has returned to the
pre-recession levels prior to 2010. 2019 Census Bureau American Community Survey
data identifies 8.2% of children under the age of 18 living in poverty in Eagle County and
6.2% of school age children (5-17) within the Eagle County School District boundaries
living in poverty. Although higher than desired, Eagle County School’s children living in
poverty is lower than both the U.S. (15.8%) and Colorado (10.7%) (Census.gov/ Our Surveys &
Programs/ SAIPE Program/ Data/ SAIPE Data Tools/ SAIPE Interactive Tool 2/10/2021) 2020 data is not available at this
time and it is hypothesized that 2020 data will show increases in poverty levels due to
the impacts of the global COVID -19 pandemic.
Percent of Children Under 18
Living in Poverty: Eagle County
16.0%
14.5% 14.3% Source: Colorado Kids Count
14.0% 13.6% Colorado Children’s Campaign;
*2019 Census Data
11.8%
12.0%
12.0% 10.6% 10.4%
10.0%
8.8%
8.1% 8.2%
8.0%
6.0%
2010 2011 2012 2013 2014 2015 2016 2017 2018 *2019
One can estimate the numbers of those Head Start eligible based solely on poverty in
Eagle County by adding the births in 2016 and 2017 and multiplying by 8.2%. This
results in an estimate of 102 eligible children. The communities of El Jebel and Basalt in
Eagle County are outside of the service area of the Eagle County School’s Head Start
grant. About 15% of children under the age of five lived in the El Jebel/Basalt area
according to the Census’s 2019 American Community Survey 5 year estimates. Thus, we
can further estimate the number of Head Start eligible children within the Eagle County
Schools service area to be 87 (102 x 85%). In the 2020-2021 school year, the Eagle
County Schools Head Start grant serves 69 Head Start children. Fifty-five (80%) Head
Start children live below 100% of poverty ($26,500 for a family of 4 in 2020). Twenty-
Page 8 of 48three (33%) of Head Start children met the McKinney-Vento definition of homelessness.
Some children (22%) are eligible in both income and housing crisis categories.
(Google Doc 2020-2021 HSCPP Enrollment 2/11/2021)
Eagle County Schools also serves at-risk children through the Colorado Preschool
Program (CPP) and Early Childhood At-Risk Enhancement (ECARE). Eighteen
CPP/ECARE children live below 100% of poverty. (Cap60 ECS database 2/11/2021) Thus, 73
children living below 100% of poverty are served by Eagle County Schools early
childhood programs, 84% of the estimated need. Considering those income-eligible on
the waitlist, the program is either serving, or has on the program’s radar, 89% of the
estimated number of income eligible children in Eagle County. There are 10 potentially
income eligible children in the community that are either “not found” or are part of the
group of applicants that have incomplete applications. Between the CPP/ECARE and
the Head Start program, 154 at-risk children currently receive services in 2020-2021 at
the time of this writing.
The Colorado Center on Law and Policy’s report, “The Self-Sufficiency Standard for
Eagle County 2018,” notes that an adult with an infant and preschooler in the household
requires an annual income of $81,801 to make ends meet. Thus, although there are few
that fall below the Federal Poverty guidelines, many more are struggling economically in
Eagle County. (cclponline.org/pub_library/)
Geographic Location
The Census’s American Community Survey 2014-2019 population estimates for children
under the age of five are identified by census tract and are combined here into
commonly referred to geographic locations within the boundaries of Eagle County
Schools.
Population Estimates of Children Under Age 5 in 2019
Gypsum/Dotsero Eagle Edwards Avon Eagle-Vail Minturn/
RedCliff/Vail
459 557 528 539 445 57
The following graphs roughly identify the estimated numbers of pre-school aged
children in poverty in each geographical area compared to the number of Head Start
Page 9 of 48and Colorado Preschool enrolled children living below poverty in the 20-21 school year.
Census track data does not identify percentages of children under the age of 5 living in
poverty. Thus, calculations were made by multiplying county poverty rates by child
population and doesn’t take into account that some census tracks have higher levels of
poverty than others. Census tract data suggests that within the boundaries of Eagle
County Schools poverty levels are highest in Avon’s census tract 5.03 at 17.1% and
Eagle’s census tract 4.03 at 15.2% for children under the age of 18.
Estimated Number of Children Ages 3-5 in Poverty vs
Number of Children Served by ECS Ages 3-5 in Poverty
30
25 27
20 18
18
15 17
15 15 15 15 Total Served in Poverty
10
Estimated # in Poverty
5 7 3
6
2
0
Gypsum Eagle Edwards Avon Eagle Vail Minturn, RC,
Dotsero Vail
The following table presents the above information in a different format.
ESTIMATED PERCENT OF PRESCHOOL AGE CHILDREN IN ESTIMATED
POVERTY SERVED BASED ON ESTIMATED NEED NUMBER
UNSERVED IN
POVERTY
GYPSUM/DOTSERO 100% 0
EAGLE 83% 3
EDWARDS 160% 0
AVON 39% 11
EAGLE VAIL 40% 9
VAIL/REDCLIFF/MINTURN 150% 0
Page 10 of 48There are only four complete Head Start applications that are below federal poverty
levels and are unserved. Some children are not attending their home school.
There are significantly less unprocessed applications in February 2021 than there were
in February 2020. In February 2020 there were 44 incomplete or unprocessed
applications compared to 21 incomplete applications in February 2021. There were not
any unprocessed applications this year.
Racial and Ethnic Composition
According to the Colorado Department of Public Health and Environment’s Vital
Statistics, in 2019 81% of the maternal race of children born in Eagle County identified
as White. Forty-five percent identified as White of Hispanic origin, 1% identified as
Asian American or Pacific Islander, 1.3% identified as Black/African American and 15%
were “unknown /other.” The “unknown/other” category may represent challenges in
data collection, difficulty of respondents in understanding the differences between race
and ethnicity categories, and the rigidity of the reporting system. The US Census 2015-
2019 American Community Survey 5-Year Estimate identifies Eagle County’s overall
population in 2019 by race as 88.8% White. Non-Hispanic White and Hispanic/Latino
(29.5%) represent the two dominant ethnicities in the county. The foreign-born
population is 17.5%. Just under twenty-nine percent of residents speak a language other
than English at home with 25.4% speaking Spanish at home (5 year averages 2015-2019- Census
https://data.census.gov/cedsci/profile?q=Eagle%20County,%20Colorado&g=0500000US08037 2/11/2021)
Housing Crisis
Twenty-three (33%) of Head Start enrolled children in 2020/2021 meet the Federal
definition of homelessness in the McKinney-Vento Act. Most are experiencing a
housing crisis by living in shared housing due to economic crisis. There are many
families living in just one bedroom or a garage. High levels of Head Start eligibility
based on homelessness are not surprising. The American Community Survey 2015-2019
identifies that the medium cost of rent is $1594, $87 more than the prior year. There is
a rental vacancy rate of 18.3. Due to second homeowners and rental properties, 44% of
all housing units are vacant. In addition, 46.7% of renters are paying more than 35% of
Page 11 of 48their income on rent and 29.4% of mortgage holders pay more than 35% of their income
on housing costs. (https://data.census.gov/cedsci/table)
Percent of Enrolled Head Start Children Meeting
McKinney-Vento Definition of Homelessness
60%
50%
49%
40%
52%
30%
41% 33%
20%
17-18 18-19 19-20 20-21
The 2018 Eagle Valley Housing Needs and Solutions study (Rees Consulting, Inc. /Williford, LLC)
describes the needs and challenges, and potential housing solutions for Eagle County.
The study notes that the Area Median Income (AMI) for a 3 person household is
$80,600. For this income, the maximum affordable purchase price for a home would be
$316,000 or the maximum affordable rent would be $2420 (page 3). Yet the medium sale
price in 2018 was $621,000 (page 18). The study reviewed listings for sale and found that
in 2017 there were only 13 units for sale at price range affordable for those with incomes
at or below AMI (page 19). For renters, the study notes “employees in a household need
to work about 120 hours a week, or three fulltime jobs, at minimum wage for the
average rent and utility payment to be considered ‘affordable.’” (page 21)
(https://www.eaglecounty.us/uploadedFiles/ECG_Website/Housing_and_Development/Documents/2018)
Foster Care
There currently is no Head Start enrolled child involved in the local Foster Care system.
Children with Disabilities
Eagle County Schools is the Local Education Agency (LEA) for children with disabilities.
Services are provided in inclusive classrooms. Each school district preschool site is
served by an Early Childhood professional with a Master’s Degree in Early Childhood
Special Education. Additional services are provided through Eagle County Schools’
Exceptional Student Services Department (Speech Therapy, Occupational Therapy,
Audiology, etc).
Page 12 of 48Data is collected by October 1st each year regarding the number of preschool children
served and their type of disability. The number of children served by the preschools
with disabilities doubled between 2008 and 2018, which is attributed to increased
outreach efforts. The large, broad and somewhat vague category of “preschooler with a
disability” is the most common disability category in 2020/2021. This category
represented 51% of enrolled children with a disability in the fall of 2020/2021. Speech
and language is now the second most common area of special needs among
preschoolers, representing 46% of disability-enrolled children by October 1st in
2020/2021. In the fall of 2020/2021, three additional children were identified; one
with a hearing disability and two with other health related disabilities.
140
126
117 115 118
120
105 107
104
100 94 93 106 # with Disability Oct 1
90 89 103
93 96
80 75 68 74
# with Disability February
57 57 67
60 65 71 68
62 63 51
44 % Speech Language
40 44 47
38 35 29 % Preschool W/ Disability
20 32 30
28 21 27 Category
0
SY SY SY SY SY SY SY SY SY SY
11/12 12/13 13/14 14/15 15/16 16/17 17/18 18/19 19/20 20/21
The “official” count of children with disabilities occurs in October, but children enter the
preschool program as they are identified, or in conjunction with a Part C child’s third
birthday and transition. Thus, the October count under-reports the number of children
with disabilities actually served annually through the Early Childhood Department. In
February 2021, children with disabilities represented 36% of total ECS preschool
enrollment (104/291). Fifteen percent (15 children) of all preschool children with
disabilities use transportation to access their special education services. Head Start
currently has twenty children enrolled with disabilities, with 19 identified at application
and one qualifying after enrollment.
Page 13 of 48Mountain Valley Developmental Services (MVDS) is the local Early Intervention/Part C
provider. In fiscal year 2019-2020 MVDS provided services to over 160 children with
disabilities under age three in the Eagle County Schools area. MVDS is also an
important partner regarding Child Find referrals and Child Find screenings. During the
last fiscal year, more than 150 children were referred, screened and/or evaluated for
these services. In addition, MVDS is the fiscal agent for the Rocky Mountain Early
Childhood Council (RMECC), employing the Council’s director and managing grant
funding.
20-21 School Year (July 2020- February 2021):
Total Child Find Referrals: 90
Part C referrals and evaluations: 55
Part B referrals and screenings: 35
19-20 School Year (July 2019 - June 2020)
Total Child Find Referrals: 236
Part C referrals and evaluations: 156
Part B referrals and screenings: 80
Data Regarding the Needs of Head Start Eligible Families 1302.11b1ii
Education:
Eagle County Schools measures educational progress on a variety of educational
domains on all enrolled children, including children with disabilities, three times a year
using the Teaching Strategies Gold Assessment. The domains are: social-emotional
development, cognitive development, physical skills, language, literacy, mathematics,
social studies, the arts, science and technology, and Spanish language and literacy. In
2017-2018, Teaching Strategies Gold combined the categories of Fine and Gross Motor
Skills into one Physical Skills category.
Due to the COVID-19 global pandemic, although there is data for the Fall 2019 check
point and the winter 2020 checkpoint there is no year-end data for the 2019-2020
school year. Nonetheless, all of the domains showed substantial educational growth
from fall to winter in the 2019-2020 school year. At the Fall Checkpoint, the lowest
areas for all children were in the domains of Spanish Literacy (16% at widely held
expectations), Spanish Language (28% at widely held expectations), and Mathematics
Page 14 of 48(36% at widely held expectations); demonstrating the greatest educational needs
entering the program. Native Spanish and native English speakers are assessed in both
English and Spanish language and literacy domains.
By the winter 2020 checkpoint, the percentage of children meeting widely held
expectations that would enter kindergarten in the fall of 2020 were the following:
Social-emotional: 77%
Physical Skills: 90%
English Language Skills: 60%
Spanish Language Skills: 38%
English Literacy Skills: 66%
Spanish Literacy Skills: 28%
Mathematics Skills: 48%
Cognitive Skills: 71%
Prior year’s data showed significant growth between the winter and spring checkpoint.
Although remote learning was provided to all enrolled preschoolers during the
quarantine period of the spring of 2020, there is not data to review the results of this
effort. Beginning in the fall of 2020, Gold data is to be collected as early as possible in
the school year, rather than at the end of the first quarter. Thus, fall Gold data will no
longer be comparable with years prior to 2020.
New in 2014-2015 were measurements in Gold regarding Spanish Language and
Literacy. All district sites, beginning in 2015-2016, provide dual language learning
opportunities. All sites, except three, are moving toward the implementation of dual
language using evidence-based strategies and are committed to moving towards a 50-50
model. The three schools that haven’t moved to a 50-50 model have smaller populations
of English Language Learners in their community but are offering specific areas of
Spanish instruction including the social and emotional curriculum, Dinosaur School,
and language and literacy instruction using storybook circles and the curriculum
Estrellita.
Page 15 of 48Page 16 of 48
Education needs as defined by families:

Parents were asked at the year-end Satisfaction Survey, “In your opinion, what are the
most important education needs in our community?” Thirty-four parents responded
with comments in the spring of 2019. Due to the global COVID-19 pandemic, there was
not a year-end Satisfaction Survey in the spring of 2020. For a complete list of
comments and results, please see the Parent Satisfaction Survey results (Appendix C). A
summary of parent-identified educational needs is noted here:
   •   General: Education, early childhood education. (5)
   •   Bilingual education. (3)
   •   Reading and reading to children. (3)
   •   Social-Emotional Development. (2)
           o Learning values. (Honesty, responsibility, etc). (3)
   •   More educational programs, including options for children who don’t qualify for
       special education. (2)
   •   Health and nutrition. (2)
   •   A school where children can communicate in the language they best understand.
   •   A quality learning environment.
   •   Skill-building for drug prevention.
   •   Better classroom ratios.
   •   Understanding technology
   •   Home-school Connection:
           o Opportunities to reinforce learning at home (including parental
              understanding of what children are being taught). (4)
           o Good communication between parents and kids. (2)
           o Family Engagement (including in school activities, meetings, events). (2)
           o Parents spending time with their children.

Health

In 2020, Eagle County ranked 3rd out of 60 Colorado counties in health outcomes.
Areas where Eagle County shines in the health behavior rankings are in the area of
premature death, the low percentages of people physically inactive, the high access to
exercise activities, the good ratio of residents to primary care doctors, low numbers of
preventable hospital stays, and low levels of air pollution. The areas where Eagle
County are lower in the health rankings is in the area of percentage of smokers (13%),

                                                                               Page 17 of 48
overall percentage of uninsured (12%), excessive drinking, and the percentage of ninth-
graders that graduate high school in four years (75%). (http://www.countyhealthrankings.org 2/9/2021)
In 2019, there were 169 deaths in Eagle County. Most were due to health related
conditions, including 41 cancer deaths and 30 related to cardiovascular disease. There
were 25 deaths due to accidents, 10 deaths due to suicide (including 5 deaths due to
discharge of firearms), 7 deaths due to drug overdose and 10 deaths due to alcohol
overdose. (Vital Statistics Program, CDPHE 2/9/2021)
The health needs of Head Start enrolled children are documented annually through the
Ninety Day Report and presented to the staff and community through the Health
Services Advisory Committee, the Policy Council, and through the self-assessment
process. Primary health needs are presented here. Please see the Ninety Day Report
(Appendix B) for full and detailed information. The top health needs, based on data, of
Head Start enrolled children are oral health, social-emotional health, vision care,
nutrition and insurance status.
Oral Health: A large percentage of
children at-risk (28%) required treatment
for tooth decay in the past year. One
challenge in oral health is lack of access to
fluoridated water for many low-income
children. Water is not fluoridated in Red
Cliff, Minturn, Gypsum and Dotsero. In
addition, none of the mobile home parks
(except the Aspens in Avon) have
fluoridated water. Many of the enrolled
children live in these areas. It is an Eagle
County Schools Head Start goal to increase
access to fluoridated water in the community. Efforts to bring fluoridated water to the
large mobile home park in Edwards have stalled. Negotiations between Eagle County
Public Health, the mobile home park owners, the Water and Sanitation District, and the
Page 18 of 48Edwards Metro District have halted. The high costs to convert the current system are a
challenge in the negotiation process. In addition, there are concerns that costs will be
transferred to low-income renters in the park. The owners of the mobile home park,
Ascencia, believe they will be able to provide fluoridated water to the park within 10
years through their own efforts.
Percent Of At-Risk Needing Dental TX
45%
April 1st 2020 - January 10th 2021
40% 39%
40%
38%
35%
30% 30%
26%
25%
20%
2015/2016 2016/2017 2017/2018 2018/2019 2019/2020
Currently there are six Medicaid Dental Providers in Eagle County: Image Dental,
Comfort Dental, All About Smiles, Mountain Family Health Center (MFHC), Mountain
Valley Kids Dental and All Kids Dental. Image Dental, All About Smiles and MFHC
refer any restorative needs to pediatric dental specialists, usually All Kids Dental.
Comfort Dental will also provide restorative care, as long as sedation is not required.
Mountain Valley Kids Dental (MVKD) is also a pediatric dental specialist located in
Edwards. MVKD, newly opened in May 2018, will likely see more pediatric referrals as
their marketing and community presence becomes known. All Kids Dental is the dental
home to 43% of the at-risk enrollment.
Percent Head Start Compliant with
EPSDT Dental Schedule
90%
80% 86% 83%
72%
70% 75% 78%
60%
50%
2015/2016 2016/2017 2017/2018 2018/2019 2019/2020
Page 19 of 48Social-Emotional: All preschoolers receive a social emotional screen (DECA) within
the first 30 days of the school year. Both parents and teachers complete the screen.
Children and families are referred for follow up individual consult(s) with a mental
health professional if the results meet any of the following conditions:
• The teacher results indicate concern in any of the five social-emotional domains
reviewed.
• The parent results indicate concern in three or more of the five domains
reviewed. (Parents are given education materials for any identified concerns).
• The family services home visit interview identifies other areas of crisis or
concern.
This year 62% of Head Start enrolled indicated the need for follow up as indicated by the
DECA, much higher than the percent identified in the application process with low
social skills (49%). There is an effective system in place to assure the family meets with
a mental health professional to discuss family needs and concerns. Parent consults with
a mental health professional are one hour long and additional sessions are available as
needed. Each program also implements the social-emotional program of “Dinosaur
School” and/or Second Step. The Incredible Years parenting classes are offered in
English and Spanish at least annually in the community.
HEAD START SOCIAL EMOTIONAL SCREENS
70% RECOMMENDING FOLLOW UP 2016-2020
60%
60% 61% 62%
50%
51%
40%
41%
30%
20%
16/17 Follow Up 17/18 Follow Up 18/19 Follow Up 19/20 Follow up 20/21 Follow up
Needed Needed Needed Needed Needed
Page 20 of 48It is the goal that identified families, including
CPP/ECARE enrolled, through funding from the
Temple Hoyne Buell grant, will receive dedicated
time with the mental health professional to
discuss concerns and strategies. Fifty-eight
percent of Head Start children with social
emotional issues had met with a mental health
professional within 90 days of enrollment (an
improvement of 30% from the prior year). Sixty
percent of CPP/ECARE enrolled children with
social emotional issues had met with a mental
health professional within 90 days of enrollment (an improvement of 39% from the
prior year). Family Service Coordinators are persistent at continuing to attempt the
scheduling of follow up visits throughout the school year.
SOCIAL AND EMOTIONAL SUPPORT 2020/2021
120%
97%
100% 89% 93%
80% 69% 65%
62% 66% 65% 65%
58% 60% 59%
60% HEAD START
40% CPP
20% AT-RISK
0%
% SCREENED % F/U % F/U % F/U
INDICATED INDICATED INDICATED
RCVD @ 90 DAYS RCVD BY 1/2021
Page 21 of 48Vision: All Head Start enrolled children received vision screens within forty-five days
of enrollment. The program has an important partnership
with the Lions Club, which conducts most of the vision screens
for enrolled preschoolers. The Lions Club utilizes a
photoscreener. The photoscreener is able to give immediate
preliminary results, expediting the referral process. The Lions
Club partnership has been very helpful in assisting families to
receive services locally through their generous voucher
program. The voucher provides approximately $200 towards
a vision exam and corrective lenses for each accepted
applicant.
Eagle Valley Vision and Dr. Pence began accepting Medicaid patients in 2015 and is only
Medicaid provider in Eagle County that will see four year olds. However, Dr. Pence will
not see children under the age of four. 20/ 20 Eye Care in Glenwood Springs and four
providers in Summit County also accept Medicaid and are willing to see children under
the age of four.
By February 2021, 55% of Head Start/Colorado Preschool Program vision referrals had
been completed, resulting in 6 children receiving glasses. About 20% of those screened
are referred for a professional eye exam.
VISION SCREENED NEW REFERRAL INDICATED REFERRAL COMPLETE
Head Start 68/72 94% 11/68 16% 6/11 55%
CPP 78/80 98% 23/78 29% 7/23 30%
All At-Risk 146/152 96% 34/146 23% 13/34 38%
Insurance
Having health insurance increases a child’s ability to access health services, especially
for low-income families that cannot afford to pay out-of-pocket for care. The political
climate from 2017-2020 increased the anxiety of immigrant parents to apply for
Medicaid for their citizen children. Family Services Coordinators relate that there are a
few children that are Medicaid eligible (Two Head Start and 5 CPP children) but remain
Page 22 of 48uninsured due to anxieties of accepting government assistance in the current political
climate.
Uninsured Head Start Children @ 90 days
25% 23%
20% 20%
15% 15%
12% 13%
10%
5%
0%
2016 2017 2018 2019 2020
Nutrition
Although the Centers for Disease Control (CDC) identified Eagle County as having the
lowest percentage of obesity in the country (Vail Daily 11/24/2017), data collected on Head Start
enrolled children demonstrate nutritional needs. Twenty-one percent of Head Start
enrolled children are overweight or obese. Eighty-one percent (39/48) of all at-risk
underweight, overweight and obese children have received nutrition consults by a
Registered Dietician by February 2021. Through funding from the Temple Hoyne Buell
Foundation, resources are available to provide nutrition consults to all nutritionally at-
risk Head Start and Colorado Preschool Program enrolled children and families.
At-risk preschool enrollments with symptoms of anemia also receive nutrition
consultations. The percentage of preschool children at-risk with anemia is 4% (5).
Three of the four children have received a nutritional consult and one other passed a
rescreen. The greatest number of anemia cases appears around the age of 1, when a
child’s diet transitions from that of an infant to that of a toddler.
Page 23 of 48Head Start BMI Comparison 16/17 to 20/21
30%
28%
25%
23% 24%
20% 21%
Underweight
19% 17%
15% 14% 14% Overweight
13%
12%
14%
10% Obese
10% 7% 10%
Overweight and
5% 4% 6% 4% 4% Obese
4%
0%
0%
2016-17 2017-18 2018-19 2019-20 2020-21
Risk of hunger is identified by asking families, through interview, the scientifically
reviewed questions of: “Within the past three months did you worry whether your food
would run out before you had money to buy more.” Or, “Within the past three months
the food we bought just didn’t last and we didn’t have money to buy more.” Hunger
levels are 38% of at-risk enrollment in 2020/2021. Children identified as at-risk for
hunger receive a weekly bag of food through the Food Rescue Express, are referred to
Supplemental Nutrition Assistance Program (SNAP), receive Free and Reduced lunches,
and are linked to local food banks (ie: Salvation Army, Our Community Foundation) and
free community dinners.
40%
38% 38%
35%
34% 35%
30% 32%
24% 28% % HS & CPP experiencing
25% 22%
hunger
20% 18%
15% of those that are hungry, the
13% percent that are also
10% obese/overweight
5%
0%
16-17 17-18 18-19 19-20 20-21
Page 24 of 48Health and Nutrition as defined by parents
Parents were asked in the year-end Satisfaction Survey, “In your opinion, what are the
most important health and nutrition needs in our community?” Forty-three parents
responded with comments in the Spring of 2019. Due to the COVID-19 global
pandemic, there was not a parent satisfaction survey completed for the 2019/2020
school year. For a complete list of comments, please see the Parent Satisfaction Survey
results (Appendix C). Most of the comments focused on nutrition related topics rather
than other types of health needs. A summary of parent-identified health and nutrition
needs are noted here:
• Healthy Eating. (17)
o Vegetables. (4)
o Affordable nutritious food.
o Accessible nutritious food.
o Available nutritious food.
o Fruit.
o Fiber.
o Protein.
o No sugary beverages (soda) for children.
o Increased variety of healthy food (fruits and vegetables) for school lunch.
• Nutrition education. (3)
o Nutrition education for children. (2)
• Activities to encourage exercise. (8)
o Exercise education.
o Sports.
o Field house.
• Health education. (2)
• Access to clean water. (2)
• Adopting healthy habits.
o Hygiene.
o Hand washing.
o Keeping the family healthy.
o Children dressed appropriately when outside.
• Accessible primary care.
o Increased access to Medicaid/ CHP+ to assure affordable care for children.
• Affordable emergency care.
• Dental care.
o Affordable dental care for uninsured.
Page 25 of 48• Vision care. • Communication. • Studies. Social Services Social Service needs, for the purpose of this report, are calculated by reviewing both the risk factors identified by enrolled families in the application process, and identified by issues recognized during the home visit and documented in the annual Head Start Program Information Report (PIR). Risk factors of 69 Head Start enrolled children were reviewed using the program database, Cap60. Risk factors that changed by 5% or more from fall 2019 to fall 2020 include the categories of families living at 100% of poverty (+15%), parents with a low educational level (+12%), high parenting demand (+7%), single parent households (-21%), homelessness (-12%), children with poor social skills (-14%), history of abuse and neglect (-8%), history of drug and alcohol abuse (-8%) and high mobility (-5%).The categories of risk factors identified and the percentage of enrolled children’s families with these risks are as follows: • English Language Learner 81% •
achieve goals. The following graph identifies the number of risk factors which each
enrolled Head Start child faces. The mean number of risk factors per enrolled Head
Start child in 2020/2021 is 4.88, lower than the prior year. The mean number of Head
Start risk factors per site is fairly even ranging from a mean low of 3.88 Head Start risk
factors at the Wolves at EELC (representing Edwards) to a mean high of 6.25 at Red Hill
Elementary.

                             Number of Risk Factors per
                          Head Start Enrolled Child 2020-2021
25
                                       20
20                                                                        Number of Children
 15                                                                       Having X Amount of Risk…
                                               13        14
10
                                 7
  5                                                                   6
       1              3                                                       3                2
  0
           1          2      3         4         5        6           7           8        9
                                       NUMBER OF RISK FACTORS

               Mean Number of Risk Factors for Head Start Enrolled
                              Children 2016-2020
   6

 5.5                                            5.7

                                 5.3                            5.3
   5                                                                                     4.9
                5.1
 4.5
           2016/2017       2017/2018        2018/2019         2019/2020           2020/2021

Estimates of social services needs can also be calculated by reviewing the annual Head
Start Program Information Report (PIR) regarding the number of Head Start families
who needed a variety of social services during the 2018-2019 school year. These needs
may have been identified through the application process or through the relationship
building process with the Family Services Coordinator during the program year. The
data is tracked through the Cap60/Servue data base. In 2019-2020 the Office of Head

                                                                                      Page 27 of 48
Start did not require a PIR due to COVID-19 so the information was not collected in a
systematic way.
Service % of families with identified
need during program year
as reported on the Head
Start PIR for 2019.
Mental Health Services 59%
Health Education 58%
Emergency or Crisis Intervention 55%
Parenting Education 39%
Asset Building Services (Financial education) 20%
Housing Assistance 19%
English as Second Language Training 19%
Adult Education 14%
Job Training 3%
Child Abuse and Neglect Services 3%
Relationship or Marriage Education 1%
Typical work, school, and training schedules of parents with eligible children
1302.11b1iii
Social and economic factors influence schedules and access to early childhood services.
Schedules, preferred hours of service and locations of eligible families are considered in
the application and enrollment process to assure that the program is best able to meet
the needs of children and families. In addition, an annual population-based review of
HS/CPP enrolled children’s parent/guardian’s ability to drop off and pick up their
children helps determine if the programs hours of operation reflect the needs of the
families the program serves. The following represents an analysis of parents of Head
Start/CPP schedules from the 2020/2021 school year.
• 62% of parents are able to have schedules that allow the easy coordination of
both a 7:50am drop off time and a 2:50pm pick up time. Of those, 35% choose
extended day services anyway.
• 8% of parents have schedules that create difficulties in dropping off children at
7:50am and/or have frequent tardy arrivals.
• 26% of parents have schedules that create difficulties in picking up children at
2:50pm. Of those, 85% (33/39) are enrolled in an extended day program. The
extended day provides continued childcare into the late afternoon from 2:50-
5:00/5:30.
Page 28 of 48• 15% (11/72) of parents who have their children enrolled in extended day have
difficulties picking up their children at 5:00/5:30.
• 10 children have frequent absences that are not due to illness.
Social Services Needs as defined by parents
Satisfaction Survey respondents were asked, “In your opinion, what are the most
important social service needs in our community?” Twenty-five parents commented
in the Spring 2019 survey. Due to the COIVD-19 global pandemic, there was not a
satisfaction survey for the 1019/2020 school year. For a complete list of comments,
please see the Parent Satisfaction Survey results (Appendix C). A summary of parent-
identified social service needs are noted here. (Note: Some of the social services needs
identified by families’ overlap into other categories, such as health and education.)
• Food/Food subsidies 10
• Police services 10
o To assure safety and peace 2
• Fire Department 5
• Job training 8
o Job training that includes financial aid
o Job training that includes child care
o Computer skills
• Housing 9
o Subsidized
o Stability and security
• Policy research
• Services towards children
• Engagement
• Mental health services for families struggling
• Established and well organized social services
• Opportunities to learn English
o Affordable English classes
• Increased child care capacity
• Transportation
• Transportation is a big issue in the community
Page 29 of 48Needs Identified by Community Immigration Survey
In the Fall of 2019, Catholic Charities’ Community Integration Services conducted a
survey of immigrants. Some of the results are included here as many parents of enrolled
children are immigrants. There were 144/237 survey responses from parents. Survey
questions were written with a scaled response, where 1 equals strongly disagree; 2
equals disagree; 3 equals neutral; 4 equals agree and 5 equals strongly agree.
There were 28 scaled questions. The most favorable, highest level of agreement, follow:
• I feel safe in Eagle County. (4.25)
• I want to stay in Eagle County long term. (4.21)
• I can communicate with my child’s teacher and or childcare provider. (4.05)
• I trust the local law enforcement officers. (4.03)
The least favorable, lowest level of agreement, follow:
• My housing costs are affordable. (2.37)
o East of Wolcott. (1.6)
o West of Wolcott. (2.36)
• I am able to be in the same profession as when I was in my native country. (2.37)
• I have access to mental health services that meet my needs. (2.67)
o I feel comfortable seeking mental health care when I need it. (2.95)
• I have access to dental care that meets my needs. (2.89)
• I can access legal services and support. (2.94)
Catholic Charities also administered the same survey in 2014. Areas that changed by
more than .3 since 2014 are:
• My housing costs are affordable. (2.83 in 2014, 2.37 in 2019, -0.46)
• I feel like my child is safe. (4.28 in 2014, 3.92 in 2019, -0.36)
• I am able to help my child with their homework. (4.1 in 2014, 3.75 in 2019, -0.35)
• I understand what my child’s teacher expects of me. (4.14 in 2014, 3.81 in 2019,
-0.33)
Community Goals Identified by Head Start/CPP Parents
Each Head Start/CPP family receives a home visit by a Family Services Coordinator.
During these visits families are asked what their goals are for the community. The
following are community goals identified by Head Start/CPP parents in the Fall of 2020.
Similar goals have been combined for reporting purposes. Head Start and Colorado
Page 30 of 48Preschool Program Families are asked at their initial home visit what would make their
community a better place to live. Here are the results:
Community wide goals:
• Child care
o Affordable/free after school programs. (2)
o Afterschool care for high needs children.
o More availability extended hours for childcare. (5)
o Universal scholarships for preschool. (2)
o Scholarships for after school programs for preschool children
o Have more opportunities for daycare/activities at low cost for kids.
o Availability of childcare after 5pm.
o Learning center for children after school. (2)
o Summer school for all children.
• Recreation
o More affordable activities for children (2)
o Affordable sports
Affordable sports options for families
o Have more activities for young children at a low cost at all recreation
centers.
o Have more recreational places that have bilingual staff to help.
o More activities for preschool aged children. (4)
o More activities for toddlers.
o More fun activities for children.
o Activities for parents.
o More family events.
o Activities for teenagers at low cost.
o More recreation centers.
o More winter activities for children besides skiing. (2)
o A park with more playgrounds and activities for children.
• Mental Health
o More therapies available
o Mental Health for Children.
Play therapy.
o Mental Health for the whole family-available and affordable.
o Free mental health support.
• Housing
o Affordable rent.
o Affordable housing (2).
o Housing for the homeless
Page 31 of 48• Legal Aid
o Immigration help and information
o Accessible and affordable legal assistance
• More resources for the uninsured
• Reading clouds for children
• More resources for sick people.
• Parents should not work as much.
• More assistance for working moms.
• Parent involvement/ be more active in schools.
• TBIR (Trust-Based Intervention) trainings.
• Increased accessibility to everything.
• Boot camps available in the county.
• Respect for life - there is a culture of violence, teach the value of life.
Dotsero:
• Better drinking water.
• Better streets.
Gypsum:
• Extracurricular activities for preschool children (4)
• Better internet reception
• Support for families of preschoolers (3)
• Prevention screenings for cancer, diabetes, etc.
• A safe community
• Food Bags
• Community unity
• Reduce speeders on Riverview St. in Gypsum, heavy traffic at certain times.
• Resources and support for attending Town of Gypsum public meetings.
• More family activities in the winter time with more variety for young children at a
low cost at the Gypsum Recreation Center.
• Have more family friendly events in Gypsum. (2)
• Parenting classes.
• Places for teenagers, where they can hang out or do activities with no adults.
• Affordable children’s camps.
• Babysitting classes.
• A big park to walk around with lots of trees.
• A movie theatre in Spanish.
• Rollerblade center is Gypsum.
Page 32 of 48Eagle:
• Hwy 6 between Eagle and Gypsum is very busy, needs to be better safety
monitoring.
• Protect/clean the environment, take care of Eagle.
Edwards:
• Internet access with better service in Edwards
• Recreation Center.
• Music.
• Art activities.
• Soccer field at Lake Creek.
• Affordable housing.
• Eagle River Village Mobile home park
o Clean drinking water.
o Notice when the water is turned off
o Improved streets/Street repair.
o Park safety for young children
Deter illegal activities in park
o Street lights. (2)
o Trash clean up/cleaner. (2)
o Affordable rent.
o Finish the park. (4)
o Free activities in the community room.
Avon:
• Playground on the Eagle Bend apartment second phase.
Eagle-Vail:
• Internet access with better service in Eagle Vail (Riverview)
• Playground at Kayak apartments.
• More cleaning at Kayak apartments.
Additional Prevalent Social Factors
Additional social factors impact the well-being of eligible children and their families. In
many ways, the data from the Community Assessment from the Center for Applied
Research and Engagement Systems (CARES) compliments the social factors identified
by parents. The following social factors show differences from state or national data.
Page 33 of 48CARES gets most of its data from the US Census Bureau, American Community Survey
2015-2019, but puts the data in an easy-to-navigate format. (https://sparkmap.org/report, 2/9/2021)
• Eagle County’s population with limited English proficiency is more than double
the percent of the state. Eagle County’s limited English proficient population is
12.1% while the state’s is 5.78%.
• The foreign-born population in Eagle County is 17.54% compared to 13.55% in
the United States.
• The percent of housing burdened households (housing costs above 30% of
income) is 38.58% compared to 31.59% in Colorado.
• Eagle County has 38.79% occupied housing units with one or more substandard
conditions compared to Colorado’s 32.03%. (To be considered substandard the
unit must have one of the following conditions: 1) Lacking complete plumbing
facilities; 2) lacking complete kitchen facilities; 3) with 1.01 or more occupants
per room; 4) monthly owner costs as % of household income greater than 30%;
and 5) gross rent as a % of household income greater than 30%.)
• The resort economy attracts many second homeowners. 44.02% of Eagle
County’s housing units remain vacant compared to Colorado’s 9.95%.
• There is significant income disparity by ethnicity. The median family income for
Non-Hispanic whites is $93,947 while the median family income for
Hispanic/Latinos is $55,310. Medium incomes have declined from the prior
year’s report by $1779 for Non-Hispanic whites and by $5885 for Hispanic /
Latinos.
• Eagle County’s population of uninsured adults (13.55%) exceeds that of the state
(7.63%) and nation (8.84%). Eagle County’s population of uninsured children
(10.59%) exceeds that of the state (4.47%) and nation (5.08%). There is an ethnic
disparity in insurance coverage, with 7.36% Non-Hispanic whites being
uninsured compared to 28.28% of Hispanic/Latino being uninsured.
• The ratio of mental health providers to Eagle County’s population has 1 provider
to every 652 persons. Colorado’s ratio is 1 provider to every 303 persons in 2018.
Eagle Valley Behavioral Health noted in February 2021 that in the last two years
over 40 licensed providers have been added to address this need.
Page 34 of 48• Eagle County’s population that is living more than 1 mile from the nearest
supermarket, supercenter or large grocery store is 17.84%. This data highlights
populations and geographies facing food insecurity.
• In Eagle County, 22.05% of adults drink excessively compared to 20.47% in
Colorado.
As noted in the Immigration Integration Survey, most feel safe in our community.
Indeed, Eagle County is a relatively safe place to live and visit. However, Eagle County
is not crime-free. The following table describes crimes in Eagle County in 2019. The
total column areas that declined by more than 10% in 2019 are marked in green and
areas that increased by more than 10% in 2019 are marked in red.
2019 Eagle Vail Avon Eagle TOTALS
Cases County
Sheriff
Assaults 16 8 7 11 42
Sex 35 9 7 8 59
Offenses
DUI 47 37 98 19 201
Drug/ 54 26 19 8 89
Narcotics
Theft 173 222 83 47 525
Burglary 25 26 1 2 54
Fraud 36 128 17 8 189
Motor 14 9 10 6 39
Vehicle
Theft
Robbery 0 2 0 0 2
Hate 0 0 0 0 0
Crimes
*Basalt’s crime statistics are not included as Basalt is not in the Eagle River Valley Head Start Service
area. Eagle County’s cases may include the town of El Jebel, not in Head Start’s service area, as they do
not have their own police department. (https://coloradocrimestats.state.co.us/tops/ 2/10/2021)
Child Development and Child-Care Programs Serving Head Start Eligible
1302.11b1iv
Eagle County Schools administers seven preschools within seven elementary schools. In
the fall of 2020 preschool classrooms at Avon Elementary School and Edwards
Elementary School closed and June Creek Elementary School converted into the
Edwards Early Learning Center. This resulted in the net increase of two preschool
classrooms, for a total of 27 preschool classrooms, and an increase of an infant and
Page 35 of 48toddler classroom for a total of 3 infant and 3 toddler classrooms. In addition, Eagle
County Schools contracts with the private childcare, the Family Learning Center, to offer
up to 8 additional CPP/ECARE slots. Eagle County Schools is the primary child-care
provider serving Head Start eligible children in Eagle County. Head Start children are
served in blended classrooms at Edwards Early Learning Center, Homestake Peak,
Eagle Valley, Gypsum, and Red Hill elementary schools.
Many Head Start eligible children who are not served through the Head Start grant are
served by the state-funded CPP/ECARE and/or Eagle County School’s special education
program. All Head Start enrolled children are able to receive full day/four day a week
services due to blended funding from CPP/ECARE, unless they are three years old with
less than three risk factors. An additional 81 children with multiple risk factors are
served through CPP/ECARE funding. Of the 81, 7 are served through the contracted
arrangement with the Family Learning Center. Additional Colorado Preschool Program
(ECARE) slots were awarded to the school district in 2013, 2014, and 2019. This both
increased the quality of services and quantity of children at-risk served. Beginning in
the 2016/2017 school year, the Colorado Department of Education began to allow
children enrolled in special education services to also enroll in Colorado Preschool
Program. This change has allowed many special education students to benefit from full
day services.
Decisions regarding which Head Start children are served through the Head Start grant,
which are served through the CPP (or ECARE) program, and which are put on a waitlist
are based on a point system approved annually by the Head Start Policy Council and the
Governing Body, the Board of Education for Eagle County Schools. Colorado Preschool
Program’s eligibility criteria, although in many ways similar to Head Start’s, is based on
state legislation. See Appendix A for the 2020/2021 Selection Criteria Worksheet.
Since 2017, ECS provides extended year and extended day programming at no cost to
eligible Head Start and CPP families. The extended day preschool program, subsidized
by the November 2016 mill levy, allows children to receive services after the traditional
school day until 5:00 or 5:30. One classroom at each site operates an extended day
program in order to better meet the needs of families. In the 2020/2021 school year,
Page 36 of 48You can also read