THE MILLENNIAL GENERATION: A demographic bridge to America's diverse future - William H. Frey January 2018 - Brookings Institution
←
→
Page content transcription
If your browser does not render page correctly, please read the page content below

THE
MILLENNIAL
GENERATION:
A demographic bridge to America’s diverse future

William H. Frey
January 2018

Overview

The millennial generation, over 75 million strong        will affect their current and future quality of
is America’s largest—eclipsing the current size of       life—including their health and well-being as this
the postwar baby boom generation. While much             generation ages.
attention has been given to this generation’s
unique attributes—its technological savvy, its           The national picture of a population that is
tolerance and independence, and its aversion to          diversifying in its younger ages while its white
large institutions—one aspect of millennials is          population is rapidly aging is an oversimplification
most relevant to its future impact on the nation:        because it does not account for variation among
its racial and ethnic diversity.                         states and metropolitan areas. Although the
                                                         public and media attention tends to focus on the
The millennial generation is the demographic             lives of millennials in high-profile markets such as
“bridge” to the nation’s diverse future. By the mid-     New York, Washington, D.C., and San Francisco,
2040s, racial and ethnic minorities are projected        local contexts for the social and economic
to make up over half of all Americans, but the           opportunities available to millennials differ widely
2020 census will show that the postmillennial            across the country.
generation—people who are younger than
millennials—will already be minority white. This         This report, its appendices, and its associated
means that millennials, now 44 percent minority,         interactive website examine the demographic
will pave the way for the generations behind them        makeup of millennials for the nation, the 100
as workers, consumers, and leaders in business           largest metropolitan areas, and all 50 states.
and government in their acceptance by and                With an emphasis on its unique racial diversity,
participation in tomorrow’s more racially diverse        this report compares the millennial generation
America.                                                 with earlier counterparts at the same stage of
                                                         life and assesses how different segments of the
As a bridge to the future, this highly diverse           millennial population are faring, as well as where
generation will face both opportunities and              they are living. Most notably, it postulates how
challenges. Race and ethnic disparities in               millennials can represent a demographic bridge
education attainment, family formation, income,          to the future—helping to close the racial and
and housing persist among the millennials. These         cultural generation gap that, as recent politics
differences need to be recognized because they           have shown, is dividing the nation.

2                Brookings Metropolitan Policy Program
Table of contents

Introduction                                                                                    4

Who are millennials and how distinct are they?                                                  6
Millennial size and diversity
Millennials’ unique attributes reflect their diversity
  Language spoken at home, immigration status, and interracial marriages
 Marital status and household relationships
 Education attainment
 Homeownership
 Financial security

Where are millennials living?                                                                   15
Growth and share of millennials in metropolitan areas and states
Racial and ethnic diversity among metropolitan areas and states
Millennials in urban cores, suburbs, and exurbs

How do millennials differ on education and poverty across
metropolitan areas and states?                                                                  24
Education
Poverty

How will millennials serve as a “bridge” across generations?                                    31
Millennials and the cultural generation gap
Geography of the cultural generation gap
Projecting millennials’ role into the future

Conclusion                                                                                      40

Appendix A: Race-ethnic composition of millennial population, 100
largest metropolitan areas                                                                      42

                  The millennial generation: A demographic bridge to America’s diverse future        3
Introduction

The millennial generation, over 75 million strong        markets such as New York, Washington, D.C., and
is America’s largest—eclipsing the current size          San Francisco, local contexts for the social and
of the postwar baby boom generation. Now                 economic opportunities available to millennials
all fully adults, millennials make up nearly a           differ widely across the country.
quarter of the total U.S. population, 30 percent
of the voting age population, and almost two-            For example, in Bakersfield, Calif., the millennial
fifths of the working age population. While much         population is 59 percent Hispanic and 30 percent
attention has been given to this generation’s            white; and among those ages 25-34, 29 percent
unique attributes—its technological savvy, its           are in poverty and only 14 percent graduated
tolerance and independence, and its aversion to          from college. In Minneapolis-St Paul, 71 percent
large institutions—one aspect of millennials is          of millennials are white; and among those ages
most relevant to its future impact on the nation:        25-34, just 10 percent are in poverty and 47
its racial and ethnic diversity.                         percent are college graduates. By virtue of their
                                                         distinct demographic profiles, each area provides
The millennial generation is the demographic             different opportunities and challenges for
“bridge” to the nation’s diverse future. By the mid-     millennials to succeed in serving as bridges to the
2040s, racial and ethnic minorities are projected        next generation.
to make up over half of all Americans, but the
2020 census will show that the postmillennial            At the local level, millennials affect important
generation—people who are younger than                   dynamics that influence housing markets,
millennials—will already be minority white. This         educational institutions, tax bases, and labor
means that millennials, now 44 percent minority,         forces, not to mention their implications for
will pave the way for the generations behind them        altering local economies, levels of income
as workers, consumers, and leaders in business           inequality, and needs for promoting greater
and government in their acceptance by and                racial and social inclusion. As such, local
participation in tomorrow’s more racially diverse        political officials, industry leaders, university
America.                                                 and community college networks, and nonprofit
                                                         institutions need to be made aware of changes
As a bridge to the future, this highly diverse           this new adult generation will bring.
generation will face both opportunities and
challenges. Race and ethnicity disparities in            This report, its appendices, and its associated
education attainment, family formation, income,          interactive website examine the demographic
and housing persist among millennials. These             makeup of millennials for the nation, the 100
differences need to be recognized because they           largest metropolitan areas, and all 50 states.
will affect their current and future quality of          With an emphasis on its unique racial diversity,
life—including their health and well-being as this       this report compares the millennial generation
generation ages.                                         with earlier counterparts at the same stage of
                                                         life and assesses how different segments of the
Moreover, the national picture of a population           millennial population are faring, as well as where
that is diversifying in its younger ages while           they are living. Most notably, it postulates how
its white population is rapidly aging is an              millennials can represent a demographic bridge
oversimplification because it does not account for       to the future—helping to close the racial and
variation among states and metropolitan areas.           cultural generation gap that, as recent politics
Although the public and media attention tends            have shown, is dividing the nation.
to focus on the lives of millennials in high-profile

4                Brookings Metropolitan Policy Program
This report addresses four questions:                    In answering these questions, this report draws
                                                         from a variety of U.S. Census Bureau data,
1. Who are millennials and how distinct are              including the Current Population Survey, the
   they?                                                 American Community Survey, census estimates
2. Where are millennials living?                         and projections, as well as historical decennial
3. How do millennials differ on education and            censuses. It also presents metropolitan area
   poverty across metropolitan areas and                 projections conducted by the author.1 Millennials
   states?                                               are defined as persons born between 1981 and
4. How will millennials serve as a bridge across         1997. In some parts of the report, special focus
   generations?                                          is given to younger millennials, ages 18-24, and
                                                         older millennials, ages 25-34, as these groups
                                                         represent different stages of the young adult
                                                         cycle.

                  The millennial generation: A demographic bridge to America’s diverse future           5
Who are millennials and how distinct are they?
The “millennial” label is applied to a generation        Millennials are distinct from earlier young adult
with birth years of 1981 through 1997, which             generations in one important demographic
followed the “birth dearth” period of Generation         respect: their racial and ethnic diversity. Overall,
X (born 1965-1980) , which was preceded by the           millennials are 55.8 percent white and nearly 30
baby boom generation (born 1946-1964). The               percent “new minorities”— Hispanic, Asian, and
exact dates of the millennial generation vary            those identifying as two or more races. In 2000,
among researchers.2 However, as with the baby            when millennials were just beginning to turn 18,
boomers, the millennials’ distinction is associated      young adults were 63 percent white. In 1980, when
not just with their large size—at 75.3 million, the      occupied by baby boomers, young adults were 78
millennial generation has now surpassed the baby         percent white. The large waves of immigration to
boomers—but also with their unique attributes in         the U.S. in the 1980s and 1990s, especially from
terms of demographics, tastes, and lifestyles. As        Latin America and Asia,3 coupled with the aging
their name implies, they are the first generation        of the white population,4 made millennials a far
to reach adulthood in the new millennium,                more racially and ethnically diverse generation
suggesting that they will usher in changes that          than any that preceded it.
will be followed by later generations this century.
                                                         As shown in Figure 2, there is a clear shift in
Millennial size and diversity                            racial and ethnic makeup between millennials
                                                         and prior generations. In 2015, the 55 and older
Despite their large size, millennials, are not as        population, including most baby boomers and
dominant as a share of the total population today        those born before them, were “whiter” than the
as the baby boomers were when they were young            country as a whole (75 percent vs. 61.6 percent),
adults. This can be seen in Figure 1, which compares     and among them, blacks were the largest racial
the baby boomers in 1980 with millennials in             minority. Those in the 35-54 age group, including
2015. In 1980, baby boomers, then ages 16-34,            Generation X and the tail end of the baby boomers
represented 33 percent of the population and             (at 61.5 percent white, 17.6 percent Hispanic, and
vastly outweighed generations that were their            12.5 percent black), were roughly representative
seniors. Their demographic imprint alone shows           of the nation’s racial and ethnic composition.
why, at the time, baby boomers held such power
in the workplace and marketplace. In contrast,           Tomorrow’s diversity is foreshadowed by the
millennial young adults today, while also large in       postmillennial generation—persons now under
numbers, represent 23 percent of the population          age 18. As Figure 2 indicates, whites make up
and must contend with sizable older generations,         just over half (51.5 percent) of this generation, of
including baby boomers, in gaining attention             whom people ages one through five are minority
socially, economically, and politically.                 white. Over one-third of this group consists of

6                Brookings Metropolitan Policy Program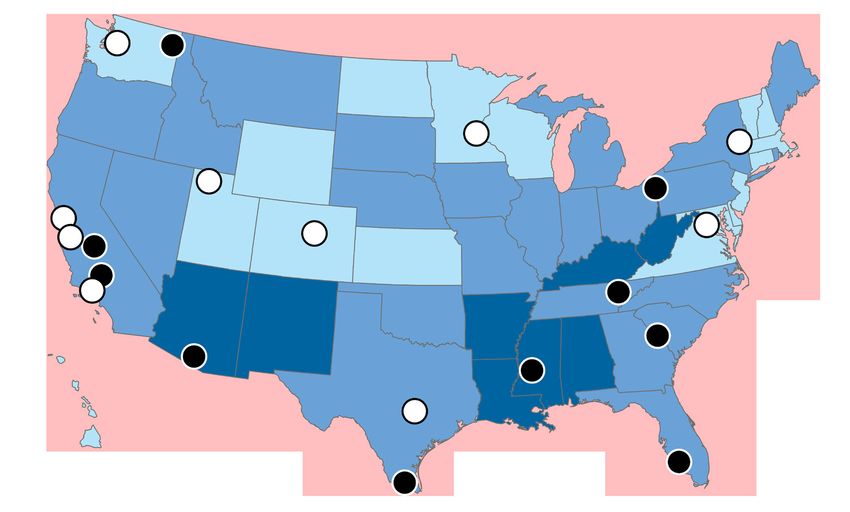
FIGURE 1

       Age and race-ethnic distributions of U.S. population
       1980 and 2015

                                 1980                                                                                                         2015
            Age 85+                                                                                    Age 85+
           Age 80-84                                                                                 Age 80-84
           Age 75-79                                                                                 Age 75-79
           Age 70-74                                                                                 Age 70-74
           Age 65-69                                                                                  Age 65-69
                                                                                               BABY
           Age 60-64                                                                                  Age 60-64
                                                                                           BOOMERS
           Age 55-59                                                                       ages 51-69 Age 55-59
           Age 50-54                                                                                  Age 50-54
           Age 45-49                                                                                 Age 45-49
           Age 40-44                                                                                 Age 40-44
           Age 35-39                                                                                 Age 35-39
           Age 30-34                                                                                 Age 30-34
    BABY Age 25-29                                                                       MILLENNIALS Age 25-29
BOOMERS                                                                                    ages 18-34 Age 20-24
ages 16-34 Age 20-24
           Age 15-19                                                                                 Age 15-19
           Age 10-14                                                                                 Age 10-14
           Age 5- 9                                                                                   Age 5- 9
           Age 0- 4                                                                                   Age 0- 4
                       0   5 million 10 million   15 million   20 million   25 million                            0      5 million   10 million    15 million   20 million   25 million

                              Minority              White                                                                               Minority   White

       Source: Author’s analysis of 1980 U.S. Decennial Census and Census population estimates

       FIGURE 2

       U.S. race-ethnic profiles for age groups
       2015

        100%
         90%
         80%
         70%
         60%
         50%
         40%                 75.0%
         30%                                                          61.5%                                      55.8%
         20%                                                                                                                                       51.5%
         10%
          0%
                           Age 55+                                Age 35-54                               Age 18-34                          Age under 18
                                                                                                          MILLENNIALS                  POST-MILLENNIALS

             White           Black                Am Indian/Alaska Native                                   Asian            2+ Races               Hispanic

       Source: Author’s analysis of U.S. Census population estimates

                                  The millennial generation: A demographic bridge to America’s diverse future                                                         7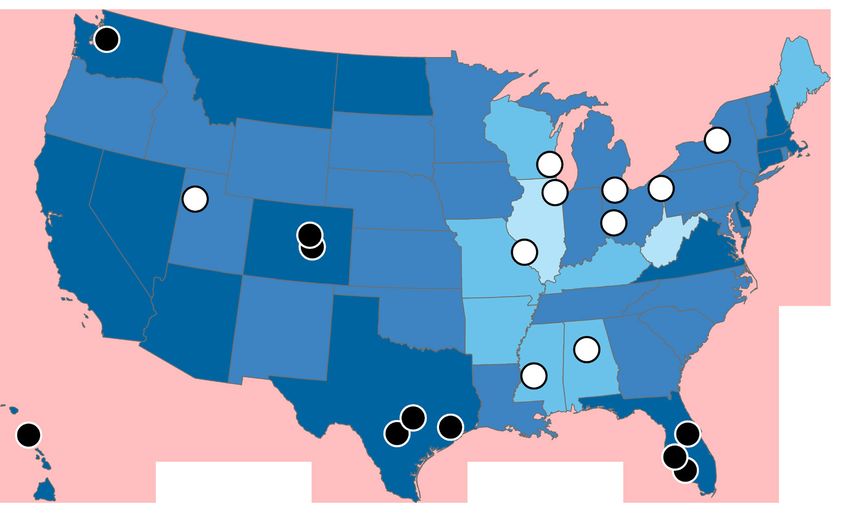
new minorities, and almost a quarter is made up             continue to experience declines in their white
of Hispanics.                                               populations, with racial and ethnic minorities
                                                            responsible for all future gains.5
Plainly it is the millennial generation that is
ushering in the nation’s broader racial diversity.          Millennials’ unique attributes reflect
This demographic bridge is illustrated by the               their diversity
growth of racial and ethnic minorities among the
young adult population, as shown in Figure 3.               Millennials are distinct in a number of respects
Between 2000 and 2015, there was a net loss of              when compared with earlier generations.
one quarter-million white young adults as more              However, the common view of millennials as a well-
whites aged out of the young adult (18-34 year              educated, tech-savvy generation that happened
old age bracket) than aged into it. Other racial            to come of age in a rough economic time must
and ethnic groups did the opposite. Over the                be seen in the context of the generation’s broad
same period, as millennials entered this bracket,           racial and ethnic diversity. Because minority
there were net gains of 4.3 million Hispanics and           groups compose a larger slice of the millennial
more than 1.5 million each of Asian and black               generation than for any prior young adult cohort,
Americans.                                                  it is important to examine how each group fares
                                                            and contributes to attributes that are associated
Ultimately, the impact of the aging of the white            with millennials.
population on younger generations cannot be
overemphasized. Census Bureau projections                   Millennial comparisons with earlier generations
indicate that, for the foreseeable future,                  are shown in Table 1 which contrasts key
postmillennial young adult populations will                 characteristics of millennials in 2015 to those

FIGURE 3

                   FIGURE 3
Change in the age 18-34 population by race-ethnicity
2000-2015

    5,000,000
                                                                                                4,313,746
    4,000,000

    3,000,000

    2,000,000
                                 1,606,459                       1,590,911

    1,000,000                                                                    900,934

                                                   73,403
           0
                 -248,130
-1,000,000

       White      Black       Am Indian/Alaska Native               Asian       2+ Races        Hispanic

Source: Author’s analysis of U.S. Census population estimates

8                 Brookings Metropolitan Policy Program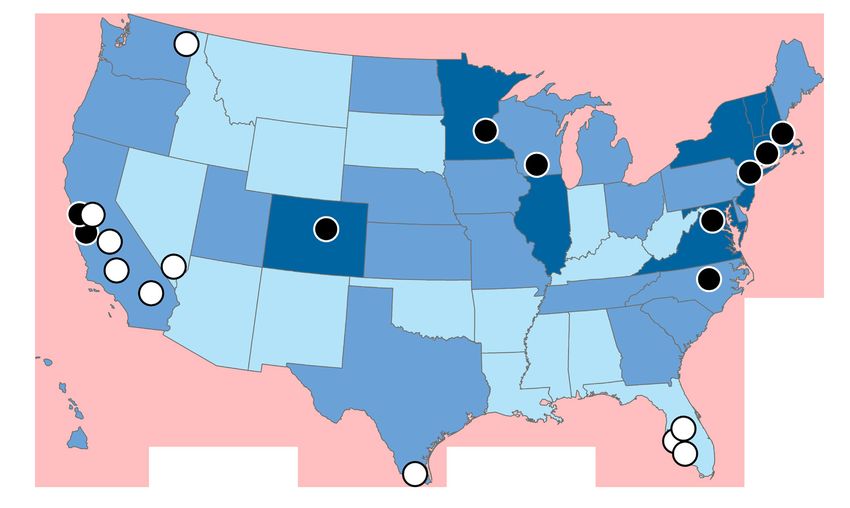
TABLE 1

Comparisons of young adults of earlier eras with millennials in 2015

                                            Young adults           Young adults           Millennials
Social and demographic profiles
                                            1980*                  2000*                  2015*
                      Percent
Race-ethnicity
                      White#                     78 xxxxxxxxxx         63 xxxxxxxxxx         56 xxxxxxxxxx
                      Black#                     12 xxxxxxxxxx          13 xxxxxxxxxx            14 xxxxxxxxxx
                      Asian#                      2 xxxxxxxxxx           4 xxxxxxxxxx            6 xxxxxxxxxx
                      Hispanic                    7 xxxxxxxxxx          17 xxxxxxxxxx            21 xxxxxxxxxx
                      Other Groups#                1 xxxxxxxxxx          3 xxxxxxxxxx            3 xxxxxxxxxx
                      Total                    100 xxxixxxxxxx         100 xxxiixxxxxxx     100 xxxiixxxxxxx
Speaking language other than English
                                                 11 xxxxxiixxxxx       23 xxxxxiixxxxx       25 xxxxxiixxxxx
at home
Marriages that are interracial                   5 xxxxxiixxxxx        10 xxxxiixxxxxx       14 xxxxxxiixxxx
Currently married
                      Age 18-24                 29 xxxxxxxiixxx        14 xxxxiixxxxxx           8xxxxxiiiixxxxx
                      Age 25-34                 68 xxxxxxiixxxx        55 xxxxxiixxxxx       44 xxxiixxxxxxx
Percent household head or spouse**
                      Age 18-24                 39 xxxxxxiixxxx        29 xxxxxiixxxxx       24 xxxxxxiixxxx
                      Age 25-34                 85 xxxxxiixxxxx        76 xxxxxiixxxxx       67 xxxxxxxiixxx
College graduates ***
                      All                       24 xxxxxiixxxxx        29 xxxxxiixxxxx       36 xxxxiixxxxxx
                      Men                       28 xxxxxxxiixxx        29 xxxxxiixxxxx       33 xxxxxxiixxxx
                      Women                      21 xxxxxxxxxxii       30 xxxxxxiixxxx       39 xxxxxxiixxxx
Percent homeowners
                      Age 18-24                 26 xxxxxxxxxxii        20 xxxxiixxxxxx       20 xxxxxiixxxxx
                      Age 25-34                 55 xxxxxxxxxxii        47 xxxxxiixxxxx       39 xxxxxxiixxxx
Percent of persons in poverty
                      Age 18-24                  12 xxxxxxxxxxii        17 xxxxiixxxxxx      20 xxxxxiixxxxx
                      Age 25-34                  8 xxxxxxxxxxii        10 xxxxxiixxxxx       15 xxxxxxiixxxx

* Ages 18-34 unless otherwise noted                     *** Ages 25-34
** Includes persons living alone                        # Pertains to non-Hispanic members of racial group

Source: Author’s analysis of U.S. Census Bureau: Current Population Survey Annual Social and Economic
Supplements 1980, 2000, and 2015; 1980 and 2000 Decennial Censuses; and 2015 American Community Survey

                   The millennial generation: A demographic bridge to America’s diverse future                 9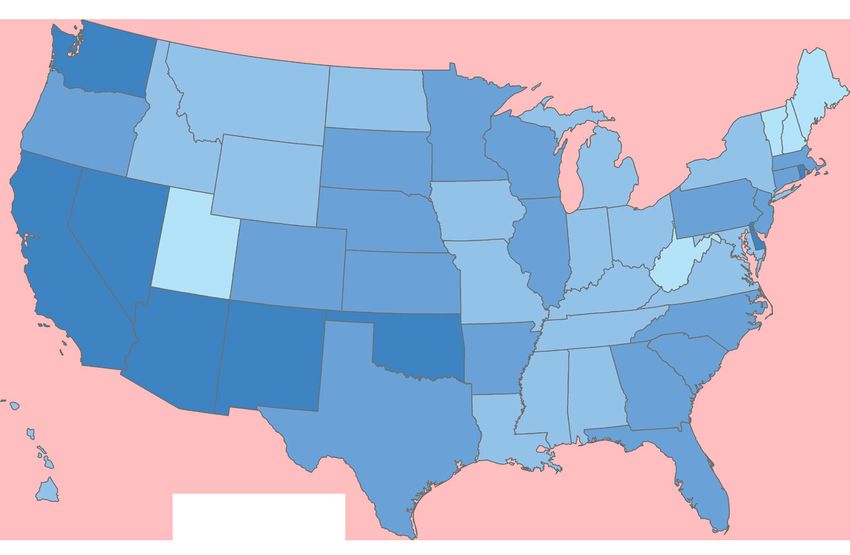
TABLE 2

Comparisons of millennials by race-ethnicity, 2015

 Social and Demographic Profiles                                  White#      Black#     Hispanic        Asian#

                Percent*
 Nativity
                Foreign born                                             4          10           36          56
                Second generation                                         5          7           34          36
                Third and higher generation                              91        83            30           8
                                                                       100        100           100         100
 Percent speaking language other than English at home                     6          9           72          72
 Marital status **
                Currently married                                       48         23            45          52
                Never married                                           44         69            47          45
                Divorced, separated, or widowed                           7          8              8         3
                                                                       100        100           100         100
 Relationship to household head **
                Household head                                          48          51           42          41
                Spouse of head                                          23          10           20          24
                Child of head                                            13         21            16         17
                Other                                                    16         18           22          18
                                                                       100        100           100         100
 Education **
                College graduate                                        43         23               17       62
                Some college                                            29         35            26          18
                High school graduate                                    23         35               31       15
                Not high school grad                                      5          7           26           5
                                                                       100        100           100         100
 Percent homeowners **                                                  56         33            37          43
 Percent of persons in poverty
                Ages 18-24                                               16        29            22          19
                Ages 25-34                                               11        24               21       13

* Ages 18-34 unless otherwise noted
** Ages 25-34
# Pertains to non-Hispanic members of racial group

Source: Author’s analysis of U.S. Census Bureau Current Population Survey, Annual Social and Economic
Supplement 2015 and 2015 American Community Survey

10                Brookings Metropolitan Policy Program
of young adults, ages 18-34, in 2000 and 1980, rise of new minorities is apparent: nearly six in 10
roughly corresponding to when Generation X and of millennials’ interracial marriages are between
baby boomers were those ages. Disparities within white and either Hispanic or Asian partners.
the millennial generation among white, black, Among married millennials involving Hispanics,
Hispanic and Asian millennials are shown in Table 35 percent are interracial. For those marriages
2. involving Asians or blacks, about three in 10 are
interracial.
Language spoken at home, immigration
status and interracial marriages Marital status and household
relationships
In keeping with their racial and ethnic diversity
and association with immigration, young adult Despite the rise in interracial marriages,
millennials are more likely than their earlier millennials are slower than earlier generations
counterparts to hold “global” attributes. One to get married, have children, and leave their
of these attributes is linguistic proficiency. parents’ homes. The median age of marriage was
Millennials are more likely than young adults lowest during the family-friendly 1950s—at age 20
in previous generations to speak a language for women and 22 for men. By 2015, these rose
other than English at home. Overall, a quarter to ages 27 and 29, respectively. Allowing longer
of millennials speak a foreign language at home, periods for higher education and rising women’s
compared with 23 percent of young adults in 2000 labor force participation have pushed up the ages
and just 11 percent in 1980 (see Table 1). More than of marriage and childbearing over the decades.7
seven in 10 Hispanic or Asian millennials speak a However, the Great Recession and resulting
language other than English at home, compared housing crash led millennials to even further
with relatively few blacks and whites. Spanish delay these domestic milestones.
is spoken at home by 16 percent of millennials
and at least 17 percent are bilingual, with strong The broad pattern toward delay in marriage has
English proficiency despite speaking another been followed by millennials in each racial and
language at home. ethnic group (see Figure 4). Blacks continue to
exhibit the lowest share of 25-34 year-olds who
Another global attribute of millennials is their are currently married—halving their share from 47
recent immigration status. Well over half of Asian percent in 1980 to 23 percent—though unmarried
millennials are foreign born, compared with 36 partnerships are common among black couples.8
percent of Hispanics, 10 percent of blacks, and Just as with the national patterns, long term
just 4 percent of whites (see Table 2). Although shifts toward later marriage have been amplified
immigrants compose a smaller share of Hispanic for all groups by recent economic conditions.
and Asian young adults than in 2000 (75 percent
and 52 percent, respectively), both groups are Millennials are not only marrying later than young
overwhelmingly made up of first- and second- adults in 2000 and 1980, but are also less likely to
generation Americans. be household heads or spouses, as many lived in
their parental homes or in multifamily dwellings
A third global attribute of millennials, an indicator at uncommonly high levels (see Table 1).9 Still, as
of racial and ethnic blending, is the pervasiveness shown in Table 2, the majority of older millennials
of interracial marriages. Interracial marriages (ages 25 to 34) in each racial-ethnic group are
have been on the rise, especially over the past either household heads (including persons living
three decades.6 As Table 1 shows, nearly one in alone) or spouses. White millennials exhibit the
seven millennial marriages are interracial—almost largest combined shares of household heads
three times the share of such marriages among and spouses, while residing with parents, other
baby boomers at the same age. The impact of the relatives, and nonrelatives is more prominent for
The millennial generation: A demographic bridge to America’s diverse future 11FIGURE 4
Percent currently married: Generational differences by race at ages 25-34
70%
60%
50%
40%
30%
20%
10%
0%
White Black Hispanic Asian
Young adults 1980 Young adults 2000 Millennials 2015
Source: Author’s analysis of Current Population Survey Annual Social and Economic Supplements
blacks and Hispanics. Fewer blacks are married was especially sharp for millennial women who
compared to other race and ethnic groups and are more educated at the bachelor’s degree level
more (21 percent) are residing with parents than than their male counterparts.
any other group. Hispanic millennials are most
likely to have an “other” relationship to the Also on the positive side, postsecondary
household head, meaning they could be living education attainment has risen for all racial and
with a nonrelative, such as a roommate, or ethnic young adult groups. As shown in Figure
another adult relative. 5, the percentage of people ages 25-34 who
received bachelor’s degrees or higher rose for
Education attainment whites, blacks, Hispanics, and Asians between
1980 and 2015. There have also been positive
One of the long-term trends that continued changes in related measures such as declines in
with millennials is the increase in education high school dropout rates and increased college
attainment, which, for their generation more enrollment for all major ethnic groups.11
than others, is tied to higher future earnings and
well-being.10 Here the story is both good and not The not-so-good news is the still-sharp disparities
so good. in education attainment among these groups,
with Hispanic and black millennials falling
Referring again to Table 1, more than a third behind their Asian and white counterparts.
of all millennials ages 25-34 achieved college While there is variation across geographic
educations by 2015, up from less than 30 percent areas in these measures (discussed below), the
for comparably aged young adults in 2000 and lower education attainment of many black and
not quite a quarter for those in 1980. The rise Hispanic millennials arises, in part, from poorer
12 Brookings Metropolitan Policy ProgramFIGURE 5
Percent currently college graduates: Generational differences by race at ages 25-34
70%
60%
50%
40%
30%
20%
10%
0%
White Black Hispanic Asian
Young adults 1980 Young adults 2000 Millennials 2015
Source: Author’s analysis of Current Population Survey Annual Social and Economic Supplements
preparation in underfunded, segregated school Homeownership
systems along with inadequate advice and career
counseling.12 Furthermore, blacks and Hispanics While the recession and its aftermath have given
especially have been more likely to enroll in two- millennials a late start on careers and family
year colleges and less selective four-year colleges formation, the housing bust has affected their
and have lower rates of completion.13 These two short-term, and potentially long-term, ability
groups are also disproportionately represented to buy homes. Nationally, homeownership rates
among the nation’s “disconnected youth”—young have not shown long-term declines. They stayed
adults who are neither working nor going to relatively stable since the 1960s except for a
school.14 housing boom from the late 1990s through
2006. The subsequent housing bust occurred
Finally, for this generation, postsecondary just before most millennials entered the market.16
education has come at the cost of significant This tamped down their homeownership rate
student loan debt. The Great Recession, which compared with young adults at earlier ages,
began as the first millennials turned 27, led many as high interest rates, a reluctance to buy, and
millennials to choose higher education as an debt or low savings prompted many millennials
alternative to labor force participation. Covering to live with relatives or move to rental housing.
the costs of expensive tuition during a time when This delay in homeownership may be robbing
fewer family resources may have been available millennials of a head start toward a traditional
placed many millennials in debt only to return means of wealth accumulation.
to a job market that was tepidly coming back to
normal.15
The millennial generation: A demographic bridge to America’s diverse future 13“This delay in homeownership financial security for millennials. The former
represents a pathway to a higher lifetime
may be robbing millennials of a earnings trajectory, and the latter has been a
head start toward a traditional key component of wealth appreciation. Yet each
means of wealth accumulation.” has been more difficult to attain for blacks and
Hispanics, even before the recession and post-
All racial groups registered recent housing-bust- recession period.
related declines in homeownership, but this was
especially the case for blacks who, along with One impediment to both postsecondary
many Hispanics, bore the brunt of fewer lower- education and homeownership is the lack of
cost, subprime loans amid a deficit of resources.17 accumulated savings and low credit among
Both groups have generally exhibited lower blacks and Hispanics. Compared with whites, both
homeownership rates than whites and Asians, but groups, as potential students and homebuyers,
the divide for blacks especially has widened more are less likely to obtain financial support from
recently.18 Thus for older millennials in 2015, there family members and, in fact, are often relied upon
were still sharp disparities in homeownership to send money back to their parents.20
across racial groups, ranging from 56 percent for
whites to 33 percent for blacks—with Asians, at A 2017 GenForward Survey of millennials of
43 percent, and Hispanics, at 37 percent, in the different racial-ethnic groups found that blacks
middle. and Hispanics, in particular, consistently report
more economic vulnerability than whites or
The prospects for greater homeownership are Asians—and experience less of a likelihood of
less encouraging than in the past for each racial- financial assistance from a family member for
ethnic groups but especially for blacks and college tuition or student debt relief.21 Moreover,
Hispanics. Those in the latter groups are less it has been estimated that the loss of wealth
well-equipped in light of their higher poverty and resulting from the foreclosure crisis between
unemployment levels, though those rates have 2007 and 2009 disproportionately affected black
receded recently.19 and Hispanic families, making them less able to
provide support for their own and their children’s
Financial security education and home purchases.22
While the economy and employment have Because racial minorities already compose
climbed back from the worst of the recession and roughly half of the nation’s K-12 public school
post-recession years, as late as 2015, millennials students and are projected to make up ever greater
were still more likely to be in poverty than most shares of the nation’s potential homebuyers,23 it
baby boomers and Gen Xers at similar ages (see is important to monitor the success of different
Table 1). segments of the highly diverse millennial
generation as they forge a bridge to the next
Both postsecondary education and generation.
homeownership are important markers of
14 Brookings Metropolitan Policy ProgramWhere are millennials living?
There is wide variation among metropolitan areas and Houston) are in Texas, and another three
in terms of the size and growth of their millennial (Orlando, Cape Coral, and North Port-Sarasota)
populations. This section presents statistics are in Florida. Rounding out the list are Honolulu
for the nation’s 100 largest metropolitan areas and Seattle.
and 50 states on growth and share of their
millennial populations and their racial and ethnic Several of these areas, including Houston, Denver,
compositions. It also examines recent changes Austin, and Seattle, are well-known millennial
and attributes of the millennial populations magnets in that they attracted large numbers of
residing in urban core and suburban counties for older millennial migrants in 2010-2015.25
the nation.
Only one metropolitan area—Birmingham, Ala.—
Growth and share of millennials in exhibited a decline in young adults. Most of the
metropolitan areas and states other areas with the lowest young adult growth
are located in the industrial north and Midwest
The young adult population ages 18-34 grew and include Ohio cities Toledo, Youngstown, and
nationally by 4.7 percent from 2010 to 2015. This Dayton, along with Chicago, St. Louis, Milwaukee,
represents gains from immigration and the aging and Syracuse, N.Y. Also on this list are Salt Lake
of younger millennials into the 18-34 age bracket City and Jackson, Miss.
during that time.24 However, this pattern of young
adult growth differs across metropolitan areas States also vary in their rates of young adult
and states in terms of the extent to which: (1) they growth. The state with the fastest growth was
attract immigrants; (2) young millennials age into North Dakota, which experienced an energy-
the 18-34 age bracket; and (3) these areas gain driven economic boom in the first half of the
or lose domestic migrants with other parts of the decade. Others in the more rapidly growing
U.S. The combination of these components yields group are mostly in the South or West, including
the overall young adult growth rate for a given the large states of California, Texas, and Florida.
metropolitan area or state. Outside those regions, other faster-growing
states were Massachusetts, New Hampshire, and
Map 1 displays the metropolitan areas, among Connecticut, increasing by more than 5 percent
the nation’s 100 largest, that had the highest and from 2010 to 2015.
lowest young adult growth in 2010-2015. Each of
the 10 fastest-growing areas, with growth rates Two states, West Virginia and Illinois, registered
exceeding 10 percent, was located in the South losses of young adults in 2010-2015, and seven
or West. Two (Colorado Springs and Denver) are others, mostly in the middle of the country,
located in Colorado, three (San Antonio, Austin, showed growth of less than 2 percent. These
The millennial generation: A demographic bridge to America’s diverse future 15MAP 1
Young adult growth and decline
2010-2015
States Metros
5% and above Highest growth Lowest growth
2%-5%
0-2% Colorado Springs 14.7% Birmingham -0.6%
Negative growth San Antonio 14.4% Chicago 0.2%
Denver 12.8% Toledo 0.5%
Orlando 12.7% St. Louis 0.9%
Honolulu 12.2% Youngstown 1.0%
Austin 11.8% Jackson 1.2%
Cape Coral, FL 11.7% Milwaukee 1.4%
Houston 11.7% Syracuse 1.5%
Sarasota 11.1% Dayton 1.7%
Seattle 10.8% Salt Lake City 1.9%
Source: Author’s analysis of U.S. Census population estimates
16 Brookings Metropolitan Policy Programinclude Mississippi, Alabama, Arkansas, Kentucky, Overall, with a few exceptions, the South and
Missouri, and Wisconsin, along with, in New West “Sun Belt” areas tend to show the highest
England, Maine. With the young adult population growth and largest shares of millennials, while
growing at 4.7 percent nationally, these states those in the North and West “Snow Belt” areas
are drawing fewer millennials than others. are more likely to register low growth and smaller
millennial shares of their populations.
Millennials composed 23.4 percent of the national
population in 2015, but this share varies widely Racial and ethnic diversity among
across metropolitan areas and states. Table 3 metropolitan areas and states
lists metropolitan areas with highest and lowest
shares of millennials. The racial and ethnic diversity that is a hallmark
of the millennial generation varies widely across
Millennials as a share of metropolitan area the nation’s metropolitan areas and states (see
populations range from 30.4 percent for Provo, Appendix A). Among the 100 largest metropolitan
Utah, to just 15.9 percent in North Port-Sarasota, areas, McAllen, Texas, at 4 percent white among
Fla. The 15 metropolitan areas with the highest millennials, is the most diverse. Thirty of these
shares of millennials are all in the fast-growing areas are “minority white,” including Miami at 25
South and West, with the exception of Madison, percent white and Houston at 32 percent. Several
a university town and state capital—an attribute it California areas (Los Angeles, Riverside, San
has in common with Austin, which has the second- Jose, Stockton, Fresno, and Bakersfield) are less
highest millennial share. Four of the areas with than one-third white. Other notable metropolitan
the highest shares are in California: San Diego, areas where whites constitute a minority of
Bakersfield, Fresno, and Los Angeles. millennials are New York, Atlanta, and Chicago.
Metropolitan areas with the lowest millennial An additional 18 metropolitan areas have
shares tend to be in Florida – where millennials millennial populations that are less than 60
are sometimes crowded out by older generations percent white, including Tampa, Philadelphia,
– and in the Northeast and Midwest. Included Charlotte, and Seattle. In fact, of all the largest
among the first group are Cape Coral, Palm Bay, 100 metropolitan areas, only four—Knoxville,
Deltona-Daytona Beach, Tampa, Lakeland, and Tenn.; Provo, Utah; Pittsburgh; and Spokane,
Miami. Among those in the last group are Ohio Wash—house millennial populations where whites
cities Youngstown, Bridgeport, and Cleveland, exceed 80 percent.
Detroit, and the Pennsylvania areas of Allentown,
Scranton, and Pittsburgh. The mix of racial and ethnic minorities among
millennials also varies widely across metropolitan
The District of Columbia, an attractive city for areas, as shown in Figure 6. In Los Angeles,
young adults that is shown along with states, is a Hispanics compose nearly half of the millennial
whopping 34.8 percent millennial. North Dakota population, with Asians making up 15 percent
and Alaska lead all states with high millennial and blacks only 7 percent. Among New York and
shares of 27.5 and 27.2 percent, respectively, a list Chicago millennials, the combined black and
which also includes the large states of California Asian millennial populations approximately equal
(25 percent), Texas (24.7 percent), and New the number of Hispanics. In Atlanta, Charlotte,
York (24.4 percent). States with lowest shares, N.C., and Detroit, blacks are the largest minority
beginning with Maine at 20 percent, are mostly in group among millennials.
the Northeast and Midwest with the exception of
West Virginia and Florida. Table 4 lists, for each racial and ethnic group,
the metropolitan areas that house the largest
The millennial generation: A demographic bridge to America’s diverse future 17TABLE 3
Highest and lowest shares of millennials, 2015: Large metropolitan areas and
states
Highest shares of millennials Lowest shares of millennials
Share Share
Rank (percent) (percent)
Metropolitan areas*
1 Provo-Orem, UT 30.40i00000 North Port-Sarasota 15.9 000000
2 Austin 27.2000i000 Cape Coral, FL 18.0 000000
3 San Diego 27.0 000000 Palm Bay, FL 18.7 000000
4 Virginia Beach 26.9 000000 Deltona-Daytona Beach 18.8 000000
5 Madison, WI 26.8 000000 Youngstown 19.9 000000
6 Colorado Springs 26.4 000000 Bridgeport, CT 20.7 000000
7 Bakersfield 26.3 000000 Winston-Salem 20.9 000000
8 Honolulu 26.3 000000 Allentown, PA 21.1 000000
9 Salt Lake City 26.2 000000 Tampa 21.2 000000
10 Baton Rouge 26.1 000000 Scranton 21.2 000000
11 El Paso 26.0 000000 Cleveland 21.2 000000
12 Fresno 25.8 000000 Lakeland, FL 21.2 000000
13 Columbia, SC 25.4 000000 Detroit 21.6 000000
14 Los Angeles 25.4 000000 Pittsburgh 21.6 000000
15 Charleston 25.4 000000 Miami 22.0 000000
States
1. District of Columbia 34.8 000000 Maine 20.0 000000
2. North Dakota 27.5 000000 West Virginia 20.8 000000
3. Alaska 27.2 000000 New Hampshire 21.4 000000
4. Utah 26.1 000000 Florida 21.6 000000
5. California 25.0 000000 New Jersey 21.7 000000
6. Colorado 24.8 000000 Connecticut 22.1 000000
7. Texas 24.7 000000 Ohio 22.1 000000
8. Hawaii 24.6 000000 Michigan 22.3 000000
9. New York 24.4 000000 Vermont 22.3 000000
10. Rhode Island 24.3 000000 Wisconsin 22.4 000000
*Among the 100 largest metropolitan areas. Names are abbreviated.
Source: Author’s analysis of U.S. Census population estimates
18 Brookings Metropolitan Policy ProgramFIGURE 6
Millennial race-ethnic makeup in selected metropolitan areas
2015
Los Angeles 26.0
Houston 32.1
New York 41.5
Atlanta 43.0
Chicago 48.6
Charlotte 56.8
Seattle 59.9
Denver 60.7
Detroit 62.3
Boston 66.0
Minneapolis-St. Paul 70.9
Pittsburgh 81.6
0% 10% 20% 30% 40% 50% 60% 70% 80% 90% 100%
White Black Asian Other Races Hispanic
Source: Author’s analysis of U.S. Census population estimates
millennial population for that group and the size of black millennial settlement. (It does not
areas that showed the greatest young adult gains appear on either list for other groups.) Other
between 2010 and 2015. While there is some metropolitan areas that saw black young adult
overlap, there are clearly some differences in the gain are Dallas, Houston, Washington, D.C., and
settlement and gain patterns for racial and ethnic Miami in the South, as well as New York and
minority groups. Philadelphia.
The largest white millennial settlements are Both Hispanic and Asian millennials share New
in the biggest metropolitan areas—New York, York and Los Angeles as major settlement areas.
Chicago, and Los Angeles—as well as Philadelphia, Beyond that, they differ somewhat with Hispanic
Boston, Dallas, and Washington, D.C. However, millennials being more numerous in Southern
when it comes to recent gains in the young adult areas—Houston, Miami, and Dallas—along with
population, there is a South and West bias among Riverside, Calif., and Chicago. Asian millennial
whites—with Texas areas Houston and Dallas settlements take more of a Western bent with
among the top three gainers (Denver ranking San Francisco, San Jose, Calif., and Seattle among
second), and Seattle, San Francisco, and Nashville the top seven, which also includes Chicago and
in the top six. New York, ranking seventh, rounds Washington, D.C. In general, Hispanics settle
out the list. more often in Southern areas, while Asians do so
in the West. New York, Los Angeles, and Houston
The largest black millennial settlement and young are top gainers among both groups.
adult gain areas have a distinctly Southern bent.
In keeping with its role as a top destination over Quite a few states exhibit more diversity in their
the past several decades in the black reverse millennial populations than the national numbers
migration back to the South,26 Atlanta ranks first show, as indicated by Map 2.
in black young adult gains and second in the
The millennial generation: A demographic bridge to America’s diverse future 19TABLE 4
Metropolitan areas with largest number of millennials, 2015, and young adult gains,
2010-2015 race-ethnic groups
Largest number of millennials 2015 Greatest young adult gains 2010-15*
Rank Area** Size Area** Gain
WHITES
1 New York 1,995,732 000000 Houston 46,785 000000
2 Chicago 1,104,304 000000 Denver 43,368 000000
3 Los Angeles 882,851 000000 Dallas 31,965 000000
4 Philadelphia 813,308 000000 Seattle 31,930 000000
5 Boston 774,846 000000 San Francisco 28,950 000000
6 Dallas 720,776 000000 Nashville 27,982 000000
7 Washington, DC 652,577 000000 New York 26,973 000000
BLACKS
1 New York 808,252 000000 Atlanta 53,666 000000
2 Atlanta 488,678 000000 Dallas 41,331 000000
3 Chicago 392,556 000000 Houston 40,107 000000
4 Washington, DC 370,210 000000 New York 31,969 000000
5 Miami 321,799 000000 Washington, DC 29,682 000000
6 Philadelphia 316,683 000000 Miami 29,540 000000
7 Houston 300,845 000000 Philadelphia 20,856 000000
HISPANICS
1 Los Angeles 1,689,364 000000 Riverside 76,029 000000
2 New York 1,326,722 000000 Los Angeles 55,237 000000
3 Houston 665,537 000000 Miami 51,961 000000
4 Riverside 633,619 000000 Houston 48,875 000000
5 Miami 607,635 000000 San Antonio 45,663 000000
6 Chicago 571,674 000000 New York 43,017 000000
7 Dallas 553,216 000000 Orlando 38,923 000000
ASIANS
1 New York 595,604 000000 New York 63,306 000000
2 Los Angeles 508,470 000000 San Francisco 46,963 000000
3 San Francisco 300,108 000000 Los Angeles 35,851 000000
4 Chicago 164,969 000000 Houston 29,759 000000
5 San Jose 164,208 000000 Seattle 29,173 000000
6 Washington, DC 154,516 000000 Dallas 27,314 000000
7 Seattle 147,279 000000 San Jose 22,504 000000
* 2010-15 change in age 18-34 year old population of group
** Metropolitan area names are abbreviated.
Source: Author’s analysis of U.S. Census population estimates
20 Brookings Metropolitan Policy ProgramIn California, less than one-third of millennials populations. In California, nearly three-quarters
are white, and more than 60 percent are new of post-millennials are minorities; in Texas it
minorities. Racial and ethnic minorities make up is two-thirds. Overall, 25 states are home to
more than half of the millennial populations in 10 post-millennial populations that are more than
states, including Texas, Arizona, Florida, Georgia, 40 percent minority, and in only four (New
and New Jersey. In another 10 states, including Hampshire, Maine, West Virginia, and Vermont) is
New York, Illinois, Virginia, and North and South this generation largely white.
Carolina, minorities comprise more than 40
percent of millennial residents. Other states have Millennials in urban cores, suburbs,
“whiter” millennial populations, but only nine and exurbs
states are home to largely (over 80 percent)
white millennial populations, including Wyoming, There is much discussion of millennials
Iowa, West Virginia, and Maine. being attracted to cities as a combination of
generational preferences and the slowdown in
The future young adult population will become the suburban housing market. While not all cities
diverse in more states when the post-millennial have benefited from renewed urban growth, this
population replaces millennials. Fourteen states phenomenon clearly came to light during the first
are now home to “minority white” under-18 part of this decade.27
MAP 2
States showing greatest percentage of minorities among millennials
50% and above 40%-50% 20%-40% Below 20%
Source: Author’s analysis of U.S. Census population estimates
The millennial generation: A demographic bridge to America’s diverse future 21TABLE 5
Millennial profiles of urban suburban categories*, large metropolitan areas, 2015
Social and demographic Mature Emerging
Urban core Exurbs
profiles suburbs suburbs
Millennial share of population
24.70000000 23.60000000 22.70000000 20.90000000
2015
Millennial racial composition
(percent), 2015
White# 41.80000000 51.90000000 61.70000000 72.30000000
Black# 18.30000000 13.70000000 10.20000000 10.50000000
Hispanic 26.20000000 24.60000000 20.90000000 12.90000000
Asian and
13.70000000 9.80000000 7.20000000 4.30000000
Other#
Total 100.00000000 100.00000000 100.00000000 100.00000000
Young adult growth 2010-15 4.9 0000000 6.9 0000000 7.9 0000000 5.0 0000000
* Based on classification of metropolitan counties devised by Brookings Institution
# Pertains to non-Hispanic members of racial group
Source: Author’s analysis of U.S. Census Bureau population estimates
It is, therefore, useful to examine the racial- What is noteworthy is the racial and ethnic
ethnic aspects of millennial presence in urban differences among millennials residing in each
cores and outer parts of large metropolitan urban category. Millennial populations living in
areas. Table 5 provides some insights by looking urban cores are decidedly more diverse, at just
at the millennial residence and 2010-15 young 41.8 percent white, than those in each suburban
adult growth for urban core and suburban county category. More than a quarter of urban core
categories—mature suburbs, emerging suburbs millennials are Hispanics, and nearly another third
and exurbs—based on population density, within are represented by the other minority groups.
the nation’s largest metropolitan areas.28
Suburban categories get less diverse as distance
Millennials make up a modestly higher share, at from the core increases. Mature, largely
24.7 percent, of urban core county populations inner-suburb millennials are only slightly less
than is the case for each of the suburban white—51.9 percent—than the national millennial
categories. This is to be expected, because many population. But in emerging suburbs and exurbs,
suburban areas have more middle-aged and child whites are far more prevalent at 61.7 percent and
populations as a result of the suburbanization of 72.3 percent, respectively.
families from earlier generations.
22 Brookings Metropolitan Policy ProgramThe growth of young adults, ages 18-34, is grow in urban cores, they will have a strong
somewhat higher in each of the suburban racial-ethnic dimension. Additional analyses
categories than the urban core. Not all of this of the 2010-15 growth rates indicate that fully
growth is due to migration and, especially in the 87 percent of millennial urban core growth is
suburbs, it is partly due to younger millennials attributable to racial and ethnic minorities,
aging into the 18 to 34 year old young adult compared with their contributions of 78, 67, and
category over the 2010-15 period. Nonetheless, 66 percent, respectively, to the millennial growth
these rates show that the young adult population rates of mature suburbs, emerging suburbs,
has been growing in all parts of the metropolitan and exurbs. This suggests that the more racially
area. diverse post-millennial generation may lead to
even greater growth and diversity for young adult
To the extent that young adult populations— populations in each part of the metropolitan area
millennials or post-millennials—continue to and especially in urban cores.
The millennial generation: A demographic bridge to America’s diverse future 23How do millennials differ on education and
poverty across metropolitan areas and states?
Educational attainment and poverty are two category are Phoenix, Las Vegas, San Antonio,
significant measures of how millennials, as young and Riverside, Calif. In fact, those areas with
adults, are likely to contribute to economic the lowest percentage of millennial college
outcomes in metropolitan areas and states. The graduates—below 25 percent—include other
former is an indicator of their human capital interior California areas of Bakersfield, Stockton,
potential. The latter is an indicator of their and Fresno; the Florida areas of Lakeland,
economic needs. The sections below show how Cape Coral, and North Port-Sarasota; as well as
older millennials, ages 25-34, differ on these McAllen, Texas and Spokane, Wash.
measures across the 100 largest metropolitan
areas and 50 states.29 Map 3 also depicts state variations in education
attainment. Those states that are home to the
Education most educated older millennials are largely in
the Northeast and on the Eastern Seaboard, led
Education attainment, as measured by the by Massachusetts, where 51 percent hold college
percentage of older millennials with at least a degrees. Highly ranked states outside this region
college degree, varies across metropolitan areas, are Minnesota, Illinois, and Colorado.
from 58 percent for Boston to 14 percent for
Bakersfield, Calif. Those areas with the greatest At the lower end of the millennial education
percentages of millennial college graduates, spectrum are states in the Deep South, the
aside from Boston, are Madison; San Jose, Calif.; Southwest, Appalachia, and the Rocky Mountain
San Francisco; Washington, D.C.; Hartford, Conn.; region along with Florida, South Dakota, Indiana,
New York; Raleigh, N.C.; Minneapolis-St. Paul; and and Alaska. Each of these exhibits millennial
Denver (see Map 3). In each of these, as well as college graduate percentages of less than 30
Austin and Seattle, more than 45 percent of older percent with Nevada, at 22 percent, registering
millennials graduated from college. the lowest.
While a great deal of attention is given to the These overall patterns do not necessarily apply
highly educated millennials in those areas, to each racial and ethnic group. Table 6 lists
the fact is that older millennials in 60 of the metropolitan areas with highest and lowest
100 metropolitan areas have college graduate percentages of college graduates among white,
percentages ranging between 30 to 45 percent; black, Hispanic, and Asian older millennials in
and in 28 areas, the percentages are less than metropolitan areas with at least 10,000 older
30. Among large metropolitan areas in the latter millennials in their respective groups.30
24 Brookings Metropolitan Policy ProgramMAP 3
Percent college graduates among older millennials
2015 (ages 25-34)
States Metros
40% and above Largest percent Smallest percent
30%-40%
Below 30% Boston 58% Bakersfield 14%
Madison, WI 58% Stockton 17%
San Jose 55% Riverside 17%
San Francisco 55% Fresno 18%
Washington, D.C. 54% McAllen 19%
Hartford 50% Lakeland, FL 19%
New York 47% Cape Coral, FL 20%
Raleigh 47% Las Vegas 21%
Minneapolis- 47% North Port- 24%
St. Paul Sarasota
Denver 46% Spokane 24%
Source: Author’s analysis of 2015 American Community Survey
The millennial generation: A demographic bridge to America’s diverse future 25TABLE 6
Metropolitan areas with highest and lowest percentages of college graduates
among older millennials, for race and ethnic groups, 2015
Highest percentages of Lowest percentages of
college graduates# college graduates#
Rank Percent Percent
WHITES
1 Washington, DC 69.9 Stockton 19.9
2 San Francisco 69.3 Bakersfield 22.5
3 Boston 65.1 Lakeland, FL 22.6
4 Madison, WI 63.8 North Port-Sarasota 24.4
5 New York 63.4 Cape Coral, FL 24.4
6 Bridgeport, CT 62.4 Deltona-Daytona Beach 25.5
7 San Jose 60.0 Spokane 26.1
BLACKS
1 Washington, DC 35.2 Milwaukee 6.4
2 San Francisco 32.0 Akron 8.7
3 Boston 31.0 Toledo 9.3
4 Hartford 30.9 Las Vegas 11.2
5 Omaha 30.4 Sacramento 11.4
6 Charlotte 29.9 Riverside 11.5
7 Atlanta 29.7 Rochester, NY 11.8
HISPANICS
1 Baltimore 30.4 Memphis 7.6
2 Jacksonville 28.9 Bakersfield 7.8
3 Miami 27.8 Boise 8.3
4 Boston 26.6 Stockton 8.3
5 Washington, DC 24.8 Allentown, PA 8.3
6 Hartford 24.7 Cleveland 8.6
7 San Francisco 23.8 Springfield, MA 9.4
ASIANS
1 Raleigh 79.9 Fresno 22.6
2 Austin 79.7 Stockton 34.2
3 San Jose 78.4 Las Vegas 35.3
4 Boston 77.6 Honolulu 43.9
5 Columbus 77.1 Riverside 44.4
6 Chicago 75.1 San Antonio 45.1
7 St. Louis 75.0 Sacramento 46.2
* Among the 100 largest metropolitan areas with greater than 10,000 older millennials in race-ethnic group. Names
are abbreviated.
# Ages 25-34
Source: Author’s analysis of 2015 American Community Survey
26 Brookings Metropolitan Policy ProgramThere is a large overlap between the education Ohio), and Midwestern centers (Chicago and St.
attainment rankings of white older millennials Louis). Areas with the lowest percentages are
with the overall rankings presented above, mostly located in interior California (Fresno,
though for whites, Washington, D.C., and San Stockton, Riverside, and Sacramento) as well as
Francisco register the highest college graduate Las Vegas, Honolulu, and San Antonio.
percentages—each exceeding 69 percent. White
older millennials with college degrees seem to Millennial human capital, as measured by the
have a strong affinity for the Eastern Seaboard presence of college graduates among 25-34
and the Bay Area in Northern California. year olds, tends to be “lumpy” in that it varies
Those areas with the lowest college graduate sharply across the country. This is also the case
percentages also mirror overall patterns, with a among the four racial and ethnic groups. Boston
strong interior California and Florida presence. is the only metropolitan area that ranked among
the top seven college graduate percentages for
Rankings for highest college graduate each group, although Washington, D.C. and San
percentages among black older millennials Francisco ranked high for three of the groups.
follow those of whites for the top three areas— Among areas with low percentages of millennial
Washington, D.C., San Francisco, and Boston— college graduates, each group listed at least
suggesting a selective movement of both groups one interior California area, where Stockton was
to these strong knowledge-based areas. Also included for three of the groups.
ranking high for blacks are the Southern growth
areas of Atlanta and Charlotte, N.C. The list of Poverty
areas with the lowest percentage of black older
millennial college graduates is distinct, leading Poverty rates among older millennials also differ
with the Midwestern areas of Milwaukee, Ohio widely across metropolitan areas. The highest
cities Akron and Toledo. Rochester, N.Y., Las rate, 31 percent, is registered for McAllen, Texas.
Vegas, and California cities Sacramento and San Jose showed the lowest rate at 7 percent.
Riverside are also on the list of areas where The 10 areas with the highest poverty rates,
college graduate percentages, among black older depicted on Map 4, are located in all parts of
millennials, stood below 12 percent. the country, including California (Bakersfield,
Fresno), Washington (Spokane), Arizona (Tucson),
The most educated areas for Hispanic older Tennessee (Knoxville), Ohio (Youngstown),
millennials are Baltimore, at 30.4 percent Georgia (Augusta), Florida (Cape Coral), and
college graduates, along with Jacksonville and Mississippi (Jackson). These metropolitan areas,
Miami in Florida. Yet, four familiar brain-gainers, along with New Orleans and Dayton, are home to
Boston, Washington, D.C., Hartford, and San older millennial populations with poverty rates
Francisco, round out the top seven. The areas exceeding 20 percent.
with the lowest college graduate percentages
are led by Memphis, Tenn., at 7.6 percent. The An additional 56 metropolitan areas have older
list also includes two interior California areas, millennial poverty rates ranging from 14 to 20
Bakersfield and Stockton; Boise, Idaho; and the percent, and 22 areas have rates lower than 14
industrial cities of Cleveland; Allentown, Pa.; and percent. Among larger areas in the latter group
Springfield, Mass. are New York, Nashville, Salt Lake City, and
Boston.
The percentages of college graduates among
Asian older millennials exceed 75 percent in each The 10 areas with the lowest poverty rates, 11
of the top-ranking metropolitan areas: a mix of percent and below, include San Jose, Washington,
high-tech centers (Austin, San Jose, Calif., and D.C., Minneapolis-St. Paul, Denver, Austin, Seattle,
Boston), college towns (Raleigh and Columbus, and San Francisco.
The millennial generation: A demographic bridge to America’s diverse future 27You can also read