LOCAL HOUSING STRATEGY - SEP TEMBER 2014 - CITY OF CANNING
←
→
Page content transcription
If your browser does not render page correctly, please read the page content below
Local HOUSING
STRATEGY

                 Final
                September 2014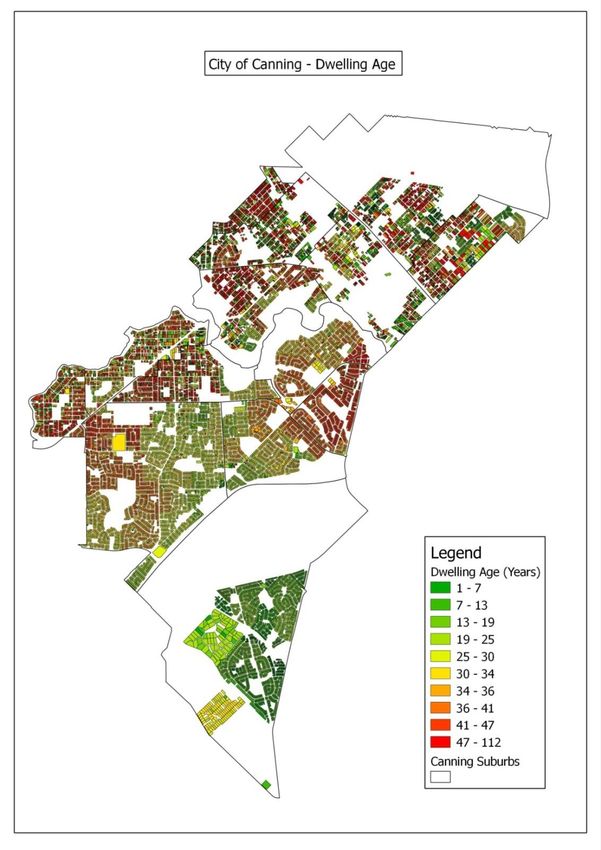
CONTENTS

       List of Tables                                                                       iv
       List of Figures                                                                      iv
   1   INTRODUCTION                                                                          1
       1.1     Executive Summary                                                             1
       1.2     Objectives                                                                    2
       1.3     CUSP Local Housing Study                                                      2
       1.4     Strategy Development                                                          3
       1.5     Local Housing Strategy Yields                                                 4
   2   CONTEXT                                                                               6
       2.1     Strategy Area & Local Government Reform                                       6
       2.2     City of Gosnells Local Housing Strategy                                       6
       2.3     State Planning Context                                                        7
               2.3.1     Directions 2031 and Beyond, and Delivering Directions 2031          8
                         Annual Report Cards (WAPC)
               2.3.2     Draft Central Metropolitan Perth Sub-Regional Strategy (WAPC)       8
               2.3.3     Statement of Planning Policy 3 – Urban Growth and Settlement        8
               2.3.4     State Planning policy 3.1 – Residential Design Codes (WAPC)         9
               2.3.5     State Planning Policy 4.2 – Activity Centres for Perth and Peel     9
                         (WAPC)
               2.3.6     Development Control Policy 1.6 – Planning to Support transit Use    9
                         and Transit Oriented Development (WAPC)
               2.3.7     Liveable Neighbourhoods (WAPC)                                     10
               2.3.8     Affordable Housing Strategy 2010-2020: Opening Doors to            10
                         Affordable Housing (Department of Housing)
               2.3.9     Planning Provisions for Affordable Housing Discussion Paper        11
                         (Department of Planning)
               2.3.10    Draft Public Transport Plan for Perth in 2031 (Department of       11
                         Transport)
               2.3.11    Moving People Network Plan (Department of Transport)               11
               2.3.12    Western Australia Bicycle Network Plan 2012-2021 (Department       12
                         of Transport)
       2.4     Local Planning Context                                                       12
               2.4.1     Strategic Community Plan                                           12
               2.4.2     Corporate Business Plan 2014-2017                                  13
               2.4.3     City of Canning Town Planning Scheme 40                            13
               2.4.4     Existing Project Areas                                             14

                                                                                             i
2.4.4.1 Canning City Centre Structure Plan                   14
                   2.4.4.2 Queens Park Structure Plan                           14
                   2.4.4.3 Bentley Regeneration Precinct Local Structure Plan   15
    2.5   Community Engagement                                                  15
          2.5.1    Strategic Community Plan Engagement                          15
                   2.5.1.1 Rossmoyne, Riverton and Shelley                      16
                   2.5.1.2 Bentley, Wilson and St James                         16
                   2.5.1.3 Cannington, Queens Park, East Cannington and         16
                           Welshpool
                   2.5.1.4 Lynwood, Ferndale and Parkwood                       16
                   2.5.1.5 Willetton                                            16
                   2.5.1.6 Canning Vale                                         17
3   DEMOGRAPHIC & HOUSING PROFILE                                               18
    3.1   Demographic Profile                                                   18
          3.1.1    Population Growth                                            18
          3.1.2    Population Age                                               18
          3.1.3    Migration                                                    20
          3.1.4    Household Structure                                          22
          3.1.5    Household Size                                               23
    3.2   Housing Profile                                                       24
          3.2.1    Dwelling Types                                               24
          3.2.2    Housing Tenure                                               25
          3.2.3    Housing Stock Age                                            26
4   HOUSING CONSIDERATIONS                                                      28
    4.1   Built Form                                                            28
    4.2   Affordability                                                         28
    4.3   Accessibility                                                         30
    4.4   Student Accommodation                                                 30
    4.5   Sustainability                                                        31
    4.6   Dual Density Codings                                                  31
    4.7   Base Density Code                                                     33
5   APPROACH                                                                    34
6   LOCAL HOUSING STRATEGY PROVISIONS                                           35
    6.1   Activity Centres                                                      35
          6.1.1    District and Neighbourhood Centres                           35
                   6.1.1.1 Willetton – Southlands                               35

                                                                                 ii
6.1.1.2 Riverton                                                                   38
                              6.1.1.3 Bentley                                                                    42
                              6.1.1.4 Livingston                                                                 44
                              6.1.1.5 Neighbourhood and Local Centres                                            46
                    6.1.2     Activity and Urban Corridors                                                       48
                              6.1.2.1 Albany Highway Corridor                                                    48
                              6.1.2.2 Manning Road Corridor                                                      53
                              6.1.2.3 High Road Corridor                                                         58
                    6.1.3     Capped Car Parking                                                                 61
           6.2      Focus Areas                                                                                  63
                    6.2.1     Bentley/Wilson/St James                                                            63
           6.3      Diverse Housing                                                                              67
                    6.3.1     Housing Affordability                                                              67
                    6.3.2     Secondary & Accessible Dwellings                                                   71
                    6.3.3     Adaptable Buildings                                                                74
                    6.3.4     Transcultural Residential Design                                                   75
           6.4      General Provisions                                                                           76
                    6.4.1     Built Form Sustainability                                                          76
                    6.4.2     Dual Density Codings                                                               80
                    6.4.3     Base Density Coding                                                                81
     7     LOCAL HOUSING STRATEGY MAP AND ACTIONS                                                                83
           7.1      Local Housing Strategy Map                                                                   83
           7.2      Actions Summary                                                                              84
     8     GLOSSARY                                                                                              90

Further information on the Local Housing Strategy is available              on   the   City   of   Canning   website
http://www.canning.wa.gov.au/Out-About/local-planning-strategy.html

The images contained within the Local Housing Strategy are intended to illustrate possible development outcomes for
various locations. They do not depict actual development which will occur as a result of this document.

                                                                                                                  iii
LIST OF TABLES

    1.5       Forecast additional dwelling yields for targeted Local Housing Strategy    5
              Provisions
    7.2       Actions Summary                                                           84

LIST OF FIGURES

    1.4       City of Canning Local Planning Strategy Framework                          3
    3.1.1 A   Forecast population growth to 2031                                        18
    3.1.2 A   Age/sex pyramid, 2011                                                     19
    3.1.2 B   Forecast age structure change to 2031                                     20
    3.1.3 A   Country of birth, 2011                                                    20
    3.1.3 B   Change in country of birth, 2006-2011                                     21
    3.1.3 C   Historical migration flows, 2001-2006                                     21
    3.1.4 A   Household type, 2011                                                      22
    3.1.4 B   Change in household type, 2006-2011                                       22
    3.1.4 C   Forecast household types to 2031                                          23
    3.1.5 A   Household size, 2011                                                      23
    3.1.5 B   Change in household size, 2006-2011                                       24
    3.2.1 A   Dwelling structure, 2011                                                  25
    3.2.1 B   Change in dwelling structure 2006-2011                                    25
    3.2.1 C   Housing tenure, 2011                                                      26
    3.2.3 A   Dwelling age                                                              27
    6.1.1.1   Element 6.1.1.1 Willetton – Southlands                                    36
    6.1.1.2   Element 6.1.1.2 Riverton                                                  39
    6.1.1.3   Element 6.1.1.3 Bentley                                                   42
    6.1.1.4   Element 6.1.1.4 Livingston                                                44
    6.1.2.1   Element 6.1.2.1 Albany Highway Corridor                                   49
    6.1.2.2   Element 6.1.2.2 Manning Road Corridor                                     54
    6.1.2.3   Element 6.1.2.3 High Road Corridor                                        59
    6.2.1     Element 6.2.1 Bentley/Wilson/St James                                     64

                                                                                         iv
1 INTRODUCTION
1.1 Executive Summary
The City of Canning has developed a Local Housing Strategy, which will guide future
residential development and intensification across the City. The Local Housing Strategy has
been directed by the City of Canning Local Housing Study, which was prepared by the
Curtin University Sustainability Policy Institute (CUSP) in 2012. The Local housing Strategy
has also been strongly informed by the City of Canning Strategic Community Plan, the
Western Australian Planning Commission’s Directions 2031 and Beyond document, as well
as other relevant State Planning Policies.
The Strategic Community Plan identifies strong community aspirations for residential
development across the City. The Local Housing Strategy investigates and recommends
mechanisms which will facilitate achievement of these aspirations.
Under Directions 2031 and Beyond, the City of Canning has a target of 11,440 additional
dwellings by 2031. Redevelopment would typically be located within defined activity
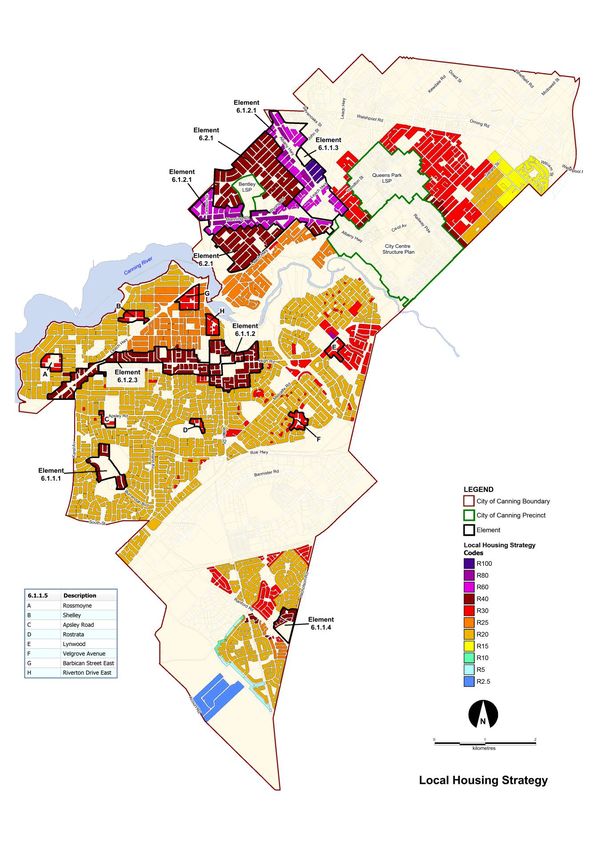
centres and corridors. The Local Housing Strategy forecasts a maximum yield of 9,358
additional dwellings (at 100% development efficiency), exclusive of the yields of the
existing project areas of the Canning City Centre Structure Plan area, the Queens Park
Structure Plan area and the Bentley Regeneration Project Local Structure Plan area.
A more realistic yield from the Local Housing Strategy is 7,948 additional dwellings,
exclusive of the existing project areas – at 85% development efficiency.
The Local Housing Strategy investigates residential redevelopment and intensification in a
number of ways:
Recommending intensification surrounding District, Neighbourhood and Local
Centres to varying degrees;
Recommending intensification within three corridors along Albany Highway,
Manning Road and High Road;
Discussing redevelopment and built form controls in the focus area of Bentley,
St James and Wilson;
Recognising that certain locations do not have the same car parking
requirements as others;
Guiding the delivery of strong housing diversity, including affordability and
accessibility;
Facilitating the introduction of more sustainable and environmentally
responsible built form across the City of Canning; and
Addressing the ineffective dual density coding provisions in the current Town
Planning Scheme.
At the completion of extensive community engagement and adoption by Council, the Local
Housing Strategy will form a significant component of the City of Canning Local Planning
1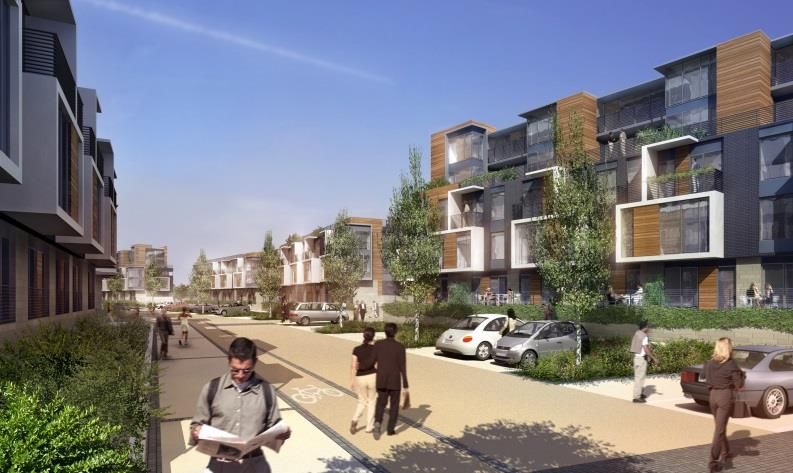
Strategy, along with a number of other sub-strategies. The Local Planning Strategy will
    provide the strategic planning direction for the City of Canning over a ten year period,
    through a review of the City of Canning Town Planning Scheme 40.

1.2 Objectives
    The Local Housing Strategy is driven by the following objectives:
    1.2.1 Outline the strategic direction for residential development across the City of
           Canning;
    1.2.2 Identify the specific work required to review the City of Canning Town Planning
           Scheme 40;
    1.2.3 Identify locations where redevelopment and intensification will occur;
    1.2.4 Facilitate efficient use of land for residential development throughout the City of
           Canning;
    1.2.5 Introduce diversity and accessibility into the City of Canning’s housing stock; and
    1.2.6 Ensure sustainable and environmentally responsible residential development is
           delivered throughout the City of Canning.

    The Local Housing Strategy objectives will be achieved through the specific objectives
    identified in Part 6 – Local Housing Strategy, and summarised in Part 7.2 – Actions
    Summary.

1.3 CUSP Local Housing Study
    The City of Canning engaged the Curtin University Sustainability Policy Institute (CUSP) to
    prepare a Local Housing Study, in 2012. The CUSP Local Housing Study, entitled ‘City of
    Canning Local Housing Study’, has been used to inform the development of the Local
    Housing Strategy.

    Demographic and building activity trends recognised in the CUSP Local Housing Study have
    illustrated the need for strong planning directions which will appropriately accommodate
    the City’s growing and changing population, as well as introduce high quality built form
    which produces good amenity and liveability outcomes. The key findings of the CUSP Local
    Housing Study have also directed investigations into intensification in identified locations,
    as well as the facilitation of certain housing typologies.

    The CUSP Local Housing Study has been reviewed in light of release of a number of
    relevant documents, revisions to dwelling targets specified in Directions 2031 and Beyond,
    finalisation of analysis of data from the 2011 Census of Population and Housing, and
    announcements on the process for local government reform in Western Australia. An
    Addendum to the CUSP Local Housing Study reflects the updated provisions and direction
    for planning and local government which have been announced since the completion of
    the work in July 2012.

                                                                                                2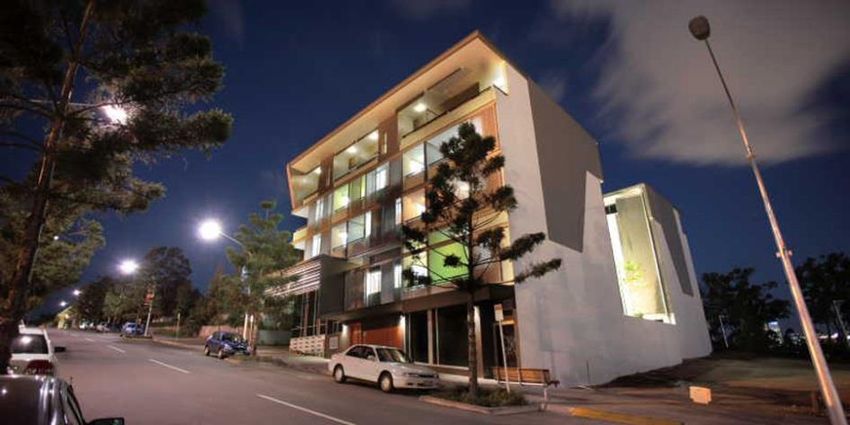
1.4 Strategy Development
    The City of Canning Local Housing Strategy has been developed from the community
    aspirations identified through the Strategic Community Plan, and the CUSP Local Housing
    Study. The City of Canning Strategic Community Plan contains significant direction for the
    Local Housing Strategy, including the following themes:

            Built Environment - Living and Moving Around
            We live in a place with a variety of quality lifestyle opportunities with a
            diverse, safe and integrated transport system.

            Prosperity – Living, Working and Doing Business in Canning
            We have diverse, vibrant places and opportunities to work, play and invest
            in our local economy and support our local business and industry.

    These themes are detailed further in Community Goals and Strategies, which prescribe the
    overarching direction for the Local Housing Strategy.

    The Local Housing Strategy also acknowledges the Western Australian Planning
    Commission’s Directions 2031 and Beyond, and delivers opportunities for development
    and redevelopment of residential land within the City aligned with this document’s
    strategic direction. Directions 2031 and Beyond identifies a future target of 11,440
    additional dwellings within the City of Canning by 2031.

    Along with the suite of other sub-strategies identified in Figure 1.4, the Local Housing
    Strategy will form a significant element of the holistic Local Planning Strategy - the primary
    strategic planning document for the City of Canning. Over a ten year period, the Local
    Planning Strategy will guide future development throughout the City by informing a review
    of Town Planning Scheme 40 (TPS40).

    Figure 1.4: City of Canning Local Planning Strategy framework.

                                                                                                 3
TPS40 was gazetted on 18 February 1994 and has undergone a comprehensive number of
    Scheme Amendments since that time. TPS40 has reached the end of its life as an
    appropriate statutory planning document. Significant Scheme Amendments will be
    undertaken to insert planning provisions for large areas such as the Cannington Strategic
    Metropolitan Centre and Bentley Regeneration Precinct.

1.5 Local Housing Strategy Yields
    Analysis in Greening the Greyfields has determined that intensification within the specific
    areas identified in the Local Housing Strategy will yield a maximum of 9,358 dwellings. This
    yield is exclusive of the three existing project areas discussed in Part 2.4.4, intensification
    which results from removal of the dual density codings and increase of the base coding to
    R20 across the City, as well as any intensification proposed outside the City of Canning
    municipal boundary.

    The CUSP Local Housing Study discusses the concept of development efficiency – the ratio
    of housing supply (the actual number of dwellings) to the dwelling capacity (the maximum
    number of dwellings capable of being accommodated in an area) of the density codings in
    question. In 2012, the City of Canning had an average development efficiency of 57%. The
    CUSP Local Housing Study has determined that a development efficiency of 85% presents a
    conservative dwelling supply increase, but is considered a genuine representation of future
    dwelling increases. It also reflects the realistic outcome where not all landowners in a given
    area redevelop, subsequent to changes in the planning framework. An 85% development
    efficiency is already attained in Parkwood and parts of Canning Vale.

    The maximum yield of 9,358 dwellings assumes a 100% development efficiency. At 85%
    development efficiency, targeted intensification in the Local Housing Strategy will yield an
    additional 7,948 dwellings under the same conditions described above.

    The population growth forecasts identified in Part 3.3.1 of the Local Housing Strategy
    represent a prediction of the City’s future population based on business-as-usual growth.
    This approach forecasts a population growth of 7,119 persons to 2031. It is considered that
    the actual population growth to 2031 will be significantly higher than this figure, as
    redevelopment resulting from the Local Housing Strategy Actions will present greater
    opportunities for population growth than what was predicted July 2011 (and illustrated in
    Figure 3.1.1 A: Forecast population growth to 2031).

    Detailed planning is currently underway for three project areas, discussed further in Part
    2.4.4. The Canning City Centre Structure Plan has a forecast yield of 10,000 dwellings, the
    Queens Park Structure Plan has a forecast yield of 4,000 dwellings, and the Bentley
    Regeneration Precinct Local Structure Plan has a forecast yield of 1,650 dwellings. The
    combined yield of these three project areas is 15,650 dwellings.

                                                                                                  4
The total number of additional dwellings, inclusive of the existing project areas described
in Part 2.4.4, will be 25,008 at 100% development efficiency, and 23,598 at a generally
more realistic 85% development efficiency.

Individual yields for each of the targeted Local Housing Strategy Provisions (discussed in
detail in Part 6) are identified in Table 1.5, at 100% development efficiency (100% DE) and
85% development efficiency (85% DE).

 Element                     Element Name                         LHS Yield          LHS Yield
 Number                                                          (100% DE)           (85% DE)
6.1.1.1     Willetton – Southlands                                  244                 207
6.1.1.2     Riverton (excluding High Road Corridor)                 144                 122
6.1.1.4     Livingston                                              114                 97
6.1.1.5     Neighbourhood and Local Centres (Total)                 558                 470
                 Central Road & Third Avenue, Rossmoyne              58                 49
                 Tribute Street West, Shelley                       102                 86
                 Barbican Street East, Shelley                       77                 65
                 Riverton Drive East, Shelley                        89                 75
                 Apsley Road, Willetton                              51                 43
                 Rostrata Avenue, Willetton                          41                 34
                 Vellgrove Avenue, Parkwood                          65                 55
                 Lynwood Avenue, Lynwood                             75                 63
6.1.2.1     Albany Highway Corridor                                2,086               1,773
6.1.2.2     Manning Road Corridor                                  2,303               1,957
6.1.2.3     High Road Corridor                                     1,711               1,454
6.2.1       Bentley, Wilson and St James                           2,198               1,868
               TOTAL YIELDS EXCLUSIVE OF PROJECT AREAS              9,358             7,948

               TOTAL YIELDS INCLUSIVE OF PROJECT AREAS             25,008             23,598

Table 1.5: Forecast additional dwelling yields for targeted Local Housing Strategy
Provisions.

                                                                                                 5
2 CONTEXT
2.1 Strategy Area & Local Government Reform
The City of Canning Local Housing Strategy applies to the City of Canning local government
area, and relates to all land within the municipal boundaries. This is the same study area as
the CUSP Local Housing Study.
Subsequent to local government reform in July 2015, the City of Canning may cease to exist
in its current form. As at January 2014, the Department of Local Government’s preferred
future boundaries will see portions of the City north and west of Leach Highway, west of
Willeri Drive, as well the portion north of Orrong Road, transferred to new local
government entities. The remainder of Canning will amalgamate with the City of Gosnells.
A final decision on the future local government boundaries is expected in October 2014.
The City of Canning Local Housing Strategy is designed to integrate with the existing City of
Gosnells Local Housing Strategy (endorsed by the Western Australian Planning Commission
in 2005), in the event of a partnership with the City of Gosnells. This will inform a new,
holistic Local Planning Strategy and Town Planning Scheme for any new local government
entity. The City of Gosnells has progressed most of the recommendations in its Local
Housing Strategy through the Scheme Amendment process.
Work will continue on the portions of the City of Canning that may be transferred to new
local government entities in July 2015. Ongoing dialogue has been established with the
relevant surrounding local governments, with regards to information sharing, involvement
and updates throughout the Local Housing Strategy process.
All work undertaken during the Local Housing Strategy development, has been considerate
of local government reform.
2.2 City of Gosnells Local Housing Strategy
The City of Gosnells Local Housing Strategy identified a number of housing precincts where
redevelopment and intensification should occur. The extent of intensification was
governed by the prevailing housing stock and infrastructure provision, development
constraints and walkability around nodes, such as train stations and activity centres. This
approach is consistent with the approach and investigations of the City of Canning Local
Housing Strategy.
Since the Strategy was endorsed in 2005, the City of Gosnells has progressed all of the
actions through a series of Town Planning Scheme amendments.
The City of Gosnells initially undertook Scheme amendments for properties within those
boundaries identified in the Strategy. Through the community consultation process for the
Scheme amendments, many property owners on the periphery of the Strategy boundaries
6expressed strong desire for their properties to be included within the Scheme
amendments, providing them with additional redevelopment potential. A second suite of
Scheme amendments was initiated to increase the density of these peripheral properties,
after the first suite of Scheme amendments had been completed.
The City of Gosnells does not intend to develop a new Local Housing Strategy prior to local
government reform in July 2015. In the event of a future partnership, the current City of
Gosnells Local Housing Strategy, and the resulting planning framework which have been
implemented through Scheme amendments, would combine to afford one holistic picture
on the strategic direction for residential development across any new municipality.
2.3 State Planning Context
2.3.1 DIRECTIONS 2031 AND BEYOND, AND DELIVERING DIRECTIONS 2031 ANNUAL
REPORT CARDS (WAPC)
Directions 2031 and Beyond (D2031) is the highest land use planning framework
document that guides planning policy for the Perth and Peel regions. Its aim is to
accommodate and manage population growth through planning requirements for
the delivery of housing, infrastructure and services to accommodate the growing
population. This includes an anticipated 47 percent target for infill development
and thus a general increase in average densities in targeted redevelopment areas.
The Study identifies Specialised Activity Centres, Strategic Metropolitan Centres
and District Centres where employment needs, services, amenities and
infrastructure are a focus. Density targets have been suggested around these
centres as well as being integrated with quality public transport services along rail
and road corridors.
D2031, along with the Draft Central Metropolitan Perth Sub-Regional Strategy,
provides the strategic direction for urban development throughout the Perth
metropolitan region. The initial target for the City of Canning was 9,000 additional
dwellings by 2031.
D2031 has been under implementation for nearly three years, and parallel
population growth studies, along with annual reporting on the achievement of
D2031 outcomes, have brought changes to individual local government dwelling
targets.
The dwelling target for the City of Canning is currently 11,440 additional dwellings
by 2031, as identified by the Delivering Directions 2031 Annual Report Card 2012
and 2013. The Annual Report Card 2013 also sets dwelling targets beyond 2031, to
accommodate a city of 3.5 million people – as forecast in WA Tomorrow. The City
of Canning has a target of 15,620 additional dwellings to accommodate 3.5 million
people across the Perth region (inclusive of the 11,440 additional dwelling target
under D2031).
7The City of Canning is capable of delivering a significantly greater number of
additional dwellings, considering the forecast yields of the Canning City Centre
Structure Plan, Queens Park Local Structure Plan, and Bentley Regeneration
Precinct Local Structure Plan, as well as the extensive activity corridors which pass
through the City.
The dwelling targets currently specified in the Delivering Directions 2031 Annual
Report Card 2013 need to be revised in light of local government reform. As the
City of Canning is likely to lose some significant residential areas to surrounding
local government entities, it is not considered that a revised housing target can be
achieved by simply adding the current dwelling targets of the Cities of Gosnells and
Canning. The Department of Planning had not commenced a revision process for
the D2031ond dwelling targets as at February 2014.
2.3.2 DRAFT CENTRAL METROPOLITAN PERTH SUB-REGIONAL STRATEGY (WAPC)
The Draft Central Metropolitan Perth Sub-Regional Strategy (CMPSRS) identifies
eight strategic priorities to deliver the outcomes of D2031. The strategic priorities
are based on the strategic themes and objectives of D2031.
The CMPSRS also specifies the individual dwelling and employment targets for each
local government within the Central Sub-Region. These targets have been updated
in successive Delivering Directions 2031 Annual Report Cards.
The CMPSRS investigates ways to reduce barriers to housing affordability, as well
as facilitate movement through the subregion with effective emphasis on the
development of urban corridors.
2.3.3 STATEMENT OF PLANNING POLICY 3 – URBAN GROWTH AND SETTLEMENT (WAPC)
Statement of Planning Policy 3 – Urban Growth and Settlement (SPP3) provides a
guide for the development of existing and future urban areas, with a specific focus
on urban sustainability, residential density and land use mix. SPP3 encourages
residential density and particular service provision in areas that support the use of
residential mass to realise the effectiveness and efficiency of public transport
infrastructure and service provision in Transit Oriented Development (TOD)
precincts.
SPP3 highlights the importance of managing growth of the Perth metropolitan
region, and in a large part this will be undertaken by urban consolidation and infill
in established inner areas of the region. SPP3 cites the principles of Liveable
Neighbourhoods to explain how the growth of metropolitan Perth can be managed
in a way which maintains neighbourhood amenity and a sense of place.
8SPP3 also states that a positive planning framework should be established by local
authorities, in order to facilitate this style of development. An intense focus on
regulation and development control does not facilitate the development of robust
mixed sue precincts which are capable of adapting to changes in social needs and
demands into the future.
2.3.4 STATE PLANNING POLICY 3.1 – RESIDENTIAL DESIGN CODES (WAPC)
State Planning Policy 3.1 – Residential Design Codes (R-Codes) provide standard
controls for residential development across Western Australia. The R-Codes also
aim to encourage strong amenable and sustainable built outcomes, and provide a
level of certainty to the development industry, landowners and community on the
extent and nature of residential development.
Local governments are responsible for the administration of the R-Codes with
respect to development assessment and can add or alter the standards for the
development of housing to achieve preferred outcomes, such as building height,
parking and sustainability.
On 2 August 2013, revised Residential Design Codes were gazetted. The revised R-
Codes contain a number of provisions which have been introduced to facilitate
appropriate infill development. The principal new provision relates to the
permissibility of small secondary dwellings (Part 5.5.1), termed ‘Ancillary
Dwellings’, instead of the former ancillary accommodation controls. Unlike the
former provisions, these Ancillary Dwellings are not restricted to accommodate
family members of the occupiers of the main dwelling on the site.
2.3.5 STATE PLANNINGPOLICY 4.2 – ACTIVITY CENTRES FOR PERTH AND PEEL (WAPC)
State Planning Policy 4.2 – Activity Centres for Perth and Peel (SPP4.2) applies to
the Perth and Peel regions and complements D2031 to guide local planning
strategies and structure plans, as well as development control. SPP4.2 identifies
target residential; densities within predetermined areas surrounding activity
centres. SPP4.2 also recommends the use of planning controls to regulate built
form and car parking, to achieve the best amenity and walkability outcomes for
activity centres.
2.3.6 DEVELOPMENT CONTROL POLICY 1.6 – PLANNING TO SUPPORT TRANSIT USE AND
TRANSIT ORIENTED DEVELOPMENT (WAPC)
Development Control Policy 1.6 – Planning to Support Transit Use and Transit
Oriented Development (DC1.6) encourages and guides the development and
ongoing success of public transport infrastructure through appropriate residential
densities and land uses within and around TOD precincts.DC1.6 focuses on the
effectiveness of appropriate residential mass to activate and stimulate the growth
9of public transport infrastructure, as well as services located within the TOD
precinct which will benefit from human presence and activity.
Achieving strong TOD outcomes will require acceptable walking distances to
optimize use of land within these precincts and to encourage use of public
transport. DC1.6 defines the ‘threshold’ for walking to transit infrastructure and
services as:
1. about 10-15 minutes walking time, or an 800m distance, for rail stations,
transit interchanges or major bus transfer stations or terminals, and
2. about 5-7 minutes walking time, or 400 m, for bus stops located on bus
routes with multiple bus services that are high frequency of 15 minutes or
less during peak periods.
2.3.7 LIVEABLE NEIGHBOURHOODS (WAPC)
Liveable Neighbourhoods offers an alternative approach to conventionally planned
development and encourages innovative, responsive and sustainable
neighbourhoods that support employment opportunities and community
development. Element 7 – Activity centres and Employment complements D2031
and the various State Planning policies in emphasising the importance of well-
designed and diverse activity centres in providing accommodation, social and
commercial opportunities for Perth’s growing population.
Element 7 specifically focuses on the built form and urban design aspects of activity
centres, and provides a guide as to how a successful activity centre should be
developed. Element 7 also explains how to effectively use land use mix and density
to ensure activity centres are efficiently and effectively developed and maximised.
2.3.8 AFFORDABLE HOUSING STRATEGY 2010 – 2020: OPENING DOORS TO AFFORDABLE
HOUSING (DEPARTMENT OF HOUSING)
The Affordable Housing Strategy 2010 – 2020 – Opening Doors to Affordable
Housing (Affordable Housing Strategy) offers a 10 year plan to address the lack of
affordable housing opportunities for low-to-moderate income earners in Western
Australia. The Strategy sets a target of 20,000 additional affordable homes by 2020
and has placed a minimum 15% affordable housing quota on all government land
and housing developments for low-to-moderate income households.
The Affordable Housing Strategy also places importance on developing
mechanisms to facilitate greater private investment in affordable housing options,
as well as the investigation of effective planning reform.
102.3.9 PLANNING PROVISIONS FOR AFFORDABLE HOUSING DISCUSSION PAPER
(DEPARTMENT OF PLANNING)
The Planning Provisions for Affordable Housing Discussion Paper (Affordable
Housing Discussion Paper) has been prepared by the Department of Planning to
further articulate and explore ways to deliver affordable housing, as outcomes of
the Department of Housing’s Affordable Housing Strategy. As the next step in the
affordable housing delivery process, the Affordable Housing Discussion Paper
discusses four process options, varying from a business-as-usual approach to
residential development, to mandatory affordable housing requirements.
Comment was sought on the Affordable Housing Discussion Paper during the last
quarter of 2013. Submissions will be used to develop an affordable housing
implementation framework, which will specifically outline delivery mechanisms for
affordable housing.
2.3.10 DRAFT PUBLIC TRANSPORT PLAN FOR PERTH IN 2031 (DEPARTMENT OF
TRANSPORT)
The Public Transport Plan for Perth in 2031 (Public Transport Plan) outlines the
future public transport network within the Perth metropolitan region, by 2031. The
Public Transport Plan focuses on two broad aspects of the transport network,
increasing the existing network capacity, and expanding the network.
A new rapid transit system is identified for Perth, which is envisaged to connect
into the existing and future rail and bus network. The Public transport Plan also
stresses the importance of public transport connectivity in areas of genuine
development potential.
2.3.11 MOVING PEOPLE NETWORK PLAN (DEPARTMENT OF TRANSPORT)
The Department of Transport is currently developing a Moving People Network
Plan (MPNP) for Perth and Peel, which will provide a comprehensive plan for the
movement of people around the metropolitan area. The MPNP is expected to
promote the TransPriority (more commonly known as SmartRoads) process. The
planning stage of the process has involved the preparation of TransPriority
mapping for each Local Government area; this was prepared by the Department of
Transport in consultation with the relevant authorities through workshops in late
2011. The mapping, which identifies at a strategic level the transport modes likely
to be prioritised along different corridors, reflects local priorities and aspirations in
relation to future development within each area.
112.3.12 WESTERN AUSTRALIA BICYCLE NETWORK PLAN 2012-2021 (DEPARTMENT OF
TRANSPORT)
The draft Western Australia Bicycle Network Plan (WABN) has been developed to
respond to the significant growth in the number of Perth people cycling to work or
for leisure and thus the increasing demand for cycle paths and facilities.
The WABN provides a blueprint for the metropolitan and regional cycle facilities
guiding the continued delivery of cycling infrastructure to better meet this growing
demand for convenient, safe cycling routes and end-of-trip facilities. It also
promotes alignment with current Government urban planning policy and
directions. The overall intention is to increase cycle trips for “transport purposes”
i.e. to work, school and shops. The objectives of the WABN are:
Provide a coordinated approach to implement a high-quality and
connected bicycle network;
Plan for maintaining and safeguarding the existing and future bicycle
network;
Integrate network development in planning strategies with other
developments, projects and programs;
Guide professionals implementing the WABN;
Encourage and promote cycling as a legitimate transport modes; and
Encourage a whole-of-government approach to cycling.
The WABN includes a number of proposed new initiatives which have been
developed from feedback received during the review of the 1996 Perth Bicycle
Network Plan. Key initiatives include a connecting schools program, a connecting
rail/bus stations program, and a feasibility study to investigate the provision of a
centrally located End-of-Trip facility. The former two initiatives both target short
trips and are aimed at improving the health of the community while also reducing
congestion at locations which experience high levels of demand during condensed
periods.
2.4 Local Planning Context
2.4.1 STRATEGIC COMMUNITY PLAN
Throughout 2012, the City of Canning embarked on a comprehensive community
engagement exercise, to develop a Strategic Community Plan. A Community
Perceptions Survey, a Speaker Series, an Accountability Group and 22 public events
were established to draw out and define community aspirations for the 10 year
future of the City of Canning. The Strategic Community Plan was finally adopted by
the Commissioner at the January 2013 Ordinary Council Meeting.
The Strategic Community Plan is a key component in the Department of Local
Government’s Integrated Planning and Reporting Framework, and has informed
the Corporate Business Plan, which identifies specific milestones in the delivery of
the Local Planning Strategy and Town Planning Scheme Review.
12Significant community aspirations for the built environment are contained within
the Strategic Community Plan, which will inform the development of the Local
Housing Strategy (and suite of supplementary strategies leading to the Local
Planning Strategy). All of the investigations undertaken through the Local Housing
Strategy process must link back to the Strategic Community Plan objectives. The
main applicable themes will be Built Environment – Living and Moving Around, and
Prosperity – Living, Working and Doing Business in Canning.
The Strategic Community Plan themes and strategies are significant in that they are
aspirations directly from the community, which are designed to guide the future
growth of the City of Canning. They illustrate community desires for housing, land
use, transport and built form which are to be investigated in the Local Housing
Strategy.
2.4.2 CORPORATE BUSINESS PLAN 2014-2017
The Corporate Business Plan 2014-2017 is developed as part of the Integrated
Planning and Reporting Framework, as the next level of strategic planning
document under the Strategic Community Plan. The Corporate Business Plan was
adopted by the Commissioner at a Special Council Meeting in June 2013.
The Corporate Business Plan 2014-2017 identifies priorities and actions for
delivering the objectives of the Strategic Community Plan, as well as the business
units responsible for achieving these outcomes.
The development of the Local Housing Strategy, and its integration into a holistic
Local Planning Strategy and Town Planning Scheme, are actions identified in the
Corporate Business Plan 2014-2017. The facilitation of housing diversity and
affordability, as well as land use mix, through the Local Housing Strategy are
additional actions identified in the Corporate Business Plan 2014-2017.
2.4.3 CITY OF CANNING TOWN PLANNING SCHEME 40
Town Planning Scheme 40 (TPS40) is the primary statutory document which
controls land use and development throughout the City of Canning. TPS40 was
gazetted on 18 February 1994, and has undergone a significant number of
amendments since this time.
A range of Local Planning Policies are adopted under TPS40.
The Local Housing Strategy will provide the residential direction for development
of a new Town Planning Scheme and suite of Local Planning Policies, to replace
TPS40.
132.4.4 EXISTING PROJECT AREAS
Areas for which detailed planning studies are already underway have been excised
from the Local Housing Study. These areas are:
2.4.4.1 Cannington Strategic Metropolitan Centre – Canning City Centre
Structure Plan area;
2.4.4.2 Portions of Queens Park – Queens Park Structure Plan area; and
2.4.4.3 Portion of Bentley – Bentley Regeneration Precinct Local Structure Plan
area.
As planning work has progressed further then the Local Housing Strategy in these
locations, it is not appropriate to include further detailed investigations within the
Local Housing Strategy.
2.4.4.1 Canning City Centre Structure Plan
The Canning City Centre is identified as a Strategic Metropolitan Centre in
Directions 2031 and Beyond and SPP4.2. A significant amount of work
has been undertaken to develop a vision and planning direction for the
area. Community comment was sought on the draft Canning City Centre
Structure Plan between June and July 2013. The Canning City Centre
Structure Plan was adopted by Council as a Local Planning Policy, in the
first instance, on 15 October 2013.
The adopted Canning City Centre Structure Plan will result in broad-scale
redevelopment, with significant intensification of land use in the project
area. It identifies the capacity of the City Centre to accommodate
approximately 10,000 new dwellings.
The built form within the project area will range from high-density mixed
use developments within the Core and TOD precincts to medium-density
grouped and preferably multiple dwellings at the periphery of the
Residential Frame. Design Guidelines will guide built form throughout the
Canning City Centre.
2.4.4.2 Queens Park Structure Plan
The Queens Park Structure Plan will deliver a Transit Oriented
Development focussed on the Queens Park Train Station. Redevelopment
in the project area will maximise the potential of Queens Park as a
neighbourhood centre, offer a diverse range of local-level facilities, and
complement the growth of the Canning City Centre.
The Queens Park Structure Plan area broadly encompasses an 800 metre
catchment, centred on the train station.
14Housing diversity is a key component of the Queens Park Structure Plan,
which will deliver an estimated 4,000 new dwellings in developments of
up to R100 density adjoining the train station.
2.4.4.3 Bentley Regeneration Precinct Local Structure Plan
The City of Canning and Department of Housing are partners in the
Bentley Regeneration Precinct project, which consists of a significant
redevelopment of a 22 hectare area in the centre of Bentley. Detailed
planning work has informed the development of the Bentley
Regeneration Precinct Local Structure Plan.
The Bentley Regeneration Precinct Local Structure Plan proposes a future
dwelling yield of 1,650 new dwellings, in a variety of building typologies
and ownership models. A significant proportion of housing in the project
area will be privately owned, with the Department of Housing retaining a
range of affordable and social housing units, including the two existing
11-storey towers with 300 social apartments.
4,000 square metres of commercial area and a new community facility
building will be developed within the Project Area, providing local
commercial and recreation services to the existing and new community
2.5 Community Engagement
2.5.1 STRATEGIC COMMUNITY PLAN ENGAGEMENT
Extensive community engagement was undertaken during the development of the
Strategic Community Plan, which ensured a full cross section of the community’s
views was obtained. During the community engagement and analysis process,
common themes emerged across the City, as well as specific themes relevant to
locations where community engagement events were conducted.
While lower density housing was generally preferred across the City (an R25
density coding was preferred by 54 per cent of the community), the need to
accommodate a growing population was also noted. The community recognised a
variety of housing types and densities in appropriate locations were required.
Opportunities for higher densities were seen around public transport
infrastructure, shopping areas and the City Centre, provided sufficient
infrastructure was developed to support intensification.
Frustration was raised by parts of the community with regards to rental housing,
and the large number of unkempt gardens and verges, inappropriate car parking,
and over-occupation of the houses.
15Specific areas throughout the City were considered to have good public transport
connectivity, however there was a desire in the community to see a greater
number high frequency public transport services, particularly busses. The Public
Transport Plan was seen to provide strong opportunities for well-connected public
transport, and the reduction of private car usage.
2.5.1.1 Rossmoyne, Riverton and Shelley
While community members from Rossmoyne, Riverton and Shelley
preferred lower densities, there was an understanding of the need for a
balance of higher and lower densities and land use mix.
2.5.1.2 Bentley, Wilson and St James
Community members generally preferred lower densities in Bentley,
Wilson and St James. Some saw benefits of higher densities, including
lower maintenance requirements and connectivity with public transport.
Higher densities were typically seen as being appropriate around
transport nodes.
Rental housing stemming from a high proportion of students was
identified as presenting property maintenance, overcrowding and car
parking issues in the area. These properties were seen to diminish the
visual amenity of the area.
2.5.1.3 Cannington, Queens Park, East Cannington and Welshpool
Community members in this area had mixed views on housing density.
Higher density was seen as acceptable in certain locations, particularly in
the vicinity of transport routes. The community identified the need for
balance between nature and development, as well as diversity in housing
types and design.
2.5.1.4 Lynwood, Ferndale and Parkwood
Generally community members in this area did not believe there should
be an increase in density. Housing preference investigations illustrated
that density codings of R20 and R30 were acceptable to approximately
35% of participating community members.
2.5.1.5 Willetton
Community preferences for lower and higher densities were mixed in
Willetton, and community members did not mind higher densities in
specific areas, including where public transport was prevalent. Integration
16with natural areas and energy and water efficiency were seen as
important in higher density development.
2.5.1.6 Canning Vale
While community members generally preferred lower density housing,
with the perception that higher densities would bring trouble and noise,
areas near shopping facilities and train stations were considered
appropriate for densities up to R40.
173 DEMOGRAPHIC & HOUSING PROFILE
3.1 Demographic Profile
3.1.1 POPULATION GROWTH
The estimated resident population in the City of Canning in 2012 was 93,383
persons. By 2031, Forecast.id estimates the City’s population will have grown to
100,502 persons, illustrated in Figure 3.1.1 A. This represents a growth rate of 0.84
percent. It should be noted that this growth represents a business-as-usual
forecast based on existing population growth rates, and does not consider
additional residential opportunities which may arise out of the Local Housing
Strategy.
Between 2006 and 2011, the population growth rate in the City of Canning was
1.34 percent. The reduction in population growth could be attributed to
development of large greenfield areas, particularly around East Cannington,
Queens Park and Canning Vale, coming to an end (CUSP, 2012).
Figure 3.1.1 A: Forecast population growth to 2031.
3.1.2 POPULATION AGE
The City of Canning has a relatively young population, with a high proportion of
persons aged between 15 and 29, illustrated in Figure 3.1.2 A. This accords with the
18array of tertiary education institutions in close proximity to the City of Canning, as
well as the broad range of housing options which have developed to accommodate
students over time. It is also indicative of the popularity of certain dwelling
typologies (notably grouped dwellings) which are predominant in certain areas of
the City, for first home buyers.
Figure 3.1.2 A: Age/sex pyramid, 2011.
The age City’s population is forecast to grow predominantly in the 30-34 and 35-39
age groups until 2021, and also the 65-69 and 70-74 age groups until 2021,
illustrated in Figure 3.1.2 B. This corresponds with declines in the 20-24 and 25-29
age groups in the same time period. The growth in these age cohorts illustrates the
need for certain housing typologies in the coming years to 2021, and beyond.
19Figure 3.1.2 B – Forecast age structure change to 2031.
3.1.3 MIGRATION
In 2011, 45.8% of the population was born overseas, with 32.9% from non-English
speaking backgrounds. The City of Canning hosts a very multicultural community,
with significantly higher proportions of the population born in Malaysia, India and
China than the greater Perth region, illustrated in Figure 3.1.3 A.
Figure 3.1.3 A – Country of birth, 2011.
The 2011 Census identifies a growth in the proportion of the City’s population from
Asia, and a continuing reduction in migrants from the United Kingdom, illustrated
in Figure 3.1.3 B.
20Figure 3.1.3 B – Change in country of birth, 2006-2011.
The City has generally experienced a net loss of population through migration to
the surrounding local governments of Gosnells and Cockburn, as well as the
predominant growth areas in the south of Perth, Kwinana, Rockingham and
Mandurah – illustrated in Figure 3.1.3 C.
Figure 3.1.3 C – Historical migration flows, 2001-2006.
213.1.4 HOUSEHOLD STRUCTURE
Couples with children are the prevailing family type in the City of Canning,
illustrated in Figure 3.1.4 A. The City contains a higher proportion of group
households than the greater Perth region, which is indicative of student
accommodation arrangements in the proximity of Curtin University.
Figure 3.1.4 A – Household type, 2011.
Between 2006 and 2011, growth was seen in the proportion of couples without
children and group households in the City, along with couples with children,
illustrated in Figure 3.1.4 B. Growth in the former two categories is indicative of an
aging population, as well as a growing tertiary education-age population.
Figure 3.1.4 B – Change in household type, 2006-2011.
22It is forecast that the predominant household types to 2031 will be couples with
and without children, and lone person households, illustrated in Figure 3.1.4 C.
Figure 3.1.4 C – Forecast household types to 2031.
3.1.5 HOUSEHOLD SIZE
The majority of households in the City comprise one or two people, illustrated in
Figure 3.1.5 A – however the greatest change in household size has been in the
number of four person households, illustrated in Figure 3.1.5 B.
Figure 3.1.5 A – Household size, 2011.
23Figure 3.1.5 B – Change in household size, 2006-2011.
3.2 Housing Profile
The City of Canning has experienced substantial residential development since the 1970’s,
and the last remaining greenfield development area in Canning Vale is nearing completion.
Future development opportunities within the City are constrained leading to the need for
infill redevelopment and a greater densification of dwellings around strategic centres.
In 2011 there were 33,526 dwellings in the City of Canning. This number is forecast to
increase to 37,514 dwellings by 2021, and 40,518 by 2031 – based on a business-as-usual
approach to housing development. Land bank analysis by CUSP indicates that at current
density codes, there is capacity for an additional 2,999 dwellings within the City.
3.2.1 DWELLING TYPES
The City of Canning is predominantly comprised of separate houses, with a
relatively similar proportion of medium density dwellings as the greater Perth
region, illustrated in Figure 3.2.1 A. The City has a distinctly lower proportion of
high density dwellings compared to Greater Perth.
24Figure 3.2.1 A – Dwelling structure, 2011.
Between 2006 and 2011, there was a significant growth in medium density
dwellings within the City, followed by separate houses, illustrated in Figure 3.2.1 B.
Figure 3.2.1 B – Change in dwelling structure 2006-2011.
3.2.2 HOUSING TENURE
Housing in the City of Canning is predominantly fully owned or mortgaged,
however there is also a significant proportion of rental housing, illustrated in Figure
3.2.1 C. The greatest increase in housing tenure has been in the rental housing
category.
25Figure 3.2.1 C – Housing tenure, 2011.
3.2.3 HOUSING STOCK AGE
The mean age of the housing stock in the City of Canning is 26.8 years with some of
the oldest dwellings being found in the Suburbs of St. James, Wilson and Lynwood.
By a fairly large margin the youngest development can be found in the suburb of
Canning Vale. Figure 3.2.3 A is a thematic map showing the age of all non-vacant
residential properties in Canning. The colour ramp depicting the age of dwellings
ranges from red (very old) to green (very new). The suburbs of Rossmoyne and
Shelley, as well as the suburbs north of the river show substantially more variation
in dwelling age than the southern suburbs. This is indicative of a large amount of
redevelopment occurring in these areas, although this does not necessarily
correlate to intensification of the housing stock.
26Figure 3.2.3 A – Dwelling age.
274 HOUSING CONSIDERATIONS
4.1 Built Form
Ongoing redevelopment throughout the City over the last 30 years has seen a variety of
building typologies become prevalent in residential areas. It is common for new
development to be designed for ease of construction and sale, with sometimes little
thought paid to the appearance of the buildings, and their interface with surrounding
residential development. The growth in the number of housing developments built to
minimise cost and construction time risks creating areas of homogenous, inefficient
buildings which do not respond well to their surrounding environments.
While the R-Codes provide general guidance toward built form design, they typically lack
prescriptive controls to ensure specific design outcomes are achieved. In key locations,
design guidelines serve this purpose. In areas which are undergoing redevelopment,
specific mechanisms which guide built form ensure attractive, well-designed buildings are
delivered.
Where significant intensification is proposed, it will be important to manage the resulting
built form in a way which achieves a positive interface with the public realm, as well as
adjoining existing development. Well-designed design guidelines provide an appropriate
level of guidance toward building design, and can describe minimum outcomes which need
to be met.
Having specific built form controls ensures that developers have some responsibility to
design and construct buildings which sit comfortably in their surroundings. This is
fundamental to ensuring redevelopment is attractive, interesting, and functions well in the
urban context.
4.2 Affordability
Housing stress describes a situation where, in the lowest 40 percent of the income profile
of a location, 30 percent of more of household income is spent on housing - either rental or
mortgage payments. For these low to moderate incomes, the cost of housing, in addition
to travel expenses, food, utilities and other reasonable aspects of modern life combine to
limit the affordability of living in Perth. It is common for key workers – or those people
required to support the functions of an urban area – to face real financial hardships in
living in locations where they work, and the added cost of commuting from home places
further financial burdens on them.
While the delivery of affordable housing units does not result in widespread housing
affordability, it does go some way to facilitating access to affordable housing in the
community. Affordable housing has to be intelligently designed to complement an urban
area and minimise occupation costs, as well as appropriately located. Through a cumulative
effect of these factors, affordable housing located in areas of strong public transport
28connectivity, employment and high quality service provision is able to offer a real
opportunity for affordable living.
For inner-city local governments, as well as those serviced by good public transport
infrastructure, the availability of affordable housing is important to ensuring the area is
accessible to low and moderate income earners, particularly key workers. From a local
government perspective however - where land ownership is typically fragmented - the
delivery of affordable housing units is hard to guarantee.
The ability to construct and lease small ancillary dwellings, introduced into the R-Codes in
August 2013, goes some way to introducing affordability into the urban fabric of Perth.
These smaller dwellings are not able to be sold independent to the main dwelling on the
property they are located, but serve to provide a smaller, foreseeably cheaper alternative
to larger housing in areas of fairly homogenous housing stock. However there is no control
over the rental price, and little certainty as to the delivery and occupancy of these
properties. Additionally, they may not be locationally tied to areas with high employment,
access to services, or public transport connectivity.
Typical mechanisms which other local authorities have considered include density bonuses
for affordable unit provision, as well as cash-in-lieu programs which are then reinvested
into either local authority affordable developments or housing providers which deliver the
units themselves. While these initiatives may prove attractive to developers at a planning
application stage, they do not necessarily result in the required number of affordable units
being provided.
A method of ensuring delivery of affordable units is through a contractual obligation - in
addition to the requirements of the planning framework - to construct units and maintain
them as affordable dwellings for a set period of time. The Metropolitan Redevelopment
Authority is able to utilise this model through contracts of sale from state-owned land. To
be successful at a local government level however the local authority would need to be
party to the contract of sale, which would generally be achieved by being the selling
landowner.
In the absence of a legislative requirement for affordable housing units, local authorities
can only investigate and offer incentives to the development industry, which provide a
market benefit for affordable housing delivery.
Maintaining housing as affordable is fundamental in ensuring the affordability of an urban
area, and ensuring that those who would most benefit from affordable living have the
opportunity to access the housing. Mechanisms such as restrictive covenants and clauses in
Strata Management Statements are commonly used to control occupancy and sale/rental
price of affordable units, generally for a certain period of time. Partnerships with not-for-
profit housing providers, or the Department of Housing through their shared equity
scheme, facilitate affordable housing delivery and ongoing management. It is generally not
appropriate for local governments to deliver and manage affordable housing units.
294.3 Accessibility
A challenge for all local governments is to ensure an appropriate stock of accessible
dwellings is delivered into the future. There are a number of aged care facilities within the
City already established – however there is a limited number of accessible dwellings
integrated throughout the remaining residential building stock. It is also important to
recognise that accessible housing extends beyond aged accommodation, and serves to
provide comfortable and convenient housing for those with mobility impairments.
Growth in the 65-69 and 70-74 age groups illustrated in Figure X highlights the need for
suitable accessible housing throughout the City. In particular, housing which is located
within existing communities, which will facilitate aging in place, is important. The revised
ancillary dwelling provisions of the R-Codes provides the basic building stock for
accessibility – small, self-contained but separate housing which can be constructed
alongside larger houses in existing residential areas.
Residential development in activity centres also should contribute to accessibility, given
their integration with public transport and high quality service provision.
Multi Criteria Evaluation illustrates certain areas throughout the City which are well-suited
to accessible housing (based on aged housing variables of population age, public transport
connectivity and distance to local shopping facilities), namely parts of Riverton and
Rossmoyne, Willetton (around Southlands), Ferndale (around Dalma College), and
throughout the northern portion of the City (see Figure X).
While it is important that a proportion of the City’s housing stock is accessible, the
dwellings themselves should be constructed in a way which facilitates sale on the general
housing market. New accessible housing should include structural accessibility – such as
wide door openings, circulation space and minimal level change – but not necessarily grab
rails and other items which can be retrofitted post-occupancy.
4.4 Student Accommodation
The proximity of Curtin University to the City of Canning, as well as transport linkages
throughout the City to other significant learning centres results in ongoing demand for
student housing, particularly in the suburbs of Bentley, Wilson and St James. During the
Strategic Community Plan community engagement, feedback from these areas consistently
included commentary on the condition of properties identified as student accommodation,
and the perceived impact on the value of surrounding properties.
It must be recognised that the Bentley/Wilson/St James area will always contain student
accommodation of some form, due to the proximity of Curtin University, as well as public
transport and service connections. It will be important to ensure that future development
in these areas results in built form which is appropriate for a transient community, but still
provides a strong contribution to the amenity of streetscapes and surrounding properties.
30You can also read


