JOHANNESBURG GLOBAL FUTURE CITIES PROGRAMME - Prosperity Fund - | Global Future Cities Programme
←
→
Page content transcription
If your browser does not render page correctly, please read the page content below
Prosperity Fund
   GLOBAL FUTURE CITIES PROGRAMME

JOHANNESBURG
              CITY CONTEXT REPORT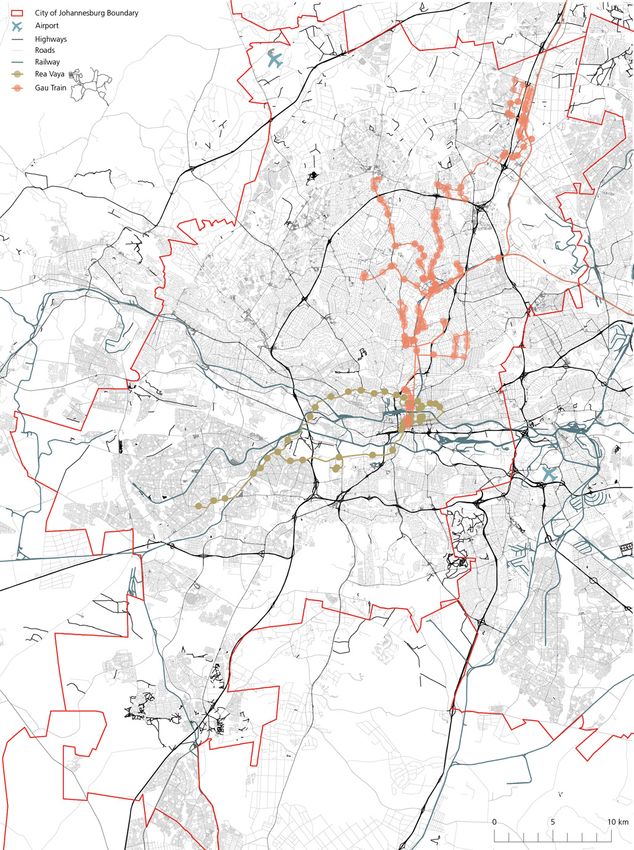
Prosperity Fund
   GLOBAL FUTURE CITIES PROGRAMME

JOHANNESBURG
              CITY CONTEXT REPORT
                       December 2018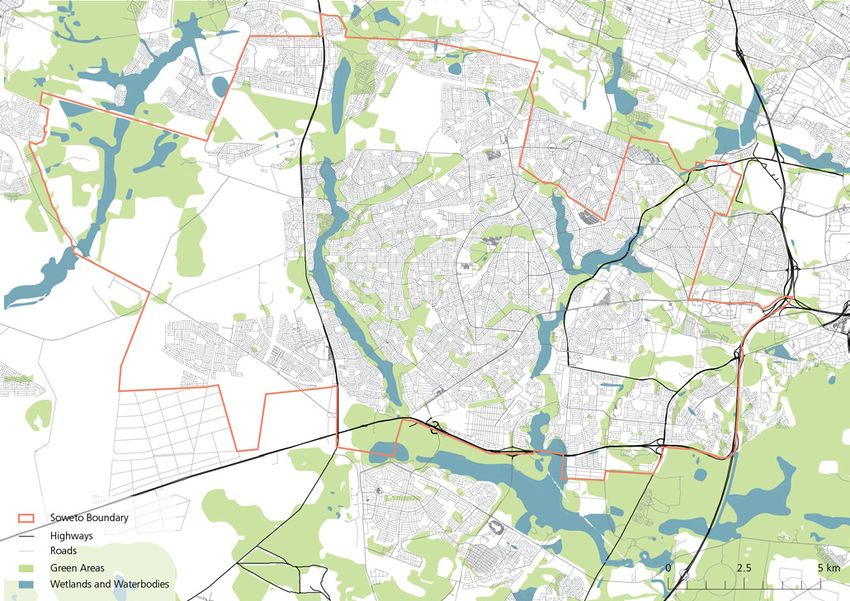
Global Future Cities Programme
JOHANNESBURG
City Context Report

UNITED NATIONS HUMAN SETTLEMENTS PROGRAMME
P.O. Box 30030, Nairobi 00100, Kenya
www.unhabitat.org

Funded by: United Kingdom Foreign and Commonwealth Office (UK FCO)
Lead executive agency: UN-Habitat: Urban Planning and Design Lab
Academic partner: International Growth Center (IGC)
Professional partner: United Kingdom Built Environment Advisory Group (UKBEAG).

Disclaimer
The designations employed and the presentation of material in this report do not imply the expression of any opinion
whatsoever on the part of the Secretariat of the United Nations concerning the legal status of any country, territory,
city or area or of its authorities, or concerning the delimitation of its frontiers or boundaries, or regarding its economic
system or degree of development. The analysis conclusions and recommendations of this publication do not necessarily
reflect the views of the United Nations Human Settlements Programme or its Governing Council or its member states.
Reference of this publication of any specific commercial products, brand names, processes, or services, or the use of
any trade, firm, or corporation name does not constitute endorsement, recommendation, or favouring by UN-Habitat
or its officers, nor does such a reference constitute an endorsement of UN-Habitat.

Acknowledgments

City context report coordinators (Johannesburg): Francesco Tonnarelli, Niina Rinne, Dongni Niu (UN-Habitat)

United Kingdom Foreign and Commonwealth Office (UK FCO)

Project Management 					Elizabeth Milsom
Pretoria Office							Mosima Maake

United Nations Human Settlements Programme (UN-Habitat)

Project Coordination 						Laura Petrella
Project Manager      					Rogier van den Berg
Project Supervisors						Klas Groth, Naomi Hoogervorst

Local City Specialist						Yondela Silimela

Urban Planning and Design LAB:
Niina Rinne, Jonathan Weaver, Sara Thabit, Gabriela Aguinaga, Dongni Niu, Riccardo Maroso, Charlotte Mohn,
Ban Edilbi, Jean-Noé Landry, Katherine Cashman, Princesse Samba, Yabework Kifetew, Nadia Mourid, Yumi Neder,
Stephanie Gerretsen, Shegufta Nawaz, Helen Yu, Francesco Tonnarelli

The International Growth Center (IGC)

Project Coordination						Astrid Haas

Contributors
Priya Manwaring, Victoria Delbridge, Michael Blake, Oliver Harman, Shah Rukh, Sebastian Kriticos

United Kingdom Built Environment Advisory Group (UKBEAG)

Project Coordination and Strategic Advisor			Peter Oborn
Project Lead 							Adrian Mallesom
Contributor and City Visiting Expert				Adrian Mallesom
CONTENTS

GLOBAL FUTURE CITIES PROGRAMME                                                                                   4
  Introduction                                                                                                   4
     About The Global Future Cities Programme
     Intervention Development and Validation
     The City Context Report
  Johannesburg                                                                                                   9
     General Context
     Introduction to the Interventions
     A Review of the Fourth Industrial Revolution (4ir) Trends and Their Effect on Urban Mobility in Johannesburg
     Intervention B: Strategic Area Framework and Associated Implementation Tools for Soweto Triangle

URBAN ANALYSIS                                                                                                 14
  Spatial Analysis                                                                                             14
     Existing Mobility System
     Transport Challenges
     Historical Context and Overview of Soweto
     Spatial Structure and Main Challenges in Soweto
     Environmental Challenges
     Access, Mobility and Transportation
  Financial Analysis                                                                                           22
     Municipal Financial Capacity
     Capital Investment Capacity
     Financing Mechanisms
  Legal Analysis                                                                                               25
     Governance Structure
     Planning Hierarchy
     Visions and Strategies for Transport
     Visions and Strategies for Soweto

INTERNATIONAL ALIGNMENT AND TECHNICAL RECOMMENDATIONS                                                          29
   Potential Impact                                                                                            29
      Short-term Outcome
      Medium-Term Outcome
      Long-term Potential Impact
   Contribution to Sustainable Urban Development                                                               31
      2030 Sustainable Development Goals
      New Urban Agenda Alignment
      Alignment with Cross-Cutting Issues and the Prosperity Fund
   Success Factors                                                                                             33
      Spatial Considerations
      Financial Considerations
      Legal Considerations

ENDNOTES                                                                                                       36
4   JOHANNESBURG - City Context Report

    GLOBAL                                                      and collectively provide further evidence for the overall
                                                                programme.

    FUTURE CITIES                                               The Programme builds upon a coherent series of
                                                                targeted interventions in 19 cities across 10 countries,
                                                                to support and encourage the adoption of a more

    PROGRAMME                                                   sustainable approach to urban development. In general,
                                                                the proposed interventions aim to challenge urban
                                                                sprawl and slum developments, thereby promoting more
                                                                dense, connected and inclusive cities that in combination
                                                                contribute to prosperity, achieving the Sustainable
                                                                Development Goals (SDGs) and implementing the New
    Introducti on                                               Urban Agenda (NUA).

                                                                The Global Future Cities Programme builds upon three
                                                                integrated pillars, that will address key barriers to
    ABOUT THE GLOBAL FUTURE CITIES PROGRAMME                    prosperity, in selected cities:

    In 2015, the UK government created a new Cross-             •   Urban planning – technical assistance for
    Government Prosperity Fund worth £1.3 billion from              spatial restructuring (Public space, Heritage
    2016-2021, in order to help promote economic growth             and urban renewal, Urban strategies and plans,
    in emerging economies. Its broad priorities include             Data systems for integrated urban planning);
    improving the business climate, competitiveness and         •   Transportation – technical assistance to
    operation of markets, energy and financial sector               support cities to develop integrated transport
    reform, and increasing the ability of governments to            systems (Multi-modal mobility strategies and
    tackle corruption.                                              plans, Data systems for multi-modal mobility);
                                                                •   Resilience – technical assistance to develop
    Emerging Economies still face considerable challenges           strategies to address the impact of climate
    such as uncontrolled urbanisation, climate change and           change and ensure development is sustainable
    high and persistent inequality which can lower long-            (Flood management plans and systems).
    term growth prospects. The Prosperity Fund supports
    the broad-based and inclusive growth needed to              In order to capitalize on the proposed interventions
    build prosperity and reduce poverty, but also make          and to ensure sustainability and impact in a longer-
    development overall more sustainable through the            term perspective, the programme has a strong focus on
    strengthening of Institutions and Improvement of the        technical support and institutional capacity development.
    global business environment.
                                                                In many of the interventions, there is a particular focus
    The Global Future Cities Programme (GFCP) is a specific     on the potential of embedding smart/digital technology
    component of the Prosperity Fund which aims to carry        and data analysis platforms in urban governance and
    out targeted interventions to encourage sustainable         management processes. Integrating smart technologies
    urban development and increase prosperity whilst            is recognized as an instrumental area that significantly
    alleviating high levels of urban poverty. The programme     can improve the efficiency in the provision of key
    will also create significant short and long-term business   infrastructure services, enhance urban resilience, support
    opportunities in growing markets, forecast to be regional   evidence-based plans and strategies and promote
    growth hubs, including for UK exporters who are world       integrated planning approaches across sectors.
    recognised leaders in urban innovation.
                                                                INTERVENTION DEVELOPMENT AND VALIDATION
    The overall strategy of the Global Future Cities
    Programme is to deliver the Programme in two phases;        Based on initial scoping studies and government-to-
    a strategic development phase (2018), followed by           government engagement carried out by UK FCO, the
    an implementation phase (2019-2021). UN-Habitat,            UN-Habitat team worked with partner local authorities
    in collaboration with the International Growth Centre       and wider stakeholders to corroborate their city
    (IGC) and the UK Built Environment Advisory Group           development strategies, and to confirm, enhance and
    (UKBEAG), has been mandated by the UK Foreign               develop the intervention proposals.
    and Commonwealth Office (UK FCO) to develop and
    undertake the strategic development phase. This in          In each city, a Local City Specialist, supported by the
    turn, will inform and shape the implementation phase,       national and regional country offices of UN-Habitat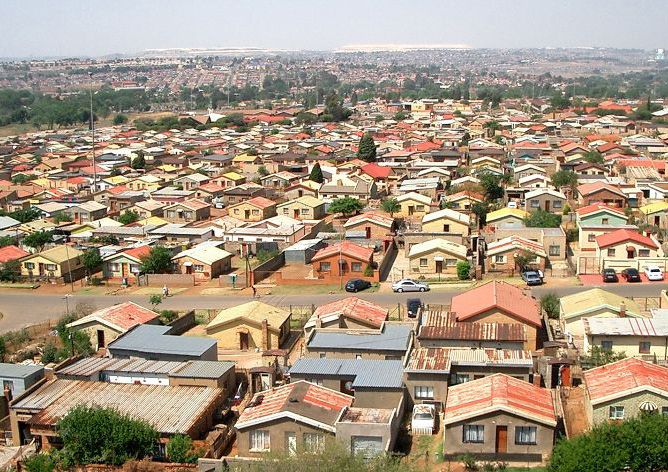
INTRODUCTION     5

and in liaison with the FCO local posts, took the             in a set of City Context Reports as well as an analysis of
lead in identifying stakeholders in a series of bilateral     the technical viability of the interventions. The analysis
meetings, interviews and focal group discussions. This        aimed at both informing the development of the Terms
has collectively gathered information and provided            of Reference and the future implementation phase of
more detailed knowledge and information on the City’s         the Programme.
visions and goals.
                                                              THE CITY CONTEXT REPORT
Based on this initial phase, a Charrette (planning
workshop) involved high-level decision-makers from            Objectives
the public and private sectors together with civil            A City Context Report is provided for each city of the
society representatives. This facilitated discussion on       Global Future Cities Programme. It serves as a tool to
the proposed and possible alternative interventions,          frame the proposed Programme interventions within
related individual interests, technical opportunities and     the characteristics and pre-conditions of each city.
constraints, as well as political objectives. The outcome
of the Charrette provided clarity on where stakeholders       The Report targets a variety of stakeholders in the
stand in relation to the strategic potential of the           Programme: administrators, city managers, policy
discussed projects and it allowed for the mobilisation        makers, legislators, private sector actors, donors, and
of support.                                                   local as well as international researchers and knowledge
                                                              generators. The Reports also provide UKFCO the
At the same time, the Charrette allowed for the technical     contextual setting of each proposed intervention, and
teams to proceed with the development of a Terms of           can in addition, be used by the Service Providers as an
Reference, outlining the specific scope and activities of     entry point for the implementation phase.
each intervention. A final Validation Workshop assured
consensus on the proposed projects and document’s             By addressing the specific challenges facing each city, the
endorsement by the authorities.                               Report illustrates how the interventions can work towards
                                                              inclusive prosperity and sustainable urban development.
Parallel to preparing the Terms of Reference, an              The benefits of each intervention, however, cannot be
evaluation of the interventions was initiated, aiming to      achieved without certain enabling conditions to ensure
address its feasibility within the local strategic context,   its success. Therefore, critical aspects for the delivery
identify potential impact on prosperity barriers and to       of the proposed interventions and its success from a
explore the optimal delivery models. This process resulted    long-term perspective are outlined. Using thematic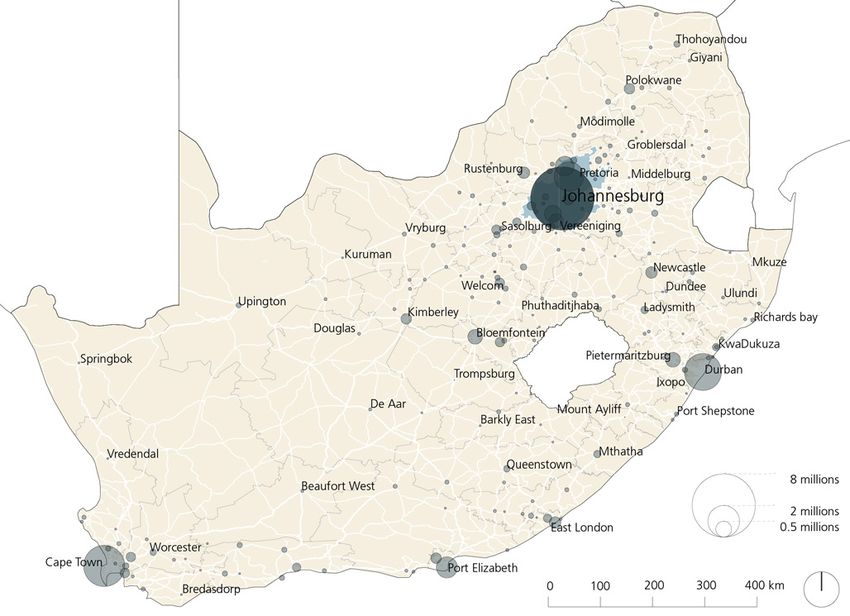
6   JOHANNESBURG - City Context Report

    best practices and evidence from global learnings and          can either facilitate or hinder the implementation and the
    research, contextualised recommendations are provided          long-term sustainability of the proposed interventions in
    on the conditions necessary for the intervention to be         transport, resilience and urban planning.
    viable and to reach a maximum impact.
                                                                   This framework follows UN-Habitat’s three-pronged
    Essentially, the City Context Report serves to ensure that     approach, recognising the three essential components
    all actors within the Global Futures Cities Programme          for a successful and sustainable urbanisation: 1. urban
    are aware of the specific conditions to be considered in       planning and design; 2. urban economy and municipal
    the delivery of the proposed interventions, on a case-by-      finance; 3. urban legislation, rules and regulations.
    case basis.
                                                                   Firstly, the spatial analysis describes the existing urban
    Set-up and Scope                                               context specific to the intervention. Urban mobility
    The first part of the City Context Report (General             systems, vulnerability of the built environment, spatial
    Overview) provides an overview of the Global Future            form and trends are considered as possible challenges in
    Cities Programme and introduces the city from the              urban management that the intervention can address.
    perspective of the urban challenge which the proposed
    intervention intends to address.                               Secondly, the financial analysis aims to identify the
                                                                   mechanisms in place by which the intervention could
    The second part of the Report (Urban Analysis) more            be sustainably financed in the long-run. This section
    critically and technically analyses a selection of factors     outlines the city’s municipal capacity, existing regional,
    which need to be considered or to be in place for              national and international financial ecosystem and
    the intervention to succeed, addressing its feasibility,       existing financing mechanisms at the municipal level.
    potential impact on prosperity barriers from a long-term
    perspective.                                                   Thirdly, from a legal perspective, the Report critically
                                                                   analyses how the intervention could be facilitated or
    The third part of the Report (International Alignment          challenged by the vision of the city and its governance
    and Technical Recommendations) presents short–and              hierarchy. Enablers and obstacles resulting from any
    mid-term expected outcomes as well as long-term                relevant legislation, as well as sectoral frameworks
    potential impacts. It further elaborates the contribution      (e.g. strategies, policies, planning frameworks and
    of the intervention to the achievement of the SDGs and         development plans, detailed plans of relevance) are also
    the implementation of the New Urban Agenda as well             described.
    as the programme objectives of the Prosperity Fund.
                                                                   This approach aims to offer implementing partners,
    As the City Context Report is tailored directly to             stakeholders and donors a general context of the city
    the Programme interventions, the analysis does not             and, with it, demonstrate the appropriateness of the
    aim to comprehensively present all aspects of urban            intervention from a spatial, financial and legal point of
    development. It does not elaborate on long term                view, while at the same time informing about potential
    planning and transformation strategies, the effectiveness      barriers and enablers for its implementation.
    of policy or urban legislation, nor the entire municipal
    financial system. As such, it also excludes urban policy       Potential Impact to the Program Objectives and the
    recommendations.                                               SDGs

    However, the Report has the scope to illustrate the            The Report also outlines the potential impact of the
    general capacity of the city for project delivery, and         interventions, based on the specific activities and
    in this regard, make recommendations to support                outputs proposed. Impact can arise from a complex
    implementation of the interventions and reaching set           interaction of context-specific factors, rather than as
    goals. The City Context Reports will be part of knowledge      result of a single action, which makes it difficult to
    management for the Programme to generate local                 empirically quantify longer-run effects that go beyond
    information and data on the cities as well as identify         the identification of program outputs. An empirical,
    gaps in knowledge, systems or governance.                      comprehensive impact assessment is therefore not part
                                                                   of the scope of this report.
    Methodology
                                                                   Nevertheless, the report outlines potential benefits
    Urban Analysis                                                 that are only achievable under certain preconditions
                                                                   and activities. Thereby, short-, medium- and long-term
    The City Context Report provides a general analysis of         outcomes are defined with reference to a project-cycle
    the spatial, financial and legal conditions in the city that   approach, which considers all the project phases from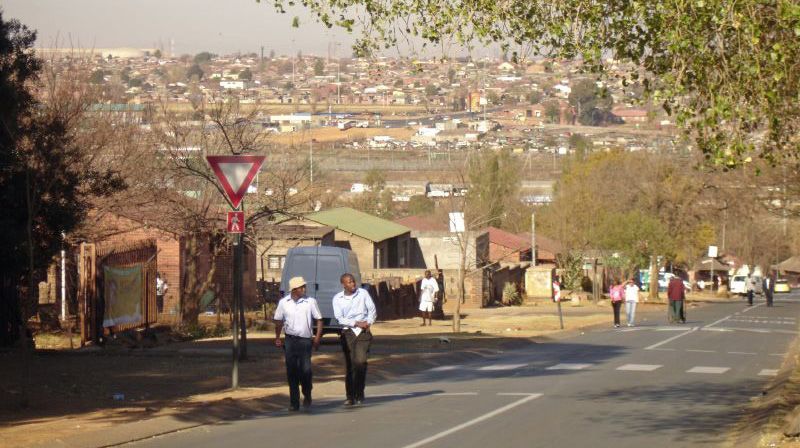
INTRODUCTION      7

                                                            The City Context Reports further connect potential
                                                            impacts to the Programme’s objectives, taking into
                                                            account also the Cross-cutting issues at the core of
                                                            UN-Habitat’s mandate from the UN General Assembly.
                                                            Consequently, the Programme’s objectives are
                                                            summarized into five principles:

                                                            •    Climate Change;
                                                            •    Gender Equality;
                                                            •    Human Rights;
                                                            •    Youth;
                                                            •    Sustainable and Inclusive Economic Growth.

                                                            Cross-cutting issues are addressed with explicit reference
                                                            to the 2030 Sustainable Development Goals (SDGs) and
                                                            the New Urban Agenda, in an attempt to ensure that
                                                            the proposed interventions are in line with the design,
                                                            implementation, review and success of the 2030 Agenda
                                                            for Sustainable Development. Consistent with UN-
                                                            Habitat’s mandate, the SDG 11 Sustainable Cities and
                                                            Communities is linked with the urban dimension of the
                                                            other 16 goals as an essential part of the localisation of the
                                                            SDGs. In this way, interventions can support localisation
                                                            processes, to support local ownership and ensure SDG
                                                            integration in sub-national strategies and plans.

                                                            Technical Recommendations and International Best
                                                            Practices

                                                            The interventions proposed in the various cities of the
                                                            Global Future Cities Programme were grouped into
                                                            clusters according to their thematic entry-point, as an
                                                            elaboration of the thematic pillars of Urban Planning,
                                                            Transport and Resilience.

                                                            These clusters are:

                                                            •    Public space
                                                            •    Heritage and urban renewal
Planning and Design through Building, to Operating and      •    Urban strategies and plans
Maintaining.                                                •    Data systems for integrated urban planning
                                                            •    Multi-modal mobility strategies and plans
Short-term outcomes are directly achieved through the       •    Data systems for multi-modal mobility
implementation of the technical assistance support,         •    Flood management plans and systems
within the 2-3 years scope of the Global Future Cities
Program.                                                    Combining the international experience in urban policy
                                                            and project implementation of UN-Habitat and the
Mid-term outcomes are only realised once the                leading academic research of IGC, each cluster was
intervention is executed through either capital             analysed to offer evidence-based recommendations for
investment, implementation of pilot projects or             a successful Implementation and a maximised impact
the actual enactment of legal documents, plans or           of the intervention. Specific reference was given to
masterplans, within a possible timeframe of 3 to 7 years.   implemented plans and international best practices.

The broader long-term impact of the interventions           The recommendations inform the Planning and Design
is linked to the sustainability of the interventions in a   phase which coincides with the timeframe of the Global
7-15 years timeframe and relates to the operation and       Future Cities Programme, and always aim for long-term
maintenance phase of the project cycle.                     sustainability of the interventions.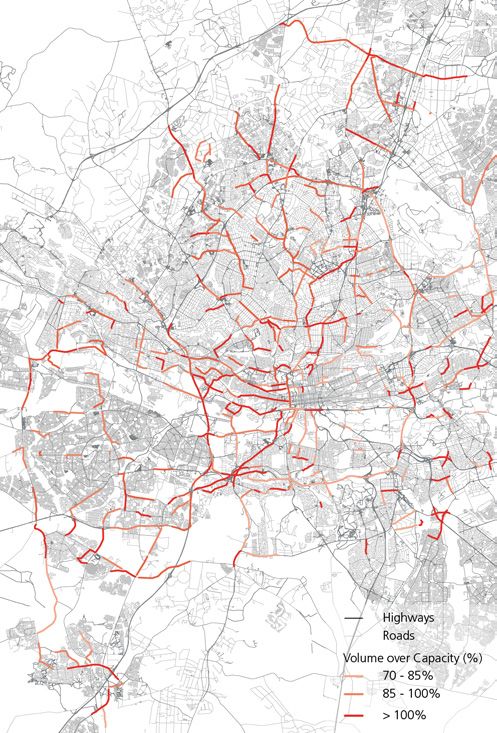
8 JOHANNESBURG - City Context Report
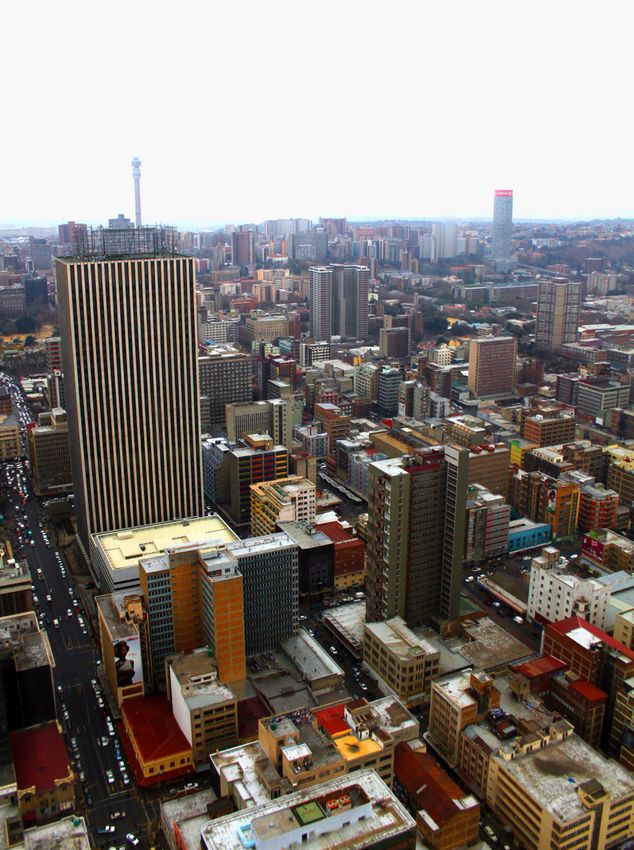
Fig. 1. Johannesburg aerial view (Source: UN-Habitat)INTRODUCTION 9
Johannesb ur g Africa as a whole and, despite inward migration, has
managed to increase employment rate compared to the
country’s average.
GENERAL CONTEXT
At the same time, Johannesburg has high levels of
Johannesburg is the capital of Gauteng. By size Guateng unemployment, poverty and one of the highest levels
is the smallest of the nine South African provinces but of inequality in the world. Of the economically active
by population it is the biggest, representing some 24 per population, 71 per cent are employed while the rest
cent of the overall population.1 are either unemployed or discouraged work seekers.
The finance sector occupies the biggest portion of the
As of 2016 Johannesburg had an estimated population of working population with 26.6 per cent, followed by the
4.4 million, more than one-third of the total population trade sector (21.1) among the formal sector workers.
of Gauteng Province.2 According to the censuses, the The informal sector employs around 395,000 people,
city has grown at extremely high rate, an average of 4.1 which is 19.8 per cent of the labour force.5
per cent between 1996 and 2001 and by 3.2 per cent
between 2001 and 2011. Although this urbanisation The city has grown in a fairy sprawled fashion over
boom which followed the end of Apartheid3 is projected the past 20 years although it has adopted a series of
to slow, Johannesburg is expected to reach 7 million strategies and policies and become denser. Moreover,
Inhabitants by 2040. the practices of Apartheid and post-Apartheid planning
have led to the development of a spatial structure with
The city is a global financial centre and economic a series of shortcomings, including spatial inequality,
powerhouse and contributes around 17 per cent to fragmentation and spatial disconnection, limited land-
national GDP.4 Its economy has grown faster than South use diversity and pressure on the natural environment.
Fig. 2. South Africa and its towns by population10 JOHANNESBURG - City Context Report
and future trends in technology that are impacting on
or likely to impact on urban mobility in the city. The
intervention will determine the likelihood of these trends
happening in the city, their impact and determination of
‘winners and losers’.
A Strategic Area Framework for Soweto: The aim of
Intervention B is to develop a Strategic Area Framework
(SAF) for Soweto that incorporates planning, transport
and resilience considerations and develops specific tools
to tackle development challenges.
A REVIEW OF THE FOURTH INDUSTRIAL REVOLUTION
(4IR) TRENDS AND THEIR EFFECT ON URBAN MOBILITY
IN JOHANNESBURG
Mobility in Johannesburg is an area of intervention
that the Municipality highlights as strategic. It is in fact
seen as the potential driver for the fundamental spatial
transformation that will overcome the fragmentation
and social exclusion which still affect the city. Although
the City of Johannesburg has developed a series of
transport strategies and programmes, which seek to
Fig. 3. Johannesburg and municipalities within Gautenberg province.
meet the objectives and outcomes of the city’s Joburg
2040 Growth and Development Strategy (GDS) as well
Of these, spatial inequality remains a defining as relevant statutory plans, the city faces a number of
characteristic of the settlement pattern of Johannesburg. transport challenges:
The areas of highest densities of housing, the ‘townships’
inherited from Apartheid spatial policies, are also some • Congestion
of the most deprived areas in the city which are located • Crime
far from economic opportunity. The city‘s economy is • Exclusion
centred on two regions - the inner city and Sandton, • Lack to reliable, safe and affordable public
which constitute 50 per cent of the economic output transport
with just 23 per cent of the population. The region from
Soweto to Orange Farm in the South-West, contributes At the same time, mobility is one of the sectors most
just 13 per cent of the city’s economy despite housing affected by technological advances and the new societal
41 per cent of the population.6 The mining belt divides trends, which are sometimes referred to as the Fourth
these two regions, emphasising the major spatial Industrial Revolution (4IR) or the Digital Revolution. The
discontinuity in the city structure. sharing economy, Internet of Things (IoT) and artificial
intelligence have radically changed the way people
move in cities and are developing at an exponential rate.
INTRODUCTION TO THE INTERVENTIONS Digital and technological advances offer new analytical
tools and improvements in the transport modes that
A series of consultative processes (bilateral meetings, a can enhance efficiency and security and open up new
focal group discussion the City of Johannesburg’s focal opportunities. However, they can also deepen social
team and a larger workshop with local government and divides if not property understood, integrated and
stakeholders from civil society, private sectors, academia) accessible.
has enabled the City of Johannesburg Metropolitan
Municipality (CoJ) and its departments of Planning, The City of Johannesburg’s transport strategy was
Transport and Environment, Infrastructure and Services, completed in 2013 but did not capture comprehensively
together with the UK FCO and UN-Habitat to Identify the challenges and opportunities that the 4IR offers.
two areas of Intervention that could match priority Hard interventions on infrastructure and mass transit,
programmes and processes currently underway within which need stability and predictability over time to be
the city. These are a review of the Fourth Industrial planned and executed, are influenced by the rate of
Revolution (4IR) trends and effects on urban mobility change and general uncertainty that prevails currently
in Johannesburg. Intervention A aims to assess current in the city, especially politically, and that Is exacerbatedINTRODUCTION 11
Fig. 4. Johannesburg aerial view (Source: Andrew More)
by tech-enabled disruptors. Societal changes and making, design and infrastructure in
consumer behaviour patterns such as shopping and anticipation of future trends.
work are shifting and these are impacting on mobility
patterns. Minibus taxis, the dominant transport modes, • To propose recommendations that urban
still depend on low tech-solutions and struggle to tackle planners need to consider in the present, to
inefficiencies. be able to achieve a sustainable and socially-
inclusive path of technology adoption in the
The intervention proposed by the Global Future Cities future.
Programme will assess which trends of the 4IR are
impacting urban mobility in the City of Johannesburg. The development of the intervention will focus on the
Key amongst this assessment will be the identification following tasks:
of the changes that can be considered positive and i. Undertake a review of international and domestic
contribute to broader goals of creating a prosperous Fourth Industrial Revolution (4IR) trends and
and equitable society. Based on this assessment, the patterns that impact urban mobility (passenger
city will determine the most appropriate pathways for and freight)
Johannesburg and develop an implementation plan that ii. Assess the likelihood of each of these being realised
details the policy, regulatory and fiscal interventions to in Johannesburg
be pursued. iii. Determine the impact of each of the likely initiatives
on a variety of stakeholders, consumers, and
The aims and objectives of the services are: operators with a focus on inclusion and equity
iv. With respect to those interventions with a high
• To raise awareness of the City of Johannesburg likelihood and significant impact, determine
and its urban decision-makers regarding associated risks and opportunities
potential future trends and technologies and v. Recommend a suite of actions (policies, regulations,
help them reflect at an early stage on the best financial and planning frameworks) to be
outcome for adoption undertaken by the City of Johannesburg to
• To explore the effects and impacts that the mitigate negative impacts and enhance positive
influx of future trends and technologies could outcomes in anticipation of the most likely
have on the quality of life, ease of movement mobility trends
and overall social equity in Johannesburg
• To guide policy, regulation, fiscal decision12 JOHANNESBURG - City Context Report
Fig. 5. Street in Soweto (Source: UN-Habitat)
INTERVENTION B: STRATEGIC AREA FRAMEWORK AND The Intervention aims to compile a development
ASSOCIATED IMPLEMENTATION TOOLS FOR SOWETO framework for a defined part of Soweto in line with the
TRIANGLE SDF. The study area (the ‘triangle’) is bounded by Van
Onsellen Road to the north; Klipspruit Valley Road to the
east; Chris Hani Road to the south and Koma Road and
Soweto is mainly residential, lacking social services and Elias Motsoaledi to the west.
employment opportunities. It has one of the highest
population densities but the lowest concentration of The plan should integrate the socio economic,
formal jobs within Johannesburg. Soweto also faces environmental, spatial and transport challenges related
environmental sensitivities and is prone to, amongst to Soweto. The primary objective of this study is to define
other issues, flooding. Nonetheless, the township’s clearly a sustainable spatial and economic development
adequate spatial form and its location along public vision and trajectory for the broader study area.
transport corridors offer the potential to develop it as a
liveable city district. This should include:
The City of Johannesburg’s approved Spatial • Description and analysis of the status quo and
Development Framework (SDF) defines Soweto as one baseline data and trends
of the priority areas for future growth, redevelopment • Identification and description of key precincts
and intensification. In general, the aim of the SDF is to and nodes, based on transit infrastructure,
diversify and better service single-use, high-density parts economic and social activity and ecological
of the city, such as Soweto, into true city districts where assets
people can live, work, learn and play. • Definition of the ideal land use mix for the
identified nodes or precincts
Capital investment prioritised in Soweto would have the • Propose spatial, urban design and resilient
capacity to trigger positive effects on a city-wide and infrastructure (social, engineering and mobility)
metropolitan scale. The strategy is to develop Soweto interventions to unlock development potential
into a series of self-sufficient mixed-use nodes, starting and promote inclusive and sustainable
around public transit stations and nodes. developmentINTRODUCTION 13
The secondary objective is to prioritise, package and
design projects and interventions that will catalyse and Main Stakeholder
support the achievement of the development vision and
ideal land use mix. Transport Department of the City of Johannesburg
City of Johannesburg Metropolitan Municipality
This should include:
Possible Project Partners
• Quantification and structuring the development
potential of the study area • Gauteng Department of Roads and
• Prioritisation and differentiation of nodes and Transport
precincts • National Passenger Rail Authority of South
• Identification of opportunities and projects Africa (PRASA)
to unlock or initiate public and private • Metrorail
development in the short-, medium- and long- • Gautrain
term • Bombela Concession Company
• Definition of infrastructure provision, • Metrobus
requirements and cost, determined within a • Taxi associations and operators
phased approach • Development planning department of CoJ
• Description of the key levers to realise the • Johannesburg Roads Agency (JRA)
development potential relating to land use
regulations, incentives, urban management Thematic Cluster
and alternative financing and funding
approaches to sustainably execute identified Integrated/Multimodal Transport Systems
projects and interventions
Keywords
Mobility, Mega trends, Fourth Industrial Revolution
Main Stakeholder
City of Johannesburg Metropolitan Municipality
Development planning department of City of
Johannesburg
Possible Project Partners
• City of Johannesburg:
• Economic Development Department
• Environment and Infrastructure and
Services Department
• Transport Department of the City of
Johannesburg
• Citizens assembly
Thematic Cluster
Urban Strategies and Masterplans
Keywords
Urban Planning, Economic development,
Environment, Mobility14 JOHANNESBURG - City Context Report
URBAN ANALYSIS
Figure 6 below provides the most frequent types of
transport used in the City of Johannesburg (CoJ).7 This is
based on a 2011 survey of 4502 respondents in the city.
The category of taxi mainly refers to the minibus taxis.
Road Network
The responsibility of the road network In Johannesburg is
shared among different government levels. The national
government is responsible for the freeways (N routes).
The provincial Department of Roads and Transport
builds and maintains various provincially-owned roads
S patial An a l y si s in Johannesburg. The CoJ builds and maintains the
remaining network of public roads, including two
freeways: the M1, connecting southern areas with the
city centre and Sandton into the highway to Pretoria,
EXISTING MOBILITY SYSTEM and the M2 and M2, running east-west just above the
mining belt.
Johannesburg’s mobility relies on a complex network
of roads and a growing public transport system, Rail System
coordinated by the Transport Department.
The Johannesburg rail system is run by the National
Public transport is made available through a variety Passenger Rail Authority of South Africa (PRASA). Its
of modes, operated by different companies, both commuter rail operator is Metrorail. The rail network
private and public. One of the main challenges of is east-west aligned, only covers the southern area of
the administration of the City of Johannesburg is the Johannesburg and does not fit entirely with existing
integration of the different operators that currently have residential and economic nodes, as shown in Figure 6.
autonomous schedules, itineraries, tariffs and don’t There are in total 55 railway stations but some major
share a common ticket system. destinations within the city are not served, such as OR
Tambo International Airport, Midrand and Sandton
although all are now served by Gautrain.8
Gautrain
Joburg has a provincially-implemented rapid rail
system known as Gautrain. Completed in 2012, it links
Johannesburg, Tshwane and OR Tambo International
Airport in the northern suburbs that do not have a
heavy rail/metro system. The 80km network comprises
two lines and ten stations, five of which are in Joburg.
Access to and from stations is through park and ride
and via a feeder/distribution network of buses serving
a catchment area of 5km radius from each station,
operated by the Bombela Concession Company. The
Gautrain works on a smartcard system, used also for the
feeder buses.9
The BRT System
The Rea Vaya Bus Rapid Transit (BRT) system is the
city’s choice of mass public transport mode for its
busier corridors. Phase 1A and 1B of Rea Vaya BRT was
completed and brought into operation between 2009
and 2013, including 48 stations and 42.2km of trunk
route. It runs between the city centre and surrounding
areas, including the main university campuses, to
Fig. 6. Transport types in the City of Johannesburg destinations in Soweto.10 Phase 1C is under finalisation,URBAN ANALYSIS 15 Fig. 7. Strategic public transport network and flagship project routes
16   JOHANNESBURG - City Context Report

     and will extend the lines to the northern part of the city.   Tuk-tuk
     The Rea Vaya is run by the CoJ and uses a smartcard
     payment which allows for automated fare collection.           Several tuk-tuk operations have been licenced to
                                                                   operate in Joburg. However, there’s no policy in the
     Bus System                                                    former ITP about these vehicles or motorcycles use in
                                                                   public transport, a condition which raises concerns
     The network of bus services in Joburg is widespread.          about safety, competition and their proliferation.
     All regular lines are subsidised and their management
     is split between the City of Johannesburg and Gauteng         Non-motorised Transport
     Province, without a shared system of schedules or tariffs
     established.                                                  Walking is one of most important main mode of transport
                                                                   in Gauteng, ranking only after the car and minibus
     A fleet of 418 buses is operated by Metrobus, more            taxis. In the morning peak, 34 per cent of travels in the
     than 229 routes covering most of the Metropolitan             province are completed on foot (car accounts for 30.8
     Municipality. Metrobus is run by the CoJ but has a            per cent and minibus-taxi for 21.9 per cent), although
     different ticket system to the Rea Vaya.11 Other private      this figure is declining compared to the previous survey
     companies are contracted by the Gauteng Province with         in 2000.15 In addition, walking is the most significant
     the largest being Putco.                                      feeder mode for access to public transport including
                                                                   railway stations, bus stops and taxi ranks. However,
     Minibus System                                                cycling accounts for only a marginal amount of travels,
                                                                   0.3 per cent.
     The minibus taxi, although informal in status, is
     remarkably regulated and to every extent the dominant         Of the total amount of walkers and cyclists in the city,
     public transport mode in Joburg. There are 32 taxi            only about 10 per cent choose to walk or cycle for longer
     associations, controlling at least 1,013 different routes.    than 30 minutes because they cannot afford motorised
                                                                   transport.
     Apart from the estimated 12,300 short distance minibus
     taxis in Joburg , there are substantial long-distance taxi    Intelligent Transport System
     operations to and from the City, operating to about 100
     different destinations, including international.12            In the past ten years the Johannesburg Roads Agency
                                                                   (JRA) has been using the Intelligent Transport System
     The radial minibus-taxi route network is focused on           (ITS) to improve the operation of the road network.
     the Central Business District with an average taxi route      Measures include remote monitoring of motorways and
     length of 17.8km. Many passengers are able to make            signalized intersections using CCTV cameras, incident
     their trips using one taxi all the way (about 65 per cent)    detection and management, real-time information
     but 24 per cent require a taxi-taxi combination and 11        provision to drivers and so on. The city’s policy and
     per cent involve transfers to trains or buses.13              investment focus has shifted towards ITS instruments
                                                                   to enhance the operation of the city’s public transport
     Metered Taxi System                                           network including the BRT network.

     It is estimated that Joburg has 1800 to 2000 metered
     taxis. Apart from a range of services with several formal     TRANSPORT CHALLENGES
     large companies there are also many individual no name
     taxis, i.e. their rooflights indicate “Taxi” rather than a    Urban Form and its Negative Transport Effects
     company name. This comprises about 44 per cent of
     taxis.14                                                      Joburg’s urban form is sprawling, low-density and
                                                                   polycentric, a characteristic derived from a car-oriented
     Legally, it is compulsory for metered taxi vehicles to be     planning, and spatial segregation and inequality in
     equipped with a sealed meter to measure the cost of the       residence and jobs inherited from the Apartheid. This has
     trip. The Gauteng Provincial Government is in charge          many negative effects on transport, including increased
     of regulating fares, registering licences and grading taxi    travel times and structural car-dependency, which have
     services.                                                     the highest impact on low-income communities who
                                                                   have to travel long distances to reach jobs and services.
URBAN ANALYSIS 17
Congestion Weak Integration and Negative Competition
Among Different Modes of Transport
Traffic congestion in the city is quite severe and mobility
is quite compromised on many of the arterials and As described briefly before, management of public
freeways in peak periods.16 A 2011 survey estimated transport is split among a variety of public and private
that almost 80 per cent of drivers on roads are stuck in operators. Despite good intentions within the planning
severe traffic jams daily. The increased use of private cars instruments, integration among different operators,
and taxis has resulted in increased traffic congestion. In even formal ones, is extremely low. No uniform ticketing
addition, the city’s transport sector continues to be the tariff system is in place and often the planning and
highest (38 per cent) carbon emitter when compared to operation of new infrastructure for mobility follows
other sectors such as the industrial (28 per cent) and the competitive interests and political agendas.
residential (26 per cent) sectors.17
Various BRT routes have been designed to include
It is estimated that, by 2040, Joburg will have an extra Gautrain stations but there remains limited integration
2.5 million inhabitants.18 Based on current patterns, this due to significant difference in fares as well as the rigid
increased figure would mean more vehicles and more nature of the Public Private artnership signed between
congestion. Consequent negative effects would include the Gauteng Province and the Bombela Concession
poor air quality, increased road accidents, increased Company.19
greenhouse gas emissions and longer travel times,
which will affect negatively on the competitiveness and
attractiveness of the city and the quality of life of its
inhabitants.
Intersection Density (Intersections/km2)
1 -15
16 - 30
31 - 45
46 - 60
61 - 75
76 - 90
91 - 105
106 - 120
121 - 135
Fig. 8. Strees over Capacity in Johannesburg Fig. 9. Intersection Density within Johannesburg18 JOHANNESBURG - City Context Report
HISTORICAL CONTEXT AND OVERVIEW OF SOWETO
Being a product of Apartheid planning, Soweto’s urban
structure evolved over a period of more than 100 years
and it remains to function as a segregated ‘township’,
one of the most deprived, high-density residential areas,
inherited from apartheid spatial policies.
The first two areas to be developed were Pimvile
(Klipspruite) and Orlando during the 1930s as the
demand for housing grew exponentially for the large
number of black people migrated to Johannesburg for
job opportunities in the gold mining industry.
It was only after the democratic elections in 1994
that Soweto became a functional part of Joburg and
was integrated into the governance of the city. Black
Local Authorities came to an end and non-racial
administrations became louder.
Soweto is also one of the most deprived, high density
residential areas. The census 2011 reported 355,351
households in Soweto. Among these, only 55% had
piped water inside their dwelling, while around 93%
had electricity of lighting, and around 91% had access Fig. 10. Location of Soweto in Johannesburg
to a flush toilet connected to a sewerage system.20
The City of Johannesburg’s approved Spatial
Development Framework (SDF) 2016 identifies Soweto
as one of the key intervention areas that has the
potential of developing into a significant district.
While attention and resources have been deployed to
improve infrastructure, there are some parts of Soweto
that remain under serviced and the carrying capacity
of existing infrastructure would need to be upgraded
to accommodate additional growth. Approaches
to infrastructure provision need to be resilient and
Fig. 11. Historical growth of Soweto Fig. 12. Population DensityURBAN ANALYSIS 19
incorporate technological advances. Finally, given ENVIRONMENTAL CHALLENGES
the population densities in Soweto and the mono-
functional nature of the area, it is a significant generator The effects of climate change will increase cities’
of traffic. While a transport strategy exists for Soweto, vulnerability to natural hazards and increase the risk of
it requires revision to incorporate and inform land-use climate-induced displacement.21
considerations that will emanate from this planning
framework. Soweto lacks diversity in terms of mixed-use activities,
social infrastructure and consolidated public spaces.
High levels of pollution, traffic congestion, limited water
SPATIAL STRUCTURE AND MAIN CHALLENGES IN supply and energy insecurity, infrastructure backlog and
SOWETO under-maintained infrastructure are leading to increase
vulnerability to the impacts of climate change and
Despite the vast gains made through public investment natural disasters. The growing population contributes
over the past two decades, Soweto still faces a to the increasing pressure on the natural environment
limited range of housing typologies, sometimes poor even more.
living conditions with overcrowding in places, high
unemployment and insufficient infrastructure. Soweto The City of Johannesburg has a multitude of ecological
lacks diversity in terms of mixed-use activities, social assets which need to be preserved for its intrinsic natural
infrastructure and consolidated public spaces. value as well as to create a liveable and sustainable urban
While Soweto has a relatively high intersection density, form for the citizens. The Region D, where Soweto is
indicating good levels of walkability, higher order roads located, has environmental sensitivities which include
and connectivity across natural barriers such as streams, ridges such as Naturena Ridge, Dobsonville koppies,
across railway lines and between districts of Soweto Zondi koppies and Vista koppies; rivers and wetlands
should be improved. such as Greater Soweto, Klipriver and Klipspruit wetlands
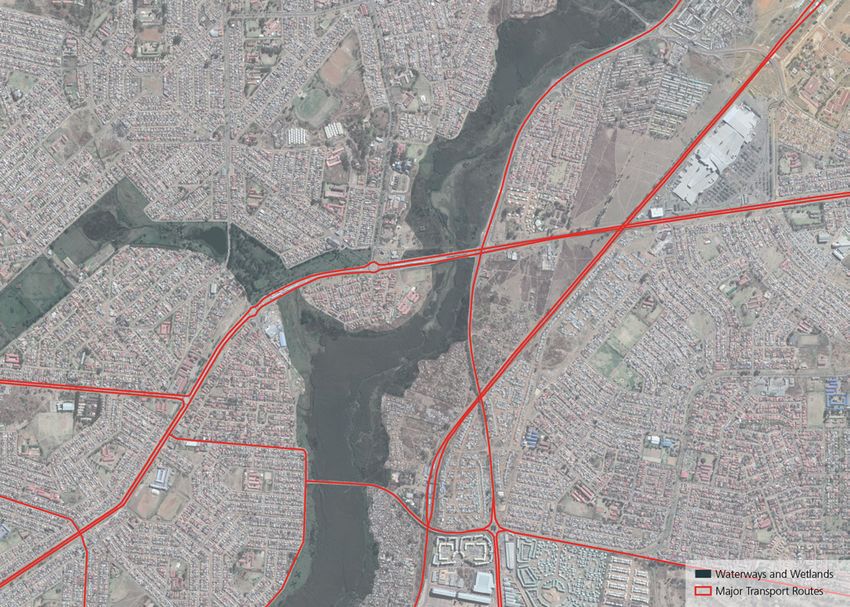
Fig. 13. Spatial structure of Soweto20 JOHANNESBURG - City Context Report
and dolomitic areas such as Protea Glen and Doornkop. ACCESS, MOBILITY AND TRANSPORTATION
Klipspruit Valley in particular is heavily impacted
by flooding. The area is earmarked as having high Soweto remains highly dependent on the wider city and
development potential due to its location along the specifically the inner city for jobs, with many residents
public transport backbone. Infrastructure provision making long daily commutes. The discrepancy between
needs to be resilient and incorporate technological the relatively high residential density of Soweto and its
advances. lack of job opportunities, caused by a limited diversity
in land use, is a generator of peak uni-directional travel
Dependence of fossil fuels in the domestic sector, demand towards the city centre which affects the whole
mining dust and increases in private traffic volumes of Johannesburg.
causes poor air quality and reduces the quality of life.
Furthermore, increased waste generation and disposal In order to solve this problem huge investment has
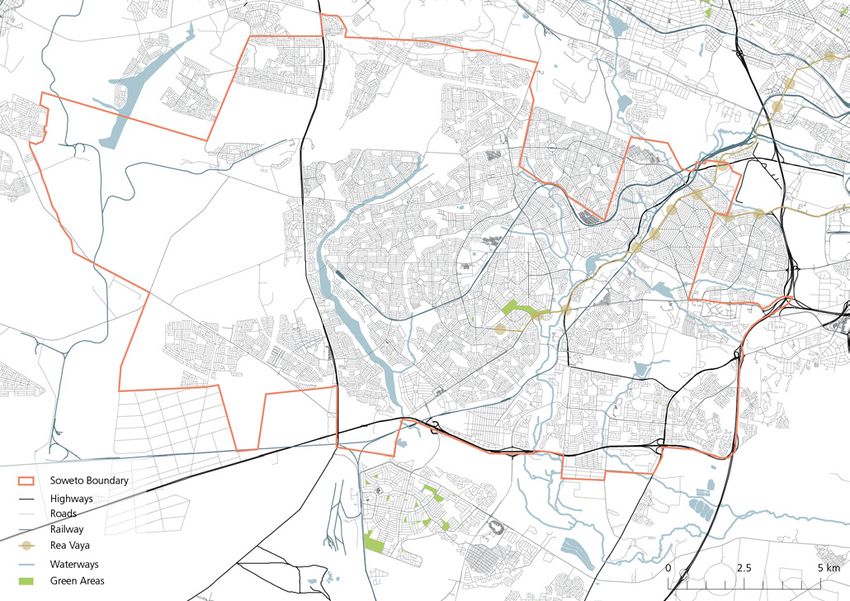
In Soweto due to population growth, lack of awareness been made to improve the connectivity of the area. As
and uncoordinated planning causes environmental illustrated in fig X, several railway stations and minibus
challenges. Sowetans experience energy insecurity, taxi routes are active in the area. The first implemented
which is the result of increasing energy demand, high phase of the Rea Vaya connects Soweto to the Central
reliance on electricity and network outages. Sources Business District, and the Bus Rapid Transit operational
should be diversified with a focus on clean energy plan identifies interchanges that will be a key point of
and energy efficiency in order to mitigate the climate origin for planned feeder and complementary routes to
change-related issues. greater Soweto.
However, a strong structure of open space provides Additionally, a proposed Gautrain extension should
the opportunity to establish corridors with public space reach Jabulani. Further to public transport access,
functions and ecological quality, potentially offering the the area is connected to primary highways via arterial
base for a resilience strategy. routes, namely Klipspruit Valley Road, Soweto Highway,
Fig. 14. Green areas and water bodies distribution in SowetoURBAN ANALYSIS 21
Randshow Road and Old Potchefstroom Road, although
road connections should be expanded - especially
across the mining belt. These arterials also provide
good neighbourhood connectivity between Soweto and
surrounding areas such as Lenasia, Rooderpoort and so
on.
Higher order roads and connectivity across natural
barriers such as streams, across railway lines and
between districts of Soweto constitute a barrier for the
integration of the different inner areas.
Large-scale monofunctional and underutilised land uses
also cause fragmentation. In addition, the low-built
form also leaves large stretches of unutilised land, which
are often illegally appropriated.
At the same time, the relatively high intersection density
indicates good levels of walkability. The population of
Soweto, one of the biggest in Johannesburg, brings
along an intrinsic demand for goods, services and
jobs. Matched with densification strategies and local
economic development incentives, there is the potential
to trigger the generation of a well-functioning compact
urban area.
Fig. 15. Isolated neighbourhoods in Soweto, divided by railway, creeks and highways22 JOHANNESBURG - City Context Report
Financial Ana l y si s
MUNICIPAL FINANCIAL CAPACITY
For the 2017-18 fiscal year, the City of Johannesburg’s
total revenue was ZAR 48.6 billion. This corresponds to
approximately USD 3.2 billion and is roughly equivalent
to a per capita municipal revenue of USD 740 based
on population figures from the 2011 Census.22 This per
capita figure is roughly similar to the municipal budgets
of Cape Town and Durban, whose revenues stand at Fig. 16. Johannesburg revenue sources
760 USD and 740 USD respectively, indicating that
Johannesburg has a similar revenue intake to other 19 per cent, which is slightly below the South African
major cities in South Africa. average. However, the fact that there is a presence of
land value-capture mechanisms in general does indicate
A breakdown of the major revenue sources for the City the potential to expand municipal revenues through
of Johannesburg is provided in the pie chart in figure these means if needed.
16. As is consistent with other municipalities across the
world,23 revenue from the provision of utility services –
chiefly, electricity and water – represents a major own- CAPITAL INVESTMENT CAPACITY
source revenue for Johannesburg. Overall, there appears
to be a strong indication for Johannesburg to able to The expected operational expenditure for the City of
raise own-source revenue. Johannesburg in 2017-18 stands at ZAR 47.3 billion,
meaning the city will have slight budget surplus of
A particularly important indicator of the city’s capacity around ZAR 1.3 billion. The pie chart in figure 17 provides
for generating own-source revenue is the receipts that a breakdown of planned expenditure in areas that are of
are generated from property taxation, as this represents particular interest to the proposed interventions.26 With
the city’s ability to capture appreciating land values regards to transport, road transport accounts for 7.3 per
which occur as a matter of course as the city develops. cent of expenditure while planning represents 2.9 per
In South Africa, property taxation is empowered by cent and housing 2.3 per cent.
the Local Government: Municipal Property Rates Act
[No. 6 of 2004] which created a uniform mechanism Focusing on capital expenditure, CoJ expects to spend
across the country through which property tax can take approximately ZAR 8.6 billion, which represents a
place. Since its enactment, municipalities in South Africa reasonably large decline compared to the ZAR9.9 billion
have taxed properties based on the value of land and that was spent on capital expenditure in the 2016/17
improvements, offering a large source of city revenue fiscal year. This is, however, expected to rise again to
to tap into.24 approximately ZAR 9.4 billion by the 2018/19 fiscal year.
These changes are illustrated in the bar chart in figure
In 2013/14, the revenue from property rates ranged 18 which show how capital expenditures are below 25
from 19 per cent of total own revenue in Ekurhuleni per cent, indicating that the municipality has mostly
to 27 per cent in eThekwini with an average of 22 limited capacity in capital expenditure and spends most
per cent across cities in South Africa.25 For the City of of its revenue in maintenance.27
Johannesburg as a whole, this stands at approximatelyURBAN ANALYSIS 23
Fig. 18. Capital vc operational projected and real spending
FINANCING MECHANISMS
As Johannesburg already derives the majority of its
finances from own-source revenue, including property
tax which already takes into account the value of the
land, this shows that there is sufficient data for land
value capture instruments. These instruments can be
relevant for both interventions in Johannesburg as,
when implemented, they can have an impact on land
values.
Given South Africa’s history of spatial segregation, the
city wants to ensure that the rise in land values does
not exacerbate urban spatial inequality. Therefore, the
city may consider instruments such as impact fees or
exaction that place the burden of paying on property
developers rather than the citizens. A relatively new and
innovative instrument to mobilise land value increment
generated by large-scale urban projects is construction
bonds, which work as an incentive for developers to
share the gains from additional building rights.
The capital investment requirements of both interventions
can also be financed in the future through borrowing.
Empowered by the Municipal Finance Management
Act, the City of Johannesburg (CoJ) has the capacity
and a strong precedent to borrow domestically and
internationally both from private sector and international
financial institutions. Since 2004, the CoJ has launched
four municipal bonds in the domestic and international
Fig. 17. Classification of heads of expenditures (2017-18) market to finance its operations and investments, with24 JOHANNESBURG - City Context Report
one of these bonds being secured by the International
Finance Corporation.28 As of October 2018, Moody has
rated Johannesburg’s debt to be ‘stable’, indicating at
first order the CoJ has a relative ease to borrow from the
international market.29
Some components of the interventions may be also
suitable to be implemented through Public Private
Partnerships (PPPs). Subject to central government
guidelines, CoJ also has the legal capacity and the
precedent to enter into PPPs. The Municipal Finance
Management Act (2003) and the Section 86A of the
Municipal Systems Act (2000) provide the legal ability
for municipalities in South Africa to enter into PPPs.
The two laws establish similar provisions and, based
on them, the Minister of Finance and the Minister
for Provincial and Local Government have set up
uniform guidelines – known as Municipal Public-Private
Partnership Regulations - for municipalities to follow
while undertaking a PPP agreement. It is stipulated that
they are able to deviate from these guidelines only if the
National Treasury preapproves it.
Broadly, these guidelines establish a framework under
which important pre-requisites to PPP agreements
and processes can be made. These Include feasibility
studies, standard procurement measures, amendment
to a PPP agreement and broader contract management
proposals.30 To give an example of past PPP projects, in
2011, the CoJ entered into a PPP for Alternative Waste
Treatment Technology. In another precedent from 2011,
CoJ entered into a PPP for fresh market produce.31 PPPs
have also been undertaken at the provincial level with
one example being the Gautrain Rapid Rail Link Project,
which was developed, operated and maintained through
a PPP between Gauteng and Bombela Concession
Company.URBAN ANALYSIS 25
CoJ’s structure is split between administrative and
decision-making. The administrative wing is headed by
the City Manager, who is appointed by the City Council.
The City Manager oversees the Executive Management
Team running the local bureaucracy. The elected City
Council acts as the principal decision-making body for
actions such as passing by-laws, passing the budget and
electing the executive Mayor, who is delegated as the
head of the executive branch and hence oversees the
City Manager and the administration branch.
The illustration in Figure 19 below provides a highly
Legal Anal y si s simplified illustration of this structure of CoJ, while
Figure 20 represents the organisational structure of the
executive branch.32
GOVERNANCE STRUCTURE
As defined by the Municipal Structures Act, No. 117
of 1998, the City of Johannesburg Metropolitan
Municipality (CoJ) has exclusive executive and legislative
authority in its jurisdiction. This gives a clarity of role
in all domains. The only exception is public transport,
where, as seen in the spatial analysis, provincial, national
and private stakeholders maintain a wide involvement.
Fig. 19. Joburg organizational structure
Fig. 20. Organisational structure of the executive branch26 JOHANNESBURG - City Context Report
Intergovernmental Cooperation The transport system in the city is heavily dependent on
the minibus taxi service, made up of privately-owned
There is presence of several coordination mechanisms vehicles. They are, however, not operated under an
between the CoJ and the provincial and central integrated system. Hence, there is no set schedule and
governments. However, most of these mechanisms are there is operational autonomy by the owners of these
non-statutory. The central government’s Department of minibuses.35 The Table below charts the key public
Cooperative Governance and Traditional Affairs is tasked transport types used in the city.
for supporting and coordinating with municipalities
across South Africa.33
Public Transport Who runs it?
The South African Local Government Association
Rail Passenger Rail Agency of
(SALGA) is a statutory autonomous association of all
South Africa (PRASA)
municipalities which lobbies for the municipalities.
SALGA plays an active role in intergovernmental Rea Vaya Bus Rapid Transport CoJ’s Johannesburg
relations. For example, it is often invited to the (BRT) Metropolitan Bus Service.
Presidential Coordination Council (PCC) to coordinate Gautrain Rapid Rail Link Gauteng Department of
with provincial and central government officials. Finance and Economic Affairs
Gauteng Premier’s Coordinating Forum is mandated to
coordinate between the provincial and the municipal Minibus taxis Privately owned but regulated
governments, including CoJ.34 by CoJ
Transport Governance Fig. 22. Key public transport types used in the city
While the CoJ has the legal mandate to regulate the
transport infrastructure in the city, the operations are PLANNING HIERARCHY
split between several public and private operators.
There are several actors in the transport arena. They are According to its governance structure, the planning
summarised in figure 21 below. hierarchy in Johannesburg delineates a significant
amount of policy power and influence to the city
government. This is evident by the hierarchy of the main
planning strategies, most of which are created at the
city level.
Stakeholder What do they do?
At the national level, the key plan is the Integrated Urban
Provincial Department of They build and maintain many Development Framework, drafted by the Department of
Roads and Transport provincially-owned roads Cooperative Governance and Traditional Affairs, which
and are also the contracting sets up a broad policy framework for urbanisation in
authority for various bus South Africa.
services in Johannesburg.
City of Johannesburg They operate the metrobus The City of Johannesburg’s long-term growth and
Metropolitan Municipality and Rea Vaya Bus Rapid development strategy is known as Jo’burg 2040
(CoJ) Transit (BRT) system and Strategy, which was drafted in 2011.36 This sets up
maintain local roads and two broad principles which the city aims to address by 2040.
free highways. Some of these Furthermore, in accordance with the Spatial Planning
functions are done through and Land Use Management Act (SPLUMA) of 2013,
the subsidiary Johannesburg in 2016 the CoJ approved the Spatial Development
Roads Agency. Framework for Johannesburg 2040 (SDF), a city-wide
The central government’s They operate the metrorail spatial vision for the city, outlining a set of strategies
Passenger Rail Authority of network, connecting various that would lead to the realisation of that vision.37
South Africa (PRASA) parts of the city, and to other While SPLUMA requires a 5 and 10-20 year vision for
parts of the country. However, the Framework, the Joburg one has taken a 25-year
it is generally acknowledged schedule, in line with the Jo’burg 2040 Strategy.
that the traditional rail system
is run down. As required by the Municipal Systems Act of 2000, the
CoJ also drafted the Integrated Development Plan (IDP)
which is the key statutory development plan in the city.
Fig. 21. Transport governanceYou can also read