Fuel Cell Electric Buses - Potential for Sustainable Public Transport in Europe - A Study for the Fuel Cells and Hydrogen Joint Undertaking
←
→
Page content transcription
If your browser does not render page correctly, please read the page content below
Fuel Cell Electric Buses –
Potential for Sustainable
Public Transport in Europe
A Study for the Fuel Cells and Hydrogen Joint
Undertaking
Sponsor of the study           The Fuel Cells and Hydrogen Joint Undertaking
                               (FCH JU)

Author of the study            Roland Berger

Coalition of the study         83 stakeholders

Bus    operators         and   Aachener Straßenbahn und Energieversorgungs-AG
municipalities                 (ASEAG); Aberdeen City Council; Agence d'Études et
                               de Promotion de l'Isère (AEPI); Berliner
                               Verkehrsbetriebe (BVG); Birmingham City Council;
                               Bordeaux Métropole; CarPostal; Centre for Budapest
                               Transport (BKK); Communauté d'Agglomération du
                               Grand Dole; Communauté de l'Agglomération Havraise
                               (CODAH); DeLijn; Dundee City Council; FirstGroup;
                               Highland Council; Highlands and Islands Transport
                               Partnership (HITRANS); HOCHBAHN; Mainzer
                               Verkehrsgesellschaft (MVG); Keolis; Métropole Rouen
                               Normandie; Pärnu City Government; Perth & Kinross
                               Council; Provincie Zuid-Holland; Rotterdamse
                               Elektrische Tram (RET); Regionalverkehr Köln (RVK);
                               Regione Lazio; Riga City Council; Rigas Satiskme;
                               Riviera Trasporti; Ruter; Südtiroler Transportstrukturen
                               AG (STA); Stadtwerke Mainz; Stadtwerke Münster;
                               Stagecoach; Stuttgarter Straßenbahnen AG (SSB);
                               Syndicat Mixte des Transports en Commun (SMTC) du
                               Territoire de Belfort; Tayside and Central Scotland
                               Transport Partnership (Tactran); Tayside Public
                               Transport; Transport Partnership for Aberdeen City and
                               Shire (NESTRANS); Tees Valley Unlimited; Torres
                               Vedras Municipal Chamber; Transdev; Transport for
                               London (TfL); ViP Verkehrsbetrieb Potsdam;
                               Wuppertaler Stadtwerke (WSW) Mobil

      Bus OEMs           and   Ballard; EvoBus; evopro group; Hydrogenics; Intelligent
      technology               Energy; MAN; Proton Motor; Siemens; Škoda; Solaris;
      providers                Van Hool; VDL

      Infrastructure           Air Liquide; Air Products; CNG Net; H2 Logic;
      OEM and hydrogen         Hydrogenics; ITM Power; The Linde Group; McPhy;
      suppliers                Shell; Siemens

      Other                    Commissariat à l'Énergie Atomique et aux Énergies
      organisations            Alternatives (CEA); Element Energy; Energies Projects
                               Services; Hydrogène de France (HDF); Ministry of
                               Infrastructure and the Environment of The Netherlands;
                               Netzwerk Brennstoffzelle und Wasserstoff NRW; FIT
                               Consulting; HyCologne; HySOLUTIONS; Hessen
                               Agentur/Wasserstoff- und Brennstoffzellen-Initiative
                               Hessen; Institut für Innovative Technologien (IIT);
                               Nationale Organisation Wasserstoff- und
                               Brennstoffzellentechnologie (NOW); PersEE Consulting;
                               Transport & Travel Research Ltd; Überlandwerk Groß-
                               Gerau; Verband Deutscher Verkehrsunternehmen
                               (VDV); Verkehrsverbund Rhein-Ruhr (VRR)

2|                                   FCH JU – Commercialisation Strategy for Fuel Cell Electric Buses in Europe
Legal notice:
Roland Berger GmbH
Sederanger 1
80538 München

Contact: Heiko Ammermann: heiko.ammermann@rolandberger.com

Authors: Heiko Ammermann, Yvonne Ruf, Simon Lange, Dragos Fundulea, André Martin

Date of publication: September 2015

Front cover pictures provided by: Daimler (EvoBus), DeLijn, Hydrogenics, Ruter

A Study for the Fuel Cells and Hydrogen Joint Undertaking by Roland Berger         |3
Executive Summary
The European Union and pioneering cities are establishing the public transport
systems of the future
The European Union is pursuing an emissions reduction agenda as well as measures to
preserve local air quality and to reduce harmful noise levels in public transport. With its
Directives on Ambient Air Quality and Cleaner Air for Europe (2008) as well as on the Promotion
of Clean and Energy-Efficient Road Transport Vehicles (2009) the EU has set first regulatory
standards in this regard. Numerous European cities and regions have started initiating change in
their public transport systems, for example with the European Climate Change Statement 2015
or in the Clean Bus Declaration of the C40 Cities Initiative.
Seeking alternatives to diesel buses is crucial for realising the emissions reduction agenda
in public transport. Although some improvements in terms of reducing harmful environmental
effects have been made with the EURO VI standard, it is expected that there is a limit to the
"cleaning" of diesel buses. Hence, cities and bus operators are under pressure to shift to electric
zero emission powertrains such as tramways, trolley, battery and fuel cell electric buses (FC
buses). Diesel buses currently dominate the public transport market due to their high
productivity, low deployment costs, technological maturity, operational reliability and flexibility,
e.g. high daily ranges, fast refuelling and no infrastructure requirement along the routes. Many
cities and bus operators are struggling with the currently conflicting objectives of shifting to zero
emission public transport while keeping operational flexibility and maintaining budgets under
control.

Fuel cell electric buses are crucial for reducing emissions while meeting
operational requirements
The potential for greening urban mobility and associated benefits is enormous. FC buses
reduce the external environmental and health costs induced by public transport. With lower
noise levels, air quality improvement and vibration mitigation, cities can cut costs, increase
property values and benefit from a "green" and modern image. Promoting the technology also
contributes to reducing the dependency on fossil fuels and securing the high-tech industrial
base and jobs in Europe.
Environmental benefits extend well beyond zero local emissions. Hydrogen as a road fuel
yields significant potential for carbon neutrality on a well-to-wheel basis along the entire
hydrogen value chain, including production and means of delivery. Hydrogen can be produced
with electricity from 100% renewable energy sources. Hence, operating FC buses can be
achieved with zero CO2 emissions along the entire hydrogen value chain. By using hydrogen
produced from renewable energy sources only, one standard FC bus would save approximately
800 tonnes of CO2 in its lifetime of 12 years compared to a conventional diesel bus.

4|                          FCH JU – Commercialisation Strategy for Fuel Cell Electric Buses in Europe

FC buses offer the best productivity and operational flexibility compared to other zero
emission concepts. FC buses use power from a fuel cell stack and a battery and run on
hydrogen which can be stored and refuelled at bus depots. In terms of costs, it is expected that
FC buses compare similarly with other zero emission powertrains in the long run. However, they
are superior in terms of operational performance: With ranges of 300-450 kilometres, refuelling
times below 10 minutes and no infrastructure requirements on the routes, FC buses can be
operated like conventional diesel buses while offering all the above mentioned advantages of
electric vehicles. Hence, FC buses are the most flexible zero emission alternative.
FC buses have been operated on about 8 million kilometres in daily service in a number of
European cities over the last 10 years, demonstrating that the technology is flexible in operation
and safe. At the time of this writing, 84 FC buses are in service or about to start operations in
17 cities and regions in 8 European countries.

FC bus costs are expected to drop significantly and become increasingly
competitive
The purchase price of FC buses has come down considerably by about 75% since the
introduction of first prototypes in the 1990s. However, to enable a sustainable market-based
commercialisation all stakeholders need to push for better and cheaper FC buses, larger scale
projects as well as for an environment conducive to FC buses:
1.   All stakeholders need to engage to rapidly increase the total number of units on the
     roads. This is a precondition for reaching the scale effects as well as the associated
     technological maturity and cost reductions.
2.   The industry needs to work on further reducing FC bus as well as infrastructure and
     hydrogen costs significantly. Future FC bus costs will depend on the technology pathway
     followed. In a technology pathway that seizes synergies with the FC passenger car market
     overall FC bus deployment costs can reduce fairly quickly with a volume uptake of FC cars.
     In this case, costs could be on par with diesel buses within the next decade. Infrastructure
     OEMs and hydrogen providers need to take the necessary steps to realise acceptable
     costs.
3.   Bus operators need to be prepared to implement large-scale demonstration projects in
     the next years. In order to further mature the technology, gather operational experience
     with larger FC bus fleets and stimulate market development, European bus operators and
     public transport authorities need to actively engage. Several deployment projects with 20
     or more FC buses by location are expected to be realised in the framework of the FC bus
     coalition. Other interested bus operators and public transport authorities can benefit from
     participating in the coalition, e.g. by gaining useful information and tools and preparing for
     projects in cooperation with other committed locations.
4.   A supportive public framework is needed. In order to support pioneering bus operators in
     carrying the costs of early technology deployment, respective funding mechanisms are
     required on European and national levels. Furthermore, levelling the playing field for fuel

A Study for the Fuel Cells and Hydrogen Joint Undertaking by Roland Berger                     |5
costs can support FC bus rollout, as subsidies and tax exemptions currently favour the use
        of diesel fuel for some operators.

A broad coalition of stakeholders supports the commercialisation of FC buses
in Europe
The European FC bus coalition aims at kick-starting the market rollout. The FC bus coalition
has been established in order to identify the required number of FC buses to be deployed to
bridge the gap towards commercialisation by reaching scale effects and reducing current costs.
It has developed a common understanding of buyers and sellers of FC buses on the required
roll-out in the next years and actively works on realising this roll-out. The coalition currently plans
to implement large-scale demonstration projects with a total of approximately 300 to 400 FC
buses in Europe by 2020. Currently, 45 public transport authorities and bus operators
representing 35 cities and regions from 12 European countries are participating in the
commercialisation initiative. The results of the first phase of this initiative are presented in this
report. In the next phases of the initiative, the coalition will continue to foster commercialisation
of FC buses. The great commitment to FC buses has been documented in a joint Letter of
Understanding of public transport authorities and bus operators which has been handed over to
the EU Commissioner of Transport at the TEN-T Days in Riga on June 23, 2015.
The industry partners are firmly committed to the initiative. Five FC bus manufacturers
participating in the coalition have signed a Letter of Understanding underlining their commitment
to the commercialisation of the technology. Participating hydrogen infrastructure OEMs and
suppliers are currently working on solutions for large-capacity infrastructure for up to 200 buses
to cater for large bus depots. In addition, the Fuel Cells and Hydrogen Joint Undertaking (FCH
JU) supports the initiative for commercialising FC buses in urban transport. It is a public-private
partnership of the European Commission, industry partners and research institutions. It
envisages putting a European funding scheme in place which will need to be supplemented by
national or local programs and funds.
Interested European cities and regions are invited to join the initiative at any time. The
coalition encourages interested bus operators and public transport authorities to engage in the
commercialisation initiative and to bring forward the change to zero emission public transport in
their cities. Becoming a partner is possible at any time.
This report provides an outlook for jointly achieving a commercialisation pathway. Building
on the findings of the 2012 FCH JU technology study on alternative powertrains for urban
buses1, this report provides an assessment of the commercialisation pathway from an
operational perspective. It reflects the actual situation in which operators deploy large scale
demonstration projects in the next years from a rather conservative angle and argues why it
makes sense to deploy FC buses now. The insights are based on first-hand data and
assessments of the coalition members from the hydrogen and fuel cell industry as well as local
governments and public transport operators in Europe.

1
    Available at http://www.fch.europa.eu.

6|                                FCH JU – Commercialisation Strategy for Fuel Cell Electric Buses in Europe
Table of Contents

Executive Summary ........................................................................................................................ 4
Table of Contents ........................................................................................................................... 7
Table of Figures .............................................................................................................................. 8
Acronyms ..................................................................................................................................... 10
The Potential of Fuel Cell Electric Buses ...................................................................................... 11

A.      Introduction – The importance of FC buses for the future of public transport ............. 11

B.      Fuel cell electric buses and their projected costs .......................................................... 17
1.      Future FC bus cost developments in the heavy-duty technology pathway .......................... 18
2.      Future FC bus cost developments in the automotive technology pathway.......................... 25

C.      Benefits of investing in FC buses now.............................................................................. 29
1.      Politically – There is a push for reducing emissions in public transport in Europe .............. 29
2.      Environmentally – FC buses are electric buses which significantly reduce emissions ......... 32
3.      Economically – FC buses reduce external costs of public transport .................................... 36
4.      Operationally – FC buses are the most flexible zero emission option ................................. 38

D.      FC bus coalition and expected deployment of FC buses ................................................. 42

E.      Next steps and how to get involved in the FC bus coalition ........................................... 49
Annex ........................................................................................................................................... 52
Annex 1 – Letter of Understanding of Public Transport Operators and Public Authorities ............ 53
Annex 2 – Letter of Understanding of bus OEMs.......................................................................... 58
Annex 3 – Cost analysis principles, methodology and assumptions............................................ 61
Annex 4 – Detailed cost results infrastructure and hydrogen ....................................................... 70
Annex 5 – Sensitivity analysis ...................................................................................................... 73

A Study for the Fuel Cells and Hydrogen Joint Undertaking by Roland Berger                                                                    |7
Table of Figures

Figure 1: Trends supporting emissions reduction in public transport ............................................. 12
Figure 2: Schematic view of a polymer electrolyte membrane fuel cell (PEMFC) ........................... 13
Figure 3: Hydrogen value chain and FC bus layout (simplified representation) ............................. 14
Figure 4: Current FC buses in Europe and numbers of buses deployed ......................................... 15
Figure 5: FCH JU commercialisation vision ..................................................................................... 16
Figure 6: FC bus purchasing cost development since the 1990s [%] ............................................ 18
Figure 7: Purchase price development of standard FC buses according to different
scenarios in the heavy-duty pathway [EUR '000] ........................................................................... 20
Figure 8: TCO development of FC buses compared to conventional diesel buses in
the heavy-duty pathway [EUR/km] ................................................................................................. 21
Figure 9: TCO split by components for standard FC buses according to different
scenarios in the heavy-duty pathway [EUR/km] ............................................................................. 22
Figure 10: TCO comparison of standard FC and conventional diesel bus in the heavy-
duty pathway [EUR/km] ................................................................................................................. 23
Figure 11: TCO for standard FC and diesel buses according to different scenarios in
the heavy-duty pathway [EUR/km] ................................................................................................. 23
Figure 12: Purchase price [EUR '000] and TCO [EUR/km] development for standard
FC buses in the automotive pathway .............................................................................................. 27
Figure 13: TCO comparison of standard FC and diesel bus in the automotive pathway
[EUR/km] ........................................................................................................................................ 27
Figure 14: Comparison of standard bus purchasing prices ['000 EUR] and TCO
[EUR/km] for different powertrain options and technology pathways ............................................ 28
Figure 15: Summary of public perception of environmental challenges in public
transport ......................................................................................................................................... 30
Figure 16: Examples for emissions reduction targets in Europe ..................................................... 31
Figure 17: Comparison of local and noise levels of diesel and FC buses ...................................... 32
Figure 18: Carbon neutral hydrogen value chain ............................................................................ 33
Figure 19: WTW CO2 emissions of diesel and hydrogen in 2015 [kg/100 km] ............................. 34
Figure 20: Annual external costs of buses in the EU that can be alleviated by
deployment of FC buses [EUR bn] .................................................................................................. 36
Figure 21: High-level comparison of operational performance of different zero
emission bus concepts ................................................................................................................... 38
Figure 22: Summary of operational advantages of fuel cell buses ................................................. 39
Figure 23: Former and ongoing FC bus demonstration projects ..................................................... 40

8|                                       FCH JU – Commercialisation Strategy for Fuel Cell Electric Buses in Europe
Figure 24: FC bus technology development and major cities supporting its
deployment ..................................................................................................................................... 41
Figure 25: Set-up of the FC bus coalition for commercialisation of FC buses ................................ 42
Figure 26: Participating locations by country (as of May 2015) .................................................... 43
Figure 27: Signees and public presentation of Letters of Understanding prepared in
the framework of the initiative ........................................................................................................ 44
Figure 28: Participating industry stakeholders ................................................................................ 44
Figure 29: Ramp-up scenario for FC buses in Europe .................................................................... 48
Figure 30: Regional clusters of the FC bus coalition and next steps in the initiative ...................... 50
Figure 31: Overview on benefits of participation in the initiative .................................................... 51
Figure 32: FC bus market development scenarios .......................................................................... 62
Figure 33: Synergies with adjacent industries ................................................................................ 63
Figure 34: Assumptions applied for FC buses in the automotive pathway ..................................... 63
Figure 35: Costs considered in calculation ..................................................................................... 64
Figure 36: FC bus characteristics .................................................................................................... 65
Figure 37: Bus availability and mileage assumptions considered for the heavy-duty
pathway .......................................................................................................................................... 66
Figure 38: Summary of main assumptions for all scenarios ........................................................... 66
Figure 39: Summary of assumptions for comparison of FC and diesel standard bus .................... 67
Figure 40: Capacity thresholds of infrastructure solutions considered in the cost
analysis ........................................................................................................................................... 67
Figure 41: Characteristics of refuelling infrastructure ..................................................................... 68
Figure 42: Feedstock prices for sensitivity analysis ........................................................................ 69
Figure 43: Infrastructure and hydrogen costs off-site production with SMR, station for
20 FC buses .................................................................................................................................... 70
Figure 44: Infrastructure and hydrogen cost, on-site with electrolysis, station for 20
FC buses ......................................................................................................................................... 71
Figure 45: Cost analysis of fleet operation with hydrogen from 100% RES electricity ................... 71
Figure 46: TCO in sensitivity analysis of feedstock prices for the heavy-duty pathway
– Hydrogen from natural gas SMR .................................................................................................. 73
Figure 47: TCO in sensitivity analysis of financing costs for the heavy-duty pathway
[EUR/km] ........................................................................................................................................ 74
Figure 48: TCO in sensitivity analysis of bus lifetime for the heavy-duty pathway
[EUR/km] ........................................................................................................................................ 74

A Study for the Fuel Cells and Hydrogen Joint Undertaking by Roland Berger                                                                     |9
Acronyms

CCS      Carbon Capture and Storage
CNG      Compressed Natural Gas
EU       European Union
EUR      Euro
FC bus   Fuel Cell Electric Bus
FCH JU   Fuel Cells and Hydrogen Joint Undertaking
GBP      British Pound
GHG      Greenhouse Gas
HRS      Hydrogen Refuelling Station
OEM      Original Equipment Manufacturer
PEMFC    Polymer Electrolyte Membrane Fuel Cell
RES      Renewable Energy Source
SMR      Steam Methane Reforming
TCO      Total Cost of Ownership
UK       United Kingdom
UN       United Nations
VAT      Value-Added Tax
WACC     Weighted Average Cost of Capital
WTW      Well-to-Wheel

10 |                        FCH JU – Commercialisation Strategy for Fuel Cell Electric Buses in Europe
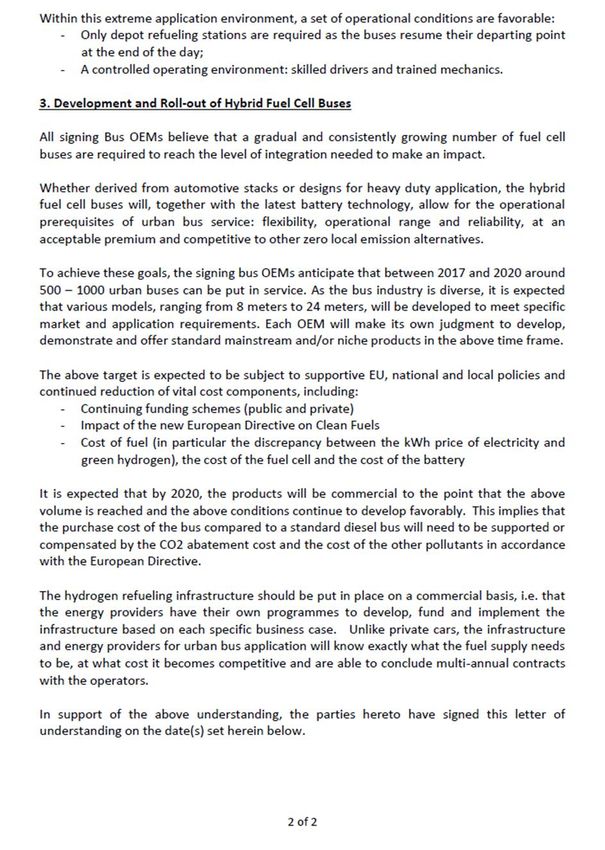
The Potential of Fuel Cell
Electric Buses
A. Introduction – The importance of FC buses for the future
   of public transport
There is a regulatory push for reducing emissions in public transport in Europe
The European Union has set itself ambitious targets for reducing emissions in the years
ahead. For 2050, EU leaders have defined the goal of reducing Europe's greenhouse gas (GHG)
emissions by 80% compared to 1990 levels; by 2030, a reduction of at least 40% of domestic
GHG emissions shall be reached2. In order to meet these overall climate targets, the European
Commission stipulated in its 2011 White Paper that GHG emissions from transport will have to
be cut by at least 60% by 2050 compared to 19903. Emissions reduction and energy
sustainability are also key pillars of the European Energy Union that the European Council
decided to create in 2014. At the same time, improvement of local air quality and reduction of
noise pollution are important goals for the EU and its member states, as for example stated in
the Directive on Ambient Air Quality and Cleaner Air for Europe (2008). With the introduction of
the EURO VI standard for buses, significant improvements for reducing local emissions have
been reached; however, such emissions are still not completely avoided. Therefore, stricter
regulations are expected to be introduced on European, national and local levels that require
further emissions reductions or penalise the cause of CO2 and local emissions.
European countries are rethinking public transportation. Promoted by trends such as
urbanisation, a shift in societal values towards more sustainability and the need to increase
energy security as well as a more holistic perspective on costs, reducing emissions in public
transport is placed firmly on the agenda of national and local governments in Europe. Some
countries, e.g. the Netherlands, have already adopted national targets for reducing public
transport emissions. Numerous European cities and regions have committed to initiate change
in their public transport systems, for example with the European Climate Change Statement
2015 or in the Clean Bus Declaration of the C40 Cities Initiative.

2
  European Council Conclusions on the 2030 Climate and Energy Policy Framework (23 and 24 October 2014).
3
  Roadmap to a Single European Transport Area – Towards a competitive and resource efficient transport system
(2011).

A Study for the Fuel Cells and Hydrogen Joint Undertaking by Roland Berger                                 | 11
Energy security
                                         and independence is one of the
 Political commitments                   EU's major objectives driving        Shift in public awareness and
 and regulation                          change to renewable energy           values
 set mandatory targets for               sources                              call for innovative public mobility
 reducing emissions in                                                        concepts with low noise, local
 public transportation                                                        and GHG emissions

                                              Emission reduction in
                                                public transport

                                                                              Increasing urbanisation
 Technological innovations                Holistic consideration of           leads to higher traffic density
 offer new opportunities for              external costs                      and severely challenges the
 sustainable solutions that work          facilitates acceptance of a         quality of living in urban
 in practice                              limited cost premium during the     areas
                                          introduction of new
                                          technologies
                                                                      €
Figure 1: Trends supporting emissions reduction in public transport

To reach carbon-neutrality and zero local emissions, deployment of electric powertrains is
required. Seeking alternatives to diesel buses is crucial for realising the emissions reduction
agenda as they are hazardous to the environment: A EURO VI diesel bus emits approximately
120 kg of CO2 per 100 km. They cause local air and noise pollution as well as vibrations that
are harmful to health and impact the quality of living in our cities. Whereas significant
improvements have been reached with the introduction of the EURO VI standard, further
emissions reduction potential is limited. This poses challenges to cities and bus operators in
Europe as performance characteristics of diesel buses today are still difficult to match with zero
emission powertrains: They feature high productivity, low deployment costs, high technological
maturity as well as operational reliability and flexibility. Many cities and bus operators therefore
struggle with shifting to zero emission powertrains while preserving operational flexibility and
maintaining budgets under control. The objective of this report is to provide an assessment of
the commercialisation pathway for FC buses required to meet the aforementioned challenges.

FC buses are zero emission electric buses with a battery and a fuel cell
FC buses are built on a conventional chassis and contain a fuel cell system and an electric
battery which form the heart of the powertrain. Fuelled by hydrogen, they emit only water
vapour. A fuel cell system typically consists of auxiliary components (humidifier, pumps, valves,
etc. grouped together as balance of plant) and a fuel cell stack which is made up of bipolar
plates and membrane electrode assemblies. Hydrogen buses are electric buses that feature a
longer lifetime and lower maintenance costs than diesel buses in the long run as abrasion is
expected to be lower. Different technical solutions exist for the main architecture of the FC bus
powertrain. It can comprise fuel cell stacks as direct energy source for propulsion in combination
with super-capacitors and different sizes of batteries as energy storage. Some FC bus models
use a larger battery and a smaller fuel cell stack which are normally referred to as "range

12 |                               FCH JU – Commercialisation Strategy for Fuel Cell Electric Buses in Europe
extenders"; the analysis presented in this report focused on fuel-cell dominant powertrains only.
The specific technical solutions used will largely determine the future cost development. Below
we depict cost projections for two technological pathways; however, other approaches might
emerge in the future as well.
The fuel cell converts chemical energy of hydrogen into electrical energy. The general
operating principle is as follows: Hydrogen is fed into the fuel cell anode where it is split into
protons (H+) and electrons (e-) by means of a catalyst. The membrane lets only protons (H+)
pass; the electrons (e-) are forced to follow an external circuit, creating a flow of electricity.
Oxygen from ambient air is fed into the fuel cell at the cathode. Oxygen, electrons from the
external circuit and protons combine to form water and heat. To achieve sufficient electrical
power to propel a vehicle, multiple cells have to be compiled into a fuel cell stack. The leading
fuel cell type for automotive applications is the polymer electrolyte membrane fuel cell (PEMFC).
Hydrogen in Electron flow Electrical energy Oxygen in 1 Hydrogen is fed to the anode of the fuel cell
1 e– e– 5
2 Hydrogen is distributed to the gas diffusion layer with
the catalyst
e– e– 3 Hydrogen comes into contact with the catalyst where
4
the hydrogen is split into protons and electrons
e–
2 e– 3 e– 6
Only the protons pass through the membrane; the
e– 4
H+ H+ –O– electrons are retained and forced to follow an
e– H+ H+ external circuit, creating a flow of electricity
2H2 –O– O2
Oxidation: 2H2 ➨ 4H+ + 4e– Reduction: O2 + 4H+ + 4e– ➨ 2H2O 5 Oxygen is fed to the cathode of the fuel cell
6 At the cathode side, oxygen from the air, electrons
Excess Heat &
from the external circuit and protons combine to form
hydrogen out water out
water and heat
Bi-polar Gas diffusion layer Polymer Gas diffusion layer Bi-polar
plate (BPP) (GDL) with electrolyte (GDL) with plate (BPP) ➨ Net reaction: 2H2 + O2 ➨ 2H2O
(Anode) catalyst layer membrane (PEM)1) catalyst layer (Cathode)
Membrane electrode assembly (MEA)
1) Also: proton exchange membrane
Figure 2: Schematic view of a polymer electrolyte membrane fuel cell (PEMFC)
Hydrogen can be produced from various sources with steam methane reforming and water
electrolysis being investigated in this study: Steam methane reforming is based on gas as
feedstock (e.g. natural gas, methane gas, biogas, etc.) while water electrolysis uses electricity as
feedstock. Hydrogen can be trucked in by suppliers or produced on site with electrolysers at bus
depots. Aboard the buses, hydrogen is normally stored in tanks on the roof. Hydrogen refuelling
and storage infrastructure for the whole fleet is typically situated at bus depots. Further
information on hydrogen production can be found in Chapter C.
A Study for the Fuel Cells and Hydrogen Joint Undertaking by Roland Berger | 13Energy source H2 production Transport Storage/fueling FC bus layout
CO2 Offsite production Hydrogen storage tank
(gaseous or liquid)
Steam
reforming Road train
High pressure/ storage
H2 system (tank)
Fossil
H2 Balance of plant and
fuels
periphery
"brown" H2 (or pipeline, rail,
maritime) Fuel cell module
Electric storage/battery
Electrolysis Onsite production at E-motor and inverter
bus depot Fuel
pump
H2 Mechanical drive line
RES
Electricity "green" H2
Figure 3: Hydrogen value chain and FC bus layout (simplified representation)
Different technology pathways for bus powertrain development design exist
Firstly, in the "heavy-duty" pathway, the technical concept of the FC bus builds on
dedicated fuel cell systems, which are specifically developed and manufactured for use in
heavy-duty vehicles such as urban buses. This pathway is well-established and currently being
applied in FC bus models in operation in major demonstration projects in Europe and elsewhere.
It has proven as a viable technical option that works today and in the future.
Secondly, in the "automotive" pathway, it is envisaged to integrate the same type of fuel
cells, systems and batteries of passenger cars for FC buses, thus achieving synergies and
seizing economies of scale provided by potential FC automotive volumes. First FC bus models
designed according to this pathway have recently been put in test service in Asia. Similar
developments are being carried out in Europe and some buses are already in operation. The
economic viability of this technological pathway strongly depends on the future achievement of
automotive production volumes (~10,000 stacks/year) and utilisation of technical synergies. In
order to be able to benefit from this technological pathway, the FC systems and other
components used need to be available to all bus OEMs in the market.
FC buses are crucial for reducing emissions and improving local air quality
FC buses are the most flexible zero emission alternative as they can be operated like
conventional diesel buses with ranges of 300-450 kilometres per tankful while offering the
advantages of every electric vehicle: zero exhaust emissions, reduced noise (see below) and
vibration levels and, therefore, higher passenger comfort.
Across Europe, cities demonstrate that the technology works in practice. Several completed
and ongoing projects such as the Clean Urban Transport for Europe (CUTE), HyFleet: CUTE, Clean
Hydrogen In European Cities (CHIC), High V.LO-City, HyTransit and 3Emotion projects support
the development of the technology. Participating operators deploy FC buses in daily service on
normal routes and demonstrate that FC buses can be integrated into existing transport networks,
that they are safe and deemed more comfortable by bus drivers, passengers and the public.
Currently, 84 FC buses are in service in Europe or about to start operation.
14 | FCH JU – Commercialisation Strategy for Fuel Cell Electric Buses in EuropeCurrent EU-funded fuel cell bus Current EU-funded fuel cell bus
projects projects
CHIC 3Emotion (operation start planned
Bolzano – 5 FC buses for 2016/2017)
Cherbourg – 5 FC buses
Aargau – 5 FC buses
Rotterdam – 4 FC buses
London – 8 FC buses South Holland – 2 FC buses
Milan – 3 FC buses London – 2 FC buses
Oslo – 5 FC buses Flanders – 3 FC buses
Cologne* – 4 FC buses Rome – 5 FC buses
Hamburg* – 6 FC buses Current national/regional-
funded FC bus projects:
High V.LO-City (operation start Karlsruhe * – 2 FC buses
planned for 2015) Stuttgart * – 4 FC buses
Liguria – 5 FC buses Arnhem * – 1 FC bus (operation
Antwerp – 5 FC buses start planned for Oct. 2015)
Aberdeen – 4 FC buses Legend:
CHIC countries
HyTransit In operation
Aberdeen – 6 FC buses Planned for operation
* Co-financed by regional/national funding
sources
Source: CHIC project – Element Energy
Figure 4: Current FC buses in Europe and numbers of buses deployed
A broad stakeholder coalition promotes the commercialisation of FC buses
A European coalition of supply and demand side stakeholders aims to kick-start the
market. Its overall objective is to roll out a total number of 300 to 400 FC buses in Europe by
2020 in order to achieve scale effects that are expected to bring down costs and deployment
costs for operators. The initiative assesses the costs for bus operators and cities in its first phase
and actively engages operators in preparing for the rollout of FC buses. Currently, 84 FC bus
stakeholders such as bus operators, local governments, bus manufacturers, fuel cell technology
providers, hydrogen infrastructure manufacturers and suppliers as well as associations and other
market players are members of the FC bus coalition. At the end of the first phase of the initiative
in June 2015, 45 bus operators and public transport authorities from 35 European cities and
regions from 12 European countries are participating in the coalition and further locations have
signalled interest to join. Joining the coalition is possible at any time for new participants.
The coalition is supported by the Fuel Cells and Hydrogen Joint Undertaking (FCH JU), a
public-private partnership of the European Commission, industry partners and research
institutions. It is supporting various FC bus demonstration projects across Europe, proving the
applicability of vehicles in different climatic and geographical conditions and preparing for
market rollout.
A Study for the Fuel Cells and Hydrogen Joint Undertaking by Roland Berger | 15Current study VISION –
FC electric buses commercially viable
and rolled out in Europe
H2 H2
Summary City Bus OEM H2 Suppl. H2 Infra
➔ Mobilisation of ➔ Regional cluster/
➔ Execution of FC
interested consortia
bus demo
locations
projects Scale effects
➔ Joint
➔ Cost analyses procurement Incentives
Regulation
➔ Formation of ➔ Grant application ➔ Local, national
regional clusters for demo project and EU funding
schemes for
demos
➔ Engineering of ➔ EU roadmap/ ➔ Regulations
H2 refueling discussion on framework to
infrastructure regulation support rollout
2014-2015 2016 2017-2020 2020 onwards
Figure 5: FCH JU commercialisation vision
This report provides an outlook for jointly achieving a commercialisation
pathway
The report is structured in four sections: Section B presents a brief overview of future cost
projections. Section C outlines the benefits of investing in FC buses on the basis of four key
arguments. Section D provides an overview about the current FC bus coalition and outlines the
expected future interest in FC buses in Europe. Section E explains how to get involved in the
initiative.
16 | FCH JU – Commercialisation Strategy for Fuel Cell Electric Buses in EuropeB. Fuel cell electric buses and their projected costs
KEY MESSAGES
• Future FC bus costs are expected to decrease significantly, provided the required
production volumes can be achieved
• A conducive regulatory framework for fuel taxation would aid FC bus
commercialisation
• Operating costs can be reduced further depending on local conditions
Future FC bus costs are expected to decrease significantly
In 2012 the FCH JU published a detailed cost-based comparison of alternative powertrains
for urban buses (Urban buses: Alternative powertrains for Europe)4. The current initiative focuses
on promoting FC buses and provides an updated cost projection for the coming years. It also
aims at supporting operators in assessing their location-specific costs and preparing for FC bus
rollout. The cost analysis is based on proprietary industry data. Further information on the
methodology and assumptions as well as on detailed results can be found in Annex 3 of this
report.
The following sections present an overview of expected cost developments for both different
technology pathways. As the main cost drivers of FC buses are powertrain components and the
system integration, different pathways can have a high impact on FC bus purchasing prices and
thereby also on the total costs of FC bus operation.
4
Available at http://www.fch.europa.eu.
A Study for the Fuel Cells and Hydrogen Joint Undertaking by Roland Berger | 171. Future FC bus cost developments in the heavy-duty technology
pathway
The heavy-duty technology pathway is well-established in the market and has achieved
significant price reductions since first deployments of FC buses in Europe. FC buses currently
in operation in Europe are based on FC bus models designed according to the heavy-duty
technology pathway. Since first deployments in the 1990s, purchasing costs for these FC buses
have fallen significantly by more than 75%.
-76%
1990’s 2002 2008 2013 2015
Figure 6: FC bus purchasing cost development since the 1990s [%]
Extensive operational experience has been gathered in Europe since their introduction in the last
15 years while establishing FC buses of this technology type (also compare Chapter C.3).
Significant achievements have been made regarding the technological maturity development of
these FC bus models and the availability levels reached. While final steps of the technology
development are currently being taken, this technology pathway has proven a viable option for
future market development. Through 2020, it is expected that the larger number of FC buses in
Europe will be designed according to this technological pathway.
Overall costs for these buses are expected to decrease down to a cost premium of about 11-
18% compared to conventional diesel buses on a per kilometre basis in the year 2030. The cost
premium is driven by the costs associated with the introduction of a new technology, mainly
reflected in a higher FC bus purchase price and thus, higher financing costs. In the first years of
deployment, infrastructure costs for the hydrogen refuelling system, bus maintenance costs and
hydrogen costs add to the premium until 2020. From 2020, bus maintenance costs are
expected to converge to diesel bus levels and hydrogen fuel costs are assumed to be even lower
than diesel costs on a per kilometre basis. Hence, in the medium term reducing the purchase
price of FC buses as well as providing affordable infrastructure solutions for large FC bus fleets
and cost-efficient hydrogen prices is crucial to bringing costs down. These assumptions suppose
that current tax regimes for diesel remain and that no new taxation for hydrogen is being
introduced.
Future costs strongly depend on the size of the market for FC buses. Hence, two scenarios
were developed in order to account for potential variations of the future market size as well as
the speed at which fuel cell costs will decrease. The "niche scenario" and the "production-at-
scale scenario" portray the variance of potential costs depending on efficiencies and economies
18 | FCH JU – Commercialisation Strategy for Fuel Cell Electric Buses in Europeof scale achieved with varying market sizes and the related overall technological progress in the
framework of the heavy-duty technology pathway. The scenarios reflect the effect that different
economies of scale have on cost-down curves and prices. For the niche scenario to materialise,
a cumulative number of 1,200-1,800 FC buses needs to be deployed on Europe's roads in total
until 2025. For the production-at-scale scenario, a total cumulative volume of 8,000-10,000 FC
buses is required until 2025. The latter represents about 7-9% of the expected total cumulative
urban bus purchases in Europe in the period 2015-20255 (see Annex 3). The costs displayed in
the following are applicable to the specified year only. They do not depict the average costs over
the entire lifetime of an FC bus.
The purchase price of FC buses is expected to significantly decrease to approximately EUR
400,000-450,000 for a standard FC bus and approximately EUR 580,000-630,000 for an
articulated FC bus in the year 2030 in the scale scenario of the heavy-duty technology pathway.
This constitutes an additional purchase price decrease of 40-45% until 2030 compared to
today's prices. A purchase price premium to the diesel bus is expected to remain also in the
long term. Higher purchasing prices are also driven by high warranties that currently need to be
provided by bus OEMs for FC bus systems (up to 5-10 years as compared to 2 years for diesel
buses). With increasing maturity of the technology, these costs will be reduced.
Similar cost reductions are expected for bus maintenance as well as infrastructure
investment and operations cost. Bus maintenance costs are expected to reach the same level
as for diesel buses after 2020. Depending on which type of infrastructure is being installed, cost
reductions of about 24% can be expected for hydrogen refuelling stations (HRS) with off-site H2
production and of about 39% for HRS with on-site H2 production by electrolysis. HRS
maintenance and operating costs are expected to drop by about 35-40%6.
5
Estimation of total annual sales of urban standard and articulated buses based on FCH JU Study: Urban buses:
Alternative powertrains for Europe (2012).
6
Figures given for HRS with a refuelling capacity to cater for 20 FC buses.
A Study for the Fuel Cells and Hydrogen Joint Undertaking by Roland Berger | 19Compared to the prior study, the price of a 12 m bus is expected to
be lower in niche scenario and slightly higher in production-at-scale
Niche scenario Production-at-scale scenario
700-730
700 700
620-650
570-600
600 600
520-550
490-520 480-510
500 500 420-450
400-450
400 400
331 329 332 339
317 299 299 300
300 300
232 233 238 244 232 233 238 244
200 200
2015 2020 2025 2030 2015 2020 2025 2030
Average purchase price of the least costly bus models Diesel Hybrid Conventional Diesel
Figure 7: Purchase price development of standard FC buses according to different scenarios in the heavy-
duty pathway [EUR '000] 19
Total Cost of Ownership (TCO) is expected to come down to EUR 3.3 per kilometre in 2030
from EUR 3.8 in 2015 for a standard bus7. TCO includes all overall costs of purchase and
operation and take into account the costs of diesel replacement buses during downtimes of FC
buses in the early years of deployments8. While most studies tend to disregard downtime costs
for newly introduced bus technologies, this study explicitly includes this type of costs in its
calculations to provide a more realistic assessment. Although costs are expected to come down
by 5-7% by 2030 from 2015 levels, a cost premium compared to diesel buses of 11-18% is
expected to remain in the year 2030. The lower overall cost decrease of 5-7% for FC buses
between 2015 and 2030 despite significantly higher reductions for FC technology related cost
components (bus purchasing and maintenance costs, infrastructure investment and operations
costs) is mainly driven by two factors: A labour cost increase of 2% annually as well as an
increase in feedstock prices for electricity and natural gas which causes higher hydrogen
production costs. Due to an assumed 3% annual increase in diesel fuel costs until 2030, as
well as the same assumed increase in labour costs, TCO of diesel buses even increase by about
30% in the same timeframe.
7
The term " standard bus" in the framework of this study includes both 12 m standard as well as 13.5 m buses
which have a double rear-axis and higher passenger capacity.
8
Total Cost of Ownership, as defined here, consist of total bus deployment costs plus costs for operating diesel
replacement buses during downtimes of FC buses in order to deliver full daily service and to achieve the total
annual bus mileage envisaged. In practice, downtime costs due to problems with a newly introduced technology
need to be considered by operators. Hence, this TCO approach provides a more realistic perspective on the costs of
FC bus deployment across the entire fleet (also see Annex 3).
20 | FCH JU – Commercialisation Strategy for Fuel Cell Electric Buses in EuropeTCO development – Standard bus [EUR/ km] TCO development – Articulated bus [EUR/ km]
-15%
-14% -18% -18%
-18%
-16% 5.3 -11%
4.3 -10% 4.7 4.6 4.4 4.3
3.9 3.9 3.7 4.1 4.0
3.7 3.9
3.4 3.2 3.3 3.5
3.0 3.3
2.8 3.0
2.5 2.8
2.3
2015 2020 2025 2030 2015 2020 2025 2030
FC Bus Niche scenario FC Bus Production-at-scale scenario Conventional diesel bus
Figure 8: TCO development of FC buses compared to conventional diesel buses in the heavy-duty
pathway [EUR/km]
Depreciation and financing costs constitute the largest share of FC bus-specific TCO,
highlighting the effect of the purchase price of FC buses and infrastructure costs which drive the
price gap between FC and diesel buses. Since labour costs are equally applicable to the diesel
bus, they do not drive the price gap (see Figure 9: TCO split by components for standard FC
buses according to different scenarios in the heavy-duty pathway [EUR/km]). Nevertheless, they
constitute the largest part of real deployment costs for operators. For financing costs, a
Weighted Average Cost of Capital (WACC) of 7% is considered.9
A higher purchasing price will remain the largest difference between FC bus and diesel bus
costs in overall TCO, as evidenced by higher depreciation and financing cost vis-à-vis the
standard diesel bus.
Maintenance costs are expected to even out after 2020 and are already close to diesel bus
maintenance costs today. Overall, the FC bus price difference is mostly offset by an assumed
3% annual increase in diesel fuel costs until 2030. In the base case for cost comparisons to
diesel buses, a diesel price of EUR 1 in 2015 is assumed.10
9
Labour costs in the scale scenario are slightly higher than in the niche scenario as a higher availability and higher
number of kilometres driven are assumed for the FC bus (see Annex 3).
10
Please note that the diesel comparison is based on EURO VI models.
A Study for the Fuel Cells and Hydrogen Joint Undertaking by Roland Berger | 21TCO niche scenario TCO production-at-scale scenario
4.34
3.90 3.87
Financing costs 0.63
3.74 3.65
0.51 0.52 3.42 3.32
0.45 0.41 3.25
0.40 0.33
Labour costs for 0.35
1.45
bus operation1) 1.39
1.50
1.59 1.66 1.44
Infrastructure costs 0.25 1.50 1.65
0.16
Fuel costs 0.42 0.23
0.41
0.23 0.15
0.41 0.21 0.14
Bus maintenance 0.55 0.40 0.40 0.49 0.40 0.14
0.45 0.39 0.39
0.36 0.34 0.38
0.30 0.28
Bus depreciation 1.03
0.80 0.90
0.70 0.62 0.66 0.57 0.53
2015 2020 2025 2030 2015 2020 2025 2030
Figure 9: TCO split by components for standard FC buses according to different scenarios in the heavy-
duty pathway [EUR/km]
Cost-efficient hydrogen prices as presented in this study are required to achieve competitive
operational costs for FC buses compared to diesel buses. For TCO calculations shown in this
study, hydrogen produced from steam methane reforming (SMR) with a price per kg of EUR 4.9
in 2015 (EUR 5.1 in 2020) has been considered as being the least costly option at the
moment. Costs for hydrogen produced by electrolysis are assumed to be slightly higher (EUR 5.9
in 2015, EUR 6.2 in 202011; also see Annex 4). In such a scenario, fuel costs for FC buses are
lower than for diesel buses if no additional taxes or levies on hydrogen are being introduced in
the future. This shows that regulatory and support frameworks greatly influence costs and have
an impact on commercialisation. This is reflected in the current political discussions on EU level
which debate penalising the use of fossil fuels in the future.
If operators were to pay current average diesel consumer prices, FC buses could be cost-
competitive in 2030 also in the heavy-duty pathway. Assuming a diesel price of EUR 1.35 per
litre in 2015 (current average consumer price in the Eurozone without subsidies and including
all taxes12) suggests that the projected price gap of the heavy-duty pathway of 11% in 2030
could be already reached in 2025 and that the gap in 2030 could be decreased further to
approximately 5%.
11
Industry indication based on assumption that at least 20 FC buses are refuelled daily.
12
Average diesel price across all EU countries including taxes since 2009. Source: Weekly Oil Bulletin of the
European Commission.
22 | FCH JU – Commercialisation Strategy for Fuel Cell Electric Buses in Europe-39% -35%
-30% -26%
3.8
3.6 -16% -10% -11% -5%
Downtime costs 0.5
0.4 3.3 3.3
Financing costs 0.5 0.2 0.2 3.2
0.5 2.9 3.0 0.2
2.7 0.3 2.8 0.2 0.3
0.2
2.5 2.5 0.1 0.2
Labour costs for 2.3 0.1
1.0 0.1
bus operation 0.1 1.1
1.4 1.7
1.5 1.5 1.7
Infrastructure costs 0.2 1.4 1.5
1.2 1.4
0.3 1.2 0.2
Fuel costs
0.4 0.1 0.0 0.0
Bus maintenance 0.4 0.0 0.0 0.1 0.0
0.0 0.4 0.0
0.0 0.4 0.7 0.4 0.8
0.4 0.5 0.4 0.6 0.5 0.6
0.3 0.3
Bus depreciation 0.9 0.3 0.3 0.7 0.3 0.3 0.3 0.3 0.3 0.3
0.6 0.5
0.3 0.3 0.3 0.3 0.3 0.3 0.3 0.3
FC Bus Diesel Diesel FC Bus Diesel Diesel FC Bus Diesel Diesel FC Bus Diesel Diesel
1 EUR 1.35 EUR 1 EUR 1.35 EUR 1 EUR 1.35 EUR 1 EUR 1.35 EUR
2015 2020 2025 2030
Figure 10: TCO comparison of standard FC and conventional diesel bus in the heavy-duty pathway
[EUR/km]
In the face of current market developments, coalition members consider the niche scenario
of the heavy-duty pathway to be most realistic until 2020. Hence, the figure below depicts the
cost projections of the niche scenario until 2020 with the base case assumptions for feedstock
prices, labour and financing costs as well as bus lifetime (see Annex 3). Deploying a higher
number of buses in the initial years is a key condition for reaching the scale scenario of the
heavy-duty pathway after 2020. If production-at-scale quantities cannot be reached in the initial
years, it may be harder for the efficiencies and advances in technology to be reached that are
assumed in the production-at-scale scenario in later years for this technology pathway.
4.0 3.84
3.65 3.61 FC Niche – Base case
3.66
FC bus
Niche – Base case
3.5 3.35 18%
3.26 FC Scale – Base case
11%
2.99
3.0 Diesel – Base case
FC Scale – Best case 2.65
1%
Diesel – Base case
2.5 2.63
2.34 Diesel – Best case
Diesel – Best case
2.06
0.0
2015 2020 2025 2030
Figure 11: TCO for standard FC and diesel buses according to different scenarios in the heavy-duty
pathway [EUR/km]
A Study for the Fuel Cells and Hydrogen Joint Undertaking by Roland Berger | 23The costs may be significantly lower for some operators. Indicated cost projections above are applicable to the average European bus operator. However, the actual cost development depends strongly on operators' local conditions, which can change the case entirely. In order to demonstrate the influence of different cost drivers, a sensitivity analysis was performed. In a best case scenario with low feedstock/hydrogen prices, low financing costs and a longer bus lifetime, the overall costs of FC buses in the heavy-duty pathway can be on a par with diesel in the medium term. Lower electricity or natural gas and, thus, hydrogen prices can reduce TCO (see Annex 5 for details). A Weighted Average Cost of Capital (WACC) of 5% can further reduce TCO. With currently low interest rates, some public operators in particular should be able to achieve such financing rates. Assuming a bus lifetime of 18 years, there could be a TCO reduction almost closing the gap to the diesel bus. As mentioned above, assuming a longer lifetime of FC buses vs. diesel buses is a realistic expectation in general, if the drive train of FC buses proves the anticipated lower abrasion and, thus, lasts longer. Out of the three mentioned parameters, a longer bus lifetime carries the greatest potential for a reduction of overall TCO (see Annex 5). The sensitivity analysis demonstrates that costs can significantly differ from the average projections presented in this study. Interested bus operators and local governments will need to assess carefully how their specific local framework conditions influence the cost projections applicable to them in order to make an informed decision on deploying FC buses. A comprehensive cost assessment tool has been developed in the framework of the study to help operators to analyse their actual FC bus deployment costs. The tool is available to all participants and allows for customised cost calculations using specific local costs (e.g. for labour or feedstock) as well as individual deployment schedules. 24 | FCH JU – Commercialisation Strategy for Fuel Cell Electric Buses in Europe
You can also read