POLICY TOOLS FOR THE DECARBONISATION OF URBAN FREIGHT TRANSPORT IN BRAZIL - DIVA
←
→
Page content transcription
If your browser does not render page correctly, please read the page content below
DEGREE PROJECT IN SUSTAINABLE ENERGY ENGINEERING,
 SECOND CYCLE, 30 CREDITS
 STOCKHOLM, SWEDEN 2021

Policy Tools for the
Decarbonisation of Urban Freight
Transport in Brazil
A Total Cost of Ownership
Analysis

Raghav Somayya MANDANA

 KTH ROYAL INSTITUTE OF TECHNOLOGY                   1
 SCHOOL OF INDUSTRIAL ENGINEERING AND MANAGEMENT

Master of Science Thesis
                               Department of Energy Technology
                                           KTH 2021
                                       TRITA-ITM-EX 2021:493
                      Policy Tools for the Decarbonisation of Urban Freight
                                         Transport in Brazil

                                   Raghav Somayya Mandana
                                        rsman@kth.se
Approved   Examiner                    Supervisor
           Francesco Fuso-Nerini       Constança Martins Leite de Almeida
           Industrial Supervisor       Contact person

                                                                              i
Abstract

There has been an increase in the carbon dioxide (CO2) emissions in the last 3 decades. A large
share of these emissions is produced by the transport sector. In 2010 alone, global transport
accounted for 7 GtCO2 eq and approximately 23% of total energy-related CO2 emissions. In
order for the decarbonisation of the transport sector, one of the most important strategies is to
reduce the use of fossil fuels. Fossil fuel consumption can be reduced by rolling out more battery
electric vehicles (BEVs) on public roads. This is one of the methods by which the concept of
electromobility is promoted. In order to increase the share of EVs, many countries have
implemented different policies that promote the electrification of the transport sector. With
respect to freight transport, electric commercial vans are one of the feasible choices.

This Master thesis involves a quantitative study which focus on the “total cost of ownership”
(TCO) of light commercial vehicles (LCVs). Two diesel vans currently used in Curitiba, Brazil
were selected - the Sprinter van by Mercedes-Benz and the Master van by Renault. In addition,
their electric counterparts were also chosen; in conjunction, a sensitivity analysis with respect
to fuel prices and annual distance driven was conducted. The results showed that the TCO of
the electric LCVs is around 1.6 to 1.7 times higher than their diesel versions. As far as the two
van model types were concerned, the Mercedes-Benz Sprinter had a higher TCO than the
Renault Master over the chosen vehicle lifetime for both the diesel and electric versions, with
the difference around 7.5% for the diesel versions and approximately 13% for the electric
versions.

Based on the results of the TCO study, possible economic policies and fiscal instruments were
recommended with regards to light commercial freight transport for Curitiba.

Keywords/Terminologies
CO2 emissions, transport sector, decarbonisation, battery electric vehicles (BEVs),
electromobility, freight transport, total cost of ownership (TCO), light commercial vehicles
(LCVs)

                                                                                                ii
Sammanfattning
Det har skett en ökning av koldioxidutsläppen (CO2) under de senaste 3 decennierna. En stor
del av dessa utsläpp produceras av transportsektorn. Bara 2010 svarade, global transport för 7
GtCO2 ekvivalenter och cirka 23% av de totala energirelaterade koldioxidutsläppen. För att
avkolning av transportsektorn är en av de viktigaste strategierna att minska användningen av
fossila bränslen. Fossil bränsleförbrukning kan minskas genom att rulla ut fler elektriska fordon
(EF) på allmänna vägar när det gäller transportsektorn i allmänhet. Detta är en av metoderna
som begreppet elektromobilitet främjas. För att öka andelen elbilar har många länder genomfört
olika policyer som främjar elektrifiering av transportsektorn. När det gäller godstransport, är
elektriska kommersiella lastbilar och skåpbilar två av de möjliga valen.
Detta examensarbete involverar en kvantitativ studie som fokuserar på “totala
ägandekostnaderna” (TÄK) för lätta nyttofordon. Två dieselbilar som för närvarande används i
Curitiba, Brasilien valdes - Sprinter-skåpbilen från Mercedes-Benz och Master-skåpbilen av
Renault. Dessutom valdes deras elektriska motsvarigheter; i samband med detta genomfördes
en känslighetsanalys avseende bränslepriser och årlig körd distans. Resultaten visade att T för
elektriska LCV är cirka 1.6 till 1.7 gånger högre än deras dieselversioner. När det gäller de två
typerna av skåpbilar hade Mercedes-Benz Sprinter en högre TCO än Renault Master under den
valda fordonstiden för både diesel - och elektriska versioner, med skillnaden cirka 7.5% för
dieselversionerna och cirka 13% för de elektriska versionerna.
Baserat på resultaten av TCO-studien rekommenderades möjlig ekonomisk politik och
finanspolitiska instrument när det gäller lätt kommersiell godstransport för Curitiba.
Nyckelord/Terminologier
koldioxidutsläppen, transportsektorn, avkolning, elektriska fordon (EF), elektromobilitet,
godstransport, total ägandekostnad (TÄK), lätta kommersiella fordon (LKF)
iiiAcknowledgements
I would like to thank everyone who have contributed to the production of this Master thesis;
without them, the experience during the last five and a half months would not have been
possible.
First and foremost, my heartfelt gratitude to my supervisor at KTH - Ms. Constança Martins Leite
de Almeida - for her time, her support and precious advice as well as conducting a thorough
review of this report on completion.
Next, my sincerest thanks to Mr. Ricardo Luders for his help in acquiring the information for
me in order to carry out the necessary calculation work for the study in this report.
I would like to show my appreciation to my examiner Prof. Francesco Fuso-Nerini, Ms. Semida
Silveira and Ms. Carolina Ribeiro for contributing with their input during the process.
Finally, I am thankful to my family for having supported me during the entire duration of this
Master thesis.
ivAbbreviations and Nomenclature
Main Acronyms
ANEEL - Agência Nacional de Energia Elétrica
ANP - Agência Nacional do Petróleo
AVT - Annual Vehicle Taxes
BEV - Battery Electric Vehicle
BRT – Bus Rapid Transit
COPEL - Companhia Paranaense de Energia Elétrica
CRLV - Certificado de Registro de Licenciamento do Veículo
CRV - Certificado de Registro do Veículo
DETRAN PR - Departamento de Trânsito do Paraná
DPVAT - Seguro de Danos Pessoais Causados por Veículos Automotores de Vias Terrestres
GHG - Greenhouse Gas
HEV - Hybrid Electric Vehicle
I&M - Insurance and Maintenance
IBGE - Instituto Brasileiro de Geografia e Estatística
ICEV - Internal Combustion Engine Vehicle
ICMS - Imposto sobre Circulação de Mercadorias e Serviços
IPI - Imposto sobre Produtos Industrializados
IPPUC - Instituto de Pesquisa e Planejamento Urbano de Curitiba (Research and Urban
Planning Institute of Curitiba)
IPVA - Imposto sobre a Propriedade de Veículos Automotores
IVP - Initial Vehicle Price
LCV - Light Commercial Vehicle
vOMC – Operation and Maintenance
OOPC - Other One-Time Purchase Costs
PETROBRAS - Petróleo Brasileiro S.A. (Brazilian Petroleum Corporation)
PHEV - Plug-in Hybrid Electric Vehicle
PlanClima - Curitiba Climate Change Adaptation and Mitigation Plan
PV - Present Value
RIT – Rede Integrada de Transporte (Integrated Transport Network)
RMC - Metropolitan Region of Curitiba
URBS - Urbanização de Curitiba
TCO - Total Cost of Ownership
VAT - Value Added Tax
Other Acronyms
AOC - Annual Operating Cost
AKT - Annual Kilometres Travelled
CRF - Capital Recovery Factor
CNG - Compressed Natural Gas
ECB - European Central Bank
GOCA - Group of Organisations for Automobile Registration
IETT - Istanbul Electric Tram and Tünel Company
KPI - Key Performance Indicator
MRT - Maintenance, Repair and Tyre replacements
NCM – Nomenclatura Comum do Mercosul
PVF - Present Value Factor
viWCV - Waste Collection Vehicle
Variables
PVinvestment / PVinv - Present Value Total Investment Costs
PVomc - Present Value Operation and Maintenance Costs
PVres - Resale Value of the vehicle after its lifetime
Pveh - Tax policy on the vehicle
Cveh - Total cost of the vehicle
Parameters
Adep - Depreciation Rate
σ - Discount Rate
n - Lifetime of vehicle
viiTable of Contents
Abbreviations and Nomenclature ............................................................................... v
List of Figures .............................................................................................................. ix
List of Tables................................................................................................................. x
1. Introduction .................................................................................................................. 1
1.1. Problem, Thesis Purpose and Thesis Framework ......................................................... 1
1.2. The City of Curitiba – Background and Actions Undertaken so far ............................. 2
2. Literature Review ......................................................................................................... 7
3. Methodology ............................................................................................................... 22
3.1. TCO Definition ........................................................................................................... 22
3.2. Vehicle Selection......................................................................................................... 22
3.3. TCO Calculation ......................................................................................................... 24
3.4. Applicable Payments on Vehicle Registration and Ownership in Brazil.................... 26
3.5. Key Assumptions and Input Data................................................................................ 27
3.6. Review on Schemes and Economic Policy Tools ....................................................... 30
4. Results and Discussion ............................................................................................... 32
4.1. Sensitivity Analysis ..................................................................................................... 36
4.1.1. TCO vs Fuel Price .................................................................................................. 37
4.1.1.1. Price of Electricity……………………………………………………………...37
4.1.1.2. Price of Diesel………………………………………………………………….40
4.1.2. TCO vs Annual Distance........................................................................................ 42
5. Feasible Schemes and Economic Policy Tools ......................................................... 44
6. Conclusion and Future Work.................................................................................... 53
References ................................................................................................................... 55
Appendix .................................................................................................................... 64
viiiList of Figures
Figure 1. Illustration of Curitiba’s BRT system ........................................................................ 3
Figure 2. Percentage (%) share of Total Emissions from the 4th Inventory .............................. 5
Figure 3. Comparison of TCO and its components for the selected LCVs over a lifetime n =
10 years .................................................................................................................................... 34
Figure 4. Comparison of TCO and its components for the selected LCVs over a lifetime n =
10 years (with PVomc breakup) ................................................................................................. 35
Figure 5. TCO vs Electricity Price for the electric LCVs for a 20% fixed step-wise increment
in the default price used ........................................................................................................... 38
Figure 6. TCO vs Electricity Price for the electric LCVs according to the COPEL white
hourly tariff modality ............................................................................................................... 40
Figure 7. TCO vs Diesel Price for the diesel LCVs taking annual average resale and
distribution price of diesel according to ANP price survey ..................................................... 41
Figure 8. TCO trends for the selected LCVs for various annual distances covered ............... 43
ixList of Tables
Table 1. Literature review summary………………………………….……………………….7
Table 2. Shortlisted chosen diesel models and their electric counterparts .............................. 22
Table 3. Diesel LCV Technical Data....................................................................................... 23
Table 4. Electric LCV Technical Data .................................................................................... 24
Table 5. Percentage increase between diesel and electric models of selected vans for selected
European markets ..................................................................................................................... 28
Table 6. TCO cost components for the LCVs with discount rate applied ............................... 32
Table 7. Results for TCO and its components for a vehicle lifetime n = 10 years .................. 33
Table 8. Results for TCO and its components for a vehicle lifetime n = 10 years (with PVomc
breakup) .................................................................................................................................... 34
Table 9. TCO-Electricity Price relationship for a 20% fixed step-wise increment in the default
price .......................................................................................................................................... 37
Table 10. TCO-Electricity Price relationship according to COPEL white hourly tariff
modality .................................................................................................................................... 39
Table 11. TCO-Diesel Price relationship taking annual average resale and distribution price
of diesel according to ANP price survey .................................................................................. 40
Table 12. TCO for the selected LCVs for various annual distances covered .......................... 42
Table 13. Summary of schemes, economic policy tools, initiatives and programmes adopted
by the countries in Latin America ............................................................................................ 44
x1. Introduction
1.1 Problem, Thesis Purpose and Thesis Framework
The demand for freight transport has been burgeoning in the global context. This growth in
demand is expected to increase in developing countries [1] [2] – especially for road transport.
However, in developing countries, road transport is heavily reliant on oil. [3] In Brazil, transport
of cargo is responsible for more than 60% of road travel [4]; but the country’s transport sector
accounted for nearly 45% of the carbon dioxide (CO2) emissions in 2014 alone. [5]
As far as freight transport is concerned, low-carbon options have been developed over time;
these can be vehicles which are fuelled either by electricity or by alternate fuels like biodiesel
and other biofuels. Transport electrification is one of the solutions with the greatest potential
towards decarbonised and sustainable transport systems. [6] However, the transition to electric
transport and its utilisation is affected by factors like vehicle usage behaviour; cost; battery
weight; charging patterns; battery range limitations; safety regulations; lack of public awareness
about the availability and practicality of these vehicles. [7] Therefore, this highlights the need
to identify measures which incentivise the decarbonisation of the freight transport sector. To
facilitate the development of electromobility, the implementation of incentives – financial and
non-financial – are necessary. [8]
86% of Brazil’s population live in urban areas; this percentage is expected to increase to over
91% by 2050. [5] The city of Curitiba, for example, has seen a rise in its population while
striving to achieve its ambitious targets for a higher standard of living for its residents. As one
of the developing economies in the world, Brazil is likely to see positive growth in the freight
transport sector - therefore making it more important that this growth is complemented with
sustainable policies and technologies. [3] If the substitution of conventional freight transport
methods with sustainable freight technologies and policies does not happen, then
implementation of low-carbon transport and sustainable mobility in Curitiba is unlikely to
succeed. In addition to this, urban freight transport has not been given enough attention. [3]
The aim of this thesis is to compare, see and then recommend feasible measures with respect to
urban freight transport for the city of Curitiba. This study comprises two parts. The first part is
a quantitative study analysing the total cost of ownership (TCO) for light commercial vehicles
(LCVs); to further validate the TCO analysis, a sensitivity analysis was done which explored
how the TCO would vary when the fuel price and annual distance covered change. The second
1part is a qualitative analysis comprising the schemes, economic policy tools and other
actions/initiatives/programmes performed in the Latin American region.
The report starts with a background of Curitiba, Brazil and mentions the actions that the city
has undertaken to reduce their carbon emissions as well as their ambitions in striving for better,
sustainable urban planning. Following the brief background information about Curitiba is the
literature review, which looks into similar studies in regards to TCO evaluation and assessment
along with economic policy tools with respect to electromobility in Brazil as well as other Latin
American countries. After the literature review comes the methodology; here, the concept of
TCO is explained. Two LCV models were selected for the TCO study, and the TCO calculation
procedure was established. In order to help find the TCO of the models, information regarding
the applicable payments made while buying and owning a vehicle in Brazil was required; also,
suitable assumptions and input data were incorporated. From the methodology used for this
study, the results obtained are then shown in the next chapter, which contains two subsections;
the first of these subsections show the results obtained using the main input data and
assumptions, while the second is a sensitivity analysis which explores how the TCO of the
different vans would change with a corresponding change in the fuel price and annual distance.
The results obtained for both subsections were in the form of tables and figures, while
containing some key discussion points and observations. Based on these results, discussion
points and findings, the report then explains a selection of possible economic policies that could
be implemented within Curitiba - with the focus being on promoting electromobility.
1.2 The City of Curitiba – Background and Actions
Undertaken so far
The city of Curitiba is the capital of Paraná state in southern Brazil on the country’s southeast
coast. It is situated 930 m above sea level, close to the Atlantic side of the Brazilian Highlands
and the headwaters of the Iguaçu River. [9] The city has encountered economic and population
growth since the 1940s. [10] It occupies an area of 434.89 km2 and has a demographic density
of 4,027.04 inhabitants per km2. [11] The city has a population of a little under 1.95 million
inhabitants. [11] It is at the heart of a group of 29 municipalities that form the Metropolitan
Region of Curitiba (RMC) [11] [12], having a population around 3.68 million people. [3] The
city is connected by motorways, railroads and air routes with other main Brazilian cities –
primarily Porto Alegre and São Paulo to the south and north respectively. [9]
2According to a survey conducted by Urbanização de Curitiba (URBS), the created mass
transportation system presently covers eight neighbouring cities and transports 1.9 million
commuters on a daily basis with an approval rate shy of 90%. This was achieved with the help
of organisations like the Instituto de Pesquisa e Planejamento Urbano de Curitiba (IPPUC). [10]
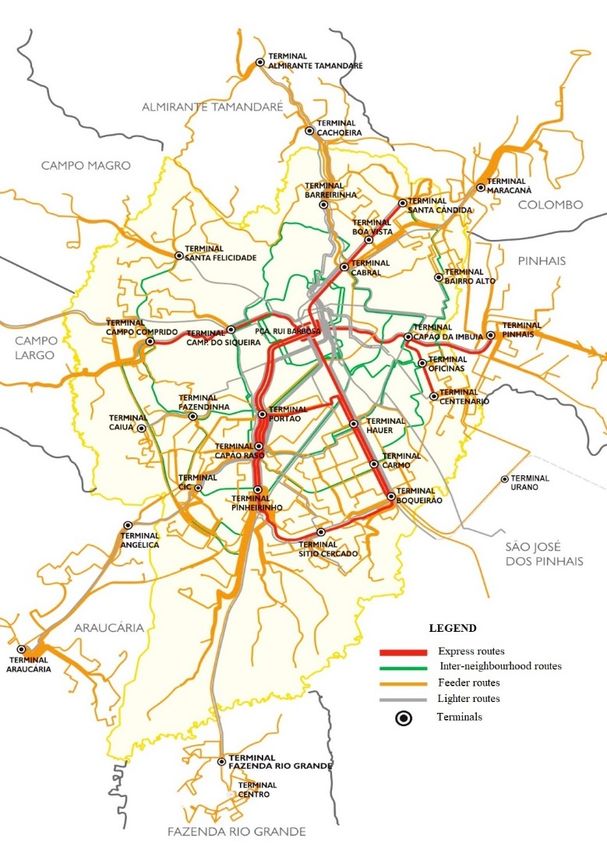
The following figure below gives an overview of the bus rapid transit (BRT) system currently
in Curitiba known as the “Rede Integrada de Transporte” (RIT).
Figure 1. Illustration of Curitiba’s BRT System [13]
Curitiba has a temperate climate; however, the temperature of the city is already, on average,
1.2 °C higher than six decades ago. Changes in the rainfall regime have been observed, with
the occurrence of strong and intense storms being more common, as well as periods of drought.
In both cases, the population has been impacted - sometimes by disasters resulting from floods,
water scarcity or thermal discomfort. [14]
3Since 1966, Curitiba has implemented a Master plan – which on approval, redeveloped the
city’s layout into a linear model of urban expansion via established regulations. [10] Recycling
programs, zoning laws and specialised busing services were set in the 1970s. [9] The 1966
Master Plan contemplated social promotion, housing, work, transportation, circulation and the
environment. The Plan established the decongestion of the centre, with the enhancement of the
historic sector, the prioritization of pedestrians and public transport. In addition, it defines the
distribution of education, health, recreation and leisure facilities throughout the city. Hence, it
provides economic support for development of the municipality, from the implantation of the
Industrial City of Curitiba - CIC. The Plan's main premise was to change the city's growth
typology, from radial to a linear model of urban expansion, adopting (as a strategy) the
integration of the aspects of land use, road system, public transport and economic, social and
environmental development in the definition of local policies. [14]
With regard to urban occupation, the current conformation of the city is guided by guidelines
established by the Master Plan of 1966 and its continuous improvement process. The 1966
Master Plan underwent two revisions - one in 2004 and the other in 2015. The revision of the
2015 Master Plan reinforced and expanded the continuity of the planning process. For example,
it extended the sustainable development guidelines from Curitiba to the Metropolitan Region,
in line with international, national and state commitments. [14] Actions that include the use of
renewable energies also received special attention. An example of the city's commitment to this
theme is the investment in technologies aimed at energy efficiency, through the “Curitiba Mais
Energia” programme, which provides for greater use of solar energy in the city.
In 2009, Curitiba developed a series of strategies and actions to act more incisively on the
climate issue in the municipality. That year, the Curitiba Forum on Climate Change was created,
instituted by municipal decree, with the objective of debating and proposing measures to
mitigate and adapt to climate change for the city. [14]
Curitiba started accounting for its greenhouse gas (GHG) emissions in 2011 and, since then,
prepared four “inventories” of GHG emissions [14]: -
• 1st Inventory: base year 2008, realisation 2011
• 2nd Inventory: base year 2012, realisation 2015
4• 3rd Inventory: base year 2013, realisation 2015
• 4th Inventory: base year 2016, realisation 2019
The total emissions reported in the 4th Inventory amounted to 3,505,046 tonnes of carbon
dioxide equivalent (CO2eq) distributed as shown in Figure 2 below. Out of these total emissions,
transport accounted for the largest share in the municipality at nearly 67%; about 11% were
produced from waste while the rest came from stationary energy. [14]
Figure 2. Percentage (%) share of Total Emissions from the 4th Inventory [14]
On 15th December, 2020, the “Curitiba Climate Change Adaptation and Mitigation Plan”
(PlanClima) was approved by the Mayor of Curitiba. PlanClima is the result of the efforts by
the GT Clima Working Group, constituting 12 institutions, which are coordinated by the
Municipal Secretariat and the IPPUC. [15]
PlanClima structures its actions in strategic sectors that emphasise areas of interest. For the
elaboration of PlanClima, five strategic sectors were defined for its structuring: Energy
Efficiency, Solid Waste and Effluents, Sustainable Urban Mobility, Urban Hypervisor and
Innovation. [14]
5In Curitiba, the Sustainable Urban Mobility strategic sector plays a central role in PlanClima
due to the transport sector concentrating the largest percentage of GHG emissions in the city
(as seen in Figure 2). PlanClima is comprised of 20 actions, with 5 of them – Actions 10, 11,
12, 17 and 20 - targeting the Sustainable Urban Mobility strategic sector. [14]
The actions prioritised in the Sustainable Urban Mobility strategic sector for PlanClima aim to
encourage the electrification of the passenger vehicle and public transport bus fleets; full
accessibility and less environmental pollution; develop studies of integration of actions in
public transport with mitigation and adaptation objectives; implement low carbon or carbon
neutral areas for mobility; encourage the expansion of the participation of public transport and
the non-motorised mode of transportation in the modal division; review and promote the
regulation of the various modes or types of transport; strengthening their integration in the urban
mobility system and transport-oriented development through the adoption of urban parameters;
encourage the creation and expansion of mixed-use zones; travel by bicycle and on foot, with
the improvement of bicycle and pedestrian infrastructure; promote the implementation of fiscal
and other mechanisms that encourage low-carbon mobility; expand the exclusive lanes of public
transport; and strengthen the technical and operational structure for planning and operating the
Integrated Transport Network (RIT). [14]
By performing the actions targeted for the Sustainable Urban Mobility strategic sector, Curitiba
aims to offer urban mobility services in the city on public transport powered by cleaner
technologies with lower emissions. [14] Other actions include encouraging active mobility and
the implementation of policies and strategies to reduce the circulation of individual vehicles.
[14]
62. Literature Review
For the TCO study conducted in this thesis, several papers were reviewed from which 14 of
them were chosen. These papers were either published as journal articles and reports or were
presented at conferences; also, they were associated with TCO analysis. All of the research by
the respective teams was performed in 14 countries – with 3 articles each applying research in
Belgium and US. From the literature review, this kind of study has been carried out
predominantly in Europe; on the other hand, there is less literature available with respect to
vehicle TCO studies in Brazil. It was observed that there are several cost components of TCO
including depreciation cost, fuel costs, insurance, operation and maintenance (OMC) as well as
fees and taxes along with purchase price.
Some of the various methods in analysing the TCO of vehicles are briefly summarised in the
performed literature review as shown in Table 1 and in the following writeup.
Name of Paper Authors Country Key Points and Assumptions
- Length of TCO study 3 years.
- Annual mileage 15,000 kms
Total cost of
ownership and its - Buyer spent 20% of purchase cost; rest
potential Hagman et financed by 3-year loan at 6% interest rate
Sweden
implications for al.
- Same depreciation rate taken for ICEVs
battery electric
and HEVs (50%); BEVs had 67%
vehicle diffusion
- BEV had lowest TCO/km
Total cost of
- Used diesel, CNG and electric buses
ownership based
economic - Lifetime of buses as 10 years
analysis of diesel, - Purchase costs inclusive of OMC costs
Topal and
CNG and electric Turkey for 5 years; OMC costs taken as 82% of
Nakir
bus concepts for purchase price
the public
- Assumed total driven distance of
transport in
450,000 kms
Istanbul City
7- TCO for diesel and CNG buses lower
than electric for daily distances between
100-200 kms
- TCO for CNG buses increased sharply
while electric buses showed the least
increase for daily distances above 200
kms
- Compared ICEVs, HEVs, PHEVs and
BEVs; types of vehicles were small-size,
medium-size and sport utility
- Probablistic simulation model built to
find total cost to consumers
Total cost of
- Monte Carlo simulations used; outcomes
ownership of
predicted for 2014, 2020 and 2025
electric vehicles
compared to - Future values discounted to respective
conventional present value (PV)
Wu et al. Switzerland
vehicles: A - Vehicle holding period of 6 years;
probabilistic interest rate of 4.1%
analysis and
- Annual short, medium and long distance
projection across
of 7,483 kms, 15,184 kms and 28,434 kms
market segments
respectively
- BEVs had the largest TCO for short and
medium distances
- PHEV sport utility vehicles had largest
TCO for medium and long distances
- BEVs, HEVs and ICEVs in study
How expensive
Lebeau et - Used PV concept with real discount rate
are electric Belgium
al. to eliminate tricky calculations and
vehicles? A total
inflation
8cost of ownership - State that typical vehicle ownership is
analysis around 7 years
- Real discount rate of 1.18%; annual
distance of 15,000 kms
- Study did not consider technological
advancements in vehicles, higher fuel
efficiency and inflation
- Assumed battery lifetime of 6 years; fuel
costs taken as average in 2012
- Vehicle registration range was €40 -
€10,000; depreciation rate between 70-
80%
- TCO/km for BEVs was highest in all
three car segments (small, medium and
premium)
- TCO model assessed competitiveness of
quadricycles and LCVs for freight
transport companies
- Economic formula of present discounted
value split into cost of ownership, costs
Electrifying light
incurred and discount rate applied on
commercial
future costs
vehicles for city Lebeau et
Belgium
logistics? A total al. - Vehicle lifetime of 9.9 years with a real
cost of ownership discount rate of 0.05% (after inflation)
analysis
- Average distance of 147,281 kms
covered per vehicle according to GOCA
- Batteries charged once a day for 260
days/year, lead-acid and Li-ion batteries
replaced every 2 and 6 years respectively
9- Maintenance, repair and tyre costs same
for first 60,000 kms; these same costs for
diesel vehicles taken higher than that for
petrol vehicles
- For LCVs, TCO/km for diesel vehicles
was lower than electric ones
- Used techno-economic simulation for
diesel and electric car models made by
Renault’s economic model for vehicles
purchased in France during 2020
- Depreciation rate discounted to present
value
Techno- - Assumed percentage change in value for
Economic vehicles in France followed same
Comparison of empirical trend as that in the US
Desreveaux
Total Cost of France
et al. - Assumed resale of vehicles after 10
Ownership of
years; battery replacement not considered
Electric and
Diesel Vehicles - TCO calculated for ownership periods of
3, 5 and 8 years respectively
- “Constant consumption” value for fuel
demand was used as a result from
technical simulations
- General trend showed TCO increased
with ownership time
Electrification of
waste collection - Techno-economic analysis to understand
vehicles: Techno- Schmid et energy demand and TCO for diesel and
Germany
economic al. electric waste collection vehicles (WCVs);
analysis based on devised open-source simulation tool with
an energy
10demand route synthetisation approach with real-
simulation using time operation data
real-life
- Real discounted rate of 2.9%, interest
operational data
rate of 4% p.a. and vehicle lifetime of 10
years
- Did not consider maintenance for
electric WCV would be lower
- Two methods to calculate TCO – simple
difference between the TCOs for diesel
and electric WCVs; calculating virtual
costs of well-to-wheel GHG emissions
saved
- BEVs, diesel and gasoline cars in report
- Car size classified as small, medium and
big
- Annual distance of 10,000 kms
Federal Planning
- Ownership periods studied were 15, 8
Bureau: Total
and 4 years; private discount rate of 1.5%
cost of ownership
of electric cars - 11-12 years and 6-6.8 years respective
Franckx Belgium
compared to median lifetime for gasoline and diesel
diesel and cars
gasoline cars in - All cost information taken from
Belgium publications by various public
organisations
- TCO for small and medium cars were
similar irrespective of fuel; for big cars,
TCO for BEVs was largest
Total cost of Mitropoulos - ICEVs, HEVs and BEVs as vehicle
Greece, US
ownership and et al. choices
11externalities of - Annual mileage of 11,300 miles; vehicle
conventional, lifetime of 10.6 years
hybrid and
- TCO calculation included values from
electric vehicle
vehicle purchase till time of scrapping
- 6% tax rate, 5% nominal interest rate
and inflation rate of 2.5%
- Shipping cost of 0.24 USD/lb
- Fuelling frequency determined; time to
recharge Li-ion battery is 26 mins
- ICEVs had highest externalities cost and
TCO
- HEVs, PHEVs and BEVs in study
- Time period between 1997-2015
Total cost of - Vehicle ownership period of 3 years
ownership and - Discount rates for UK, US and Japan
market share for taken as 3.5%, 4% and 3.5% respectively
Palmer et UK, US,
hybrid and
al. Japan - Initial vehicle subsidies applied before
electric vehicles
depreciation; assumed some cost savings
in the UK, US
will be passed on vehicle resale
and Japan
- Cost ratio for PHEVs more than HEVs
except in Japan; UK had lowest cost ratio
for BEVs
Table 1. Literature review summary
The work performed by Hagman et al. [16] aimed at understanding the TCO and its potential
implications for diffusion of battery electric vehicles (BEVs) on the Swedish market. A TCO
model which focused on consumers was built with the aim to look into the probable gap
12between the TCO and the buying price for three kinds of vehicles - internal combustion engine
vehicles (ICEVs), hybrid electric vehicles (HEVs) and BEVs. Four vehicles, comprising one
BEV, two ICEVs and an HEV, were taken and the TCO of each of these models was compared
in a Swedish market setting. For this study, the length of ownership was considered as 3 years
with each vehicle assumed to cover an annual mileage of 15,000 kilometres. It was also
assumed that each vehicle was owned by a 30-year-old male living around Stockholm, who did
not have an accident record for 12 years. In their study, Hagman et al. assumed that the
purchaser provided a 20% down payment with the remainder of the purchasing cost financed
by a 3-year loan at a 6% annual interest rate; hence, they determined that effective interest rates
were 4.2% if the amount of deductible tax was 30%. Fuel/energy costs were calculated as the
product of fuel consumption per kilometre, fuel price per unit and total vehicle mileage during
the ownership period. [16] They took a depreciation rate of 50% for both ICEVs and the HEV.
Finding a suitable value for the BEV depreciation rate was trickier, since it required a thorough
analysis due to a lack of historical data. Also, the uncertainty regarding the future conditions of
BEV could have contributed to conservative depreciation estimates of BEV by the financial
institutes, as evident by the estimated 67% depreciation rate for the eUP, the electric car model
manufactured by Volkswagen. [17] Their results showed that the BEV had the lowest TCO per
kilometre, with the HEV having the second highest value in between both of the ICEVs. [16]
A study by Topal and Nakir [18] looked into the creation of a dynamic model based on the TCO
from well-to-wheel for buses in Turkey fuelled by diesel, compressed natural gas (CNG) and
electricity. Using this model, the data source was established by carrying out performance tests
for these kinds of buses in real road, time and trip conditions within the city of Istanbul, Turkey.
The lifetime of the buses was taken to be 10 years and operation expenses were taken as 82%
of their respective purchase price. The vehicle purchase costs were inclusive of operation and
maintenance (OMC) costs for 5 years - these were inclusive of constant values for driver costs,
amortisation costs, insurance costs and taxes. By knowing the time taken to reach a full tank of
fuel, the authors could establish the OMC cost and average fuel cost per kilometre. OMC cost
comprised various cost components like vehicle body cost, traffic insurance, damage and repair
payments, taxes, administrative management etc. For the electric buses, total OMC cost was
found as the product of the route length and the OMC cost per kilometre; this calculation took
the assumption that the buses travel a distance of 450,000 kilometres. The maintenance and
repair and fuel costs in the formula used in this study for TCO calculation were based on the
13specified conditions laid out by the Istanbul Electric Tram and Tünel Company (IETT) for the
10-year period in the forecast; therefore, the average values obtained were used. As far as the
TCO was concerned, they concluded that the TCO for the diesel and CNG-fuelled buses was
lower than that of the electric buses if they covered a daily distance between 100-200
kilometres. However, for daily distances beyond 200 kilometres, the TCO for the diesel and
CNG buses sharply increased. The TCO for the electric buses showed the least increase for the
range of daily distances considered in this study as compared to its other two rivals. [18]
The study conducted by Wu et al. [19] explored at evaluating and comparing the discounted
TCO per kilometre among the four main types of vehicles on roads today - ICEVs, HEVs,
PHEVs and BEVs. They did this by building a probabilistic simulation model to calculate the
TCO to find the complete cost of the consumer with the focus on individual vehicle classes,
powertrain technologies or use cases. The developed model was aimed to be broad enough to
capture most of a national market and considered a range of vehicle sizes - from small to
medium-size vehicles and sport utility vehicles. Outcomes from this model were calculated for
the years 2014, 2020 and 2025 - hence, looking into past, present and future scenarios - using
Monte Carlo simulations since they state that the corresponding policy targets (e.g. EU transport
regulations, German vehicle stock target 2020), were in the scope of many other studies. These
policy targets provided the input data for the authors’ projections [19] (e.g. [20] and [21]). They
used input data from multiple sources and used the statistical distribution among these data to
calculate the ranges and averages of the TCO outcomes - these outcomes were, in turn, tested
with multiple rounds of simulation. Any future costs were discounted to their present values in
their TCO calculation.
The future resale value, initial purchase cost, annual operating cost (AOC) and annual
kilometres travelled (AKT) were all dependent on the vehicle class. The capital recovery factor
(CRF), interest rate, vehicle lifetime and present value factor (PVF) were assumed to be the
same for all cases. The authors assumed an average vehicle holding period of 6 years and
analysed TCO for an annual distance of 7,483 kilometres, an annual medium distance of 15,184
kilometres and an annual long distance of 28,434 kilometres. [19] An interest rate of 4.1% was
used to calculate CRF and PVF. [22]
In their TCO formula, the difference between the initial buying price and discounted future
resale value was capital cost was annualized by the CRF to obtain the capital cost. The average
14AOC took the time value of future payments applied with the discount rate. This present value
of annual cost was then divided by the AKT to get the TCO per kilometre. Their results showed
that the mean TCO per kilometre for all time scenarios increased for all vehicle types except
BEVs - which decreased till 2020 and then expected to increase again. For short and medium
distances, BEVs had the largest TCO per kilometre with that of ICEVs and HEVs showed
similar trends and were the lower two categories. The same for PHEVs was highest for sport
utility vehicles driving medium and long distances. [19]
A TCO model for three different car segments - small cars, medium cars and premium cars was
presented by Lebeau et al. [23] with the objective of understanding the cost efficiency of BEVs
and HEVs as compared to conventional vehicles, i.e. petrol and diesel ICEVs, in Belgium. They
considered three car segments - small, medium and premium cars. All costs were included as
follows - purchase cost, registration tax, vehicle road tax, maintenance, tires and technical
control cost, insurance cost, battery leasing cost, battery replacement cost and fuel or electricity
cost. They adopted the concept of present value (PV) which used a real discount rate in order
to eliminate the risk of complicated calculations which accounted for inflation within the PV
equation. [23]
Lebeau et al. state that the average lifetime of a vehicle is around 14 years, while the average
ownership period by an ordinary Belgian consumer before sale is half of the average lifetime.
They assume an average annual mileage is 15,000 kilometres per year and a real discount rate
of 1.18%. However, their study did not take into account technological advancements in
vehicles, increased fuel efficiency and inflation. [23] They assumed that the BEVs require
charging thrice a week - therefore leading to a battery lifetime of a little over 6 years. Coupling
this lifetime with the mileage assumption would give a total lifetime of 90,000 kilometres which
is higher than 75,000 kilometres [24] or a period of 8-10 years [25]. The fuel or electricity costs
were based on the average prices in 2012 for petrol, diesel and electricity and were inclusive of
value added tax (VAT). They also used varying amounts of vehicle registration tax - between
€40 and €10,000 at the time - and used an annual depreciation range between 70-80%.
Regarding maintenance, vehicles would require small maintenance every 10,000 kilometres
and a large one every 30,000 kilometres. [23] For the ICEVs, they deduced that the average of
TCO per kilometre for diesel vehicles was within the estimated range for petrol vehicles while
the same for BEVs was the highest for all three car segments; for the medium and premium
cars, the average TCO per kilometre for HEVs was lower than that of the BEVs.
15The same research team in [23] also developed a TCO model to assess the competitiveness of
quadricycles and LCVs for freight transport companies where this work presented the results
for a selection of BEVs, diesel and petrol vehicles [26]. The present value of the future one-
time costs were used as per [27], while the financial formula of the present discounted value in
[27] is divided into three parameters - the period of time over which these costs were incurred,
the discount rate applied on future costs to actualise them and the costs of ownership. Unlike in
[23], the period of ownership used in this model is 10 years since they state that the average
end-life of vehicles in Belgium is around 9.9 years according to data from the Belgian technical
control. Lebeau et al. used the Belgian long-term bounds at 10 years which showed a discount
rate of 1.15% as of July 2015, as per ECB. From the interest rate, as per the Federal Planning
Bureau, they then extracted 1.1% of expected average inflation between 2014 and 2020 in the
euro zone to find a real discounted rate of 0.05%. [26]
The costs for each vehicle were retrieved from the standard vehicle versions by contacting the
manufacturers, the distributors, the car dealers, the insurance companies and the regulatory
bodies. The costs considered were the annual car inspection, fuel (and electricity) costs,
maintenance, repair and tyre replacements (MRT), insurance, vehicle purchase costs, battery
costs, governmental support, fiscal incentives and road taxes; all costs excluded VAT. Their
TCO analysis considered all costs associated with the use of the vehicle except for the
investments in charging infrastructure as the authors felt those investments should be diluted
according to the size of the fleet. [26]
According to data from the company GOCA, the vehicles covered around 147,281 kilometres
in the 10-year period. For MRT, the cost for petrol engines was assumed constant for the first
60,000 kilometres which then increased afterwards. On the other hand, they considered the
MRT cost of diesel engines to be higher than that of petrol engines and remained constant over
time. The model took the replacement of the battery into account when the vehicle lifetime was
attained (i.e. maximum number of cycles); also, batteries were assumed to be charged once a
day during 260 days a year, lead acid batteries were replaced after 2 years and lithium-ion (Li-
ion) batteries were replaced after 6 years. Replacement costs were assumed to be in charge of
the customer only once the warranty provided by the manufacturer ended. [26] It was seen that
for LCVs, the TCO per kilometre for diesel vehicles was lowest while that for petrol vehicles
was the highest; since there were no petrol quadricycles, the TCO per kilometre for EVs came
to be higher than that for their diesel equivalent models.
16Desreveaux et al. [28] constructed a techno-economic simulation model using the Clio (diesel)
and Zoe (electric) manufactured by Renault. The technical models for each small car were
coupled to economic models to determine the TCO for a French study. The economic model
was developed for a vehicle purchased in France for the year 2020. Depreciation rate was
discounted to present value using a fixed discount rate and followed a decelerating decrease
calibrated based on real resale values of vehicles in the US. The study assumed that the
percentage change in value over time for a vehicle in France followed the same empirical trend
as the US and that the model could be used for both types of vehicles. They considered resale
of vehicles to take place after 10 years (i.e. ownership period). The replacement of the battery
and its lifetime were not considered since they state that newer batteries have lifetimes
approximately equal to the expected life of the vehicle. [28]
Their economic model defined the capital cost of the vehicle as the difference between the result
of the initial purchase price plus registration cost and tax policy on the vehicle. The equation
used to calculate the resale value in this thesis project (can be seen in the next section) is the
one implemented in this study also. The authors used a “constant consumption” value for both
the diesel and electric cars as obtained from their technical simulations. Energy/Fuel cost was
calculated as the product of the cost of fuel, annual vehicle mileage and fuel consumption -
following which the total annual cost was calculated as the sum of energy cost, insurance cost
and maintenance cost. The TCO was then calculated and plotted graphically for three values of
period of ownership (3, 5 and 8 years respectively) for diesel, electric and leased electric
vehicles. Also, they obtained similar graphs for three different driving cycles - the urban case,
the extra-urban case and the highway driving cycle. [28] The general trend seen from their
results is that the TCO for the diesel, electric and leased electric vehicles increased with the
period of ownership.
The study conducted by Schmid et al. [29] was a techno-economic analysis carried out to
analyse energy demand and TCO, integrating well-to-wheel emission costs for waste collection
vehicles (WCVs) powered by diesel and electricity. Here, they devised an open-source
simulation tool with a route synthetisation approach with the help of real-life operation data for
five different route types. With respect to the TCO, the first step was to calculate the one-time
and recurring present value costs (equations 5 and 6 in the next section). They assumed a
nominal interest rate of 5% and inflation rate of 2% - leading to a real discount rate of 2.9%;
even though this was a conservative assumption, it would represent long-term and risk-included
finance interest rates in agreement with studies conducted at the time. [20] They state that [30]
17assumed an interest rate of 4% and a vehicle lifetime of 10 years, but did not consider that
maintenance of the electric WCVs were likely to be lower than for their diesel counterparts.
The study included investment costs, operation and maintenance (O&M) costs and residual
costs in the TCO calculation. [29]
Two methods were implemented for the TCO evaluation - the first involved calculating the
simple difference in TCO between the electric WCV and the diesel WCV while the second
looked into calculating the virtual costs of the saved well-to-wheel greenhouse gas (GHG)
emissions.
Franckx [31] compared the TCO of BEVs with those of diesel and gasoline cars, classifying
them according to the size of the cars - small, medium and big. All assumptions on tax rates
were based on an annual publication by the Federal Public Service Finance, titled the “Tax
survey”. The cost information was obtained from the “Moniteur Automobile” for gasoline,
diesel and electric cars. The annual maintenance costs were based on Letmathe and Suares [32].
Insurance costs had been obtained from the National Bank of Belgium while annual control
costs were estimated using the annual report of GOCA, the professional association of car
inspection centres. Projections of fuel prices and electricity prices came from the long-term
energy outlook for Belgium to 2050 [33]. The annual report “Kilometers afgelegd door
Belgische voertuigen” published by the Federal Ministry of Mobility and Transport [34]
contained estimates of the mileage and the car stock for 5 fuel types (gasoline, diesel, LPG,
CNG and electric) and for 20 age classes. Variable costs include annual traffic tax, monthly
fuel cost (including VAT and excise tax), periodic technical control, maintenance and
insurance.
For the sake of the comparability between the different car types, the study assumed that all
cars drive 10,000 kilometres per year in order to calculate the cost per month and the cars were
grouped as per their size classification. For electric cars, the reported data on the annual
mileages were not differentiated according to size class. The median and average lifetime for
gasoline and diesel cars were pretty similar - 11.4 and 12 years respectively for the former while
it came to be 6.8 and 6 years respectively for the latter. [31]
In a more recent study, Franckx stated that Drabik and Rizos [35] assume that a battery has an
average lifespan of eight years in a vehicle. A private discount rate of 1.5% was assumed which
was consistent with the interest rates found on a website dedicated to the comparison of car
18loans on the Belgian market. The TCO was calculated and analysed for three different
ownership periods of 15, 8 and 4 years respectively. Results from this study concluded that the
TCO for medium and small cars were relatively similar irrespective of the fuel they ran on; on
the contrary, a clear difference could be seen for the big cars with the TCO for the BEVs being
the largest and that of diesel cars the smallest. [31]
Mitropoulos et al. [36] conducted work in developing a method that integrated indirect costs
(externalities), including emissions (i.e., global and local air pollution) and time losses with
direct TCO. Three representative urban light duty vehicles were considered for their study:
ICEVs, HEVs and BEVs. The TCO calculation included the present value of vehicle retail cost
including tax and lifetime operation cost from the time of vehicle purchase to the time of
scrapping - including fueling, maintenance, taxes, insurance, registration and driving license
costs.
For consistency in calculating annual fuel consumption, all vehicles were assumed to operate
in an urban environment; also, they were assumed to have covered the same annual mileage of
11,300 miles and a lifetime of 10.6 years. A 6% tax rate for all vehicle types was assumed in
this analysis which included all state and local taxes. The nominal interest rate is assumed to be
5.0% and the inflation rate is assumed to be 2.5%; using the two aforementioned two values,
the real discount rate could be found. In addition, they added a shipping cost (destination
charge) based on vehicle weight - this shipping cost was 0.24 USD/lb in terms of 2015 US
dollars. Costs for refuelling and maintenance were taken in the formula they have used here to
determine the fuelling frequency. For the estimation of the time loss, it was assumed that it took
an average duration of six minutes for a full tank. In the EV case, the fuel tank is substituted by
the Li-ion battery. [36] Time losses for an EV user were estimated based on the assumption that
26 minutes are required to charge a depleted Li-ion battery in order to complete the required
trip to a charger. [37] The maintenance frequency for parts replacement - but not inspection -
of a gasoline vehicle during its lifetime was estimated to be 22 times and each owner was
assumed to lose two hours per time for dropping-off and picking-up the vehicle. [36] For a
BEV, the maintenance schedule (excluding severe operating conditions) proposed a
maintenance frequency of 10 times for 144,000 miles or 10 years [38]. Their findings showed
that the BEV had the lowest total externalities costs while the HEV had the lowest TCO of the
three car fuel choices; the ICEV had the highest externalities costs as well as TCO.
19Palmer et al. [39] provide a more extensive TCO assessment of HEVs, plug-in hybrid (PHEVs)
and BEVs in three industrialised countries - the UK, the US and Japan; they carried out this
study for the time period 1997-2015. The TCO for HEVs, PHEVs and BEVs were compared
with that of petrol vehicles in all the three regions, while the UK part of their study included
analysing the TCO of diesel vehicles as well. Their study aimed to contribute to the existing
literature in three available areas - investigating how TCO has changed historically, examining
how TCO varies across different geographical regions and assessing the relationship between
hybrid vehicle TCO and adoption. In addition to the TCO, they used a panel regression model
to evaluate the effect of varying ownership costs on market share. The study considered the
Toyota Prius as the HEV, the Toyota Prius plug-in model as the PHEV and the Nissan Leaf
electric model as the BEV. [39]
The ownership length was chosen as 3 years in accordance with the new average vehicle length
in the UK [40]. The discount rates were applied based on the social discount rates available for
each case - 3.5%, 4% and 3.5% for Japan, US (the states of California and Texas only) and the
UK respectively. [41] A country specific manufacturer's selected retail price was taken as the
initial vehicle price (IVP) [39] [42] while the depreciation rates were the same used by
Storchmann [43]. The same depreciation rate was assumed across all types as mentioned by
Gilmore and Lave. [41] The initial vehicle subsidies were applied before depreciation was
calculated as the authors state it was reasonable to assume that some of the cost savings will be
passed on when the vehicle gets sold. These subsidies for the three countries in the study ranged
between $2,000-$4,500 (US dollars) and those for PHEVs and HEVs had a higher financial
value than those for BEVs. Figures about the fuel use were sourced from Spritmonitor [44]
with the electric-only range efficiency figures were from the Idaho National Laboratory [45];
the authors also assumed that vehicle efficiency was the same for the three regions. They also
used past fuel prices for each country - while they derived their future fuel prices and used those
for all three from the UK price projections. [46]
TCO studies have mainly been published to assess the cost-effectiveness of new vehicle
technologies, e.g. technologies for electric vehicles. [36] The lifetime of an electric vehicle is
determined by the life of its battery. Normally, batteries are covered by warranty in case of any
issues. Under normal driving conditions, electric car batteries can last 10 years or 100,000 miles
(in terms of driving distance) before they need to be replaced. [47] A variety of approaches
have been adopted by different research teams while performing their respective TCO study on
20You can also read