Fuel Cell Electric Vehicle Deployment and Hydrogen Fuel Station Network Development - Annual Evaluation of
←
→
Page content transcription
If your browser does not render page correctly, please read the page content below

June 2014

                Annual Evaluation of

 Fuel Cell Electric Vehicle
Deployment and Hydrogen
     Fuel Station Network
             Development

Annual Evaluation of

Fuel Cell Electric Vehicle Deployment
 and Hydrogen Fuel Station Network
                         Development

                   Pursuant to AB 8, Statutes of 2013

                                           June 2014
List of Acronyms

AB     Assembly Bill

ARB    California Air Resources Board

BEV    Battery Electric Vehicle

CaFCP California Fuel Cell Partnership

CDFA California Department of Food
     and Agriculture

CEC    California Energy Commission

CNG    Compressed Natural Gas

CSA    Canadian Standards Association

DMV    Department of Motor Vehicles

FCEV   Fuel Cell Electric Vehicle

GHG    Greenhouse Gas

HFS    Hydrogen Field Standard

LCFS   Low Carbon Fuels Standard

LEV    Low Emission Vehicle

LEV III Future Low Emission Vehicle
        regulations, including criteria
        pollutant standards and greenhouse
        gas standards (formerly known as the
        Pavley Regulation, or Assembly Bill 1493)

NREL National Renewable Energy Lab

PHEV Plug-in Hybrid Electric Vehicle

SB     Senate Bill

VMT    Vehicle Miles Traveled

ZEV    Zero Emission Vehicle

This report has been reviewed by the staff of the Air Resources Board (ARB or
Board) and approved for publication. Approval does not signify that the contents
necessarily reflect the views and policies of ARB, nor does mention of trade names
or commercial products constitute endorsement or recommendation for use.
Table of Contents

Executive Summary                                                                              2
Findings			                                                                                    4
I: Introduction		                                                                             11
II: Location and Number of Hydrogen Fuel Cell Electric Vehicles                               15
III: Expected Vehicle Deployment Based on Past Experience with Advanced Technology Vehicles   20
IV: Location and Number of Hydrogen Fuel Stations                                             22
V: Evaluation of Current and Projected Hydrogen Fueling Capacity                              29
VI: Hydrogen Fuel Station Performance Standards and Technology                                34
VII: Conclusions and Recommendations                                                          44
VIII: References                                                                              46
IX: Appendix A                                                                                47
X: Appendix B                                                                                 49

                                                                                                   1
Executive Summary

    The year 2014 was a pivotal year for fuel cell electric vehicles (FCEVs), with multiple factors
    and events paving the way for the successful commercialization of FCEVs in California:

        • Assembly Bill 8 (Perea, Statutes 2013, chapter 401) dedicated up to $20
          million per year to support continued construction of at least 100 hydrogen
          fuel stations, demonstrating California’s commitment to FCEVs as a
          key component of achieving its air quality and climate goals;
        • $200 million in cap-and-trade proceeds were allocated for low-carbon
          transportation projects, $116 million of which are slated for the Clean Vehicle
          Rebate Project, including up to $5,000 per FCEV. This further supports the State’s
          broad mission to support zero emission vehicles (ZEVs), including FCEVs;
        • California Energy Commission (CEC) conducted an innovative solicitation that provides
          funding for 28 new stations, resulting in an anticipated 51 operating hydrogen fuel stations
          by the end of 2015 (more than doubling the previous number of State-funded stations);
        • ARB approved the update of the AB 32 Scoping Plan in March,
          emphasizing the role that FCEVs and other ZEV technologies must
          play to achieve the State’s air quality and climate goals;
        • The Governor’s Office is facilitating hydrogen fuel station permitting
          and project management through its Go-Biz office;
        • Through the continued leadership of Governor Brown, California joined the
          federal public/private partnership H2USA and entered into multistate ZEV action
          agreements (Multistate ZEV Action Plan, Pacific Coast Collaborative).

    AB 8 reinforced California’s commitment to fuel cell electric vehicles and other ZEVs and the
    transformation of personal and commercial transport in the state. AB 8 provides particular focus
    on development of the state’s hydrogen fuel station network. In addition to AB 8 and ARB’s
    Scoping Plan, Governor Brown’s Executive Order B-16-20121 provides another strong policy driver
    for accelerating commercialization of FCEVs and their associated hydrogen fuel station network.
    These policy drivers give clear direction for the California Air Resources Board (ARB) and CEC to
    plan and fund the state’s hydrogen fuel station network for its imminent FCEV market. The two
    agencies have been working diligently on the state’s hydrogen network, and these efforts
    demonstrate progress towards the State’s ZEV Action plan.

    The hydrogen fuel station network is a key component of meeting the State’s goals for air quality,
    renewable fuel use, and greenhouse gas mitigation. The magnitude of changes necessary to
    achieve the National Ambient Air Quality Standard for ozone and the State’s greenhouse gas
    reduction commitments requires a substantial fleet of fuel cell electric vehicles and other ZEVs, in
    order to move the state away from conventionally fueled vehicles.

    AB 8 requires ARB to assess the size of the current and future FCEV fleet annually, based on
    vehicle registrations with the Department of Motor Vehicles (DMV), auto manufacturer responses
    to ARB surveys of projected future sales, and current and future hydrogen fuel station locations
    1    1B-16-2012 directs ARB, CEC, and other relevant agencies to take actions that will help the deployment of over
         1.5 million ZEVs in California by 2025, with easy access to fueling infrastructure supported by a strong, and
         sustainable industry. The order also requires 25% of the State’s new vehicle purchases to utilize ZEVs by 2020.

2   Executive Summary
and capacity. This information informs the State’s             Recent Key Automaker Activities
decisions for future funding of hydrogen fuel stations,        June 2014: Hyundai became first in the
including the number and location of stations as well as       state to lease a production FCEV to a
minimum technical requirements for those stations.             private consumer. This followed its
                                                               announcement in November 2013 to
This report represents ARB’s first annual evaluation
                                                               lease Tucson FCEVs worldwide, with
pursuant to AB 8. The period from 2014 to 2017 is
                                                               a spring 2014 target for availability in
projected to be a transition from technical and market
                                                               Southern California.     Some cars have
demonstration of FCEVs to beginning the early
                                                               already arrived and have been seen visiting
commercial market. Funding under the directive
                                                               local hydrogen fuel stations.
of AB 8 will be sufficient to accommodate multiple
auto manufacturers’ commitments to bring FCEVs                 June 2014: Toyota unveiled its production
to the market. Pursuant to AB 8, ARB has determined            FCEV, expected to have about 430 mile
the following:                                                 range and performance comparable to
                                                               gasoline fueled vehicles, with a 2015 target
 • 125 FCEVs are currently registered with DMV.                launch for California.
 • Auto manufacturer projections indicate that                 Nov. 2013: Honda introduced a concept
   California’s FCEV fleet will grow to 6,650 by               FCEV for market launch in 2015 in the US
   the end of 2017 and 18,500 by the end of 2020.              and Japan.
 • A total of 51 stations are expected to be                   2012-2013: BMW and Toyota; Daimler, Ford
   operational statewide by the end of 2015,                   and Nissan; and GM and Honda entered
   providing up to 9,400 kg/day of hydrogen.                   into or expanded existing partnerships
 • The coverage and capacity provided by these                 and agreements for further development
   stations will be nearly sufficient through 2018 to          of their FCEV and related technologies.
   support the FCEV fleet within that timeframe.
 • However, the coverage and capacity provided
   by these stations to be funded under the latest
   CEC award will not be sufficient for
   the expected vehicles out to 2020.
 • Additional coverage and capacity needs in 2020 will require up to 49 additional stations.
 • Therefore, CEC should maintain the course – the maximum $20 million allocation
   and any other potential funding sources identified by ARB and CEC should be utilized
   in the next CEC funding program for hydrogen fuel stations, with placement and
   other considerations as recommended in the findings and the main report.

ARB staff has developed six principal findings and suggestions to inform these determinations.
The remainder of this report is structured to discuss these findings and determinations in more
detail and provide context and supplementary information. The section immediately following
this Executive Summary identifies ARB’s findings along with the AB 8 provisions the findings are
intended to address. This is followed by the main body of the report, which provides additional
details in support of the findings.

                                                                                      Executive Summary       3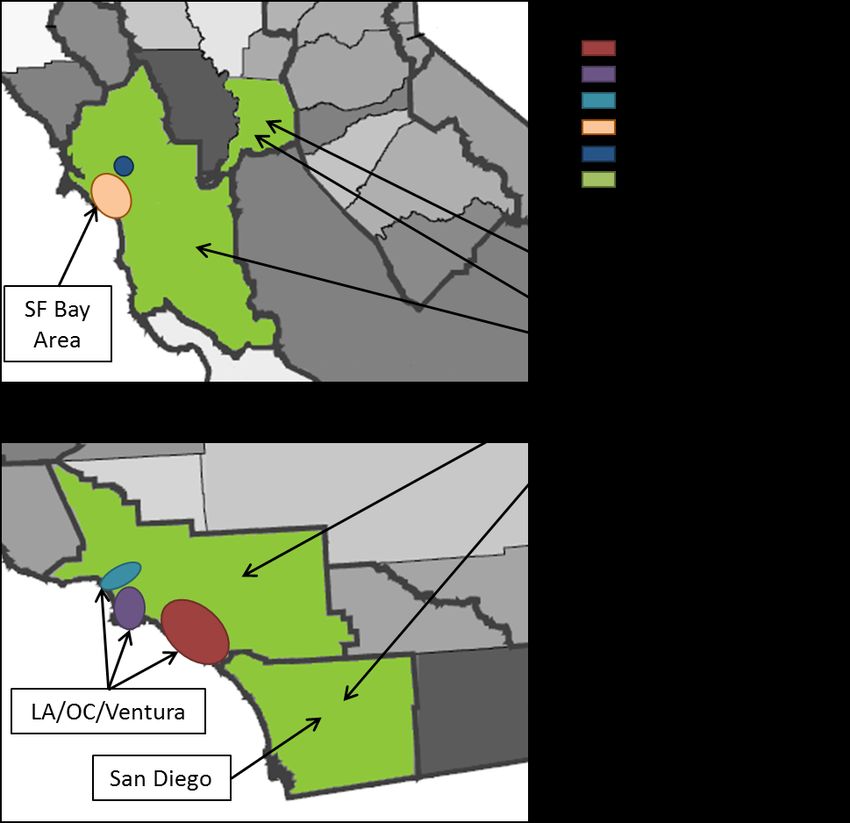
Findings
    Finding 1: The fuel cell electric vehicle fleet is poised to grow rapidly.
    As Figure ES1 shows, auto manufacturers project a rapid acceleration in the number of vehicles
    coming to California beginning in 2015 and sustaining this growth at least to 2020, the last year
    included in the current ARB survey. By 2017, the state’s fleet is expected to grow to more than
    6,600 vehicles and, by 2020, to nearly 18,500 vehicles. Three auto manufacturers have publicly
    announced plans for major vehicle launches in model year 2014/2015, and more announcements
    are expected in the near future.

    Figure ES1: Current and Projected Cumulative Vehicle Populations

    Supplement to Finding 1: The rollout of fuel cell electric vehicles is expected
    to follow a trajectory similar to other recent advanced technology vehicles.
    Toyota’s experience with hybrids over the past 20 years provides useful perspective on the
    expected rollout process for FCEVs. On this basis, Dr. Tom Turrentine of UC Davis has suggested
    that introducing a new vehicle technology generally follows a multi-phase process, defined
    primarily by the progression of vehicle generations, but also correlating to years following vehicle
    technology launch.

    Figure ES2 reproduces Dr. Turrentine’s concept of the           “For years, the use of hydrogen to power
    three vehicle introduction phases; each of these phases         automobiles has been seen by many smart
    is characterized by different types of consumers, as            people as a foolish quest. That point of view
    noted. Comparing California’s historical sales of hybrids       is reminiscent of opinions 20 years ago
    to historical and projected sales of battery electric (BEV)     of how the Prius hybrid was nothing more
    and plug-in hybrid (PHEV) vehicles indicates that PHEVs         than a science project… and economically
    and BEVs are following consumer acceptance and sales            unfeasible. Change takes persistence.”
    trajectories consistent with Dr. Turrentine’s observations
    of hybrids. FCEVs are at the earliest point of commercial       – Bob Carter (Sr. V.P. for Auto. Operations)
    deployment, at the first model year of the first phase.         at Toyota’s unveiling its FCEV concept car
    Nevertheless, California’s past experience suggests             at the 2014 Consumer Electronics Show.

4   Findings
the FCEV market may develop similarly to other advanced technology vehicles, provided the
hydrogen fuel station network is established ahead of FCEV introduction.

Figure ES2: Hybrid Electric Vehicle Launch Trend

Finding 2: California’s committed and planned funds for the hydrogen fuel station
network appropriately address the growing numbers of FCEVs in the state during
initial vehicle launch, but continued funding is needed to meet future demand.
Two guiding principles, station coverage and capacity, underlie the process of determining the
number and location of stations necessary to support commercial FCEV deployment. Station
coverage emphasizes adequate hydrogen fueling outlets in areas of high demand; in the
early years of the FCEV rollout, this can entice early adopters by ensuring positive consumer
experiences. For the initial rollout of 100 stations (the minimum to be supported under AB 8),
five key markets or “clusters” have been identified for a successful FCEV launch in California.
In addition to these clusters, stations are necessary in the “Expanded Network” in anticipation
of the first markets that will develop beyond the initial target clusters. Sufficient capacity
indicates that the state’s hydrogen fueling supply chain can provide enough fuel for the FCEVs
projected to be on the road during the vehicle launch.

A: Coverage
Current hydrogen fuel station plans are expected to be well-matched to projected near-term
vehicle adoption rates and largely meet geographical coverage needs for the early adopters in
all areas other than the Berkeley cluster. The longer-term adoption rates will depend heavily on
the continued ability to provide hydrogen to the markets where vehicles are sold and used. This
requires a continued focus on incentivizing the construction of hydrogen fuel stations ahead of
the projected demand from FCEVs.

Figure ES3 shows the projected hydrogen fuel station rollout through 2020; operational and
funded stations are broken down according to the five key clusters. The successful roll out of the
51 stations expected by the end of 2015 will align well with the State’s goals to ensure fueling
stations are ready and available as soon as the near-term vehicle market is established. This
is a critical point in the process to roll out the 100-station network to ensure adequate station
coverage for the early FCEV adopters. It requires particular attention and State support for
operations and maintenance costs for station operators to maintain their stations’ availability

                                                                                            Findings   5
until vehicle volumes increase and revenue from hydrogen sales can provide sufficient income to
entice further private investment.
Figure ES3: Projected Cumulative Station Counts
B: Capacity
As shown by the intersection of the Funded Station Capacity (# of FCEVs) and Aggregated
FCEVs in Figure ES4, the current supply of hydrogen from funded fuel stations is expected to be
sufficient to meet demand out to 2018 but will be insufficient to meet projected demand from
2018 to 2020. With continued funding to support more hydrogen fuel stations, the projected
hydrogen demand in 2020 can be sufficiently addressed. The funding schedule depicted in Figure
ES4 is consistent with the State’s plan to ensure leading hydrogen infrastructure investment can
positively impact vehicle adoption rates. The intersection of the FCEV Aggregated count with
the green-shaded region demonstrates that without additional funding, the state will experience
a shortfall in supply from 2018 onward. By following the projected schedule of funding shown
by the purple region, the state can ensure sufficient supply is maintained ahead of vehicle
deployment. With the current projected number of vehicles, the 100 stations required by AB 8 will
be necessary to establish sufficient supply prior to the long-term (2020) demand.
6 FindingsFigure ES4: Need for Continued Station Investments to Support Future FCEV Fleet
Finding 3: CEC’s innovative solicitation is paving the way for a comprehensive
hydrogen fuel station network in California.
In May 2014, CEC announced awards for 28 new hydrogen fuel stations and a mobile refueler to
provide backup and auxiliary service statewide. This sent a strong market signal to investors and
continued the State’s clear commitment to provide needed funding for the development of the
hydrogen fuel station network. As shown in Table I, by the close of 2015, there are expected to
be a total of 51 stations statewide, providing adequate station accessibility and coverage to meet
consumer expectations in the near term.
Table ES1: Statewide Hydrogen Fuel Station Locations at Close of 2015
Station Count Station Locations
10 South San Francisco/Bay Area cluster
8 Coastal/South Orange County cluster
6 Torrance Area cluster
5 West Los Angeles/Santa Monica cluster
22 Expanded Network (New markets, connectors and destination)
The 28 new stations awarded by the CEC in 2014 will introduce many new hydrogen fuel station
operators (thereby diversifying the market) and achieve several goals:
1. Increase convenient access in areas of expected high vehicle adoption.
2. Establish local network for the South San Francisco/ Bay Area.
3. Establish fueling capability in key connector and destination
locations that enable trans-state travel.
4. Establish a hydrogen presence in the emerging major market of San Diego.
5. Provide operation and maintenance funding support as the market develops.
Moreover, the stations recently selected by the CEC are expected to significantly help the State
meet its renewable hydrogen goals as proscribed in Senate Bill (SB) 1505. By providing priority
incentive for stations with 100% renewable hydrogen and requiring a minimum of 33% renewable
Findings 7hydrogen for all proposals, the CEC has ensured the State’s targets will be exceeded by the
currently-planned stations.
Finding 4: The five cluster regions remain a priority for future funding.
Berkeley in particular requires the establishment of a local retail hydrogen
network. San Diego and Sacramento also require attention.
Past State funding, including CEC’s 2014 announcement, has mostly addressed the short term
localized hydrogen refueling needs for four of the five clusters identified by stakeholders through
the CaFCP 2012 Road Map for hydrogen infrastructure. In the long term, these clusters will
individually require a focus on additional coverage and capacity to meet the expected demand
and provide measures of redundancy.
Ongoing discussions with automakers indicate the Berkeley cluster will be an early target market;
however, the cluster is not expected to have the capability for retail service once the first vehicles
arrive in California. Thus, of the five high-priority early market clusters, Berkeley will require
highest priority for near-term funding. An initial investment in two new stations within the area is
needed to help establish a local hydrogen network and incentivize local vehicle deployment.
San Diego and Sacramento will soon have their first operational stations. Though not included in
the five key clusters, the markets in these areas have the potential to grow into future clusters and
will likewise need to receive substantial focus in the near future.
Table ES2 provides an initial set of recommended locations for the next set of hydrogen fuel
stations based on ARB staff’s analysis.
Table ES2: Draft Recommendations for Near-Term Station Funding
Location Purpose Suggested Station Counts
Berkeley Cluster Establish Market 2
South SF/Bay Area Cluster Coverage/Capacity 1
Coastal/ South OC Cluster Coverage/Capacity 1
West LA/SM Cluster Coverage/Capacity 1
Torrance Cluster Coverage/Capacity 2
San Diego Area Coverage 1
Sacramento Area Coverage 1
Expanded Network Areas Coverage or Destination/Connector 1 or 2
Finding 5. Continued incentives are needed for increased station fueling capacity
and innovative technology. Continued development of policies is needed to meet
retail customer and station investor expectations.
FCEV drivers will expect a fueling experience comparable to conventional gasoline vehicles,
with prominent station availability allowing drivers to take full advantage of their vehicles’ long
driving range. Thus, a well-planned hydrogen fuel station network will be a major component of
consumer acceptance of the new technology, as localized fuel availability will play a significant
role in vehicle purchase decisions. The State is committed to ensuring that FCEV drivers
experience a near seamless transition to refueling with hydrogen. To this end, retail customer
expectations need to be addressed by the technical capabilities and design capacities of the new
hydrogen fuel stations. Incentives for continued innovation in areas of station design, including
back-to-back and consecutive fills, should remain a focus of future State funding. Additionally,
station data collection and reporting, including real-time status, will inform the State and
station developers of needs and best practices for the ongoing development of the network and
individual station designs.
8 FindingsFor station investors, the need for certainty in their investments will help drive further station
development, both for publicly and privately funded stations. In its station awarding process
for publicly funded stations, CEC already considers location siting criteria, along with the
environmental protections built into State law, and should continue to do so. To further
strengthen this market signal and accelerate investments in the station network, ARB staff is
investigating the feasibility of concepts governing the siting of both publicly and privately funded
hydrogen fuel stations, pursuant to specified air quality and market sustainability criteria, which
will help ensure a sufficient demand for each station’s hydrogen. ARB staff is also exploring
ways to enhance existing State fuels programs, such as the Low Carbon Fuel Standard (LCFS), to
further strengthen the market signal to station builders and auto manufacturers.
Additional details on this finding are presented in the body of the report.
Finding 6: Completion of ongoing projects to address station performance
certification (validation, quality, and accuracy) is necessary to ensure a smooth
transition to retail hydrogen fuel sales.
Technical capabilities of hydrogen fuel stations are constantly improving, and it is essential to
maintain the pace of innovation. Challenges remain for the development of a set of industry
standards for performance certification of fueling stations. The State can provide guidance to
station builders and operators by continuing ongoing participation in defining these standards
and developing capabilities for their implementation. Multiple interagency projects are currently
under consideration to support the rapid development of standards for dispensed hydrogen
purity, accuracy in measuring dispensed hydrogen mass, and simultaneous and back-to-back
vehicle fills.
Findings 9Conclusions
Transformation requires vision, commitment, and action. California is taking the necessary
actions and committing substantial public funds to begin turning the singular vision of zero
emissions transportation into reality. Those actions are putting the state on the path to a zero
emissions future in which FCEVs and BEVs are effective, “no compromise” alternatives to
conventionally fueled vehicles. There are challenges ahead on this path to building the hydrogen
fuel station network, and the State must remain vigilant in maintaining its commitment and
responding to the evolving market.
The success of the hydrogen fuel station network and the FCEV rollout are interdependent.
California’s station funding programs have established the basis for a fueling network to provide
assurance to auto manufacturers that the necessary infrastructure will be in place to support
their markets. Likewise, auto manufacturers must respond in kind by committing to increased
deployment of FCEVs by orders of magnitude so that station builders will have certainty of a
robust market for their stations. Thus, this report also serves as a call to action for the auto
manufacturers to enhance their vehicle deployment strategies in response to California’s ongoing
fueling network development. Actions such as Hyundai’s delivery of the first mass-produced
FCEV to California initiate the needed progress; however, these actions must be replicated and
amplified many times over by multiple auto manufacturers for this market to succeed.
10 FindingsI: Introduction
Through a growing understanding of the impact of light duty vehicle emissions on air quality
and climate, the State of California has spent decades devoted to developing programs and
technologies to mitigate the harmful effects of vehicle emissions. Significant progress has been
made, but studies from a variety of experts have also repeatedly demonstrated that California
must not only maintain its focus on reduced emissions, but pursue even more effective solutions
than have been utilized to date. Long-term goals, such as the greenhouse gas targets in Assembly
Bill (AB) 32, will require the implementation of highly effective technologies. Fuel cell electric
vehicles (FCEV) have been identified as one such effective technology solution to address these
challenging air quality and climate goals. The following criteria pollutants and greenhouse gases
emitted by conventional vehicles are absent in FCEV tailpipe emissions:
• Nitrogen oxides: Precursors to photochemical smog and ground-level ozone; ozone
has been linked to a number of cardiovascular and respiratory diseases.
• Carbon monoxide: A powerful asphyxiant in confined
spaces and a precursor to greenhouse gases.
• Sulfur dioxide: A precursor to acid rain and a respiratory irritant.
• Particulate Matter: Hydrocarbon-based particles that have been linked to a number
of cardiovascular and respiratory diseases; this category also includes particles
made entirely of carbon from unburned fuel, known as black carbon.
• Volatile organic compounds: Various organic gases that can indirectly
affect cardiovascular and respiratory health, smog, and climate.
• Carbon dioxide: A greenhouse gas that is a significant
constituent of gasoline combustion products.
• Methane: Another greenhouse gas with a global warming
potential more than 20 times that of carbon dioxide.
• Nitrous Oxide: Another greenhouse gas with a global warming
potential nearly 300 times that of carbon dioxide.
Additionally, California’s experience with developing hydrogen production technology has
demonstrated that fuel lifecycle emissions (accounting for production, transportation, delivery,
and use of the hydrogen) can be reduced significantly below those of gasoline; for some
hydrogen production methods, emissions can be all but completely eliminated. Moreover,
multiple production methods have demonstrated the ability to utilize up to 100% renewable
process and/or feedstock energy. These considerations are all crucial to the motivation and
goals of the Air Resources Board’s (ARB) current Zero Emission Vehicle (ZEV) program. Thus,
FCEVs, along with other alternative vehicle technologies like battery electric and plug-in hybrid
electric, have been prioritized for incentive programs to support their market development and
adoption within the state. Each alternative vehicle technology faces its own unique challenges
in implementation and adoption. For the FCEV, the need for a substantial and purposefully-
designed network of hydrogen fuel stations has been identified as a primary challenge that can
be addressed by State programs.
As a result, AB 8 (Alternative Fuel and Vehicle Technologies: Funding Programs), signed by
Governor Brown in September 2013, dedicated up to $20 million per year for the California Energy
Report 11Commission (CEC) to fund hydrogen fuel stations. In addition, the legislation directs ARB and
CEC to plan and fund the development of an economically-viable and ultimately self-sustaining
hydrogen fuel station network to enable market launch and growth of FCEVs within the state [1].
Particularly germane to this report, AB 8 requires that:
1. ARB aggregate and make available current DMV registration counts of FCEVs
and auto manufacturer projections of future vehicle placements.
2. Beginning in June of 2014, ARB will provide CEC an annual evaluation
of the need for additional hydrogen fuel stations, geographic
areas of need, and minimum operating standards.
3. Beginning in December of 2015, ARB and CEC jointly review and report on the
annual progress towards establishing the state’s hydrogen refueling network.
The analysis included in this report addresses the first two of these requirements. It builds upon
data sources specified by AB 8 and information gained through ARB’s continued interactions
with industry, academic, and government stakeholders. In order to facilitate the effort, ARB
has developed and utilized a database-driven hydrogen and FCEV accounting tool to evaluate
hydrogen supply and demand. Inputs to the tool include number and placement of hydrogen
fuel stations, and number and placement of FCEVs based on DMV registration data and auto
manufacturer surveys.
The vehicle data and needs assessment developed in this report are therefore intended to provide
an objective analysis of CEC’s recent 2013/2014 awards and help guide the development of the
next funding program, for 2014/2015. Currently, the hydrogen fuel station network and FCEV
fleet are in an early demonstration phase. California has recently been the focus for introduction
of the first mass-market product, the Hyundai Tucson FCEV, and rollout announcements from
Toyota and Honda. Auto manufacturers have established alliances for technical collaboration.
Furthermore, in addition to the work in California, large public-private efforts for hydrogen fuel
station deployment are taking place in Japan, Germany, and the United Kingdom. It is anticipated
that the next five years will be a period of rapid acceleration in growth and development planned
for both FCEV deployment and hydrogen fuel station installation. The assessments in this report
address two main topics: 1) present-day trends of the nascent hydrogen FCEV market and 2)
forecasts for the industry during its early growth phase in California.
California has had a longstanding commitment to funding the construction of hydrogen
fuel stations, much of which has provided valuable data and lessons during the industry’s
demonstration and development phase. Experience with these early stations has led to better
planning. This experience has also made it possible to determine best practices for siting and
designing stations. The span of years from 2014-2017 is a turning point in the industry, moving
from demonstration to establishment of the first commercial markets. As part of planning to
accommodate this advancement in the market, State funding of hydrogen fuel stations has
allowed for standards and codes for increasingly better station equipment, such as higher
pressure on-site storage that reduces the needed number of on-site compressors, or the use of
compressors that improve efficiency by using ionic fluid. Through coordination between CEC,
ARB, and industry stakeholders, new stations meet high standards of operation through adoption
of the following:
1. Standardized and consensus-based hydrogen fueling protocols
based on the capabilities of currently-available technologies
2. Incentives for early completion of station construction
3. Continued requirements for use of renewable feedstock
and priority for 100% renewable stations
4. Continued priority for stations with lower greenhouse gas emissions
12 Report5. Planned capability to operate with a mobile backup refueler
6. Construction of a mobile backup refueler able to provide statewide service.
Stations funded under these guidelines will be capable of providing the user-friendly service
essential for a successful vehicle launch. When construction is completed, the last round of State
funding will lead to a sufficiently large number of stations to support initial vehicle deployment
in most local markets for the next few years. With the latest CEC station funding awards, ARB
anticipates 51 stations operating by the end of 2015.
The CEC’s last solicitation for hydrogen fuel stations was dramatically oversubscribed; 61
proposals were received, totaling $102 million in funding requests, well above the $20 million
annual appropriation indicated in AB 8. This enabled the CEC an opportunity to fund a larger-
than-expected number of stations by moving forward funds from the 2014/2015 program, a
step consistent with the State’s commitment to supporting a network that can supply sufficient
hydrogen for the vehicles that will be on the road in the near future. In so doing, previously
unaddressed target markets will now have significant hydrogen fueling capacity, as will new
destination and long-distance connector sites. As the network grows, the learnings about
station characteristics and performance standards will continue to evolve and lead to on-going
optimization and improvements. If there is again a strong response with multiple high value
proposals, the Commission could use an award process similar to that implemented in the recent
program. ARB staff would work closely with CEC staff to ensure that the future awarding process
is again consistent with the best available information.
Moreover, the latest solicitation issued by CEC introduced some key characteristics not previously
implemented in station funding programs. In recognition of the State’s goals for renewably-
sourced fuels, and in accordance with the requirements outlined in Senate Bill 1505 (Statutes
of 2006, Chapter 877), CEC prioritized incentives for the construction of stations utilizing
100% renewably-sourced hydrogen. CEC was able to fund two such stations as a result of the
solicitation. Additionally, all station proposals were required to demonstrate a plan for sourcing
at least 33% of production energy (process and/or feedstock) from renewable resources, ensuring
that the currently-funded network will be able to meet the SB 1505 goals once construction is
complete. The other important addition was the provision of operation and maintenance funding
for up to three years available to all qualifying stations, operating, in construction, or awarded
by the solicitation. This funding improves the business case for investors who choose to address
California’s need for hydrogen infrastructure in the earliest stage, when total hydrogen sales
may not be as high as their potential when compared to the future years of the FCEV rollout.
By providing this funding upfront, CEC can help ensure these stations will remain open and
operational as the vehicle rollout steadily progresses.
This first annual June report directly addresses the requirements of AB 8, and provides additional
context and supplemental information. The report is organized thematically, with an overarching
focus on developing the evaluation of how well current infrastructure plans meet projected
vehicle demand, sequentially addressing hydrogen demand, hydrogen supply (referred to as
capacity), and refueling station performance requirements. These analyses are addressed by the
report in the following manner (all section references are to the Health and Safety Code unless
otherwise noted):
Chapter II: Location and Number of Hydrogen Fuel Cell Electric Vehicles
Based on DMV records and auto manufacturer projections specified in section 43018.9(c)
(1) and (c)(2), ARB has developed an estimate of the statewide and regional FCEV fleet out to
2020. This establishes the basis for defining current and future hydrogen demand. Given the
emphasis throughout AB 8 for regionally-specific analyses, Chapter II also presents a brief
overview of ARB’s methodology for evaluating the hydrogen network on regional scales.
Report 13Chapter III: Expected Vehicle Deployment Based on Past Experience
with Advanced Technology Vehicles
Chapter III provides an extended background to support the analyses and findings of Chapter
II; thus, it provides additional context for the material presented to meet the requirements of
section 43018.9. Additionally, this Chapter provides an independent reference to validate the
FCEV fleet rollout numbers provided by auto manufacturers required by section 43018.9(c)(1).
Chapter IV: Location and Number of Hydrogen fuel stations
Section 43018.9(d)(1) and (d)(2) require an analysis of the fueling coverage provided by
the operational and funded fueling network. Analysis of coverage requires matching
projections of localized vehicle deployment and adoption to localized infrastructure
plans. Convenient access to sufficient hydrogen fuel stations to enable daily FCEV
consumer driving habits underlies the evaluation of station coverage required in
AB 8. Chapter IV assesses the known hydrogen fueling network on this basis and
supplies recommendations for future station locations to meet coverage needs.
Chapter V: Evaluation of Current and Awarded Hydrogen Fueling Capacity
Section 43018.9(d)(1) requires an evaluation of the quantity of additional hydrogen
needed (additional capacity) beyond currently operational and funded stations. Chapter
V therefore compares the planned hydrogen capacity to the projected demand, utilizing
the balance as a guideline for determining the additional required capacity. Though
defined separately in AB 8, coverage and capacity are interrelated concepts and the
analysis of Chapter V builds from and incorporates the analysis presented in Chapter IV.
Chapter VI: Hydrogen Fuel Station Performance Standards and Technology
Chapter VI addresses the final topic area of section 43018.9 (d)(2), minimum operating
standards for hydrogen fuel stations. The analysis considers topics of customer experience,
station planning and design, and operational performance. Analyses of the current stations
and recommendations for short- and long-term development goals are provided.
Chapter VII: Conclusions and Recommendations
Section 43018.9(d)(1) and (e)(1) require ARB to recommend the funding level for CEC’s next
funding program (up to $20 million per year), geographic areas that will require increased
coverage and/or capacity to meet their hydrogen refueling needs, and minimum station
operating standards. ARB has condensed the analyses of previous chapters into a quickly-
referenced list of recommendations for CEC’s upcoming Program Opportunity Notice.
14 ReportII: Location and Number
of Hydrogen Fuel Cell
Electric Vehicles
AB 8 Requirements: Estimates of FCEV fleet size and bases for evaluating
hydrogen fueling network coverage.
ARB Actions: Distribute and analyze auto manufacturer surveys of planned
FCEV deployments. Analyze DMV records of FCEVs. Develop correlations
between survey regional descriptors and widely-accepted stakeholder
frameworks for evaluating coverage.
As part of its responsibilities under AB 8 and under the authority of ARB’s Low Emission Vehicles
(LEV III) program [2,3], ARB distributed mandatory surveys to 16 auto manufacturers in March
2014. Confidential responses were collected by April 2014. The surveys requested information on
the auto manufacturers’ planned deployment of FCEVs in California for the current model year
and the next three model years. Auto manufacturer vehicle projections were specified within
five geographic regions (“San Francisco Bay Area”, “Sacramento Area”, “Los Angeles/Orange
County/Ventura”, “San Diego”, and “Other”) and as statewide totals. In addition, ARB distributed
an optional supplementary survey to the same respondents to request 3-year statewide
aggregate totals for vehicle deployments in model years 2018 to 2020. Thus, auto manufacturers
had the opportunity to provide year-by-year regionally distributed data of projected vehicle
deployments for model years 2014 through 2017 as well as statewide, aggregated deployments
for the model years 2018 through 2020.
ARB’s database tool aggregates vehicle numbers by calendar quarters. Annualized aggregates
are then calculated as the average, sum, or maximum over four quarters, as appropriate.
Additionally, the database works at the ZIP code-level for station placement analysis. Every
ZIP code in the database is then linked to both its corresponding air district and cluster. A
cluster is a group of communities and neighborhoods with similar vehicle usage patterns and,
importantly, a potential for high FCEV adoption rates. The cluster definitions implemented in
the tool are adopted from the California Fuel Cell Partnership’s (CaFCP) 2012 Road Map for the
commercialization of FCEVs [4].
Currently, the Road Map identifies five main clusters throughout the state. Coordinated hydrogen
fuel station network development and vehicle deployment within the clusters will build a
robust early market and provide motivation for continued geographical expansion of vehicle
deployment. As published in their Road Map, the CaFCP’s members determined through an
iterative process that early market launch of FCEVs will be enabled by 68 strategically placed
stations, two thirds of which would be located in the clusters. Similarly, AB 8 set a target of 100
stations as the minimum number of stations the State would need to support in order to enable a
transition to a market-driven and increasingly privately-funded network.
The auto manufacturer surveys provide projected counts of vehicle deployment grouped by
model year. But model year does not directly correlate to calendar year of sales/deployment of
Report 15vehicles. Moreover, auto manufacturer data are projections of delivery to dealers; the date for
vehicle purchase or lease and when the vehicle is in use is unknown until subsequent years of
DMV data can be obtained. Accordingly, ARB made the following assumptions:
1. Unless otherwise indicated by an auto manufacturer, half of the vehicles reported for a
given model year are assumed delivered in the calendar year preceding the model year;
the other half are assumed delivered in the calendar year corresponding to model year.
2. All vehicles are assumed to be on the road from the first quarter of the year of
delivery. This allows for an estimate of the upper bound of hydrogen demand.
Auto manufacturers were provided information of projected numbers of statewide stations
and requested to provide projected vehicle placement by region. Figure 1 demonstrates
how ARB translated regional distinctions in survey responses into the clusters and air districts
implemented in the database tool. In the figure, colored areas correspond to clusters and the map
boundaries correspond to air districts. Stations outside of clusters are located in regions
considered to be the “Expanded Network” and are intended to provide service in areas where the
market may expand beyond the early target clusters. The Expanded Network definition is adopted
from the CaFCP Road Map, similar to the cluster definitions. Expanded Network locations could be
targeted areas for increased coverage, destination or connector sites, or network backup
and redundancy. Distribution from one survey region to multiple clusters or districts followed the
annually varying trends of station counts. This regional distribution scheme was utilized
throughout the ARB analysis to provide localized context of vehicle deployment, hydrogen
demand, and fueling station installation.
16 ReportFigure 1: Map of Auto Manufacturer Vehicle Placement within CaFCP Clusters and Expanded
Network (Colored Areas), and Air Districts (Map Boundaries) According to Survey Regions
(Text Boxes)
Report 17Figure 2: Statewide and By-Cluster Cumulative Vehicle Populations
Based on CaFCP data, Auto Manufacturer Surveys and Station Distribution
Based on the above, annualized vehicle populations were calculated as the average over four
quarters, taking into account assumed attrition rates consistent with ARB’s EMFAC model [5].
This accounts for factors such as voluntary vehicle retirement, retirement due to accidents,
planned non-operation, and transfer of vehicles out of state. The resulting statewide projections
for the future FCEV fleet are over 6,600 vehicles on the road in California in 2017 and nearly 18,500
vehicles in California in 2020. Figure 2 provides the split by cluster for the 2013-2014, 2017, and
2020 timeframes.
From the 2020 projections, approximately half of the vehicles will be located within the five
clusters. Of those vehicles within the clusters, approximately two-thirds are projected to be
deployed in the three southern California clusters, and the remainder predominantly in the South
San Francisco/ Bay Area cluster.
Figure 3 further breaks down Figure 2’s vehicle projections within the expanded networks.
As shown in Figure 3, within the Expanded Network category, deployments are expected to occur
mostly in the South Coast Air District, within the greater Los Angeles communities outside the
clusters. The distribution of vehicles are expected to show an approximate 2-to-1 split between
southern and northern regions of the state. For 2018-2020, staff assumed the vehicle distribution
across the state follows the same proportions as in the 2017 period.
Comparing the projected statewide vehicle counts across the periods shown in Figure 2 suggests
auto manufacturers are planning a rapid acceleration in the number of vehicles brought to market
for the 2015 to 2020 timeframe. This is consistent with the current announcements indicating that
2015 through 2017 will be significant launch years for a number of vehicle manufacturers. For
18 Reportthese reasons, the rate of hydrogen fuel station deployment also needs to be sustained and the
fueling network needs to be ready for the arrival of the vehicles. Once open, it is vitally important
that stations remain operational and functionally available so that the planned vehicle launches
can be successful.
Figure 3: Expanded Network Auto Manufacturer FCEV Deployment by Air District
AB 8 also requires ARB to report the total number of hydrogen FCEVs registered with DMV
through April of the current year. DMV currently has registrations for 125 vehicles; this is lower
than industry estimates of the current FCEV population at around 230 vehicles. DMV counts may
be smaller for a number of reasons: FCEVs may be registered by auto manufacturers in other
states but operated in California and included in industry counts; FCEVs may currently be in
California but not yet placed with customers and therefore not yet registered to DMV; or industry
counts may not consider retirements and relocations. Thus, the lower number represented by
DMV registrations is likely a more accurate representation of the statewide fleet utilizing today’s
existing fueling infrastructure.
The count of vehicles registered to DMV is small in comparison to the auto manufacturer
projections of vehicles from 2015 onward, especially in the northern areas of the state. Therefore,
the current DMV-registered population should not be considered an indicator for the eventual
fleet distribution. However, it is worth noting that comparing statewide DMV data to current auto
manufacturer plans indicates nearly a seven-fold increase of the current FCEV fleet within the
year. Reaching the projected number of FCEVs in 2015 will be a landmark in California’s fleet.
Report 19III: Expected Vehicle Deployment
Based on Past Experience with
Advanced Technology Vehicles
(Corollary to Chapter II)
AB 8 Requirements: Estimates of FCEV fleet size and bases for evaluating
hydrogen fueling network coverage.
ARB Actions: Distribute and analyze auto manufacturer surveys of planned
FCEV deployments. Analyze DMV records. Develop correlations between
survey regional descriptors and widely-accepted stakeholder frameworks
for evaluating coverage.
Consumers historically adopt new vehicle technology through a gradual process, with
early adopters of the technology kick-starting demand for the new vehicles. Based on past
experience, the same may be true with FCEVs, provided sufficient fueling station installation
prior to vehicle launches.
Dr. Tom Turrentine of UC Davis has shown that introducing a new vehicle technology generally
follows a multi-phase process, shown here in Figure 4. The shaded regions of the figure are
conceptual phases in the launch of new vehicle technology.
Dr. Turrentine developed this framework based on observations of Japan’s launch of hybrid
vehicles (which is slightly longer than California’s) [6]. Each shaded phase corresponds well to
a new generation of the vehicle technology and by extension to a period of time following the
vehicle technology’s first introduction.
In Figure 5, the timing of Dr. Turrentine’s conceptual phases has been applied to California’s hybrid
fleet and other advanced technologies. Figure 5 utilizes data obtained from current and past ARB
studies and displays historical rates of initial vehicle deployment for conventional hybrid, and
historical and projected battery electric (BEV), and plug-in hybrid (PHEV) vehicles. The dip in year
nine sales of hybrids reflects the general economic downturn at the end of the last decade.
Based on experience with hybrids in both markets, there is an initial “Early Market” phase that
exhibits a steady acceleration of vehicle adoption, most prominently fueled by the purchase
choices of technology first adopters. The “Fast Followers” phase begins to show the first
signs of a wider market entry, with a more consistent rate of vehicle adoption. Note that even
in this second phase, sales of the new technology are less than 10% of all new vehicle sales.
Finally, based on the example of sales in Japan, the “Early Core Market” develops, with a rapid
acceleration of vehicle adoption rate, fueled by broad market acceptance of the technology.
California’s hybrid market appears to be on the cusp of this third phase.
20 ReportAll other advanced vehicle technology platforms are currently in the first phase of deployment,
when vehicle sales volumes are expected to be small, but there is the possibility for a near-
term rapid acceleration. The data in Figure 5 for BEV and PHEV represent actual sales and
projections, especially in their later years. The FCEV fleet is exceptionally young compared to
the other technologies. It is only recently that the very first commercial model year FCEV has
been introduced to California. It is expected that as the vehicle launch progresses, following
the installation of hydrogen fuel stations, the FCEV fleet will likely exhibit adoption rates with
characteristics similar to the hybrid, PHEV, and BEV. PHEVs and BEVs entered the market with
significantly smaller infrastructure requirements due to the ability to refuel at home. Installation
of the necessary hydrogen infrastructure ahead of vehicle introduction will likely be the key factor
in accelerating FCEV deployment beyond the projections currently available.
Figure 4: Hybrid Vehicle Technology Launch Trend and Projection
Figure 5: Comparison of Hybrid Vehicle Launch Trend and Projected
Advanced Technology Vehicle Launch
Report 21IV: Location and Number
of Hydrogen Fuel Stations
AB 8 Requirements: Evaluation of hydrogen fuel station network coverage.
ARB Actions: Determine the regional distribution of hydrogen fuel stations
in early target markets. Assess how well this matches projections of regional
distribution of FCEVs in these markets. Develop recommendations for locations
of future stations to ensure hydrogen fueling network coverage continues to
match vehicle deployment.
A: Overview of Coverage Concept
It is broadly acknowledged within AB 8 and by CEC, ARB, and stakeholders that maintaining
sufficient hydrogen fueling capacity for vehicles is only one of two major aspects required to
support the deployment of FCEVs. The first essential aspect is the geographic coverage of the
hydrogen fuel station network. The idea of coverage stresses the importance of the location
of each fueling station as a metric of the effectiveness of the network in providing convenient
service to FCEV drivers. Prior work referenced in the Fuel Cell Partnership’s Road Map indicates
that a maximum six minute drive-time is the optimal distance between stations, balancing
customer convenience with total investment cost [7]. In many areas of the state, this equates to
a small driving distance. Thus, stations must be built near projected vehicle placements in order
to optimize vehicle adoption by consumers. Customer perceptions that stations are too far for
convenient access can affect their purchasing decision and ultimately hinder cumulative FCEV
deployment. Similarly, auto manufacturers cannot foster consumer confidence without the ability
to identify nearby hydrogen fuel stations; without fueling capability, customers will not buy a
FCEV. Moreover, properly-planned coverage can enhance station utilization (and therefore the
effective investment of State funds).
Thus, it is imperative that priority is given to building stations in areas of projected vehicle
adoption. These stations must precede the vehicle placements themselves. This is especially true
leading up to the early years of deployment when consumer confidence and education in a new
technology and infrastructure will play a major role in the real deployment scenario. Coverage
is therefore used to convey the concept that the serviceable areas of the planned stations will
properly and fully align with and cover the areas of projected need.
At present, this coverage metric can only be broadly applied to large geographic regions;
however, it is the intent that as time progresses, coverage can be assessed at community and
neighborhood scales. Furthermore, it is the goal of AB 8 to support the development of the
hydrogen FCEV market until at least 100 stations are built. Thus, tracking the regional distribution
of station counts is vital to an assessment of the state’s hydrogen fuel station network.
B: Current Operational and Funded Station Coverage
There are currently nine stations in operation and able to provide hydrogen to the public, either
with or without familiar retail sales features. With the exception of one station in Thousand Palms
and another in Emeryville, these stations are exclusively in the Coastal/South OC, Torrance, and
West LA clusters, as can be seen in Figure 6. This region has historically been considered the
22 Reportfocus area of many auto manufacturers’ initial deployments and many of the associated stations
were involved in early research and fleet demonstration projects. It is expected that most of these
stations will transition into full public service. A full list of stations and their characteristics is
provided in the Appendix.
Figure 6: End-of-Year Station Counts by Cluster and Statewide
25 4 6 8 9 23 51 60
Statewide Totals 50
20
Cumulative Stations
40
15
30
10
20
5 10
0 0
2010 2011 2012 2013 2014 2015
Berkeley Coastal/South OC Torrance
West LA/SM South SF/Bay Expanded Network
This focus on the South Coast is expected to continue into 2014, with funded but not yet open
stations largely planned for construction in the same regions, as illustrated in Figure 7. In the
map, a distinction is made between the stations funded with the original appropriation (yellow
markers: Funding Awarded ’14) and the stations funded through the additional application of
2014/2015 funds (purple markers: Funding Awarded ’14 + $20M). Due largely to the stations
chosen for funding under CEC’s May 2014 announcement, the clusters in the northern region
of California are also expected to begin to exhibit significant growth in coverage and capacity
in 2015. When all stations currently funded, under construction, and awarded are completed
by the end of 2015 (provided all funded projects remain on schedule), there will be a total of 51
stations operating throughout the state, providing a familiar retail fueling experience. Thus, in
terms of number of stations, by 2015 California appears to be within close reach of attaining
the preliminary goal of 68 stations strategically placed throughout the state. The projection of
68 stations represents industry and stakeholder consensus as the minimum number of stations
necessary to support the initial auto manufacturer vehicle launch, while the State’s goal of 100
stations additionally considers the needs for a transition to a market-driven industry [4].
The South SF/Bay, Coastal/South OC, Torrance and West LA/Santa Monica clusters are planned to
have significant stations counts, at 10, 8, 6, and 5 stations, respectively. While the Berkeley cluster
currently has a hydrogen fuel station in Emeryville, this station is thus far expected to not meet
retail customer demands after 2015. One station in Thousand Palms is similarly expected to be
operating but not providing a familiar retail customer experience. Given 2015 as a major launch
year, customers are likely to expect an experience very similar to current retail gasoline stations
and these two hydrogen fuel stations in Emeryville and Thousand Palms do not currently have
plans to provide this capability, though they will remain operational.
Report 23Generally, there is good agreement between the locations of planned stations and the locations
of planned vehicle deployment. Based on 2017 projections, the furthest year for which some
auto manufacturers provided information on the spatial distribution for planned deployment,
the regional proportions of vehicles and stations are nearly identical. Combining all cluster and
Expanded Network stations and vehicles into general north and south categories (with San
Joaquin and Santa Barbara attributed to the south), the 2017 proportions for vehicle fleets are
2:1 for southern and northern California, respectively. By station counts, the split is similarly 2:1;
by station capacity (shown later), the split is slightly smaller at 3:2. Thus, by all measures there is
expected to be a roughly 2-to-1 ratio of hydrogen supply and demand when comparing southern
and northern California out to 2017 and possibly 2020. This high-level spatial resolution is
currently the most appropriate for aggregate analysis, given the numbers of vehicles and stations
considered in this report.
Figure 7: Station Coverage (Existing and Planned as of May 2014)
24 ReportYou can also read