The Great Divide: What Consumers Are Buying vs. The Investments Automakers & Suppliers Are Making in Future Technologies, Products & Business ...
←
→
Page content transcription
If your browser does not render page correctly, please read the page content below
February

                                      2018

The Great Divide: What Consumers Are
Buying vs. The Investments Automakers &
Suppliers Are Making in Future
Technologies, Products & Business Models

Carla Bailo
Kristin Dziczek
Brett Smith
Adela Spulber
Yen Chen
Michael Schultz

CENTER FOR AUTOMOTIVE RESEARCH 2018        1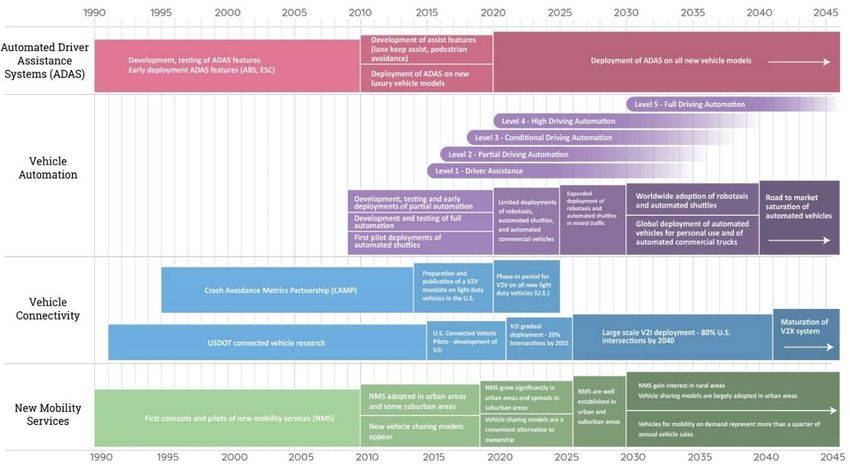
Table of Contents
Table of Contents .......................................................................................................................................... 2
Section I: Introduction .................................................................................................................................. 3
Section II: Current Market ............................................................................................................................ 3
   Segments................................................................................................................................................... 3
   Profitability................................................................................................................................................ 4
   Average Vehicle Age and Vehicle Turnover .............................................................................................. 5
   Vehicle Miles Traveled .............................................................................................................................. 5
Section III: Powertrain & Propulsion ............................................................................................................. 6
   Powertrain Market and Consumer Acceptance........................................................................................ 6
   Investment in Advance Powertrain Technology ..................................................................................... 10
   Technology Readiness Roadmap ............................................................................................................ 11
   Emissions and Fuel Economy Regulatory Climate .................................................................................. 12
Section IV: Innovative Mobility Services and Connected and Automated Vehicles ................................... 15
   Innovative Mobility Services Market and Consumers ............................................................................ 15
   Connected and Automated Vehicles Market and Consumers................................................................ 16
   Acquisitions and Investments ................................................................................................................. 17
       Noteworthy Investments and Acquisitions......................................................................................... 19
       Noteworthy Partnerships.................................................................................................................... 19
   Technology Readiness ............................................................................................................................. 20
       Testing Automated Vehicles on Public Roads ..................................................................................... 20
   Legal and Regulatory Framework of Connected and Automated Vehicles ............................................ 21
   Infrastructure .......................................................................................................................................... 23
Section V: Convergence of Electrified Powertrains and Connected and Automated Vehicles .................. 24
Section VI: Conclusion ................................................................................................................................. 25
Bibliography ................................................................................................................................................ 28

CENTER FOR AUTOMOTIVE RESEARCH 2018                                                                                                                             2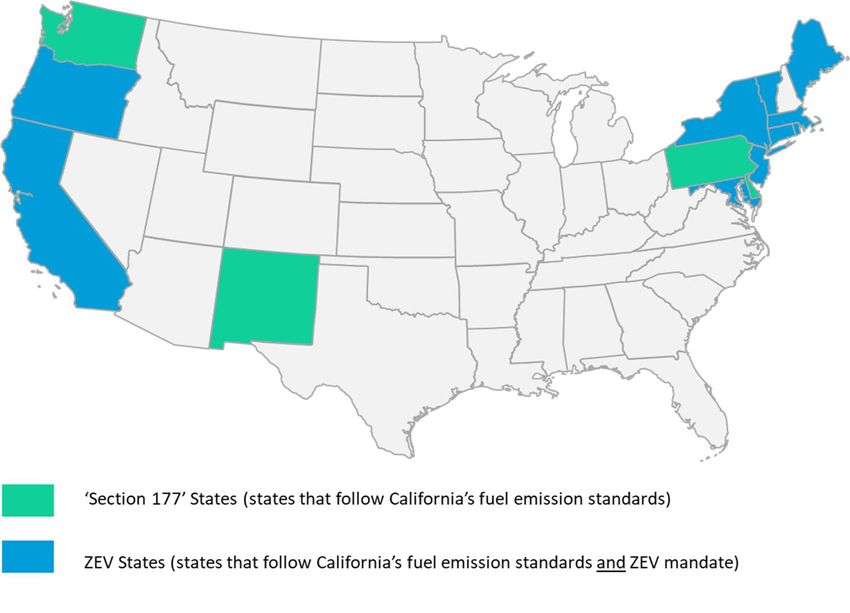
Section I: Introduction
The U.S. automotive industry is in a critical period. U.S. light vehicle sales are plateauing at a high level
that includes a rich mix of pickup trucks, SUVs, and CUVs. Sales of these high-priced and high-margin
vehicles are producing record profits that companies are pouring into new products, processes, and
technologies. Some technological developments—including automated driver assist systems (ADAS);
connected and automated vehicle technologies (CAV); and advanced powertrains—have the potential to
transform not only the vehicle but also the entire automobile industry. Alone or in combination, these
technologies can enable new mobility paradigms and business and revenue models that could
dramatically alter the way consumers purchase transportation and interact with vehicles.
Even while the industry is making substantial bets on the future of automotive technology and the
automotive business more broadly, companies must continue to develop and sell vehicles to make a
profit in today’s market. The mixed fleet—personal ownership and shared mobility—will likely persist
for decades. Developing and manufacturing a light vehicle is a costly endeavor with uncertain paybacks.
Automakers must justify their platform and powertrain business cases over a multi-year time horizon to
meet internal rate of return (IRR) hurdle rates or the targeted level of return on invested capital (ROIC).
Capital and human resources are typically constrained, and current technology trends have tightened
the constraints even further. The United States’ technological leadership is at stake.
Most automakers and suppliers agree that the “three revolutions” of automated, shared, and electric
vehicles will be transformative (Sperling, 2018). However, it may take decades for this idealized future to
take hold, and even then, automated, connected, electric, and shared vehicles (ACES) will not make
sense in every region of the country or every climate. This briefing addresses the challenges automakers
and suppliers face, the tension between consumer demand and regulatory mandates on electrified
powertrains, the impact of CAVs on personal vehicle ownership and mobility, and the implications for
the nation’s engineering and technological leadership in the world.

Section II: Current Market
Segments
As recently as 2000, the U.S. market was evenly split between vehicles considered “cars” and those
classified as “light trucks.” With relatively low fuel prices, and the corresponding popularity of vehicles in
the sport-utility (SUV), crossover-utility (CUV),1 and pickup truck segments, the light truck share has
grown to nearly two-thirds of the U.S. market, as shown in Figure 1. The CUV segment alone expanded
from just 5.7 percent market share in 2000 to 37.8 percent share in 2017 as manufacturers offered more
vehicles in this very appealing consumer category.

1
 The CUV can be classified as either a car or a light truck, but over 97 percent of CUVs sold in the United States in 2017 were
considered light trucks.

CENTER FOR AUTOMOTIVE RESEARCH 2018                                                                                               3

Figure 1: U.S. Car-Truck Market Share Split, 2000-2017

 100%
  90%
  80%
  70%
  60%
  50%
  40%
  30%
  20%
  10%
    0%
          2000 2001 2002 2003 2004 2005 2006 2007 2008 2009 2010 2011 2012 2013 2014 2015 2016 2017

                                               Light Truck Share    Car Share

Source: IHS|Markit

Profitability
It is not a coincidence that the shift to CUVs, SUVs, and pickups coincides with a period of increased
profitability for nearly every automaker that sells vehicles in the U.S. market. Figure 2 shows that after
the recession, almost every automaker in the U.S. market is profitable on a per-unit basis on their U.S.
sales. The exceptions at Toyota and Honda are a result of currency and other factors, and not the vehicle
profit margins per se. Profit margins also vary by segment, with profits in the hundreds of dollars on
some cars and $10,000 per vehicle or more for larger CUVs, SUVs, and trucks. The more the market
moves toward these vehicles, the greater the opportunity to increase margins.
Figure 2: Operating Profit Per Vehicle, 2010-2017 for Five Largest Automakers in U.S. Market

 $4,000
 $3,500
                                                                                                     2010
 $3,000
                                                                                                     2011
 $2,500                                                                                              2012
 $2,000                                                                                              2013
                                                                                                     2014
 $1,500                                                                                              2015
 $1,000                                                                                              2016
                                                                                                     2017
   $500
     $0
  -$500
                  GM                FORD                 FCA*             TOYOTA           HONDA**

*2013 and earlier: Chrysler Group LLC; 2014 and 2015: FCA US LLC; 2016 and on: FCA NAFTA
**Honda also excludes motorcycle, finance, and power products
Source: CAR research based on companies’ financial reports.

CENTER FOR AUTOMOTIVE RESEARCH 2018                                                                         4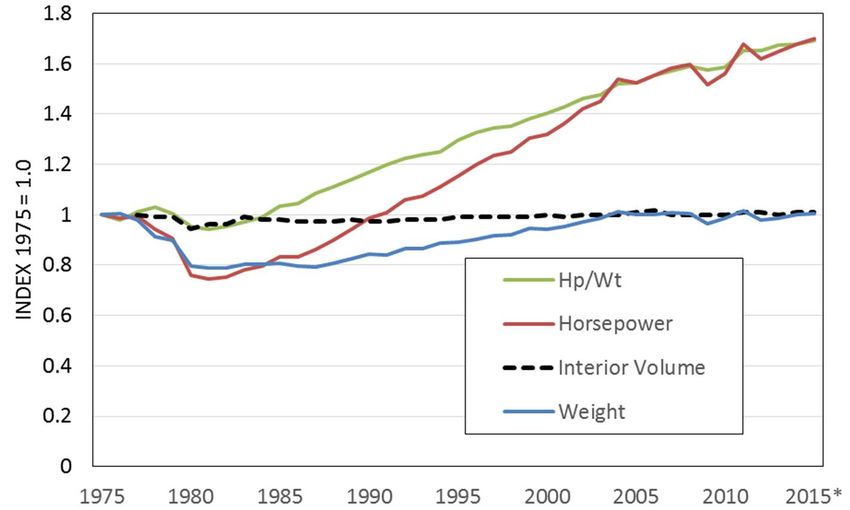
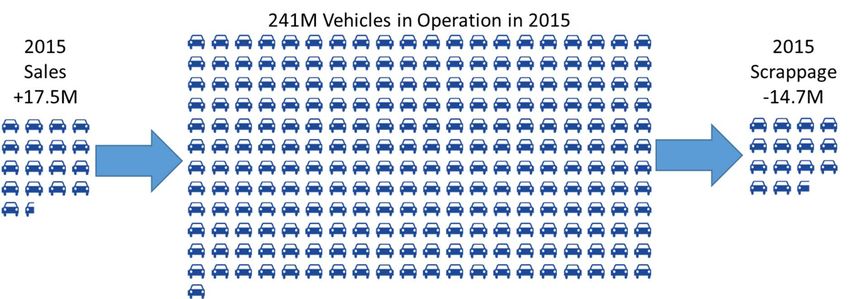
Average Vehicle Age and Vehicle Turnover
The average vehicle on the road in the United States in 2016 was 11.6 years old (IHS|Markit, 2017). The
market turnover is relatively slow. On a base of 241 million light vehicles registered in the United States
in 2015, new vehicle sales added 17.5 million to the in-use fleet, and 14.7 million vehicles were scrapped
that year, as shown in Figure 3.
Figure 3: Illustration of 2015 U.S. Light Vehicle Fleet Dynamics

Source: CAR analysis; Automotive News; Oak Ridge National Laboratory Transportation Energy Data Book

Remarkably, vehicle sales and retirement rates have remained relatively constant over a period of more
than 30 years, as shown in Figure 4. U.S. sales rates average roughly 8 percent, and retirements around
6 percent annually, which means the overall fleet is growing at a rate of 2 percent a year.
Figure 4: Dynamics of the U.S. Light Vehicle Fleet: Sales and Retirement Rates, 1971-2015

                                               Sales Rate        Retirement Rate

                                 14%
  Share of Light Vehicle Fleet

                                 12%
                                 10%
                                 8%
                                 6%
                                 4%
                                 2%
                                 0%

Source: CAR calculations using data from Oak Ridge National Laboratory and Automotive News

Vehicle Miles Traveled
The relatively high average vehicle age does not mean that it would take nearly 12 years for new
technologies to proliferate. While fleet installations might take that long, the fact that the newer
vehicles comprise a majority of the vehicle miles traveled (VMT) in a given year means that it would only

CENTER FOR AUTOMOTIVE RESEARCH 2018                                                                       5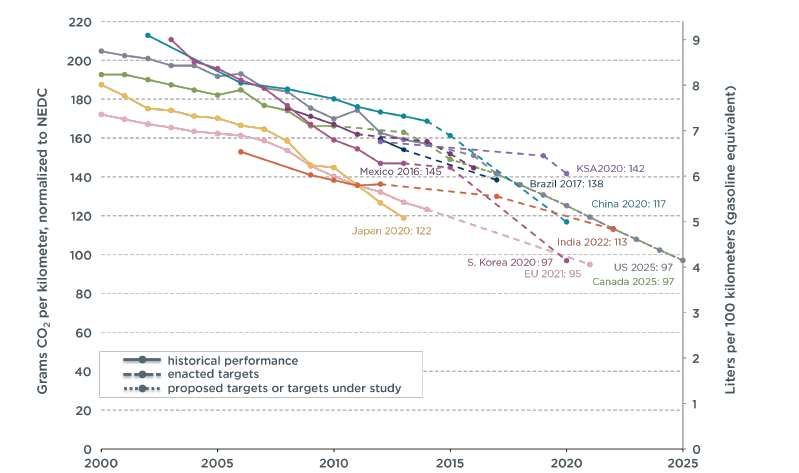
take about seven years before a new technology installed on every vehicle sold is in use for half of the
annual U.S. VMT.2
Many of the new and emerging automotive trends have prioritized dense, urban areas for deployment.
For ridesharing and ridehailing services, this reflects the relative ease of finding customers in denser
areas. New technologies, such as automated driving, require detailed three-dimensional maps of
roadways for system reliability. With an extreme cost to develop these maps, urban areas, representing
the majority of the population and thus potential customers, are prioritized. For vehicle electrification,
the charging infrastructure build-out is a critical factor.
Even with a significant delay before mobility and charging systems and services are available in rural
areas, near all of their potential benefits, whether to motor vehicle safety from avoided and mitigated
collisions or improved convenience of travel, will have been realized before rural area technology
deployment takes place. Driving on rural roads constitutes only 30 percent of all VMT each year, as
shown in Table 1. Excluding rural travel on the interstate highway system, which transportation
providers may prioritize above urban surface roads for vehicle autonomy, the rural share of VMT is
significantly smaller at 22.5 percent of vehicle travel (United States Department of Transportation-
Federal Highway Administration, Various Years).
Table 1: 2016 Share of U.S. Vehicle Miles Traveled by Type of Route
Percent of Total
Rural Interstate 8%
Rural Other Arterial 12%
Other Rural 11%
Urban Interstate 18%
Urban Other Arterial 36%
Other Urban 17%
All Systems 100%
Source: U.S. Department of Transportation, Federal Highway Administration
Section III: Powertrain & Propulsion
Powertrain Market and Consumer Acceptance
The internal combustion engine (ICE) has been the dominant power source for a light-duty vehicle for
over a century. U.S. light vehicle sales were over 17.2 million in 2017, and over 98 percent of the
vehicles sold in this country last year had an ICE. However, automakers are investing heavily and making
significant commitments to advanced propulsion and vehicle electrification (Reuters, 2017):
BMW plans to offer 12 fully-electric vehicles by 2025 (Preisinger & Taylor, 2017).
Daimler plans to sell 100,000 electrified vehicles by 2020.
FCA is planning to offer half of all Maseratis as EVs by 2022.
2
CAR bases its VMT by age schedule on data from available travel surveys. According to the most recent available
data in the 2009 National Household Travel Survey, the average vehicle on the road has an annual mileage of
approximately 11,200, while the newest vehicles travel 14,400 miles per year (Federal Highway Administration,
n.d.).
CENTER FOR AUTOMOTIVE RESEARCH 2018 6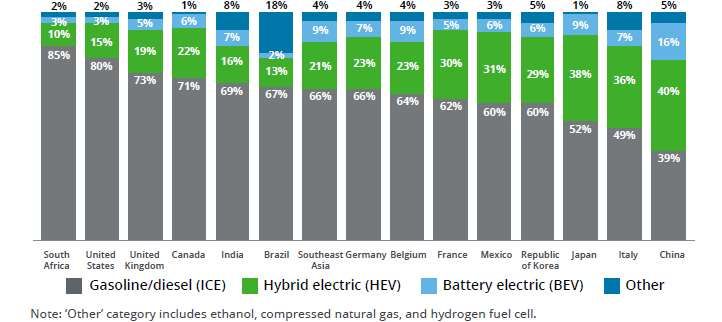
Ford is spending $11B and plans to offer 40 electrified vehicles by 2022 (White & Carey, 2018).
GM will offer 20 all-electric models by 2023 (Welch, 2017).
Honda announced two electric vehicles in 2017 and planned to have two-thirds of its lineup
electrified by 2030 (Tajitsu, 2017).
Mercedes is planning an electrified version of every model it sells.
Renault-Nissan has sold nearly 500,000 Leafs globally—the highest volume of EVs of any
automaker—and expects to have zero-emission vehicles make up 20 percent of its sales by
2020.
Tesla is planning to build 500,000 all-electric Model 3s annually by 2020—which would be six
times the total number of EVs sold in 2016.
Toyota plans to offer all zero-emission vehicles by 2050.
VW is investing $11.8B to roll-out 80 new electric models across all of its brands by 2025.
Volvo announced it would only launch electrified vehicles after 2019.
Consumers’ stated preferences for powertrain technology vary widely across global markets, and there
are also vast differences between what consumers say they want and what they buy. Consumer interest
in alternative powertrain technology is a critical first step to increased sales, but consumer surveys on
future purchase intentions are often hard to interpret. Figure 5 shows results from a consumer “engine
preference” survey for selected countries. The data suggest that globally, consumers have a solid
interest in hybrid-electric (HEV) and battery-electric (BEV) vehicles. While 18 percent of U.S.
respondents indicate a preference for HEVs and BEVs, European respondents express an even higher
preference for the technology (30 percent in Germany, 25 percent in France). Chinese consumers top
the list with a reported 56 percent preference for HEV and BEVs. The current market share of BEVs and
HEVs is 3.3 percent in the United States (2017), 0.7 percent in Germany (2016), 1.5 percent in France
(2016); and 1.4 percent in China (2016) (OICA, 2016). There is a disconnect between consumers’
expressed intent and their actions.
Figure 5: Consumer Preference for Type of Next Vehicle (2018)
Source: 2018 Deloitte global automotive consumer study
CENTER FOR AUTOMOTIVE RESEARCH 2018 7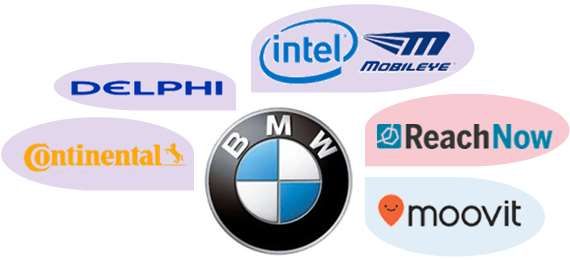
Another survey suggests a lack of consumer awareness is a barrier to increased EV sales. The share of
car-owning households in California who have already considered buying a BEV, plug-in electric vehicle
(PEV), or plug-in hybrid electric vehicle (PHEV) is no higher in 2017 than it was in 2014 (Kurani &
Hardman, n.d.). Greater public awareness could help, but it is also essential that these vehicles meet all
of the consumers’ expectations. Even with the broader availability of BEV and PEV makes and models,
most consumers continue to be unaware or uninterested in buying one. The reasons behind consumers’
choices to not buy a BEV or PEV could include purchase price, technology limitations, or other
performance challenges that current electrics may not be capable of meeting.
The U.S. market has long been unique amongst major global markets. Low, relatively stable, energy
prices and higher levels of suburban driving have encouraged U.S. consumers to value different vehicle
characteristics than do vehicle owners in many other markets. Current and upcoming global regulatory
pressures, combined with technological advancements, may lead the composition of vehicles sold in the
U.S. market to further deviate from much of the rest of the global automotive world.
The U.S. automotive market has shifted from passenger cars to body-on-frame based SUVs, and more
recently toward unibody CUVs. Throughout these vehicle preference shifts, the U.S. consumer has
shown a penchant for increased performance, and the industry has responded with ever more refined
and powerful ICEs.
Figure 6 shows three often measured vehicle characteristics for the U.S. market: horsepower, weight,
and interior space. Consumers define vehicle performance in many ways, but the relationship between
horsepower and weight is a critical performance factor for many U.S. consumers. Material selection and
vehicle size influence vehicle weight, and average vehicle weight steadily increased between the mid-
1980’and 2005. Since 2005 vehicle weight has remained relatively stable, and over the same period,
vehicle horsepower has risen steadily leading to a remarkable increase in the horsepower-to-weight
ratio. The U.S. customer has shown an appreciation for performance as defined by horsepower. In many
ways, the refinement of the ICE has been an enabler for satiating this demand.
Figure 6: Selected Attributes of Passenger Cars: 1975-2015

Source: U.S. Environmental Protection Agency CO2 and Fuel Economy Trends Report

CENTER FOR AUTOMOTIVE RESEARCH 2018                                                                      8
In the United States, electrified vehicle (HEV, PEV, and BEV) sales and market share are highly correlated
with gasoline prices. The vertical bars in Figure 7 represent annual electrified vehicle sales (on the left
axis), the blue line represents electrified vehicle market share, and the green line represents the
inflation-adjusted gasoline price (both lines on the right axis). In 2013, the U.S. market achieved record
high electrified vehicle sales (nearly 600,000 vehicles or 3.8 percent of market share) during a period of
relatively high gasoline prices. In 2017, after a three-year dip in sales and a concomitant drop in gasoline
prices, electrified vehicle sales and gasoline prices rebounded, and the U.S. market share for electrified
vehicles reached 3.3 percent.
Figure 7: The U.S. Electrified Light Vehicle Sales and Take Rate 1999 – 2017
                                                                            Electrified LV Sales                 % of LV Sales            Real Gasoline price

                                 600                                                                                                                                                  4.50

                                                                                                                                                                       3.31%          4.00
                                 500

                                                                                                                                                                                             Percent of LV Sales (%)
U.S. Electrified Sales (000’s)

                                                                                                                                                                                      3.50

                                                                                                                                                                                               Real Gas Price ($)
                                 400                                                                                                                                                  3.00

                                                                                                                                                                                      2.50
                                 300
                                                                                                                                                                                      2.00

                                 200                                                                                                                                                  1.50

                                                                                                                                                                                      1.00
                                 100
                                                                                                                                                                                      0.50

                                   0                                                                                                                                                  0.00
                                       1999   2000   2001   2002   2003     2004   2005      2006   2007   2008     2009    2010   2011   2012   2013   2014    2015   2016    2017

Source: Ward’s Automotive Reports; Hybridcars.com; U.S. Energy Information Administration

Among the 567,000 electrified vehicles sold in 2017, near two-thirds were traditional HEVs such as the
Toyota Prius and the Ford Fusion Hybrid, as shown in Figure 8. PHEVs such as the Chevrolet Volt and the
Ford Fusion Energi accounted for only 16 percent of U.S. electric vehicle sales in 2017. BEVs such as the
Chevrolet Bolt, the Tesla Model S, and the Nissan Leaf, accounted for 19 percent of the electrified
vehicle market. In 2017, BEVs held 0.6 percent of total U.S. market share, PHEVs comprised 0.5 percent
share, and traditional HEVs accounted for 2.1 percent of the overall U.S. light-vehicle market.
Figure 8: Market Share: Electrified Vehicles 2017: 1/3 of electrified vehicles are BEVs and PHEVs
                                                                      Mild-Hybrid                    Fuel Cell
                                                                          1%                           0%

                                                                          Battery Electric
                                                                               19%

                                                                   Plug-in Hybrid
                                                                        16%                   Traditional Hybrid
                                                                                                     64%

Source: Hybridcars.com

CENTER FOR AUTOMOTIVE RESEARCH 2018                                                                                                                                                                                    9
Investment in Advance Powertrain Technology
In the last decade, governments have rapidly instituted stricter regulations to lower tailpipe carbon
dioxide emissions and, in some cases, governments have mandated the implementation of specific
vehicle technologies. With rare exceptions, U.S. consumer powertrain preferences tend to shift only in
relation to the price of fuel.
Regulatory efforts to limit global climate change and improve energy security have driven the
automotive industry to develop and produce ever more efficient vehicles. Automakers and suppliers
have made significant investments in both research, development, and engineering to refine ICE
powertrains further and develop viable alternative energy systems. To keep pace with future
regulations, the auto industry will need to make even more investments in advanced powertrain
research and development.
BEV and fuel cell vehicles (FCVs) may gain broader market acceptance at some point in the future, but
for the coming decade, the ICE powertrain will likely remain dominant in the U.S. market. While
powertrain development-specific investment data are not available for individual companies, many
companies have announced their projected expenditures. According to Reuters, the automotive industry
has announced investments to develop EVs totaling as much as $90 billion globally (Lienert, 2018).
While these announcements may include both product and powertrain development, the spending
represents a substantial investment in a technology that has not yet gained mass market acceptance.
Even without a precise estimate of automakers’ powertrain expenditure, investments in production
facilities can shed some light on the scale of the industry’s spending. Since 2009, automakers have
announced investments in North America exceeding $9.2 billion for the production of advanced,
efficient, ICE powertrain systems. These investments are split evenly between high-speed transmissions
(8+ gears and CVTs) and new, smaller engines (4 or fewer cylinders). Electrified vehicle technologies
remain in development, and electrified vehicle sales levels have grown slowly, and therefore related
capital outlays in North America have been relatively small, totaling just $9.8 billion between 2009 and
2017. The majority of this sum, $6.1 billion, has been to establish or expand manufacturing operations
for electrified vehicles (HEV, PHEV, BEV, FCEV) and their components. North American battery
production is limited in scale, and automakers often source this work to a supplier company.
Automakers have directly invested less than $3.7 billion in battery production to date, with nearly $3
billion of this investment from one company (Center for Automotive Research, 2018).
Historically, automakers have built powertrain business cases over at least a ten-year time horizon,
straddling two or more vehicle programs. The need to introduce new technology coupled with the
substantial levels of capital investments required to design, engineer, test, and validate engine and
transmission programs drives this long time horizon. In addition to the engine and transmission,
automakers must invest in machining and assembly lines for drivetrain components and assemblies.
Vehicle programs, in turn, take on the cost of these powertrain programs as automakers allocate the
spending over the total unit volumes, and incorporate the costs into the vehicle platform business cases.
Auto manufacturers design and engineer engine and transmission families for use across as many
vehicle platforms and nameplates as possible to spread the powertrain costs and market risks across as
many units, market segments, and vehicle designs as possible. Companies that offer a variety of
powertrain options per platform or nameplate increase the probability that their vehicles will be in
demand month-to-month, quarter-to-quarter, and year-to-year through fuel price changes, competitor

CENTER FOR AUTOMOTIVE RESEARCH 2018                                                                      10
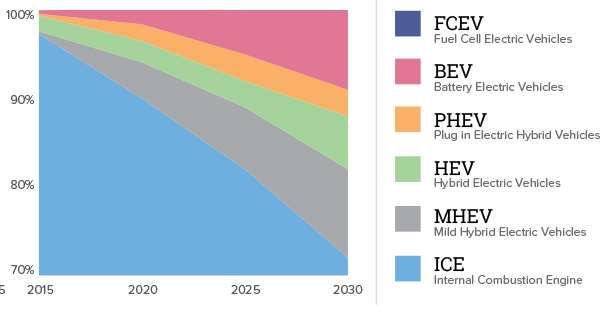
new vehicle introductions, regulatory requirements, consumer lending availability, and other factors
that drive market volatility.

Technology Readiness Roadmap
There is some consensus on the general direction of powertrain technological advancement in the
coming decade; however, there remains a significant degree of uncertainty as to specific
implementation timeframes. Light duty vehicle propulsion systems have rapidly progressed over the
years due to several factors, but most importantly due to increasingly stringent global emissions and
fuel economy regulations. Manufacturers are investing in a broad portfolio of different propulsion
technologies for the next several years including advanced ICE, BEV, HEV, PHEV, and FCVs. For over a
century, ICEs have been the primary propulsion for light-duty vehicles throughout the world. With
additional advanced technology upgrades, ICEs will continue to dominate the market with
approximately 80 percent market share, including 48-volt mild hybrids (MHEV), through 2030, as shown
in Figure 9 (Smith, Spulber, Modi, & Fiorelli, 2017).
Figure 9: Global Powertrain Market Share 2015-2030

Source: Center for Automotive Research

North American production may lag this global market shift. Figure 10 shows the LMC Automotive
forecast for a powertrain product mix of 91.4 percent ICE and MHEV share in 2025 (LMC Automotive, Q4
2017). The production forecast may be indicative of the difficulty of selling advanced electrified
powertrains in the U.S. market.

CENTER FOR AUTOMOTIVE RESEARCH 2018                                                                    11
Figure 10: North American Powertrain Production Share 2017-2024

Source: LMC Automotive

Global vehicle manufacturers are committed to developing electrified vehicle technology, and their
recent announcements are a strong indication that vehicle electrification is nearing a tipping point. The
Chinese government’s commitment to creating an electric vehicle market will be critical to automakers,
as China is now the largest new vehicle market both regarding units sold and total market value. China
also has the policy tools to shape market acceptance, thus creating markets for the technology.
Regulations may drive propulsion technology implementation, but the consumer determines the market
success of these technologies. Consumers tend to be cautious when presented with new technologies.
Therefore automakers need to address their concerns about safety, reliability, and high costs. The ICE,
even with additional technology and content, remains a formidable cost, performance, and utility target
to beat—especially in low-cost energy regions.
Development of advanced batteries for tractive power is a critical enabler for the successful adoption of
PEVs. Lithium-ion is the current technology for electrified vehicles, and the cost of lithium-ion batteries
has been decreasing rapidly for over a decade. Cost-per-kilowatt-hour estimates for lithium-ion
batteries vary but are thought to be approximately $200/kW currently. Lithium-ion battery costs could
be below $100/kW by 2025 (Smith, Spulber, Modi, & Fiorelli, 2017). Such cost reductions would make
BEVs much more purchase-price competitive with ICE vehicles.

Emissions and Fuel Economy Regulatory Climate
Vehicle emissions and fuel economy regulation are frequently done on a national level but often have
global environmental and industrial implications. There are many reasons governments may regulate
emissions and fuel economy, but the reduction of CO2 and local pollutants is usually a primary goal.
While emissions regulation in certain markets can drive technology development, the consumer may or
may not immediately embrace the new technology. These policies can potentially create a position of
industrial leadership in those markets that mandate specific technology use, such as China.
For decades, governments have relied mainly on laws of such as the U.S. Corporate Average Fuel
Economy (CAFE) standards or Europe’s New European Drive Cycle (NEDC) to regulate motor vehicle

CENTER FOR AUTOMOTIVE RESEARCH 2018                                                                       12
emissions. The International Coalition for Clean Transportation has tracked these past, current, and
future standards, as shown in Figure 11. While there are some differences in the slope, globally, these
standards are rapidly becoming more restrictive, which will lead to lower emissions and reduced fuel
consumption.
Figure 11: ICCT Passenger Car CO 2 Emissions and Fuel Consumption, Normalized NEDC

Source: International Coalition for Clean Transportation

Regulators in the United States are currently reviewing future CAFE and CO2 standards. Their decisions
will have significant implications for the U.S. market, and likely also the technological competitiveness of
the U.S automotive industry. Early indications are that NHTSA may reduce the stringency of regulation
starting in 2021 (Lippert & Beene, 2018).
As noted earlier, a majority of U.S. consumers seem to place a higher importance on attributes other
than fuel efficiency in their new vehicle purchase decision. The most fuel-efficient vehicles available
enjoy considerable subsidies from governmental entities and direct from manufacturers. Subsidization
from manufacturers comes in two forms: purchase or lease incentives and base pricing which does not
reflect fixed costs. An example of the latter is when FCA CEO Sergio Marchionne famously revealed that
the Fiat 500e sold at a $14,000 loss per unit (Marchionne, 2014). Additionally, consumers do not weigh
vehicle attributes for only the new purchase – they select a vehicle attribute portfolio across all of the
vehicles within their household, as is documented in a wide range of studies including recent research
sponsored by the California Air Resources Board (Rapson, Gillingham, & Knittel, 2017).
A reduction in fuel economy standards will likely offer many consumers continued opportunity to
purchase vehicles with the attributes they most desire. It may also encourage manufacturers from
around the world to continue to partake in what is a highly competitive, but also very profitable U.S.
market. However, it will create a fragmented U.S. market; state regulators in California and the other 14

CENTER FOR AUTOMOTIVE RESEARCH 2018                                                                       13
Section 177 states will continue to regulate CO2 and mandate zero emissions vehicles (ZEVs) regardless
of the direction national regulation (see Figure 12).
Figure 12: States that have adopted California Emissions Regulations

Source: Center for Automotive Research

Government regulators across the globe are increasingly shifting toward regulating a technology-based
solution. Vehicle electrification, long the domain of the California Air Resource Board (CARB), has
become a favored technology for many government regulators throughout the world. Many countries
and even cities have taken actions develop zero-emission vehicle mandates, with a specific interest in
BEV technology. Countries including China, France, Germany, Great Britain, India, Norway have
announced plans to phase out gasoline and diesel-powered engines. Also, Austria, Denmark, Ireland,
Japan, the Netherlands, Portugal, Korea and Spain have set government targets for EV sales (Petroff,
2017). Several cities are also looking to move to limit or ban ICE-powered vehicles, including Paris,
London, and Copenhagen.
Norway has been famously aggressive in its commitment to PEV technology; the country has
implemented a “green” tax system for vehicles, where the government taxes vehicles sold according to
their emissions. The Norwegian strategy has been effective; in 2017, PEVs accounted for 39.2 percent
(20.8 percent for BEV and 18.4 percent PHEV) of new vehicle sales in the country (NPRA, 2017). Norway
has supported this effort with a set of broad financial incentives, and the development of charging
infrastructure (Lorentzen, Haugneland, Bu, & Hauge, 2017) (Milne, 2017). Norway’s monetary incentives
are the equivalent of 45 percent of the total price for a midsize EV. At the end of 2017, Norway had
more than 10,330 charging stations, and, over 2,000 of those were high powered (European Alternative

CENTER FOR AUTOMOTIVE RESEARCH 2018                                                                      14
Fuels Observatory, 2017). While this strategy has gained much acclaim, it may not serve as a model for
countries with larger vehicle markets due to its high costs.
Although Norwegian regulatory activities have helped the country achieve the highest penetration of
PEVs, China’s New Energy Vehicle (NEV) credit system may be more important for global automakers.
Modeled after California’s ZEV mandates, China has put in place the foundation to what might be a
viable market for electric vehicles. China’s strategy is a partial response to local, and maybe even global,
emissions concerns. However, the opportunity to become the global leader in the development and
manufacture of EVs and components also drives the country’s regulatory approach to create an electric
vehicle market.

Section IV: Innovative Mobility Services and Connected and Automated
Vehicles
Advances in connectivity, automation, and new mobility services are potent agents of change affecting
the automotive industry, the broader transportation sector, and beyond.
The growth of innovative mobility services (IMS) around the world and in the United States has many
implications for the automotive industry, and these impacts will become even more significant after the
deployment of automated vehicles (AVs). Increased use of IMS (including those that will use AVs) could
reduce car ownership for people that do not use a private vehicle as their primary mode of
transportation, and instead use public transit, bike or walk. The shift towards IMS and away from the
private vehicle may cause some losses in sales of new and used vehicles. However, higher vehicle
turnover and a shorter life expectancy of vehicles used by mobility services will offset some of those
losses.
The most important impact that innovative mobility services (IMS), driving automation, and vehicle
connectivity will have on the automotive industry will be on how customers interact with vehicles, their
expectations for vehicles, and their uses of these vehicles. Mobility, connectivity, and automation will
change the way people use, value, and relate to personal vehicles. They will alter people’s expectations
about vehicles, and that may be more important in the long term than the net loss in vehicle sales. IMS
will likely contribute to a change in preferences away from vehicle ownership and towards “vehicle
usership,” exploring new business models that do not involve the user owning a vehicle and having all
the inconveniences and costs associated with that ownership (Spulber, Dennis, Wallace, & Schultz,
2016).

Innovative Mobility Services Market and Consumers
The origin of IMS can be placed roughly in the 1990s, though substantial growth occurred in the 2010s
when the number of different concepts (or business models) and companies increased. IMS are growing
in areas with specific characteristics, and many of their first adopters share a set of distinctive
demographic traits.
Overall, consumer attitudes toward IMS are improving. However, fewer Americans consider ridehailing
and carsharing an alternative to the personal vehicle (56 percent and 47 percent, respectively) than they
do buses (58 percent) and subways (86 percent). In 2016, 35 percent of U.S. residents reported having
used ridehailing, and 8 percent of Americans had used carsharing in the past year (Abraham, et al.,
2016). It is important to place these low usage shares in context; these services are still relatively recent

CENTER FOR AUTOMOTIVE RESEARCH 2018                                                                        15
developments and have limited geographic availability. The first ridehailing service, Uber, launched in
2009, and small carsharing programs started appearing in the 1990s.
Overall, IMS are available in denser and walkable urban areas that also have good public transportation
networks. Few people use IMS as a sole means of transportation, but instead, riders use these services
in combination with other modes, especially public transit. IMS are occasionally used in areas with little
or no public transit, and in these areas, IMS might serve specific purposes, such as travel to or from an
airport. In areas with sparse public transit coverage, a personal vehicle remains the dominant mode of
transportation, thereby limiting the demand for hailing an Uber or renting a Zipcar, for example
(Spulber, Dennis, Wallace, & Schultz, 2016).
Table 2: Guidelines for Where Carsharing Succeed

                               Demographics

                               One-person households               minimum 30%

                               Work Commute Mode

                               Drive alone                         maximum 55%

                               Walk                                minimum 5%

                               Vehicle Ownership

                               Households with 0 vehicle           10% - 15%

                               Households with 0 or 1 vehicle      60% or more

                               Neighborhood Characteristics

                               Housing units per acre              5 or more

                              Source: (Millard-Ball, Murray, Ter Schure, Fox, & Burkhardt, 2005)

Carsharing works in areas with dense housing units, a number of single-person households, where
vehicle ownership is low, and people either drive to work alone or walk, as shown in Table 2. Likewise,
IMS users are mostly urban dwellers and have higher income and educational attainment levels than
average (83 percent of carsharing members hold at least a Bachelor’s degree) (Millard-Ball, Murray, Ter
Schure, Fox, & Burkhardt, 2005). They are also less likely to own a vehicle and rely more heavily on
public transportation, especially for the work commute. The average IMS users own 1.05 cars per
household (Shared-Use Mobility Center, 2016), compared to the national average of 2.06 (Federal
Highway Administration, 2013). For instance, the target demographic for carsharing programs are
younger than average, with a median age of 35 years (Millard-Ball, Murray, Ter Schure, Fox, &
Burkhardt, 2005). College students and faculty frequently rely on IMS.

Connected and Automated Vehicles Market and Consumers
Consumer attitudes concerning AVs have been evolving rapidly in the past few years. One survey
compared consumers’ trust that fully automated vehicles would be safe and found that in 2017, 53
percent of U.S. residents deemed self-driving cars safe, up from 26 percent in 2017 (Giffi, Vitale, Schiller,
& Robinson, 2018). Another survey from 2017 found that only 44 percent of Americans would want to
ride in a self-driving vehicle (Smith & Anderson, 2017).

CENTER FOR AUTOMOTIVE RESEARCH 2018                                                                        16
While a growing number of drivers have experienced ADAS features and SAE Driving Automation Levels
1 or 2, vehicles with Levels 3 to 5 are not yet available to the general public beyond a few limited pilot
projects (Waymo, Uber, Navya, among others). It is therefore still a challenge to measure attitudes to
products that consumers have not yet experienced. Nevertheless, a growing number of surveys on
attitudes toward AVs reveal a generation divide. Table 3 shows that younger adults are more
comfortable with the idea of automated driving compared to older adults. According to one survey from
2016, 40 percent of respondents aged 25 to 34 are comfortable with full autonomy—significantly more
than any other age category. On the other hand, older adults over 45 years old were more comfortable
with ADAS features such as collision avoidance and lane keeping (Abraham, et al., 2016).
Table 3: Age Differences in Willingness to Use Automation in Vehicles – Maximum Level of Automation
With Which Respondents Would Be Comfortable
Age
Level of 16-24 25-34 35-44 45-54 55-64 65-74 75+
Automation
No Automation 12.4% 8.0% 9.7% 6.1% 5.0% 3.8% 3.1%
Emergency Only 18.3% 11.3% 15.7% 16.0% 14.7% 12.2% 16.7%
Help Driver 26.7% 25.4% 21.1% 41.2% 44.4% 56.0% 52.2%
Partial Automation 16.3% 15.3% 19.0% 13.2% 17.0% 13.9% 15.4%
Full Automation 26.2% 40.0% 34.4% 23.4% 18.9% 14.2% 12.7%
Source: (Abraham, et al., 2016)
Acquisitions and Investments
The growth of IMS and the development of CAV technologies are prompting vehicle manufacturers to
rethink their existing business models and explore new approaches to the market. The mainstreaming of
IMS is more of an opportunity than a threat for automakers. As transportation preferences slowly
evolve, the automotive industry is trying to show customers that it understands the shift toward on-
demand shared mobility and that it has relevant new products and services to offer. Some of the
opportunities for the automotive industry include:
Partnerships with new mobility and technology firms
Investments and venture capital in mobility startups
R&D and experiments on mobility solutions
In-house mobility services
Fleet sales to mobility providers
New vehicle financing models
Beyond presenting a challenge to the vehicle ownership mode, the expansion of IMS could influence
other aspects of the automotive industry and related sectors such as the automotive value chain, supply
chain, logistics, automotive insurance, and vehicle maintenance and repair.
The success of IMS is encouraging automakers to create mobility services of their own, and those can
become new revenue sources. Vehicle manufacturers such as Ford and Volkswagen have announced
their intention to become mobility companies that offer different services alongside their established
core business of manufacturing vehicles. On-demand mobility services are a way to generate ongoing
income and to engage more with customers more frequently than just through a vehicle sale or lease
every few years.
CENTER FOR AUTOMOTIVE RESEARCH 2018 17In the past several years, automakers have started investing in, partnering with, and acquiring mobility
and tech companies, as well as creating mobility subsidiaries (see Figure 13). Building customer
relationships through IMS is an opportunity for vehicle manufacturers to diversify their activities and to
strengthen their market share in urban areas and with the younger generations. Partnerships with IMS
companies give automakers increased visibility to mobility users (who might one day become car
buyers), as well as access to valuable consumer data and analysis. Innovative mobility companies also
have an interest in these deals that come with access to auto industry engineers or discounts on
vehicles.
Tech companies and startups are disrupting traditional supply chains by developing software, chipsets,
and sensors for connected and automated vehicles. In turn, many automakers are developing driving
automation technologies in-house to assure their companies remain relevant and profitable in a future
in which software, data, and connectivity are more valuable than the mechanical elements of a vehicle.
However, investing or acquiring startups that are developing CAV technologies is another primary way in
which established automotive companies can advance in the race to developing self-driving cars.
Figure 13: Automakers’ Partnerships Related to Connected and Automated Vehicles and Innovative
Mobility Services
Acquisition
Investment
Subsidiary / Brand
Partnership
Source: Center for Automotive Research
CENTER FOR AUTOMOTIVE RESEARCH 2018 18Noteworthy Investments and Acquisitions
1. December 2015 – Audi, BMW, and Mercedes acquired mapping company Here for $2.8 billion (Krauskopf, 2018). Intel
announced the purchase of a 15 percent stake in the company in January 2017 and in January 2018 Bosch and
Continental announced the acquisition of 5 percent of Here each (Krok, 2018).
2. January 2016 – General Motors paid $500 million for a minority stake (9 percent) and a board position in ridehailing
company Lyft (Trousdale, 2016).
3. March 2016 - General Motors acquired automated driving startup Cruise Automation for $581 million (DeBord, 2016).
In April 2017, GM announced plans to invest $14 million in Cruise, adding an estimated 1,100 full-time employees by
2021 (Wayland, 2017).
4. May 2016 - Volkswagen invested $300 million in ridehailing company Gett (Lunden, VW invests $300M in Uber rival
Gett in new ride-sharing partnership, 2016).
5. May 2016 - Toyota has invested an undisclosed amount in ridehailing firm Uber (Buhr, Uber and Toyota confirm
strategic investment and auto leasing deal, 2016). In August 2017, Toyota also invested in Uber rival Grab (Meyer,
2017).
6. August 2016 - Uber acquired Otto, a truck automation company for $680 million (Buhiyan, 2016).
7. February 2017 - Ford Motor announced it would invest $1 billion over the next five years in Argo AI, an artificial
intelligence start-up focused on developing autonomous vehicle technology (Ford Motor Company, 2017). Ford did not
acquire Argo AI, but is the majority stakeholder and has two seats on a five-seat board (Korosec K. , An inside look at
Ford’s $1 billion bet on Argo AI, 2017). Since September 2016, Ford Smart Mobility LLC, Ford’s mobility subsidiary,
acquired Chariot, TransLoc, and Autonomic, and invested in Velodyne, SAIPS, Nirenburg Neuroscience, Civil Maps, and
Swiftly (Ford Motor Company, 2018).
8. March 2017 - Intel acquired Mobileye, an Israeli company that makes sensors and cameras for driverless vehicles for
$15.3 billion, making it one of the most significant CAV acquisitions so far (Lunden, Intel buys Mobileye in $15.3B deal,
moves its automotive unit to Israel, 2017).
9. April 2017 - Delphi made minority investments in Otonomo and Valens, two Israel-based connected vehicle companies
(Irwin, 2017).
10. June 2017 - Bosch announced it would build a $1.1 billion semiconductor plant in Germany, the largest single
investment in the company’s history (Behrmann, 2017).
11. October 2017 - GM announced it would acquire lidar company Strobe (Vogt, 2017).
12. October 2017 - Delphi acquired startup NuTonomy for $400 million (Burns, 2017).
13. December 2017 - Denso invested an undisclosed amount in Ridecell, a leading platform for carsharing and ridesharing
operators (Denso, 2017).
Noteworthy Partnerships
1. Alliance led by BMW includes Intel, Mobileye, Delphi, Continental and FCA (Reuters, 2017).
2. Lyft’s Open Self-Driving Platform includes GM, Ford, NuTonomy, JLR (Newcomer, Lyft Enlists Ford to Help Get Self-
Driving Cars on the Road, 2017).
3. Waymo has partnerships with Lyft since May 2017 (Isaac, 2017) , FCA since May 2016 (Burke, 2018), Honda since
December 2017 (Byford, 2017).
4. Uber has partnerships with Volvo since August 2016 (Volvo, 2016), Daimler since January 2017 (Newcomer, Uber,
Daimler Strike Partnership for Self-Driving Vehicles, 2017) , and Toyota since May 2016 (Buhr, Uber and Toyota confirm
strategic investment and auto leasing deal, 2016).
5. Aurora (Chris Urmson’s new automated driving startup) has partnerships with Moia (Volkswagen’s mobility subsidiary)
and Hyundai since January 2018 (Korosec K. , Meet Aurora, the Ambitious (and Spunky) Self-Driving Car Startup, 2018).
6. Delphi and Quanergy since October 2015 (Delphi, Quanergy team up on low-cost lidar, 2015).
7. Daimler – Bosch since April 2017 (Taylor, 2017).
8. Volvo – Autoliv since September 2016 (Volvo, 2016).
9. Nvidia has partnerships with many automakers including Toyota, Audi, Tesla, Daimler, Toyota, and Volvo (Hawkins,
2017).
CENTER FOR AUTOMOTIVE RESEARCH 2018 19Technology Readiness
Vehicle automation, connectivity, and mobility encompass trends in technology and business models
that have been in motion for decades, but these technologies and strategies have accelerated in the
past five to ten years. Between 2000 and 2010, automakers and suppliers introduced numerous ADAS
that warn, aid, and assist drivers. Automakers mainly installed these automated and safety systems on
higher-end vehicles where consumers could pay for the additional features. ADAS features will be
increasingly standard across the new vehicle fleet in the coming decades. Some features may be
mandated or included in safety-rating systems, such as the EU’s New Car Assessment Program (NCAP).
Customers have demanded some automated vehicle systems such as automated park assist, adaptive
cruise control, and automated emergency braking, and these systems are now available on an increasing
number of new vehicles.
Automotive manufacturers, suppliers, and tech companies are in a race to develop and test automated
driving and connectivity technologies. Increasingly, these companies are testing their self-driving
prototypes in a variety of urban and suburban environments and weather conditions, even opening
their pilots to the general public as Waymo and Uber have done.
Testing Automated Vehicles on Public Roads
1. Waymo – currently in Mountain View, CA (since 2009), Austin, TX (since July 2015), Phoenix, AZ (since April 2016), and
Kirkland, WA (since February 2016)
2. Uber – Pittsburgh, PA (since September 2016) and Tempe, AZ (since February 2017)
3. General Motors/ Cruise – San Francisco, CA (since May 2016), Scottsdale, AZ (since August 2016), and metro Detroit,
MI (since 2016)
4. Ford – metro Detroit, MI (since November 2015), California (since December 2015), and Arizona (Since 2016)
5. Apple – California (since April 2017)
6. Lyft/NuTonomy – Boston, MA (since December 2017)
Most automakers and tech companies agree they will first launch AVs in the form of low-speed
automated shuttles. Pilot tests for such automated shuttles and taxis are already in progress. For
example, in November 2017, Waymo took its Early Rider Program to the next level by beginning to give
people in the Phoenix area rides in their driverless taxis without a human test driver (Korosec K. , 2017).
In January 2018, Uber CEO Dara Khosrowshahi said his company would use AVs as part of their services
within the next 18 months (Etherington, Uber CEO hopes to have self-driving cars in service in 18
months, 2018). The same month, General Motors asked NHTSA for an exemption on 16 FMVSS to
deploy vehicles without steering wheels or brake pedals in a ridehailing program expected to be in place
by 2019 (Bhuiyan, 2018). In June 2017, Lyft set the target of providing at minimum 1 billion rides per
year via electric AVs by 2025 (Etherington, Lyft sets goal of 1 billion autonomous electric rides per year
by 2025, 2017). While driverless taxi services (SAE Level 4) will be available in select urban areas as soon
as 2020, AVs for personal use will be available in 2030 or later. Fully AVs (SAE Level 5)—capable of
operating anywhere and in all situations—are also expected to be available after 2030, although there
are still considerable uncertainties related to full driving autonomy (see Figure 14) (Smith, Spulber,
Modi, & Fiorelli, 2017).
CENTER FOR AUTOMOTIVE RESEARCH 2018 20Figure 14: Roadmap for CAV Technology and Innovative Mobility Services Deployment Source: Center for Automotive Research In recent years, the industry has made considerable progress in developing and testing vehicle-to- vehicle (V2V) and vehicle-to-infrastructure (V2I) communication equipment and applications. Connectivity will play an increasing role in the auto and mobility sectors in the coming years, but it is less clear what specific communication technologies will be most pertinent and prevalent. While the U.S. mandate for V2V-capability on light-duty vehicles that the federal government initially proposed in December 2016 has moved to the long-term regulatory agenda, large-scale Dedicated Short-Range Communication (DSRC) investments seem unlikely now. On the other hand, progress on the development of 5G seems steady, with the launches of first 5G mobile networks expected around 2020. These 5G networks will enable a variety of commercial- and convenience-oriented applications, but it remains an open question whether or not 5G can support cooperative active safety. Finally, IMS are expected to diversify and grow significantly in cities and to spread beyond urban areas in the 2020s and 2030s, benefitting from the convergence with vehicle automation (see Figure 14). In the 2020s, sharing models will become a convenient alternative to vehicle ownership for an increasing share of the world’s population. After 2030, cities will see large-scale adoption of vehicle-sharing models and rural areas will begin to see viable IMS models. Legal and Regulatory Framework of Connected and Automated Vehicles As the technology for CAVs continues to develop, federal and state governments have begun to address the implications of the deployment of CAVs with new legislation and regulations. Each year, the number of states considering and passing legislation related to CAVs has gradually increased. In 2012, six states introduced legislation, in 2013 there were 9 plus the District of Columbia, in 2014 there were 12, in 2015 there were 16, in 2016 there were 20, and in 2017 there were 33 states considering such legislation. CENTER FOR AUTOMOTIVE RESEARCH 2018 21
Nevada was the very first state to pass a CAV law in 2011. At the end of 2017, 26 states plus the District
of Columbia had formally addressed CAVs in some way.
The regulatory approaches to CAVs can vary widely, causing many to be concerned about an emerging
‘regulatory patchwork’ that will prevent efficient deployment. Despite the variation, there are several
trends in the enacted state laws or executive orders as shown in Table 4. First, many states have
introduced definitions of driving into their vehicle code, which is an important initial step. Secondly,
states are regulating testing, deployment, or both. Thirdly, addressing liability is a common regulatory
concern. Although these liability provisions often merely restate existing law, some have required
additional insurance for CAVs. Fourthly, requesting a study or convening a committee is a popular state
response and, in some cases, these steps are the only measure states had passed so far. Finally, many
states have instituted some preemptive restriction on local control and ordinances.
Table 4: Items Addressed in State Automated Vehicle Legislation and Executive Orders
                     Introduce     Regulate   Regulate       Address     Call for   Permit        Local
                     Definitions   Testing    Deployment     Liability   Study      Platooning    Preemption
 Alabama                                                                      X
 Arizona*                              X                                      X
 Arkansas                                                                                X
 California               X            X            X           X
 Colorado                 X                                     X            X                         X
 Connecticut              X            X                        X             X                        X
 Delaware*                                                                    X
 Florida                  X            X                        X
 Georgia                  X                         X           X                        X             X
 Illinois                 X                                                                            X
 Louisiana                X
 Michigan                 X            X            X           X             X          X             X
 Nevada                   X            X            X           X
 New York                 X            X                                      X
 North Carolina           X                         X                        X           X             X
 North Dakota                                                                 X
 Pennsylvania
 South Carolina                                                                          X
 Tennessee                X                         X           X                        X             X
 Texas                    X                         X           X                        X             X
 Utah                     X                                                  X           X
 Virginia
 Vermont                                                                                 X
 Washington*                           X                                      X
 Washington DC            X                         X           X
 Wisconsin*                                                                   X
  * Executive Order
Source: Information gathered on the National Conference of State Legislatures online Autonomous Vehicles Legislative Database
http://www.ncsl.org/research/transportation/autonomous-vehicles-legislative-database.aspx

CENTER FOR AUTOMOTIVE RESEARCH 2018                                                                                        22
At the federal level, the most meaningful evolution is the House of Representatives passage of the SELF Drive Act (H.R. 3388) on September 6, 2017. The bill aims to expand federal preemption of state legislation on vehicle design, construction, and performance. The states would retain their powers to register and license vehicles and drivers, and regulate motor vehicle dealers that sell highly automated vehicles (SAE driving automation levels 3 to 5). The bill also expands the number of vehicles allowed an exemption from FMVSS to 25,000 in year one, up to 100,000 in year three and four of production. Finally, the bill establishes a new timeline for NHTSA developing rules and standards for highly automated vehicles. The Senate Commerce, Science, and Transportation Committee sent a similar bill called AV START Act (S. 1885) to the Senate floor on September 28, 2017. The bill was amended and reported to the full Senate on November 28, 2017, and has yet to be discussed by the full Senate. On September 12, 2017, NHTSA released the second version of its federal guidance for Automated Driving Systems (ADS), A Vision for Safety 2.0. The new guidance focuses on SAE driving automation levels 3-5, revises elements of the safety self-assessment, and clarifies the role of federal and state governments. The 2017 document reinforces the voluntary nature of the guidelines and does not contain a compliance requirement or enforcement mechanism. In Europe, there is also a two-tiered effort to provide a legal framework for CAVs—both at the national and European Union level. The approach of European countries, such as Germany that passed a law in May 2017 is more cautious than the U.S. stance. Germany’s new law allows the operation of automated vehicles on public roads as long as a driver is sitting behind the wheel at all times ready to take back control if prompted to do so by the AV. China is gradually opening up its roads to self-driving cars. The government announced in December 2017 that companies registered in China would be able to obtain temporary approval to test AVs on certain roads and under certain conditions. This action comes after in 2016 Chinese authorities banned self-driving vehicles from the country's highways pending new regulations that have yet to be released. Similarly, Japanese authorities began to allow testing of CAVs on public roads only in May 2017. Previously, Japanese regulatory action in 2016 only allowed testing of CAVs on public roads with a person in the driver’s seat. Infrastructure Innovative mobility services have already impacted cities in transformational ways and CAVs will contribute to substantial changes in urban, suburban, and rural areas. These new services and technologies will transform how people move, and where they work and live. There will be significant changes in travel patterns, land use decisions, and environmental sustainability in the coming decades, and public agencies and planners will need to plan for and adapt quickly to many of these changes. Human-driven vehicles will share the road network with CAVs for decades as the transportation system is in transition. In the long term, widespread CAV adoption, and to a lesser extent IMS, may render some infrastructure projects currently in the pipeline obsolete, such as roadway capacity expansion, corridor upgrades, or new roadways. Conversely, IMS and CAV adoption may increase the need for ITS and other infrastructure deployments, traffic signal updates, bicycle and pedestrian improvements, and transit investments. Increasingly, municipalities are considering whether to give access to IMS with high-occupancy in transit- only lanes or to allocate specific parking or bike docking space. In the medium- to long-term, communities can convert some on-street parking, turn lanes, or service roads into loading zones for CENTER FOR AUTOMOTIVE RESEARCH 2018 23
You can also read