Energy Transition Trends 2019 - China, Europe, USA - Dena
←
→
Page content transcription
If your browser does not render page correctly, please read the page content below
Energy
Transition
Trends 2019
China, Europe, USA
Implementing Unit   Financial Support

Technical Support
International Trends in Energy Transition                                                     02
1. China                                                                                      04
Building a Clean, Low Carbon, Safe and Efficient Energy System                                04

Outlook: Three Revolutions are the Future Development Trends in China Energy Sector           08

Conclusion                                                                                    08

2. European Union (EU)                                                                        09
Main Drivers and Long-term Energy Targets for a European Energy Transition                    09

The “Clean Energy for all Europeans” Package                                                  10

Transfer to China                                                                             13

3. Germany                                                                                    14
Status 2018: RE Power Production Caught up with Power Production from Hard Coal and Lignite   14

Germany’s Coal Phase-out According to Recommendations from the Commission for Growth,
                                                                                              15
Structural Change and Employment

Transfer to China                                                                             16

4. Denmark                                                                                    18
Higher Share of RE in Energy and Power Consumption                                            18

Transition in Close Cooperation between Public and Private Sector                             18

Holistic Long-term Energy Planning                                                            19

Setting and Meeting Ambitious Energy Targets                                                  19

New Ambitious Energy Agreement Unanimously Approved                                           19

Flexibility Key for Renewable Energy Integration                                              21

Transfer to China: Large-scale RE Integration and Market Transformation                       21

5. United States of America (USA)                                                             22
Power System Transition: Where the U.S. Stands                                                22

Current Focus Points and Potential                                                            23

Transfer to China                                                                             25

References                                                                                    26
Energy Transition Trends 2019
International Trends in
Energy Transition
Global warming affects all countries and can only be tackled in a joint international effort. The Paris
agreement was a crucial milestone in the fight against climate change. For the first time, virtually all
countries worldwide acknowledged the threat of global warming and commonly agreed on “holding
the increase in the global average temperature to well below 2 degree above pre-industrial levels and
pursuing efforts to limit the temperature increase to 1.5 degree above pre-industrial levels.” To date,
over 180 countries have submitted their so-called Nationally Determined Contributions (NDCs) to the
United Nations and published national greenhouse gas (GHG) reduction targets.
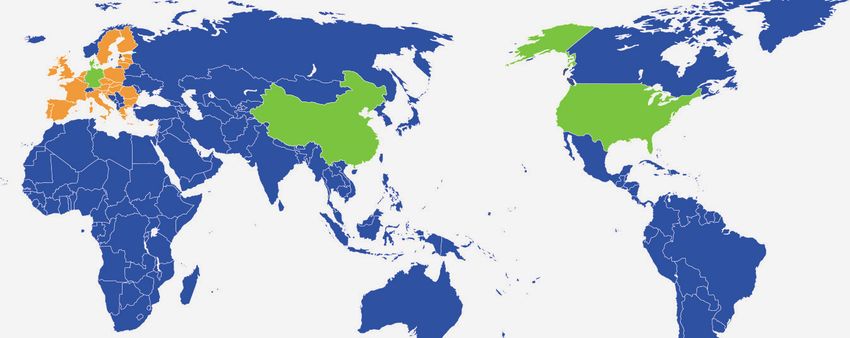
Figure 1: Overview of Key cCountries’ GHG Reduction Targets a a
The data shown
in the graphic are
based on either
Nationally Determined
Contributions (NDCs)
submitted to the United
Denmark Nations (UN) or, in the
• minus 48% by 2030 China
• minus 80-95% by 2050 • peaking of CO 2 emissions
case of Denmark and
around 2030 Germany, additional
Germany • lower CO 2 emissions per
• minus 55% by 2030 unit of GDP by 60% to 65% national targets. Unless
from the 2005 level
• minus 80-95% by 2050 stated otherwise, the
EU28 USA
base year for all targets
• minus 40% by 2030 • minus 4.6% by 2030 is 1990. In order to allow
• minus 80-95% by 2050 • minus 14.9-17.3% by 2050
for comparability, for the
U.S., official NDC targets
with base year 2005 have
been converted to a base
Key Elements for a Successful Energy Transition Worldwide: year 1990 using data
from the Environmental
Protection Agency
• International exchange of experiences and mutual learning. (EPA). The Danish GHG
• Clear long-term vision, elaborated and regularly revised mid-term targets and flexible mind-sets reduction target for
for short-term adjustments. 2030 is based upon the
• An integrated approach that allows for a cross-sectoral optimization of the energy preliminary Danish non-
ETS reduction target of
39% compared to the
2005 level and is not an
In the past years, many countries have begun to transition their energy systems towards a more official Danish target.
sustainable energy supply based on renewable energies (RE). The transition of the Chinese energy
system takes place in the context of similar developments around the world. The paths all these
countries have undertaken so far vary and depend on a number of variables, such as their different
starting points, geographical locations, or political and social setting. This report provides a short
summary of the current status of the energy transition in China, followed by case studies to illustrate
this variety:
2Energy Transition Trends 2019
• The European Union (EU) as the world’s biggest market is a leading global player and a strong
advocate for the fight against climate change. With the “Clean Energy for all Europeans” package,
significant legislation for the European energy transition has currently been passed.
• Germany, as Europe’s biggest economy and most populous country, is a particularly good example of
a highly industrialised nation that aims at decarbonising its economy. The results of the so-called coal
commission setting the way for a coal phase-out are being observed worldwide.
• Denmark is widely considered a pioneer when it comes to RE, particularly wind energy, and the
transition of its electricity and heating system. Recently, Denmark’s political parties reached an
ambitious new energy agreement.
• The United States, being a vast territorial state with a complex political system, is another example
for the wide variety of the variables mentioned above.
These countries all have in common the experience of acting in a highly dynamic and internationally
intertwined context while transforming their energy systems from a rather centralised approach with
continuous energy generation based on fossil fuels to a more decentralised system with fluctuating
energy generation from thousands of energy production facilities (wind, solar, and biomass). This
requires that politics and regulation are governed by a clear long-term vision, with elaborated and
regularly revised mid-term targets and continuous concrete adjustment steps on a short-term basis.
3Energy Transition Trends 2019
1. China
Building a Clean, Low Carbon,
Safe and Efficient Energy System
China is in the beginning of an energy transition with the aim of building an energy system for the
future. At the 19th National Congress of the Communist Party of China, President Xi Jinping confirmed
that China will promote a revolution in energy production and consumption. The country’s plans
emphasize shifting economic development from high growth to high-quality growth, a paradigm shift
that also applies to the energy sector. With the important milestones for 2020, 2035 and 2050, China
plans to develop a “clean, low carbon, safe and efficient energy system”.1
This chapter summaries the energy transition achievements of China in 2018 and future trends towards
2030. After a brief review of 2018 energy consumption, carbon emissions and power mix changes, we
review recent changes and newly announced policies, especially concerning renewable energy and
the upcoming phase-out of subsidies. China has begun to introduce a renewable energy obligation,
renewable tendering policies, and subsidy-free wind and solar pilots. Chinese policy-makers have faced
delays in building out the national Emissions Trading System (ETS) and regional spot power markets.
The chapter concludes by summarizing challenges facing China’s energy transition overall.
China is Still under Pressure of Carbon Reduction
China’s carbon dioxide emissions intensity (CO2 emission per unit of GDP) fell by 4.0% and energy
intensity (energy consumption per unit of GDP) decreased by 3.1% in 2018. Although both intensities
decreased, electricity generated from thermal power plants grew 6.7% and secondary industry’s energy
consumption grew 7.6%, implying that carbon- and energy-intensity improvements are primarily the
result of economic output outpacing growth in carbon emissions and energy use. Growing secondary
industry energy consumption could pressure China’s policies on coal caps and carbon reductions.
Energy Consumption Continues to Transform
China has seen progress in its efforts to transition away from coal, which includes scaling up other
energy sources as well as restricting coal use in key regions. In 2018, China had total primary energy
consumption of roughly 135.98 PJ, representing annual growth of 3.3%. Although raw coal production
increased by 4.5%, its share in total primary energy consumption declined below 60% for the first time.
Meanwhile, 2018 consumption of crude oil rose 6.5% and natural gas consumption grew 17.7%. China
is increasingly reliant on imports of oil and gas: imports accounted for 70.9% of oil consumption and
45.3% of gas consumption in 2018.
Electricity Consumption Continued to Increase
China’s total electricity consumption in 2018 reached 6846 TWh, an 8.5% annual increase, the highest
annual growth since 2012. Secondary industry contributed five percentage points of this growth, led
by high technology and equipment manufacturing industries, whose electricity consumption grew
9.5%. Tertiary industry consumption also increased sharply, led by telecom, software, and information
technology. As the trends of urbanization, electrification of heating, and rising living standards
continue, residential electricity consumption as also continued to show strong growth.2
4Energy Transition Trends 2019
Renewable Energy Continues to Grow, Though Coal Power Rebounded
In 2018 China added 120 GW of new power capacity, reaching 1,900 GW total capacity. Non-fossil energy
resources took up 73% of this newly added capacity. In 2018, the power sector in China generated 6,990
TWh, 30.9% of which was from non-fossil energy sources, of which 26.7% was renewables and the
remainder from nuclear.3 China added 20.59 GW of new wind capacity, of which 47% was in East Central
and South China, diversifying wind power development across more of the country.4 China added
44 GW of new solar PV, 17% below the amount added in 2017 but above market expectations. The
proportion of incremental power capacity of distributed solar PV accounts for 47% which shows parallel
development of centralized and distributed solar PV markets.
Figure 2: 2018 Incremental Installed Capacity (Left); 2018 Incremental Power Generation (Right)
33.9%
50 400 7.2%
44
324
Power Generation (TWh)
Installed Capacity (GW)
40
2.8% 300
31
30
12.4%
200
20
20
24.2% 2.5% 20.2% 50.8%
100 18.6% 3.2%
10 9 8 20.7% 61 60 14.0%
46 38
3 11
0 0
Thermal Nuclear Hydro Wind Solar Biomass Thermal Nuclear Hydro Wind Solar Biomass
Renewable Energy Curtailment Decreasing
Figure 2
China has improved uptake of renewable energy in the past two years. In 2018, China experienced
Notice: Thermal power
wind power curtailment of 27.7 TWh, a rate of 7%, a 5-percentage-point improvement versus 2017. In = thermal in CEC
2018, China saw solar power curtailment of 5.49 TWh, or 3%, 2.8 percentage points lower than in 2017. datasheet – biomass
Officials cited various explanation for high curtailment in certain regions, including high proportion of in NEA datasheet.
renewable energy concentrated in certain provinces, competition with large scale thermal power plants Source: Biomass data -
for operating hours, and inadequate transmission capacity.7 China National Energy
Administration, January
20195; the rest date -
China Electricity Council,
December 20186
Figure 3
Source: China National
Energy Administration,
from March 2014 to
February 20198
Figure 3: China 2018 Curtailment of Wind (Left) and Solar PV (Right)
100 20% 100 20%
17%
15%
80 16% 80 16%
12%
11% 11%
60 12% 60 9% 12%
8% 50 7% 10%
42
40 34 8% 40 8%
6%
28
16 13
20 4% 20 3% 4%
5 7 7 5
2
0 0% 0 0%
2013 2014 2015 2016 2017 2018 2014 2015 2016 2017 2018
Wind Curtailment (TWh) Wind Curtailment Rate PV Curtailment (TWh) PV Curtailment Rate
5Energy Transition Trends 2019
Release of Renewable Energy Obligation Draft
China plans to adopt provincial level targets for renewable electricity consumption in 2019. The
implementation mechanisms consist of a renewable obligation enforced by provincial grid companies,
and green certificates that enable compliance entities to meet their obligation. The government
kicked off the development of China’s renewable energy obligation policy in 2001.9 Due to provincial
objections and other factors, the policy has experienced delays lasting nearly two decades. In 2017,
National Energy Administration (NEA) relaunched the process and issued a third renewable obligation
policy draft in November 2018.10 The policy sets an explicit goal of encouraging renewable electricity
consumption, especially to increase short-term uptake of existing wind and solar. It also aims to address
wind and solar curtailment, inadequate transmission of renewable energy between provinces, and
bilateral power trading that might discourage large customers from purchasing clean energy. NEA sets
renewable electricity consumption targets by province and provides measures to achieve them. Those
entities include provincial grid companies, stated-owned and private distribution grid companies,
electricity retail companies, industrial enterprises owning their own power plants, and large end-users
participating in bilateral electricity trading. Present plans call for the policy to go into effect in 2019.
New Wind Power Projects Required to Participate in Tenders Since 2019
As NEA pushes to wind down feed-in tariffs for new projects, since the beginning 2019 China has
required all new provincial centralized onshore wind and offshore wind power projects to participate
in tenders to receive construction quotas and feed-in tariff subsidies. The weight of price in assessing
bids is at least 40%. In December 2018, wind-rich Ningxia province announced the bidding results for its
first wind power auction.11 The auction results show that price was not the only factor in determining
winning bids.
Figure 4: Ningxia Onshore Wind Power Auction Results Figure 4
Note: Dots scaled by
0.60 approved project size.
Project Serial Number (Approved) Source: Ningxia DRC12
0.55
Winning Price (RMB/kWh)
Benchmark Fit: RMB 0.49/kWh
0.50
0.45
0.40
0.35
0.30
1 2 3 4 5 6 7 8 9 10 11 12 13 14 15 16 17 18 19 20
A Nationwide Unified Solar Tendering System is under Discussion
China has long experience with renewable energy tenders: NDRC launched the first renewable tender
in 2003.13 Since 2016, the government allowed all utility-scale PV projects to participate in tenders. As a
reward for regions that have used competitive bidding to reduce FiT subsidy payments, the government
grants proportionally higher annual provincial PV construction quotas.14 This policy, designed to lower
costs and reduce the subsidy burden, has partially achieved these objectives.15 Policymakers are now
discussing a nationwide solar tendering system to replace provincial feed-in tariff capacity quotas. One
possibility is an annual national tendering process, in which provincial governments would provide a list
of local tendering projects to NEA, and NEA would select projects based on accepting projects starting
from the lowest price until the amount of annual subsidies is used up. Provincial governments would
have to confirm that local consumption is adequate to integrate the added capacity.
6Energy Transition Trends 2019
Figure 5: Solar Tendering Policies in China
2015.06 2016.06 2019
Top-runner PV tendering 8 Top-runner PV bases Nationwide unified
mechanism launched, The announced, 5.5 GW in solar tendering system
first demonstration base total. under discussion
of 1 GW was determined.
2016.05 2017.09
NDRC and NEA allowed all 13 Top-runner PV
utility-scale PV to participate bases announced,
tenders and clearly put forward 6.5GW in total.
price as the main criteria.
Plans to Scale up Subsidy-free Wind and Solar Projects
In January 2019, NEA and NDRC jointly announced a plan to launch subsidy-free wind and solar pilots
in regions with superior wind or solar resources and high local electricity consumption.16 Since these
pilots will not receive national government subsidies, their capacity won’t affect the annual provincial
wind and solar feed-in tariff project construction quotas. The tariff of the pilots must be the same or
lower than the local benchmark feed-in tariff for coal plants.17 By providing another tool to promote
renewable energy and bring down costs, the pilot policy should help scale up wind and solar in the most
cost-effective regions, and thereby accelerate the phase-out of subsidies. China anticipates wind and
solar will generally no longer receive subsidies in the early part of the 14th Five-Year Plan period (2021
to 2025).
China’s National ETS Marks First Anniversary
China’s national ETS was officially launched at the end of 2017. At the time, the schedule for establishing
the ETS called for a preparation phase, followed by trial operation, and then official operation. The
ETS currently remains in the preparation period; China has been making efforts on regulation system
building, infrastructure construction, verification of historical emission data from major emissions
entities, capacity building, and initiating carbon trading in the power generation industry. A national
data reporting system has been established with industrial emissions data from 2016 and 2017.
Although the design of the allocation system has yet to be published, an anonymous expert cited by
Energy Observer stated that policymakers plan to tighten carbon allowance allocation principles and
put into place an allowance distribution mechanism using baselines.18
Spot Power Market Pilots Delayed
NDRC and NEA jointly announced the first batch of spot power market pilots in August 2017. These
pilots covered eight regions and aimed to complete market designs by the end of 2018.19 Almost
all pilots have faced delays due to various difficulties in 2018. For instance, the pilot in Zhejiang
saw disagreements among policymakers and grid officials concerning grid participation in market
organization and annual account settlement. Provincial restraint of coal use will also affect the market
position of thermal power plants.20 The government has required the eight spot market pilots to
accelerate the research and preparation for initiating spot markets and drafting market operation
regulations.21 Pilots should start commissioning by the end of June 2019 provided no special obstacles
arise, and provinces should report progress monthly to responsible government departments. At
present, three pilots have already started the process: Guangdong, Gansu and Shanxi.22 The spot market
in Guangdong is well underway, although electricity from outside the province cannot participate
in trading, influencing its capability of reflecting actual power demand and supply information. The
system also lacks support mechanisms such as ancillary services markets and financial futures.23
7Energy Transition Trends 2019
Spot Market Situation Affecting Competitiveness of Wind and Solar
During the first operating period of spot power markets, renewable power may face a bigger challenge
to be competitive with coal power. The 13th Five-Year Plan (2016 to 2020) stipulates that without
subsidy, wind power should be competitive with coal benchmark tariffs and solar PV should be
competitive with retail electricity prices by 2020.24 While wind and solar are likely to easily reach current
benchmark coal tariffs, market trading may result in still lower prices for coal power, reducing the
competitiveness of wind and solar. Environmental taxes and prices for other externalities are currently
too low to have a major impact on the price of coal power relative to renewables.25
Outlook: Three Revolutions are the
Future Development Trends in
China Energy Sector
At the 19th CPC National Congress, the central government proposed three revolutions to promote
economic development, covering economic quality, efficiency, and dynamics.26 NEA applied this
concept to the energy sector in its 2018 work guidance as follows.27 Quality Revolution is about the
optimization of existing and incremental energy mix by coal phase out and renewable expansion.
Efficiency revolution promotes synergetic development of energy industries, as a result to improve the
efficiency of the whole energy system. The dynamics revolution relies on technological and market-
oriented innovative strategies to drive and diversify energy sector development.
Based on the projection of China National Renewable Energy Centre (CNREC), China should add 150-
350 GW wind and solar power capacity annually in 2020’s, of which 65-183 GW for wind and 71-183 GW
for solar, in order to achieve the below 2 degree target. In the long-term, wind and solar will dominate
power supply in the power sector, under this scenario.28
Figure 6: Annual Growth of Wind and Solar Capacity from 2017 to 2050 Figure 6
under the Below 2 Scenario Source: China National
Renewable Energy
Centre, December 201829
Annual Growth of Wind and Solar
150
Power Capacity (GW/year)
100
50
0
2018-2020 2021-2025 2026-2030 2031-2035
Below 2 Wind Below 2 Solar
Conclusion
In 2018, China saw various changes in energy transition process as well as in renewable energy policy
formulation. The energy consumption of the country continued to gradually shift away from reliance
on coal, but carbon emissions rose due to strong growth of secondary industry. Electricity consumption
also grew faster due to the improved economy. In power sector, wind and solar power generation rose
rapidly, and the longstanding problem of curtailed energy from these sources began to improve.
To build a clean, low carbon, safe and efficient energy system, the government adopted a series of new
policies and regulations for the sustainable development of renewable energy. In 2018, NEA required
all new wind power projects to participate in tendering since 2019, and it kicked-off subsidy-free wind
and solar power pilots that will receive incentives. Currently the renewable obligation mechanism and a
nationwide solar tendering system are under discussion. These efforts will be helpful for a cost-effective
renewable power expansion. In the future, China’s energy transition will focus on quality, efficiency and
dynamics’ improvement.
8Energy Transition Trends 2019
2. European Union (EU)
Main Drivers and Long-term Energy Targets for
a European Energy Transition
The EU has ambitions to be the leading force in the fight against climate change. The EU has agreed
to spend at least 20 percent of its budget for 2014-2020 – as much as €180 billion − on climate
change-related actions.30 An EU-wide energy system transition is seen as an important driver for
the decarbonisation of the economy. Decarbonisation could be achieved by implementing common
targeted policies and advancing the structural integration of the EU.
In addition to the decarbonisation of its economy, the EU pursues two other important goals with its
energy transition: first, reducing the EU’s dependency on energy imports, which currently amount to
more than 50% of total energy consumption31, by increasing the share of renewable energies while also
increasing energy efficiency. Second, bolstering growth and employment in new industries considering
the developing global need for clean energy supply and the development of new technologies for a
sustainable energy system.
The long-term goal of reducing GHG emissions by 80-95% by 2050 compared to 1990 levels was set in
October 2009 by the European Council. In October 2014, the EU agreed on more concrete, EU-wide
targets for 2030. In August 2018, the targets for both energy efficiency (non-binding) and the share of
renewable energy (binding at EU-level) were reviewed and increased (see table below) according to this
strategy update.
The targets are to achieve a more competitive, secure and sustainable energy system and to meet the
long-term 2050 greenhouse gas reduction target. The targets are set at EU level, but do not prevent
Member States from pursuing their own, more ambitious targets.
Table 1: EU Energy Targets for 2030 and 2050
2030 2050
GHG Emissions Reduction >40% 80-95%
Compared to 1990 Levels
Energy Efficiency Increase >32.5% --
Compared to “Business-as-usual”-Projections
Share of Renewable Energy >32% --
of Total Energy Consumed
9Energy Transition Trends 2019
The “Clean Energy for all Europeans” Package
Arguably the most far-reaching change in European energy policy currently comes from the Clean
Energy for all Europeans legislative package (also called the Winter Package): Eight legislative acts aim
at shaping a new framework for the European energy policy in order to reach the EU energy targets for
2030 and 2050. They are grouped into the following three topics: the governance of the Energy Union
after 2020, the design of the electricity market, and the market conditions for renewable energies and
energy efficiency.32
Governance of the Energy Union after 2020
Regulation (EU) 2018/1999 on the Governance of the Energy Union and Climate Action 33
The regulation introduces a reporting mechanism for all Member States, obliging them every ten years
to set out national objectives, targets and contributions for the five dimensions of the Energy Union (see
figure below) in their respective “integrated national energy and climate plan”. Every two years, each
Member State shall report to the European Commission on the status of implementation of that plan.
Updates to the plan can be made if the result is an increase of the level of national ambition. In addition,
the new regulation contains detailed provisions on public consultation and regional cooperation and in
particular establishes a formal multi-level climate and energy dialogue.
Figure 7: Five Dimensions of the EU Energy Union
Energy Security
The Internal Energy Market
Energy Efficiency
Decarbonisation
Research, Innovation, Competitiveness
Furthermore, every ten years each Member State shall submit its long-term national energy and climate
strategy with a perspective of at least 30 years and update that strategy every five years.
The role of the EC is to monitor and assess the progress made by the Member States on a biennial basis.
If the national targets and/or actions of the Member States prove to be insufficient to reach the EU
targets and if recommendations by the EC to fill this gap are not considered by the Member States, the
EC shall be able to introduce measures on EU level in order to make sure the EU targets are reached.
Design of the Electricity Market34
Recast of the Regulation Establishing an EU Agency for the Cooperation of Energy Regulators (ACER) 35
The new regulation reforms and reinforces the Agency for the Cooperation of Energy Regulators (ACER)
as an independent European regulator that can counterbalance national (political) interests, creating
a more powerful agency that oversees the integrated energy market and decides on regulatory issues
with cross-border relevance. This includes adopting and implementing electricity network codes as well
as amending and approving methodologies developed by the European network of transmission system
operators (ENTSO-E) for generation adequacy assessments and electricity supply crisis scenarios.
Recast of the Directive on Common Rules for the Internal Market in Electricity 36
The new directive lays down key rules relating to the organisation and functioning of the European
electricity sector, in particular rules on consumer empowerment and protection, on open access to the
integrated market, on third party access to transmission and distribution infrastructure, unbundling
rules, and on independent national energy regulators. Several measures are included to empower
consumers and prosumers to actively take part in the internal electricity market, such as by introducing
10Energy Transition Trends 2019
the right for consumers to demand dynamic price schemes from their energy supplier. The directive also
defines the roles of aggregators and specifies the tasks and responsibilities of both transmission system
operators (TSOs) and distribution system operators (DSOs) and sets out modes of cooperation among
Member States, regulatory authorities and TSOs towards the creation of a fully interconnected internal
electricity market.
Recast of the Regulation on the Internal Market in Electricity 37
The new regulatory framework for the European internal electricity market sets fundamental principles
for well-functioning, integrated electricity markets as well as fair rules for cross-border exchanges in
electricity. By that competition shall be enhanced within the internal market in electricity while taking
into account the particular characteristics of national markets.
The regulation contains:
• General rules for balancing markets, day-ahead and intraday markets;
• A framework for a more market-based dispatching of power plants, limiting priority dispatch for
renewables and high-efficiency cogeneration to small installations, pre-existing installations and
demonstration projects;
• A process for defining regional electricity markets (bidding zones) in order to improve cross-border
trading and hence economic efficiency and security of supply;
• New rules on network tariffs that shall prevent discrimination against energy storage and demand
response;
• Tasks and responsibilities of the European Network of Transmission System Operators for Electricity
(ENTSO-E) and the framework for so-called Regional Coordination Centres with the goal to further
develop the regional coordination of TSOs and to increase reliability and efficiency of cross-border
grid and system operation;
• A framework for a new European entity for DSOs in order to raise efficiencies in the electricity
distribution networks in the EU and ensure close cooperation with TSOs/ENTSO-E.
New Regulation on Risk-preparedness in the Electricity Sector 38
An assessment of the earlier Security of Supply Directive revealed significant shortcomings regarding
the interconnectedness of national energy systems. The EU has thus replaced the directive with a new
regulation that lays down rules for the cooperation between Member States in view of preventing and
preparing for managing electricity crises (such as due to extreme weather conditions, cyberattacks or
shortage of fuel) in a spirit of solidarity and transparency. It also takes into account the requirements of
a competitive internal market for electricity.
Notably, the new regulation contains the following measures:
• Establishing a methodology for identifying cross-border electricity crisis scenarios at a regional level
(to be developed by ENTSO-E);
• Developing a European methodology for short-term and seasonal adequacy assessments in order to
regularly assess the security of supply (to be developed by ENTSO-E);
• Implementing mandatory national risk-preparedness plans including mechanisms for cross-border
exchange of information and reporting obligation in case of crisis;
• Developing an approach to utilize all market-based options before triggering other measures of crisis
prevention.
Renewable Energies and Energy Efficiency
Directive (EU) 2018/2001 on the Promotion of the Use of Energy from Renewable Sources39
The directive establishes an EU-wide 32 % binding target for the share of RES in final energy
consumption by 2030. Different to the 2020 strategy, individual targets per Member State were not
defined. However, the national targets for RES share for 2020 have now become a binding baseline. By
2023, the EC is required to re-evaluate the 32 % target and, in case of need, to introduce gap-fillers—
additional measures to reach the common target.
11Energy Transition Trends 2019 Furthermore, a number of concrete measures are set, such as: • Opening of RES support schemes to cross-border capacity providers as an option for Member States while setting indicative targets (2023-2026: 5 % of the newly-supported capacity per year; 2027-2030: 10% of the newly-supported capacity per year); • Setting a binding EU minimum target of a 14% RES share in the transport sector with advanced biofuels rising from low levels to a minimum share of 3.5 % by 2030; • Reducing existing barriers for prosumers to consume their self-produces energy and to participate in the energy market; • Increasing the Member States’ share of heating and cooling from RES by 1.3 % per year (non-binding), with a lower target (1.1 %) set for Member States where waste heat and cold is not used; • Establishing higher GHG emissions savings criteria for biofuels and bioliquids. Member States are required to transpose the revised directive into their national legislation by 30 June 2021. Directive (EU) 2018/2002: Amended Directive on Energy Efficiency 40 A key element of this directive is the replacement of the current non-binding target of at least 27% reduction of energy consumption by 2030 (compared to projections made in 2007) with a more ambitious target of 32.5 %. This headline target may be revised upwards (but not lowered) on the basis of a new legislative proposal in 2023. Additionally, indicative targets for all Member States shall be formulated. The revised directive sets the new yearly energy savings obligation of 0.8 % of annual final energy consumption between 2021 and 2030. The EC is required to assess whether the EU as a whole has achieved its 2020 headline targets in energy efficiency and to evaluate the functioning of the revised directive. Further measures included are: • Introducing a new methodology for calculating energy savings as well as more far-reaching energy- savings obligations covering more sectors than under the previous directive; • Strengthening existing provisions on individual metering and billing based on real consumption, and introducing a new remote reading requirement; • Introducing requirements for new, advanced meters for district heating, cooling and domestic hot water to be remotely readable by 2020 (old meters will have to be replaced by 2027 unless this is proven not to be cost-efficient); • Improving transparency regarding the personal energy consumption of energy consumers by setting clear rules for better billing information and by strengthening the consumers’ rights to receive accurate information. Directive (EU) 2018/844: Amended Directives on the Energy Performance of Buildings and on Energy Efficiency 41 The revised directive contains a number of concrete steps for the buildings sector, such as: • Expanding the provisions for Member States to establish a long-term renovation strategy to support the renovation of the national stock of residential and non-residential buildings, both public and private. Long-term renovation strategies will need to be accompanied by a roadmap for a highly efficient and decarbonised national building stock by 2050, with indicative milestones for 2030, 2040, and 2050; • Formulating more clear requirements for the minimum energy performance of new buildings; • Introducing e-mobility requirements for new non-residential buildings (as well as those undergoing major renovation): Generally, buildings with more than ten parking spaces should have at least one charging point, while pre-cabling should apply to at least one in five parking spaces. In addition, the EC is required to publish a report on the promotion of e-mobility in buildings by 1 January 2023, which could lead to further measures being introduced; • Establishing a common scheme for rating the smart readiness of buildings. The rating shall be based on an assessment of the capabilities of a building or building unit to adapt its operation to the needs of the occupant and the grid and to improve its energy efficiency and overall performance; 12
Energy Transition Trends 2019

• Setting various thresholds (and some exemptions) for determining the needs for regular inspection of
  heating and air-conditioning systems.

The EC should review the revised directive by 1 January 2026, with the possibility of proposing further
changes. Member States will be given until 10 March 2020 to transpose the revised directive into
national legislation.

Transfer to China
Subsidiarity – a Political Decision-making Process that Allows for
Regional Differences
As set out in the Paris Agreement, China and the EU both have the same overarching goal: to develop a
low-carbon, clean and efficient energy system as a basis for economic development.

The inherent value of a comprehensive policy approach for the whole of Europe is now clear. This is
a very important conclusion that can be drawn from the past years of energy policy in the EU which
now culminated in the Winter Package. Instead of looking separately at the different sectors and
fields of action, the Winter Package has aligned all policy measures regarding energy efficiency, RE
development, energy market development as well as R&D and innovation under one umbrella.

In addition, the example of the Winter Package highlights the role of the EU institutions in the pursuit
of defining common policies of Member States that may come from rather different starting points.
Similarly, China faces the challenge how to do two things at a time: following a consistent energy
policy and at the same time taking into consideration the differences between its regions and take into
account geographical or climate conditions due to historic developments of the structure of energy
supply.

The general approach of the EU is following the principle of subsidiarity: on the one hand, the EC as
a central entity focuses on setting and monitoring clear common targets and on making sure that
the general framework (market structures, regulations, infrastructure etc.) allows for a dynamic
development towards a new energy system. On the other hand, the Member States have both the right
and the duty to implement such policies that contribute to the common targets while at the same time
respecting their specific national conditions and potentials.

Besides obvious differences between the political and administrative systems of China and the EU, it
should be highlighted that integrated energy markets are the key instrument for a successful energy
transition. Regional and/or sector specific characteristics can and should be taken into account within
the general framework of such energy markets.

The EU-China Energy Cooperation Platform (ECECP)
The ECECP is a €3.5 million project funded by the EU with the overall objective to enhance the
mutual understanding between EU and China in each other’s energy sector and to contribute to a
global transition towards clean energy. Guided by the draft Joint Statement on the Implementation
of the EU-China Cooperation on Energy (July 2018), the main theme of the platform’s activities is the
transformation of the energy system. It will include exchanges in energy system modelling, energy
efficiency, LNG market development, and how to accelerate the commercialization of innovative
energy technologies. ECECP will also support EU energy businesses regarding market access in
China (communicating common market entry barriers; showcasing of EU competencies; information
on known issues and work-arounds, new regulations, incentive policies, standards, compliance
requirement etc. related to the energy sector).

The project is being implemented over three years by a consortium led by ICF Consulting, Energy
Research Institute of China (ERI) and China Energy Conservation and Environmental Protection
Consulting (CECEP). ECECP is financed under the Partnership Instrument which underpins new
relationships with countries that have graduated from bilateral development aid and for which the
EU has a strategic interest in promoting links with. Overall steering is provided by the European
Commission and in co-operation with the National Energy Administration (NEA) in China.

                                                                                                                          13
Energy Transition Trends 2019
3. Germany
Status 2018: RE Power Production
Caught up with Power Production from
Hard Coal and Lignite42
38.2 percent of the power consumed was generated by wind, photovoltaics, biomass and hydropower.
Among the renewables, especially photovoltaics has seen above-average power production, thanks
to a very long and sunny summer. The increases in PV power production offset a below-average year
for wind and hydro energy. Especially the capacity expansion of wind power fell back behind previous
years’ track record.
In 2018, renewables produced 228.7 TWh electricity, which is 12.4 TWh or 5.6 percent more than in the
previous year. Largest increase showed the power production from photovoltaics with 17.5 percent
compared to 2017, now at 46.3 TWh. This is mainly due to a very sunny year with around 30 percent
more sunshine hours than on average. The increase in power production from wind fell back behind due
to less capacity additions and a less windy year: wind onshore produced 93.9 TWh electricity and wind
offshore 19.4 TWh. Power production from hydropower decreased by 20 percent to 16.9 TWh, mainly
due to drought.
Power production from conventional energy sources decreased to 420 TWh. Hard coal decreased the
most, by 11 percent or 10.6 TWh, reaching 83 TWh. The reasons for this were unit shut-downs, increasing
commodity prices for hard coal and CO2 emissions, and an increased rate of renewables feed-in. Power
production from gas also decreased by 4.3 percent, now at 83 TWh. Here, decreasing factors include
increased import prices for gas, as well as in increased renewables power production. The higher CO2
prices in the EU-ETS, however, partially led to a substitution of hard coal power production with gas
power production, due to gas power’s beneficial position in the merit order at times of high ETS prices.
Nuclear power production remained on the same level as in the previous year, contribution 76.1 TWh
electricity. The shut-down of one plant at the end of 2017 was compensated with higher full-load hours
for the remaining fleet of nuclear power plants. The next power plant will shut down in December
2019 in line with the German nuclear phase-out plan, in which all nuclear plants will phase-out until
December 2022.
Lignite power production remained on a high level with 146 TWh, decreasing only by 2.4 TWh or 1.6
percent.
Due to a lower energy consumption because of a warm winter, high commodity prices and a slight
decline in production, the share of renewables in total energy consumption increased from 13 percent
to 14 percent. Furthermore, Germany’s greenhouse gas emissions declined significantly by 5.7 percent
or 51 million tonnes CO2-equivalent. Additional to the low primary energy consumption in industry,
heating and transport sectors, due to the increased prices for emissions certificates in the EU-
ETS, power production from hard coal decreased and now contributes to 14.3 percent of the power
production.
14Energy Transition Trends 2019
The Grand Coalition is Expected to Advance the Framework for
Further Transformation of the Energy System
Politically, Germany looks back at the first year of the newly reinstated grand coalition between the
conservative parties CDU and CSU and the social democrats SPD. In this new government, some
cornerstones for the future of the energy system are to be set: the coalition treaty agreed to increase
the target for the expansion of renewables in power consumption to 65 percent in 2030. Further, grid
expansion was made a priority by introducing a new law that allows accelerated approvals for power
lines.
Most public attention focused on the Commission on Growth, Structural Change and Employment – the
so-called Coal Commission.
Germany’s Coal Phase-out According to
Recommendations from the Commission
for Growth, Structural Change and Employment43
The Commission for Growth, Structural Change and Employment was initiated in the coalition treaty
of the coalition among CDU, CSU and SPD. The commission’s mandate was to agree on a phase-out for
coal and the necessary measures to be taken in coal (lignite) mining regions, namely Lusatia and the
Rhineland. It was set up with stakeholders from mining regions, science, business and industry, energy
industry, unions and civil society and accompanied by the board of state secretaries.
Currently, about 22 percent of the German primary energy consumption is covered by hard coal and
lignite. Nearly all of lignite is mined domestically, while 7 percent of hard-coal was mined domestically
in 2018. Hard coal mining, however, has been phased-out end of 2018, so that all hard coal consumed
has to be imported starting 2019.
Four Pillars of the Coal Compromise
In January 2019, the commission concluded its work with a proposal which has yet to be transferred
into legislative measures. The proposal includes four pillars: phasing out coal, building strong and
sustainable regions, modernizing the power and energy system as well as absorbing negative effects on
vulnerable affected groups.
Phasing out Coal
Phasing out coal includes renouncing new coal-fired power plants as well as opening new mines. It
further concludes a step-by-step phase-out of coal until 2038 with two intermediate step stones in
2023, where only 30 GW coal (15 GW lignite, 15 GW hard coal) remain in the system and 2030, where the
coal capacity is reduced to 17 GW (9 GW lignite, 8 GW hard coal). In the commission’s base year 2017,
Germany had 43 GW coal capacity (23 GW lignite, 20 GW hard-coal).
In order to prepare the affected regions for the future, the commission established three pillars for
structural development: building strong and sustainable regions, modernizing the power and energy
system as well as reducing negative effects on vulnerable interest groups.
Building Strong and Sustainable Regions
The commission proposes to incentivize the creation of new jobs by modernizing the affected regions
as energy regions with a focus on research and development in future energy technology such as
power-to-X and storage. Additionally, modernized infrastructure such as railways and mobile internet
infrastructure help to make the regions attractive locations for new businesses and could help attract
new private investment.
Modernizing the Power and eEnergy System
Modernizing the power and energy system in Germany ensures system stability and security of supply
with reserves and new gas capacity. To allow effective climate mitigation, the expansion of renewable
energy is crucial as well. Making the energy system more flexible allows for efficient integration of
variable renewables.
15Energy Transition Trends 2019
Absorbing Negative Effects on Vulnerable Affected Groups
Transitioning vulnerable affected groups is eased by securing competitiveness with the compensation
of grid costs for affected industries as households. Additionally, a non-dismissal clause and labor market
measure are to ensure a smooth transition for workers in the affected industries and businesses.
Implementation of Suggested Measures
Short-term measures are suggested to be implemented until 2021, so that effects of the structural
management are immediate. The commission further suggests that the government frees financial
means to help especially large infrastructural measures. They assume an amount of 1.3 billion euros to
be invested over the course of 20 years.
To monitor, evaluate and adapt the phase-out plan as well as the structural measures, the commission
suggests continuous monitoring and progress reports as well as evaluations in 2023, 2026 and 2029 by
an independent expert panel. The commission’s proposal shall be translated into legislative measures in
the first half of 2019.
Transfer to China
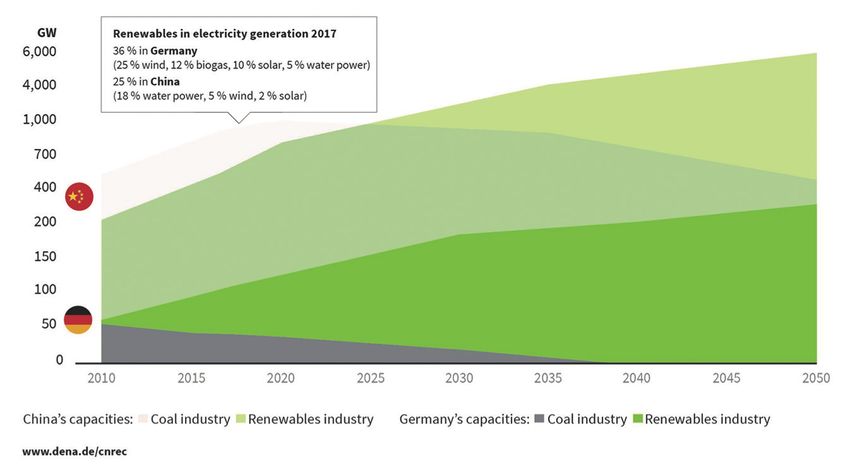
Energy Generation Capacities in Germany and China
Germany and China face similar challenges regarding the fulfilment of their climate protection targets:
CO2 emission-intensive lignite is the dominant domestic energy source and important heavy industries
need access to reliable and affordable energy. Both countries are increasing their renewable energy
capacities considerably. In contrast to Germany, coal capacities in China were further expanded in
recent years due to the high level of economic growth. However, similar to the suggestions of the
German coal commission, the China Renewable Energy Outlook 2018 (CREO) shows how coal power
generation in China can be significantly reduced by 2035 and be compensated by further dynamic
installation of renewables.
Figure 8: Projection of the Development of
Energy Generation Capacities in Germany and China (2015-205o)44
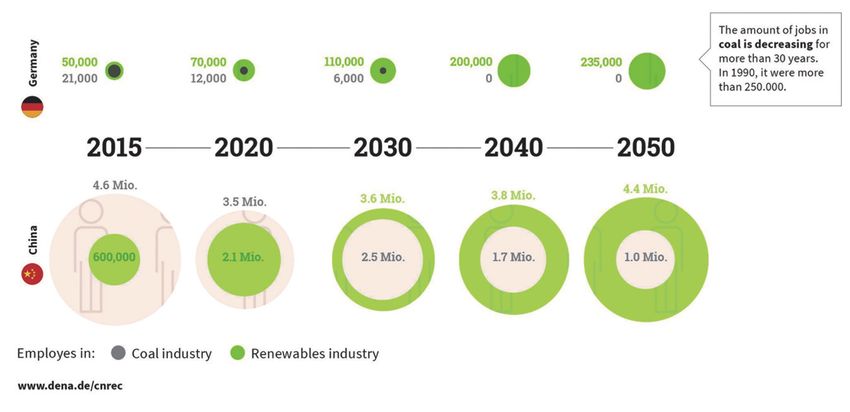
Employees in the coal and renewables industry
Furthermore, in both countries the energy transition has effects on the amount of employees in the two
sectors. In China, many people are employed in the coal industry, so a quick transition in order to reach
climate protection goals is a challenging task. In Germany, the structural change of the coal industry has
developed over several decades. In comparison with China, in Germany there are proportionately fewer
jobs affected by the transformation. The trends of the scenarios show that there are more new jobs
generated in the renewables industry than existing jobs lost in the coal industry, provided that the right
political course is set.
16Energy Transition Trends 2019
Figure 9: Projection of the Development of Employees in
the Coal and Renewables Industry in Germany and China (2015-205o)45
17Energy Transition Trends 2019
4. Denmark
Higher Share of RE in Energy and
Power Consumption
In 2017, Denmark continued to add renewable capacity to the system, which along with a good wind
year lead to a new record in the share of renewables in both energy and power consumption.
32.4 percent of the energy consumption where covered by renewables in 2017. In terms of power
generation Denmark set a new world record of covering 43.8 percent of the Danish power consumption
by wind power generating 14.8 TWh by onshore and offshore installations in Denmark. Power
production from solar power plants has increased again and now contributes 2.3 percent to the total
power production. Including the increasing usage of biomass for the power sector the average carbon
emission per produced kWh went below 200 gram compared to more than 500 grams in 2005.
With 32.3 percent of the final energy consumption coming from renewable source including biomass
in 2017 and with the planned additional renewable capacity to be installed in the next couple of years,
Denmark will surpass its obligations to the EU of 30 percent of final energy consumption with good
margin by 2020.
After a slight increase in the carbon emission from the energy sector in 2016 the emission again went
down in 2017 with a decrease of more than 5 percent. Since 1990 the carbon emission related to energy
has reduced by 33 percent despite that the final energy consumption has only been reduced by 1
percent in the same period. The transition toward renewable energy sources and improved efficiency
in the energy sector including combined heat and power generation are the key factors behind this
development.
Transition in Close Cooperation between
Public and Private Sector
Several long-term plans and strategies have been setting ambitious goals for the development in the
energy sector in Denmark. There has been broad political consensus about both the goals and the
implementation of the most important initiatives. The involvement and stimulation of both the private
sector and academia has also been very important for the changes in the Danish energy sector. It set
the basis both for the development of new technologies like renewable energy and energy efficiency,
and for the transformation of energy systems and planning including exploiting synergies like combined
heat and power generation, utilization of exceed heat from the industry, etc. The private sector has
provided important stepping-stones for policy makers to reach and even surpass energy targets and
ambitions.
Denmark started this journey without having all the solutions and answers. Both the public and private
sector have been able to mobilise funding for the development of new energy solutions in close
cooperation with universities and other part of Danish academia. However, as an open economy in
international competition all solutions have to pass the test of offering economically viable energy
services to companies and consumers going forward. A strong focus has been on maturing and reducing
costs of new energy technologies and systems to serve the Danish society with both economically and
environmentally sustainable products and solutions.
18Energy Transition Trends 2019
Holistic Long-term Energy Planning
For a sector characterised by major long-term investments like power plants, grid, etc., it was
important to provide visibility on long-term policies and thus business certainty which reduces risk
premiums and funding costs. For new and immature energy technologies, Denmark has been offering
economic frameworks like feed-in premiums securing the financial viability of the projects. These
support mechanisms have been closely monitored to make sure energy consumers would benefit from
improvements of the economic efficiency of emerging technologies.
An on-going dialogue between politicians, lawmakers, regulators and key stakeholders in the energy
sector including major utilities, technology companies and energy system operators has been key
factor in the development of energy policies and regulation in Denmark. The dialogue has ensured good
and effective decisions and solutions as well as a high level of investor certainty. Major changes in the
energy market have been analysed, discussed and in most cases some level of compensation has been
offered for disruption of traditional business models toward a low carbon future of the Danish energy
supply.
The transition of the Danish energy system has also included smaller consumers and private households.
This was done by using a combination of energy standards, incentives and public campaigns focusing on
energy efficiency, common energy solutions like district heating and changes in everyday behaviour to
secure a more energy efficient society. One of the biggest efficiency gains has been made in the heating
of Danish households with an 80% reduction in energy consumption per square meter since the 1960s.
Part of the stimulus of energy efficiency has come from introducing energy taxation for businesses and
private energy consumers. Raising the price of energy has improved the business case for investing in
energy saving technologies and systems.
Setting and Meeting
Ambitious Energy Targets
As a member of the EU since 1973, Denmark actively follows EU targets for the transformation of
the energy sector. Denmark has rapidly implemented the market and sector transformation of the
energy sector, including international energy trading and unbundling of the power sector. Denmark’s
“early mover advantage” also meant that the country specific targets in the EU’s energy strategy
2020 approved in 2009 were significantly higher than the EU average despite the lack of traditional
renewable energy options like large-scale hydro power. Denmark’s 2020 target includes a 31 percent
GHG reduction compared to 1990 level46 and as mentioned before getting 30 percent of Denmark’s final
energy consumption from renewable energy source – both well above the overall EU targets for 2020
that aim at a 20 percent GHG reduction compared to 1990 level and a 20 percent share of renewable
energies. Projections made by the Danish Energy Agency show that Denmark will most likely surpass
both targets with a GHG reduction of 32 percent in 2016 and renewable energy generation share already
at 32 percent in 2017.
New Ambitious Energy Agreement
Unanimously Approved
Not surprisingly Denmark is set to have more ambitious targets with respect to the EU energy targets
for 2030.47 Based upon these targets, the political negotiations on a new Danish energy agreement
began earlier this year in order to set the course and targets for the period beyond 2020 for the Danish
energy sector. High on the agenda was a further transformation away from fossil fuel based energy
sources, a further improvement of energy efficiency and the advance of a market based energy
sector securing a cost effective transformation and thus competitive energy prices for consumers and
enterprises.
19Energy Transition Trends 2019
Textbox 1: Key Elements in New Danish Energy Agreement
• Focus on ways and means to reach Danish energy target of covering 55 percent of gross
final energy consumption by renewable energy sources by 2030
• Further expansion of offshore wind power generation through tender for additional three
800 MW projects to be built before 2030
• Funding for technology neutral renewable energy tenders for additional onshore wind and
solar PV capacity and support scheme for biogas
• Support further electrification of Danish energy sector by lower and adjusted electricity
taxation
• More market-based energy systems in order to reduce the level of public support including
more competitive based and focused support for energy efficiency initiatives, further
liberalisation of the heat sector, etc.
In late June 2018 an agreement that includes all of the political parties represented in the Danish
parliament was reached aiming for more ambitious targets set by EU and responding to a call for
additional effort by the Paris Agreement to secure the 2 degree target. The Danish government is now
aiming at a renewable energy target of 55 percent of the gross energy consumption by 2030 responding
to the increase of the overall EU renewable energy target by 2030 from 23 to 32 percent. The current
“frozen policy scenario”48 shows that Denmark will be 15 percentage points off this target without
new political and regulatory initiatives. The new Danish energy agreement includes a target of adding
additional three 800 MW offshore projects by 2030 and funding of EUR 563m for technology neutral
renewable energy tenders. At the same time spatial planning for up to 10 GW of offshore wind capacity
in Danish waters will be conducted to insure that further offshore wind capacity can be established
quickly if so decided.
One part of the new energy agreement is also the explicit target to eliminate coal consumption in
the Danish power sector altogether by 2030. Coal accounted for almost 30 percent of Danish power
generation in 2016. The increase in wind and solar based power generation along with a further
transition toward biomass and biogas power generation is the main element in this transition toward a
zero coal based power sector in Denmark.
To support the electrification of the Danish energy supply including the use of more electricity in the
heating sector a reduction of taxation of electricity and a revision of other energy related taxes have
been proposed. The proposal also includes a reallocation and more specific support for certain energy
efficiency measures in the industry and for R&D of green energy solutions.
In the late autumn of 2018 the Danish government presented a climate and clean air act (Together for a
greener future) focusing on climate and air pollution from especially the transportation and agriculture
sectors. The main headlines of the plans are:
• Phase out the sale of new petrol and diesel cars in 2030
• Zero carbon emissions and air pollution from busses and environmental zones by in cities 2030.
• A climate- and environmentally-efficient agricultural sector, with a strong focus on research.
• Lower emissions from industry and housing including behavioural campaign with climate labelling
• Research efforts to develop carbon capture and storage technologies for use in Denmark’s fields and
forests
Political negotiations over the plan are still going on but selective initiatives including lower electrical
vehicles taxation have been enforced.
20You can also read