Bridge Economies of Energy Communities - Energy Communities and self-consumption Task Force - European Commission
←
→
Page content transcription
If your browser does not render page correctly, please read the page content below
bridge
Economies of Energy
Communities
Review of electricity tariffs and business
models
Energy Communities and              self-
consumption Task Force
Economies of Energy Communities: Review of
                                  electricity tariffs and business models

Economies of                               Energy
Communities
Review of electricity tariffs and business
models
April 2021

                   bridge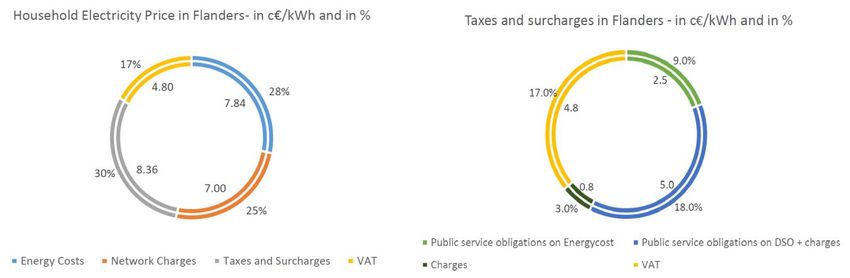
Economies of Energy Communities: Review of
                                                                         electricity tariffs and business models

LEGAL NOTICE

This document has been prepared for the European Commission. However, it reflects the views only of the authors,
and the Commission cannot be held responsible for any use which may be made of the information contained
therein. More information on the European Union is available on the Internet (http://www.europa.eu).

                                                    bridge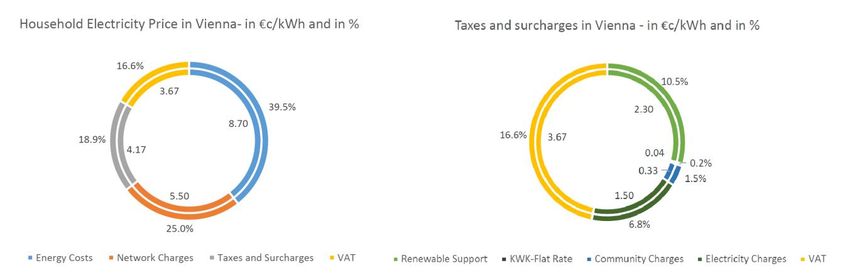
Economies of Energy Communities: Review of
                                                                             electricity tariffs and business models

DOCUMENT INFORMATION

Editors                                                            •   Andrej Gubina, University of Ljubljana,
                                                                       Slovenia
   •      Leen Peeters, Th!nk E                                    •   Maria Xylia, Sweco, Sweden
   •      Andreas Tuerk, Joanneum Research                         •   Magnus Linden, Sweco, Sweden
   •      Lucija Rakocevic, Th!nk E                                •   Marie Swenman,
   •      Christina Protopapadaki , Th!nk E                            Energimarknadsinspektionen, Sweden
   •      Malgorzata Matowska, Th!nk E                             •   Nico Primo, Coopernico, Portugal
   •      Quentin Lancrenon, Th!nk E                               •   Esteban Pastor Calatayud, ETRA, Spain
   •      Dorian Frieden, Joanneum Research                        •   Eric Vermeulen, Haulogy, Belgium
   •      Anna Eisner, Joanneum Research                           •   Jeroen Baets, Energent, Belgium
   •      Gabriele Comodi, Università Politecnica delle            •   Dominique Dhont, UGent, Belgium
          Marche                                                   •   Piotr Nowakowski, Polish National Energy
   •      Anna Pinnarelli, University of Calabria                      Conservation Agency KAPE, Poland
   •      José Pablo Chaves, Comillas                              •   Sanket Puranik, Smart Innovation Norway
   •      Panos Kotsampopoulos , NTUA                              •   Stratos Keranidis, DomX, Greece
                                                                   •   Konstantina Medesidi, HERON, Greece
Contributors                                                       •   Costas Baslis, HERON, Greece
                                                                   •   Kostas Komninos, DAFNI, Greece
   •      Melani Frulan, ZEZ, Croatia                              •   Alexandros Chronis, NTUA, Greece
   •      Jan Pellis, Stedin, the Netherlands                      •   Marten Saareoks, TREA, Estonia
                                                                   •   Nele Ivask, TREA, Estonia

Support from BRIDGE secretariat

   •      Panos Kotsampopoulos, ICCS – NTUA, BRIDGE Secretariat
   •      Shenja Ruthenberg, CLERENS, BRIDGE Secretariat
   •      Marcos Jareño, ZABALA, BRIDGE Secretariat Coordinator

Acknowledgements

The editors would like to acknowledge the valuable inputs from the BRIDGE projects consortia who filled in the
questionnaire and the TF Energy communities and self-consumption members, as well as members of the
Intensys4EU and the SPRING teams for their contributions to this BRIDGE Economies of energy communities
Report. The authors are grateful for the cooperation and assistance provided by CEER member national regulatory
authorities.

European Commission

   •      European Commission – Energy Directorate-General, Unit B5 “Innovation, research, digitalisation,
          competitiveness”
   •      European Climate, Infrastructure and Environment Executive Agency - Unit C.C2 “Horizon Europe Energy”

Bridge WG/TF Chairmanship

   •      Leen Peeters, Chair
   •      Ludwig Karg, Chair

                                                          bridge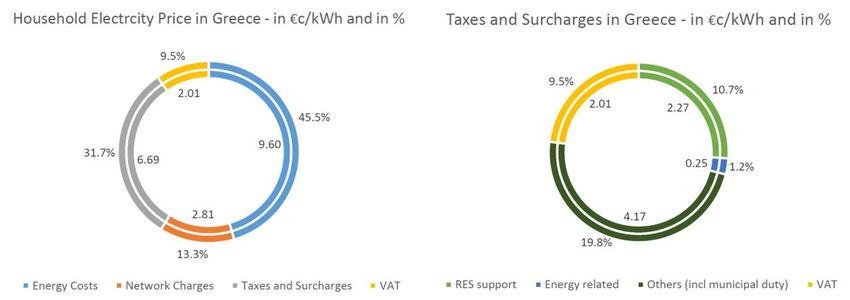
INDEX
1. Introduction......................................................................................................................................................................... 2
                Electricity tariffs for energy communities ..................................................................................................................................... 3
                Energy communities’ business models ............................................................................................................................................ 3
2. Electricity tariffs for Energy Communities ............................................................................................................. 4
                Method and Process ................................................................................................................................................................................... 4
                Overview of household electricity tariffs in selected Member States ........................................................................... 4
                Options and plans for energy communities .................................................................................................................................. 5
        2.3.1             Options for setting electricity tariff-based incentives.................................................................................................. 5
        2.3.2             Plans of Member States for setting network tariff-based incentives ................................................................. 7
        2.3.3             Results on tariff setting .............................................................................................................................................................. 12
        2.3.4             Country details on electricity tariffs .................................................................................................................................... 14
3. Collective energy actions’ business models ........................................................................................................ 22
                Belgium ........................................................................................................................................................................................................... 22
                Croatia ............................................................................................................................................................................................................. 23
                Estonia ............................................................................................................................................................................................................. 24
                Greece .............................................................................................................................................................................................................. 25
                Germany ......................................................................................................................................................................................................... 27
                Italy ................................................................................................................................................................................................................... 28
                The Netherlands ......................................................................................................................................................................................... 29
                Poland .............................................................................................................................................................................................................. 29
                Portugal .......................................................................................................................................................................................................... 31
                Slovenia .......................................................................................................................................................................................................... 31
                Spain ................................................................................................................................................................................................................. 32
                Sweden ............................................................................................................................................................................................................ 33
4. Summary ........................................................................................................................................................................... 35
Abbreviations and Acronyms........................................................................................................................................... 36
List of Figures ....................................................................................................................................................................... 37
References ............................................................................................................................................................................. 38
Web links ................................................................................................................................................................................ 39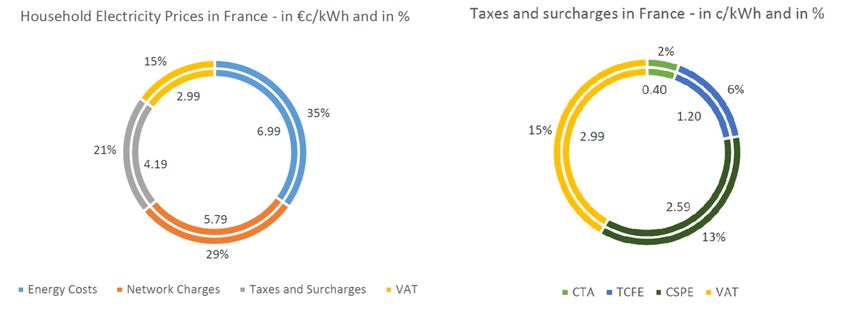
Economies of Energy Communities: Review of
                                                                              electricity tariffs and business models

1. Introduction
Democratisation of the energy sector and move towards easily accessible and affordable green energy in the EU
has never been more important. While citizens’ participation in the local energy market is not a novel concept in
some Member States, with adoption of the Green Deal and Clean Energy Package the EU put focus on citizens’
active and coordinated participation.

Within the Clean Energy Package, the recast of the EU Renewable Energy Directive (RED II) entered into force in
December 2018, followed by the Internal Electricity Market Directive (EMD) which entered into force in 2019.
Through definitions of energy communities, they introduced a legislative support for collective energy actions and
citizens’ active participation in energy markets. Even though the package recognises certain categories of energy
initiatives as “energy communities”, it has provided the Member States with the definitions of two notions i.e.
“Renewable Energy Communities” (RECs) and “Citizens Energy Communities” (CECs). The previous BRIDGE report
within Task Force for Local energy communities (Hannoset et al., 2019) reviewed the level of transposition of
these directives. Even though, the EU Member States have until June 2021 to transpose these concepts into their
national laws, in this report we briefly review the state of transposition.

The main focus of this report is the economic aspect of energy communities. The economic aspect is split into two
parts: (1) electricity tariffing, with focus on a potential link between the implementation of a local flexibility market
and energy communities and encouraging increase share of renewable energy generation through energy
communities; and (2) business models and services offered by energy communities and wider collective energy
actions across the EU. In total, 20 Member States (Belgium, Czech Republic, Croatia, Denmark, Estonia, Finland,
France, Greece, Germany, Ireland, Italy, Lithuania, Luxemburg, the Netherlands, Portugal, Poland, Slovenia, Spain
and Sweden) are reviewed to show the variation and similarities across EU.

The main part of the report investigates household electricity tariffs among different EU Member States in light
of the creation of suitable framework conditions for energy communities. The paper argues that electricity tariffs
are vital part of households’ everyday consumption and production decisions and they have a strategic impact on
creating incentives in a country. Even though the preconditions for corresponding tariff schemes differ between
Member States, electricity tariffs in all analysed MSs have the same three main price components, i.e. energy
costs, network charges, taxes and surcharges. The report analyses which part of the electricity costs can be used
to incentivise specific system-relevant behaviour and local energy systems as well as what are the Member States
plans in setting electricity tariff-based incentives.

The detailed analysis of the electricity tariffs is followed by an overview of existing and emerging business models
for energy communities and wider collective energy actions in their national legislative environment. The business
models of collective energy actions are presented by identifying their organisational forms, income streams and
subsidies, offered services, participants and their motivation. Based on the presented business models it becomes
obvious which models can be used for wider EU replication and which are dependent on locally available incentives.

                                                                                                                       2
                                                        bridge
Economies of Energy Communities: Review of
electricity tariffs and business models
Electricity tariffs for energy communities
Electricity tariffs are an important part of the everyday consumption and production decisions of households and
the industry. The energy costs as well as the network charges can create incentives in a country. For example, the
high electricity prices in Germany lead to an increase in photovoltaic integration, which goes hand in hand with
increasing self-consumption in Germany. These market incentives strongly depend on the electricity price structure
of the country. Because of the different price ranges and structures, the room for incentives strongly differs
between countries. This also relates to social aspects such as energy poverty. Understanding the price composition
and the possible incentives that can be set is very important for future policy decisions and can support economic
analysis of potential energy communities.
Some EU Member States have adopted or are considering the introduction of local network/electricity tariffs or
specific tariffs for self-consumption including Austria, Belgium, Portugal and France. Such tariffs can support the
establishment of energy communities and should aim at reflecting the actual impact of energy communities on
the electricity network system. The aim of Chapter 2 of this document is to give an overview of elements that are
part of household electricity prices in different Member States and present some preliminary options for local
tariff setting. This overview aims at facilitating the assessment of options for the modification of tariff structures.
The preconditions for corresponding tariff schemes strongly differ between Member States due to huge
differences in electricity tariffs. Nevertheless, each Member State has the same three main price components.
These are the energy costs, the network charges and the taxes and surcharges. While the energy costs are largely
up to the liberalised market, the other price components are mostly regulated or politically determined. In
particular, the network charges can be adapted to incentivise specific system-relevant behaviour and local energy
systems with a high degree of autonomy.
Where not stated differently, the electricity tariff information presented in Chapter 2 is based on expert
consultations, including interviews with CEER and its members.
Energy communities’ business models
Following the detailed analysis of the electricity tariffs among EU Member States, the Chapter 3 of this report
gives an overview of existing and emerging business models for energy communities or collective energy actions.
Based on desktop research and interviews with stakeholders from different Member States, services offered to
the members of the Energy Community (EC) or collective energy actions have been analysed. The overview is
provided for 12 Member States: Belgium, Croatia, Estonia, Greece, Germany, Italy, the Netherlands, Poland,
Portugal, Slovenia, Spain and Sweden.
3
bridgeEconomies of Energy Communities: Review of
electricity tariffs and business models
2. Electricity tariffs for Energy Communities
Member State’s electricity bills have the three main price components: the energy costs, the network charges and
the taxes and surcharges. The energy costs are dependent on the liberalised market, while the other price
components are regulated. Specifically, the network charges can be adapted to incentivise specific system-
relevant behaviour and local energy systems with a high degree of autonomy, such as ECs and collective energy
actions.
Method and Process
Within this BRIDGE taskforce a set of interviews was made with regulators facilitated by CEER. The main issues
discussed with the regulators were:
● How do they see the goal, the role, the uptake and potential benefits of ECs to the energy system? What
are potential targets followed by the government (e.g. local self-supply, flexibility…)?
● Assessment of tariff setting in different Member States.
● What are the principles behind potential incentives and tariffs for ECs?
● Is a flexibility market for DSOs previewed?
Overview of household electricity tariffs in selected
Member States
In Europe, there is a large difference in household electricity tariffs across the countries. While the lowest
household electricity price in 2020 is 10 €c/kWh in Bulgaria, the highest is 30.4 €c/kWh in Germany1. These
enormous differences arise because of diverse price structures across the EU. While some countries have high
network charges, some others have high taxes or policy costs. In the following section, the structure and
components of the household electricity tariffs in Austria, Belgium (Flanders), France, Spain, Greece, Portugal and
Italy will be investigated and explained.
In the following section, the three main components of all seven countries are compared. The energy costs, network
charges as well as the taxes and surcharges are presented in the following figure for seven European countries.
Please note that, as presented above, the composition of the major tariff components strongly differs between
countries. Therefore, absolute values only provide a rough indication on possible space for change in the future,
for example for the creation of local tariffs. In addition, the electricity prices presented in Figure 1 for each country
represent the costs for an average or reference electricity consumption in kWh. The average consumption in kWh
for each country is given in Figure 1.
For the presented seven countries, the lowest energy costs are charged in France with 6.99 €c/kWh followed by
7.02 €c/kWh in Portugal. In comparison, the highest energy costs are in Italy with 9.94 €c/kWh.
1 https://ec.europa.eu/eurostat/web/products-eurostat-news/-/DDN-20201124-1
4
bridgeEconomies of Energy Communities: Review of
electricity tariffs and business models
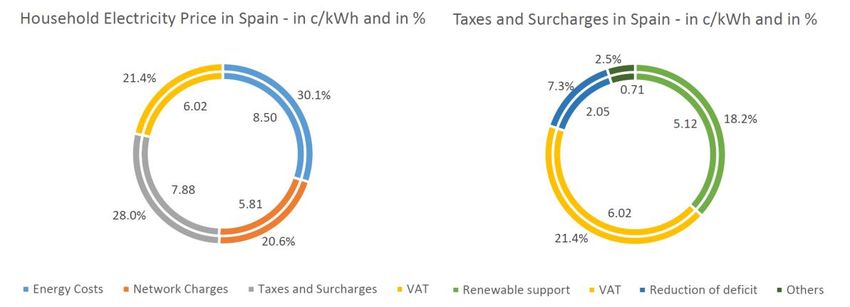
The range of network charges spans from 2.81 €c/kWh in Greece to 7.0 €c/kWh in Belgium. The second lowest
network charges are in Italy (4.01 €c/kWh) while the second highest are in Spain with 5.81 €c/kWh. One example
to show the extreme differences across the member states is Greece. Although Greece has the highest energy
costs, it has the lowest network charges. However, these low network charges do not allow much room for new
incentives2. Finally, the taxes and surcharges are investigated. The highest taxes and surcharges are in Belgium
(Flanders) with 8.36 c/kWh. Spain has the second highest taxes and surcharges at 7.88 €c/kWh which is only
slightly lower than in Spain. In comparison to that, the lowest taxes and surcharges can be found in Austria with
4.17 €c/kWh. 3
Figure 1 Cost components for the chosen member states (for average or reference household consumption4)
3500 kWh 3500kWh 4770 kWh 2200 kWh 3500 kWh 2800 kWh 2700kWh
To summarise, it can be said that energy costs and taxes and surcharges vary across the Member States.
Especially, the structure of taxes and surcharges differ in all investigated countries due to different policy costs
in the member states or other cost items that are charged within the electricity bill. In contrast, energy costs
mainly depend on the energy mix of a country.
Options and plans for energy communities
2.3.1 Options for setting electricity tariff-based incentives
Due to the potential system benefits of ECs (i.e. reduced use of the public electricity network due to internal
generation and balancing), corresponding support mechanisms are being investigated or are already in place.
These include for example local electricity tariffs that aim to incentivise the use of the existing infrastructure
rather than investing in parallel infrastructure (e.g. in Austria, see BMVIT 2018). The actual system impact of ECs
2 The references and a detailed discribtion for each country can be found in Chapter ¡Error! No se encuentra el origen de la referencia.
3 Ibid
4 Sources:
Austria: https://www.e-control.at/konsumenten/strom/strompreis/was-kostet-eine-kwh
Belgium: VREG 2020: Tariefmethodologie 21-24
France: Selectra, 2020
Greece: Incumbent standard offer: GR-2018
Portugal: Portuguese General Directorate for Energy and Geology, www.dgeg.gov.pt. Data for 2019
Italy: https://www.arera.it/it/dati/ees5.htm
5
bridgeEconomies of Energy Communities: Review of
electricity tariffs and business models
is heavily debated and importantly depends on the specific circumstances. In particular, whether the expansion of
local renewable energy systems reduces or increases overall system costs cannot be answered generally. For
instance, in the Netherlands, a new area with residential and commercial building is constructed, including the
installation of local PV plants and storage systems. Due to the local generation, storage and energy supply, the
electricity needs for larger consumers (e.g., supermarkets) can be satisfied while avoiding a local electricity
network reinforcement. Such reinforcement would have been done by the DSO only in a couple of years and would
be very costly. In Germany, since 2005, the potential system cost benefits of decentralised generation are
considered by a reimbursement scheme for electricity producers injecting into lower electricity network levels.
However, it turned out that decentralised generation is often not consumed locally and therefore requires the
transmission system.
Due to the particularities of the actual cases, some support (or compensation) mechanisms may thus take into
account the specific local situation. Accordingly, the Electricity Market Directive calls for “a transparent cost-benefit
analysis of distributed energy resources developed by the competent national authority” and an adequate
contribution of Citizen Energy Communities to the overall cost sharing of the system. The Renewable Energy
Directive refers to “cost-reflective network charges” and states that “Member States shall take into account
specificities of renewable energy communities when designing support schemes in order to allow them to compete
for support on an equal footing with other market participants”.
In this context, several options for the consideration of a decreased use of the public network are possible. A
general difference can be made between 1) fixed (local) tariffs that take into account standard assumptions on
system impacts and 2) approaches that remunerate the actual impact of a local energy system. Possible
approaches include:
Local network tariffs: In these cases, a generic reduction of the network tariff is applied. One approach, as
discussed in Austria, is that entities that use only the low voltage network would only pay for the corresponding
share of the network tariff. In case costs for higher voltage network levels remain the same however the remaining
consumers would have to pay these.
Rolling cost models: The network tariff may be adapted periodically depending on the actual network usage
over a certain period (e.g. based on the peak load). Thereby, a flexible incentive is set to reduce the network impact
over time and to improve and maintain local balancing. Such an approach is thought of in Austria (BMVIT 2018).
Ex-post remuneration of (part of) the network tariff: This may be done in cases where it can be proven that
network expansion has been avoided, such as in the above-mentioned case in the Netherlands or other benefits
have been achieved to the system by introduction of the EC.
Dynamic tariffs: In case of dynamic tariffs, the flexibility services that the prosumers of an EC provide could be
taken into account, but also the short distance that the electricity travels when being supplied to a community
member within a regional cluster. Ideally, these shorter distances would lead to lower network tariffs, which can
incentivise flexible consumer behaviour and provide a business case for ECs.
Policy measures related to network charges for ECs in EMD and RED II:
EMD (CECs):
● cost-reflective network charges in accordance with Article 18 of Regulation (EU) 2019/943, ensuring that
they contribute in an adequate and balanced way to the overall cost sharing of the system.
● where electricity is shared, this shall be without prejudice to applicable network charges, tariffs and levies,
in accordance with a transparent cost-benefit analysis of distributed energy resources developed by the
competent national authority.
6
bridgeEconomies of Energy Communities: Review of
electricity tariffs and business models
● If CECs are granted the right to manage distribution networks in their area of operation, they should be
“subject to appropriate network charges at the connection points between their network and the
distribution network outside the citizen energy community”.
RED II (RECs):
● Renewable energy communities should be able to share between themselves energy that is produced by
their community-owned installations. However, community members should not be exempt from relevant
costs, charges, levies and taxes that would be borne by final consumers who are not community members,
producers in a similar situation, or where public network infrastructure is used for those transfers.
● cost-reflective network charges, as well as relevant charges, levies and taxes, ensuring that they
contribute, in an adequate, fair and balanced way, to the overall cost sharing of the system in line with a
transparent cost-benefit analysis of distributed energy sources developed by the national competent
authorities.
● Member States shall take into account specificities of renewable energy communities when designing
support schemes in order to allow them to compete for support on an equal footing with other market
participants.
2.3.2 Plans of Member States for setting network tariff-based
incentives
Some EU countries are developing or have in place local electricity tariffs specifically for CEC and/or RECs or
collective self-consumption (Austria, Portugal, Italy), while others have plans to develop new tariffs in the future
(Spain, Belgium (Wallonia)). It needs to be noted that the reduced tariffs generally do not apply to the entire
consumption of an energy community but only to the electricity exchanges/self-consumed within the community.
These reduced tariffs thereby reflect for instance the fact that subordinate grid levels are used to a lower extent.
In Portugal, the tariffs explicitly refer to self-consumption, not to energy communities. They, however, also apply
to self-consumption within an energy community that has a self-consumption arrangement in place.
7
bridgeEconomies of Energy Communities: Review of
electricity tariffs and business models
MS Network tariff for EC / Other tariff elements Additional incentives
collective self-consumption or self-consumption
Austria Grid fees above the grid level of Removal of consumption-based
REC do not need to be paid surcharges (electricity tax, RES
support)
Italy Refund of variable TSO network 100-110 €/MWh for RES
charge electricity self-
consumed within EC
Portugal Grid fees above the grid level of Reduction of consumption-based
the CSC scheme do not need to surcharges (policy costs (CIEG):
be paid for collective self- 100% for CSC, 50% individual
consumption self-consumption)
Figure 2 Overview of (planned) local tariffs in Europe
As Figure 2 shows several countries have plans to reduce network tariffs, as well as taxes and surcharges. While
the EMD requires to set cost-reflective tariffs, the RED II foresees support for RECs. Reduction in network charges
represents reduced electricity tariff, and can thus be expected to be in line with RED II as support for ECs. Therefore,
in practice, the boundary between policy goals and energy market regulation cannot be drawn clearly.
Italy
In 2020, Italy has adopted a law on self-consumption and renewable energy communities (law N8/2020),
providing a general regulatory framework. Within a subsequent consultation document by the Italian Authority for
Energy, Networks and Environment (ARERA), two models are introduced:
• Collective self–consumers (CSC) of renewable energy with a focus on condominiums: natural persons or
commercial actors, for whom generation and energy exchange is not the core business and that are
located in the same building or condominium.
• Renewable energy communities (REC) involving natural persons, small and medium enterprises,
local/regional authorities (e.g. municipal administrations), and private companies. Generation plants
(individually not exceeding 200 kW) need to be located in the low or medium voltage network behind the
same transformer station (MV/LV substation).
In 2020, Italy set up an incentive scheme targeting self-consumption of RES geographically limited to the same
MV/LV substation or at condominium level (CSC of RES). In both cases, within a “virtual” model, RECs and CSC
schemes can join and exchange electricity through the public low voltage electricity network. For CSC and RECs,
the self-consumption is calculated on hourly basis as the minimum of aggregate production and aggregate
consumption. 99.5%5 of final users in Italy already have smart meters.
5 https://www.arera.it/it/operatori/smartmetering.htm#elettricit%C3%A0
8
bridgeEconomies of Energy Communities: Review of
electricity tariffs and business models
For the electricity shared through the public network, members receive a refund for the electricity exchanged
within the community. This refund represents the consumption-based part of the transmission/distribution losses
related costs and amounts to 0,822€c/kWh of self-consumed energy (sum of the transmission tariff for low
voltage users, equal to 0,761 €c/kWh for the year 2020, and the higher value of the variable distribution
component for other low voltage users, equal to 0,061 €c/kWh for the year 2020).
For collective self-consumers, the tariff is further reduced by the network losses charge (1,2% for medium voltage
and 2,6% for low voltage; variable depending on the voltage level and the hourly zonal price of electricity. Taking
as a reference, purely by way of example, the average single national price of 2019 would have a value equal to
approximately 0,13 €c/kWh for the low voltage and approximately 0,06 €c/kWh for medium voltage). This
reduction is however not applicable to RECs (ARERA 2020). In addition to the network tariff refund, self-consumers
receive a subsidy on the self-consumed electricity. This incentive will be 110 € for energy communities and 100€
for condominiums for each MWh self-consumed. This incentive will last 20 years and it is thought to payback the
renewable plant investment.
Italy currently has no short term plans to introduce local flexibility markets. There is a very advanced framework
(Arera decision 300/2017 and subsequent decisions) for aggregators to participate on the ancillary market –
currently at the system level –in the future maybe on the DSO level as well. At the moment there is no need for
local flexibility markets yet as network reinforcements have been regularly made. This has been especially the
case for period of 2011-2016 to deal with a steep increase in renewables (from 4GW to 30GW).
Portugal:
Portugal in 2019 introduced a framework for self-consumption of renewable energy on individual and collective
level and by renewable energy communities (Comunidades de Energia Renovável) (Decree Law 162/2019).
Thereby, the REDII was partially transposed. Previously, self-consumption was limited to the individual level
(Decree-Law No. 153/2014). The 2019 decree does not yet include citizen energy communities. Since January 1st
2020, individual and collective self-consumption projects and projects for collective self-consumption in RECs are
possible as far as they have an intelligent counting system and are installed at the same voltage level. The 2019
decree law adopts the major lines of the EU REDII in terms of membership, possible activities etc. and the need
to form a legal person.
Network tariffs for self-consumption using the public network are already in place, currently regulated by the
Regulamento do Autoconsumo establishing the methodology (RAC, Regulamento n.º 266/2020) and the Directive
n.º 1/2021 establishing the specific tariff levels. For collective self-consumption schemes connected by the public
grid the tariff for the self-consumed energy is calculated taking into account only the tension level used (for self-
consumed energy e.g. within a REC on low voltage level only low voltage network tariffs apply). If a self-
consumption installation is located at a voltage level where reverse flows occur (i.e. from lower to higher voltage
levels), the deduction of network use tariffs of higher voltage levels might be only partial. However, in practice,
this is so far negligible. In June 2020, a new law was published that exempts collective self-consumption schemes
to different extents from paying an element of the network charges called CIEG (Custos de Interesse Económico
Geral). For individual self-consumption projects, 50% of CIEG costs are discounted, for collective self-consumption
(including in but not limited to RECs) 100%. The CIEG are the costs of energy policy, environmental or general
economic interests associated with the production of electricity and the costs of sustainability of markets
(Despacho n.º 6453/2020).
Spain
The Royal Decree-Law 23/2020 of June 2020 first introduced energy communities and aggregators, only defining
their general purpose and nature (Government of Spain 2020). However, Spain has an advanced framework on
9
bridgeEconomies of Energy Communities: Review of
electricity tariffs and business models
self-consumption in place, allowing to share generation among customers connected at low voltage within a
distance of 500m. Besides the actual development of the legal framework for energy communities, also the
Spanish tariffs regarding the use of the public network and the compensation scheme are currently under revision.
A new methodology for network charges will be applied in June 2021 to all consumers, including those with self-
generation (CNMC 2020). This new methodology will allow more time dependent network charges and provide
incentives to household consumers to reduce the contracted power in peak periods.
Austria
In September 2020, a legislative package on the expansion of renewable energy was published for public
consultation (Government of Austria 2020). The package establishes the Renewables Expansion Law
(Erneuerbaren-Ausbau-Gesetz, EAG). The legislative package establishes a framework for RECs, while also
provisions on CECs are introduced.
Reduced network tariffs are foreseen for electricity sharing in RECs at medium and low voltage level. The tariff
reduction will be defined on national level for low and medium voltage communities applying to all network areas.
For the low voltage level, a reduction of more than 50% is discussed, for medium voltage communities a reduction
of 30%.
For setting the level of reduction in principle, fees for using network voltage levels that are superordinate to the
network voltage level in which the REC is located will be deducted for electricity exchanged within the REC. In
addition, the volumetric tariff elements for surcharges are supposed to be deducted from the network tariff. The
losses DSOs make because of reduced network fees to participants of energy communities, would have to be
compensated by consumers not participating in Energy Communities. The development of local flexibility markets
has not yet started in Austria6.
France
Self-consumption in France is regulated in law 2017-2277 and decree 2017-676 (French government 2017)
which contain provisions for individual and collective self-consumption. Collective self-consumption involves the
public network. Collective self-consumers can choose between the standard distribution network tariff (TURPE –
national Distribution Network Utilization Tariff) and CSC TURPE (Enedis 2019). Aim of the network tariff for
collective self-consumption is cost-reflectivity, not incentivisation of self-consumption. There are different tariffs
in summer/winter and peak/non-peak.
A new tariff for residential consumers is expected to be more accurate and allow consumers to benefit more from
a lower tariff for the self-consumption part. So far, the higher levels of self-consumption, the more beneficial the
collective self-consumption tariff is for consumers. The French DSO in 2020 launched tenders for local flexibility
markets (experimental projects), Energy Communities could participate in these markets.
In 2021 a public consultation on a draft ordinance that would define RECs and CECs was launched7. Also the draft
ordinance provides for expanding the scope of collective self-consumption. The injection and draw-off points of
the projects will no longer be limited to the low voltage network but may be located on the entire distribution
network, the low and medium voltage levels.
Figure 3 below shows the cost reduction effects of applying local tariffs for Austria, Italy and Portugal, for Austria
these are not yet decided so the above mentioned assumptions for a LV energy community were applied. As shown
in the figure, the possible reductions differ across the countries due to the different elements that are deducted.
6 Based on Frieden et. al 2020: Collective self-consumption and energy communities: Trends and challenges in the transposition of the EU
framework
7
http://www.consultations-publiques.developpement-durable.gouv.fr/projet-d-ordonnance-portant-transposition-de-a2288.html
10
bridgeEconomies of Energy Communities: Review of
electricity tariffs and business models
While in Italy only the TSO part is deducted in Austria and Portugal also taxes and surcharges are reduced. It is
important to consider, that these local tariffs are not an overall price reduction for energy communities or actors
in a self-consumption scheme, but they are only applied to the electricity that is shared and consumed within the
community.
Figure 3 Effects of local tariffs for Austria, Italy and Portugal8
One important aspect in the local tariff setting debate concerns potential additional costs for non-participating
households. DSOs may want to recover income losses. Figure 4 shows with the example of Vienna the bandwidth
of these potential negative effects for the remaining customers. The assumption for the chosen scenarios is, that
there are fixed costs for the energy system that are needed for the network provider to maintain the system.
Therefore, we calculated the revenue losses for the DSO, depending on the participation rate of consumers in
energy communities, the energy produced and consumed by the community and the height of the network fee
reduction. These revenues losses are distributed across the remaining customers. The scenarios show that the
additional yearly costs for the remaining customers at a yearly average consumption in Austria of 3500 kWh are
rather small at a low deployment rate of energy communities. The bandwidth of the additional costs ranges from
0.47 EUR/a (30% network tariff reduction, 5% participation rate in the population and 20% of the energy
consumed is produced by the community) to 89.10 EUR/a (70% network tariff reduction, 50% participation rate
in the population and 90% of the energy consumed is produced by the community). The scenarios have been
derived during the discussions with Austrian stakeholders to assess the impact of different tariff reductions and
energy community uptake. However, the scenarios with more than 25% participation rate are considered as long
8
The shown reductions on figure 2 and on tariff sheets.
Austria: Example for Vienna. Reduction of network charges and taxes and surcharges according to figure 2
Portugal: Differences between Tarifa simples for normal consumer in 2020 (source: Entidade Reguladora dos servicos enrgeticos, Diretiva
n. 3/2020 p. 147) and tarifa simples for CSC (100% CIEG reduction) (source: Diretiva n. 14/2020, p.9) applied on the average household
electricity price of 21.33 c/kWh (source: Eurostat)
Italy: Reduction of the variable TSO network charge (0.822 c/kWh)
11
bridgeEconomies of Energy Communities: Review of
electricity tariffs and business models
run scenarios since such a high degree of participation will not be reached in the next few years (Frieden et. al
2020b).
Figure 4 Scenarios for potential negative spill-over effects on the example of Vienna
2.3.3 Results on tariff setting
The interviews with regulators illustrated that most countries do not foresee electricity network issues in the short
term and therefore, for some, the benefits of energy communities are not clear. Energy communities however are
seen as one of the options among others to increase investments in renewable energy and as a way to activate
consumers and increase consumers’ awareness. However, in the long term through activating consumers,
increasing consumers’ awareness and increasing the flexibility of the electricity system, ECs have a potential to
reduce the need for network reinforcements.
Up to now, when setting incentives there is currently a high focus on promoting self-consumption. This is currently
seen as the best measure to assure that there are no network issues in the long run due to expected high increase
in renewables share by 2030.
Regarding the possible uptake of energy communities no clear direction could be found. Several countries regard
the current transposition of the REDII/EMD as a pilot phase with the possible need for future adjustments.
12
bridgeEconomies of Energy Communities: Review of
electricity tariffs and business models
Tariff setting in different Member States
Most regulators emphasised the aim to set cost-reflective tariffs. Some countries however also plan to reduce
taxes and surcharges to incentivise the deployment of ECs. As reduced network fees may have a supportive
element with respect to incentivising the deployment of ECs, the boundary between policy goals and energy market
regulation cannot be drawn clearly. To extent to which the financial losses for the DSOs will be covered by non-
participating consumers is dealt with differently in the Member States. While Austria plans to recover the financial
losses of DSO caused by reduced network fees, Italy has no such plans.
In addition, too generic tariffs/incentives could prevent the needed tailoring (technologies, regions, type of
community).
CBA considering all costs
Overall, there seems to be a lack of cost benefits assessments considering all costs (metering, digital
infrastructure, local assets and operational management) versus all benefits as well as missing baselines with the
risk of remunerating “business as usual”.
Flexibility markets for DSOs
The approach to flexibility services seems unclear. A few regulators did not see the need for such services at least
in the short term. The transposition of ECs is too often regarded and developed independent from Article 32 of
EMD on flexibility in distribution networks. The strong focus on self-consumption creates the risk of
overinvestments in technology, conflicting with the EU ambition on a circular economy.
13
bridgeEconomies of Energy Communities: Review of
electricity tariffs and business models
2.3.4 Country details on electricity tariffs
2.3.4.1 Austria
Share of energy costs, network charges, taxes and surcharges9
Austria has 13 network zones with different total household electricity tariffs ranging roughly from 17 to
24 €c/kWh10 in 2020. For average households with a consumption of 3500 kWh/a, energy costs have a share of
around 37.5% of the overall electricity price. The second component, the network charges (25%), depend on the
location of the household. Every year the regulator E-Control recalculates the network costs. The presented
numbers are based on the electricity prices in 2020. The lowest network charges are in the federal state of
Vorarlberg with 3.76 €c/kWh while the highest are in a small area called Kleinwalsertal with 9.74 €c/kWh. The
area Kleinwalsertal is a special case with a poor network connection. The second highest network costs can be
found in the federal state of Carinthia with 7.56 €c/kWh. Thus, the potential for creating network charges related
incentives even depends on the sub-national level.11 The third cost component, (direct) taxes and surcharges
(37.6%), contains of five different levies. Finally, Value Added Tax (VAT) is added, i.e. a form of indirect tax on
goods and services12.
Figure 5 Electricity price components in Austria in % of the electricity bill.
Network charges
The network charges are composed of three elements. The first component is the network utilisation charge. Via
the network utilisation charge, the network operators are reimbursed for the costs of the construction, expansion,
maintenance and operation of the network. The network utilisation charge is fixed by the regulator E-Control and
consists of a capacity rate and a consumption-based unit rate per kWh. The second part of the network charges
is a charge for network losses, again consumption-based. The distribution of electricity across an area causes
losses, which leads to costs for the network operator. Therefore, the consumer bears a part of these costs to
compensate the network operator. The last part is the metering charge. Via the metering charge, the network
operators recover the costs of the installation and operation of metering equipment and the costs related to their
calibration and meter reading.13
9 Based on Frieden et. al 2020: Collective self-consumption and energy communities: Trends and challenges in the transposition of the EU
framework,
10 https://www.e-control.at/de/konsumenten/strom/strompreis/was-kostet-eine-kwh
11https://www.e-control.at/documents/1785851/1811582/SNE-V-2020-Vergleich-der-Netzebenen.pdf/959e4eda-1945-1a1d-f4ca-
3c655453165b?t=1576846685632
12 This applies for the assessment of the other countries as well, i.e. VAT is considered separately from taxes and surcharges
13
https://www.e-control.at/konsumenten/strom/strompreis/preiszusammensetzung/netztarif
14
bridgeEconomies of Energy Communities: Review of
electricity tariffs and business models
Taxes and surcharges
The last and biggest component of the electricity costs are taxes and surcharges (37.6%). This part consists of
five different levies. The first and simplest one is the VAT, which is 16.7% of the electricity price and nearly half
of the taxes and surcharges. The second one is the KWK-Flat Rate, which is necessary to finance the renovation
and construction of highly efficient cogeneration plants (“Kraft-Wärme-Koppelungsanlagen”, KWK). For
households, the flat rate is 1.25 EUR per year. In addition, there is a renewable support charge, which has two
components. First, the green electricity charge “Ökostrompauschale” (28.38 EUR per year and per household) which
is a flat rate. Second, the green electricity contribution “Ökostromförderbeitrag”, which is an additional percentage
charge on the network utilisation charge and the charge for network losses. The last two components of the taxes
and surcharges are the community charge and the electricity charge. The electricity charge is a fixed amount of
1.5 €c/kWh while the community charge depends on the area the customer lives in. Each municipality sets its own
community charges.
2.3.4.2 Belgium – Flanders
Share of energy costs, network charges, taxes and surcharges
Electricity tariffs in Flanders are rather complex. In particular, the taxes and surcharges contain a high number of
contributions and socialised costs. For a yearly consumption of 3500 kWh the average electricity tariff is 28.00
€c/kWh. The smallest cost component in Flanders is the network charges with 7.00 €c/kWh (25%), followed by the
energy costs with a share of 7.84 €c/kWh (28%). For the energy costs, customers can choose a tariff where
different prices for day and night electricity are charged. The biggest part of the electricity costs in Flanders are
the taxes and surcharges incl. VAT with 13.16 c/kWh (47.00%)14.
Figure 6 Electricity price components in Flanders in % of the electricity bill.
Network Charges
The network charges consist of the network costs and the costs for maintenance and operation of infrastructure,
summing up to 7.00 €c/kWh on average.
Taxes and Surcharges
The electricity price in Flanders contains 23 different levies as part of the taxes and surcharges. In the second
figure for Flanders, the six highest levies are presented while the remaining seventeen components are pooled in
14
VREG 2020: Tariefmethodologie 21-24.
15
bridgeEconomies of Energy Communities: Review of
electricity tariffs and business models
the variable “others”. The biggest component is the public service obligations of DSO plus charges with 18% (5.04
c/kWh), followed by the VAT with nearly 17% of the total tariff (4.76 €c/kWh). The third highest cost component
is the obligations on energy costs with 9.00% (2.52 €c/kWh). Further examples are components like costs related
to energy poverty, maintenance for public lightning or subsidies for rational energy use. The part of public lighting
only contains the personnel costs for maintenance and reparation. It excludes material costs, the installation of
new lamp posts, and the energy consumption of public lighting.
2.3.4.3 France
Share of energy costs, network charges, taxes and surcharges
The electricity price components in France have similar shares as in Austria. Thus, each of the three main
components (energy costs, network tariffs and taxes/surcharges) represent around one third of the final price
(4770 kWh per year).15 The energy costs, which have the second biggest share of 35%, covers, for example, the
costs of production (investment costs and operating expenses), marketing costs and procurement costs (electricity
price on the wholesale market). The components network tariff and taxes/surcharges have a share of 29% and
36% respectively.
Figure 7 Electricity price components in France in % of the electricity bill.
Network Charges
One important part of the electricity price is the TURPE (Public Utilities Tariff). The TURPE covers the costs of
operation and maintenance and the development of the network. The Regulatory Commission for Electricity (CRE)
sets this tariff. Similar to the E-Control in Austria, the CRE is an independent administrative authority in charge of
the proper functioning of the electricity and natural gas market in France. The CRE was created to support the
opening of the energy markets in 2000.
Taxes and Surcharges
Finally, the taxes and surcharges have a share of 36% in the total electricity tariff. The smallest tax within the
electricity bill is the CTA (Contribution Tarifaire d’Acheminement) (2%), with which the retired employees of the
electricity and natural gas sector are financed. With 6% of the final electricity price, the local tax on final electricity
consumption (TCFE) is the second smallest component. These costs depend on the location of a households and
benefits the local authorities. The last two components are the Contribution for the Public Electricity Service (CSPE)
15
https://en.selectra.info/energy-france/guides/electricity/tariffs#:~:text=With%20the%20average%20household%20in,€%20-
%2075€%20per%20month.
16
bridgeEconomies of Energy Communities: Review of
electricity tariffs and business models
(13%), which covers the charges relating to the public service tasks of electricity, and the VAT (overall 15%), which
is 5.5% on the subscription and 20% on the consumption part. 16
2.3.4.4 Greece
Share of energy costs, network charges, taxes and surcharges
In comparison to the other countries in the EU, the household electricity price in Greece includes a different set of
cost components. Although the overall cost structure in Greece for a yearly consumption of 3500 kWh is the same
(three main components: Energy costs, network charges and taxes/surcharges), there are some significant
differences within the components. For instance, the network charges only have a small share of 13.3%. The
biggest part is the energy costs with 45.5% while the taxes and surcharge have a share of 41.2% inclusive VAT.
The figures below show an example for an average household with an annual consumption of around 3500kWh.
Figure 8 Electricity price components in Greece in % of the electricity bill.
Network Charges
The network costs are composed of the transmission charges and the distribution charges. Both, transmission and
distribution charges contain fixed and variable costs. For both, the fixed costs depend on the contracted power
while the variable costs depend on the electricity consumed. Overall, the transmission part has a small share on
the electricity price (2.6%) while the distribution takes over 10.7% of the electricity price.
Taxes and Surcharges17
The taxes and surcharges in Greece have a share of 31.7% (excluding VAT) of the total electricity network tariffs.
Overall, the electricity price in Greece contains six different levies. With a percentage of 19.8% the category others
is the biggest component. This category includes taxes for the good operation of market, municipal taxes and
duties, and a fee for ERT (Greek Radio and Television). Especially, municipal taxes and duties constitutes a big
percentage, since they are calculated proportional to the floor area of each house. This is connected also with the
fact that the owner-occupied housing ratio is still high in Greece, in contrast with other MS. Moreover, RES support
tax is achieved through a special duty of greenhouse gas emissions reduction in order to compensate producers
of RES units and promote RES units in society. In contrast with RES support, energy related taxes that include taxes
16https://www.connaissancedesenergies.org/fiche-pedagogique/tarification-de-l-electricite
17 Source: DEH. https://www.dei.gr/en/oikiakoi-pelates/xrisimes-plirofories-gia-to-logariasmo-sas/logariasmos-kai-
xrewseis/giati-stous-logariasmous-sas-uparxoun-duo-katigori/ruthmizomenes-xrewseis
17
bridgeEconomies of Energy Communities: Review of
electricity tariffs and business models
for the non-interconnected islands, energy poverty households etc., are the smallest tax (1.2%). At last, VAT
represents the 9.5% of the total taxes and surcharges.
2.3.4.5 Italy
Share of energy costs, network charges, taxes and surcharges
Figure 9 Electricity price components in Italy in % of the electricity bill
The electricity price for an average household with a yearly consumption of 2700 kWh and capacity of 3 kW in
Italy is 20.83 c€/kWh (March 2021) and has the following cost components: 47.7% (9.94 c€/kWh) of the electricity
price is for the energy provision, which is divided in two parts. While 81% of the energy costs are charged for the
production and delivery, 19% are used for marketing and other managerial costs. The network costs are 19.3%,
which is equivalent to 4.01 c/kWh. In addition, there are taxes and surcharges of 4.18 c€/kWh (20.1% of the
electricity price) and the VAT 2.7 c/kWh (13%).18
Network Charges
The network charges in Italy take 19.3% of the whole electricity price, which corresponds to 4.01 c€/kWh. It covers
the transmission, distribution, and metering costs, the components necessary to cover the imbalances of the
equalisation systems’ costs for the energy transport and cover a part of the costs incurred by the system to reward
the companies that manage the transport and distribution networks for actions that lead an improvement of the
service quality (or penalise them in case of inadequate quality of service in respect of ex-ante standards set by
the Regulatory Authority)19.
Taxes and Surcharges
Overall, taxes and surcharges are 33.1% (6.88 c€/kWh) of the electricity bill in Italy, where 13% (2.7 c€/kWh) are
the VAT and the remaining 20.1% (4.18 c€/kWh) are system charges. These system charges contain two blocks:
the so-called Arim and ASOS. The ASOS covers general charges relating to sustainability, i.e. the support of
renewable energy and can be divided in two parts. The first one (ASOS – A3) is for incentives for renewable sources
and are 12.1% of the total electricity bill (60.54% of the system charges) and the second one (called ASOS-Ae) is
for concessions to companies with high consumption of electricity and takes 3.5% of the electricity bill (17.54%
of the system charges). The Arim is 4.4% of the total electricity bill (21.92% of the system charges) and cover the
18 https://www.arera.it/it/dati/ees5.htm
19 https://www.hindawi.com/journals/ijp/2020/3605498/
18
bridgeYou can also read