Patricia Schneider-Marin & Werner Lang - Environmental costs of buildings: monetary valuation of ecological indicators for the building industry ...
←
→
Page content transcription
If your browser does not render page correctly, please read the page content below
Environmental costs of buildings: monetary
valuation of ecological indicators for the
building industry

Patricia Schneider-Marin & Werner
Lang

The International Journal of Life
Cycle Assessment

ISSN 0948-3349

Int J Life Cycle Assess
DOI 10.1007/s11367-020-01784-y

                                    1 23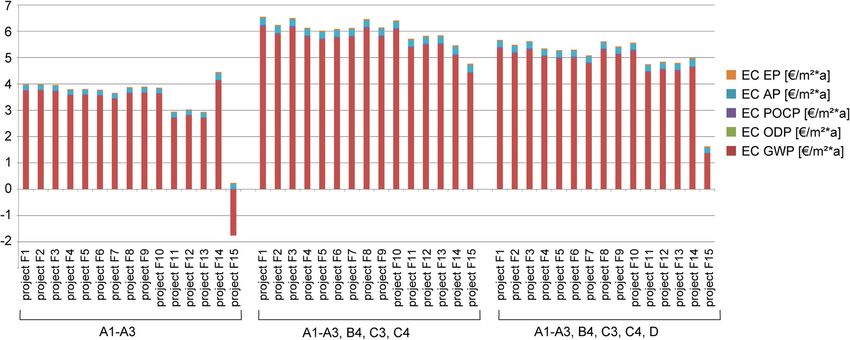
Your article is published under the Creative
Commons Attribution license which allows
users to read, copy, distribute and make
derivative works, as long as the author of
the original work is cited. You may self-
archive this article on your own website, an
institutional repository or funder’s repository
and make it publicly available immediately.

1 23
The International Journal of Life Cycle Assessment
https://doi.org/10.1007/s11367-020-01784-y

    BUILDING COMPONENTS AND BUILDINGS

Environmental costs of buildings: monetary valuation
of ecological indicators for the building industry
Patricia Schneider-Marin 1           &   Werner Lang 1

Received: 20 March 2020 / Accepted: 22 June 2020
# The Author(s) 2020

Abstract
Purpose Building life cycle assessment (LCA) draws on a number of indicators, including primary energy (PE) demand and
global warming potential (GWP). A method of constructing a composite index of weighted individual indicators facilitates their
use in comparisons and optimization of buildings, but a standard for weighting has not been established. This study investigates
the use of monetary valuation of building LCA results as a way to weigh, aggregate, and compare results.
Methods A set of six recent German office buildings served as a case study. For these, standard LCA and life cycle cost (LCC)
calculations were conducted. Monetary valuation models from the literature were investigated as a basis for evaluation. From these,
maximum and minimum valuation was chosen and applied to the LCA results for the embedded impacts of the case study buildings.
The buildings’ environmental costs (EC) were thereafter calculated and contributions of single impacts are analyzed. The EC—based
on external costs—are subsequently compared with the life cycle costs (LCC)—based on market prices—of the respective buildings.
Results and discussion Of the five standard environmental indicators used in Germany, GWP contributes approximately 80 to 95% of
the overall EC. Acidification potential (AP) is the second largest contributor with up to 18%. Eutrophication (EP), photochemical
oxidization (POCP), and ozone depletion potential (ODP) contribute less than 2.0%, 1.05%, and 2.4E−6% respectively. An additional
assessment of the contribution of resource depletion to EC shows an impact at least as large as the impact of GWP. The relation
between the EC and LCC strongly depends on the EC model used: if EC are internalized, they add between 1 and 37% to the life cycle
costs of the buildings. Varying construction materials for a case study building shows that materials with low GWP have the potential to
lower environmental costs significantly without a trade-off in favor of other indicators.
Conclusions Despite their sensitivity to the monetary valuation model used, EC provide an indication that GWP and resource
depletion—followed by AP—are the most relevant of the environmental indicators currently considered for the construction
industry. Monetary valuation of environmental impacts is a valuable tool for comparisons of different buildings and design
options and provides an effective and valuable way of communicating LCA results to stakeholders.

Keywords Building life cycle assessment . LCA . Monetary valuation of environmental impacts . Environmental life cycle cost .
Weighting in LCA . Comparative LCA . Building life cycle cost . LCC

                                                                          1 Introduction and problem statement

                                                                          The building industry is one of the major contributors to cli-
Responsible editor: Holger Wallbaum                                       mate change and the consumption of the earth’s resources. In
Electronic supplementary material The online version of this article      this context, life cycle assessment (LCA) is being established
(https://doi.org/10.1007/s11367-020-01784-y) contains supplementary       as a method of evaluating the environmental quality of build-
material, which is available to authorized users.
                                                                          ings (Weissenberger et al. 2014), as it assesses environmental
                                                                          impact for their entire life cycle. As the use of life cycle as-
* Patricia Schneider-Marin
  patricia.schneider@tum.de                                               sessment (LCA) is adapted to buildings, it is facing multiple
                                                                          challenges. Originally, LCA was designed for evaluating and
1
                                                                          optimizing industrial products (Klöpffer and Grahl 2009) that
     Institute of Energy Efficient and Sustainable Design and Building,
     TUM Department of Civil, Geo and Environmental Engineering,
                                                                          are usually made in batch production. Buildings, on the con-
     TUM Department of Architecture, Technical University of Munich       trary, are almost exclusively prototypes and consist of a mul-
     (TUM), Arcisstr. 21, 80333 Munich, Germany                           titude of products and services. Hence, each individual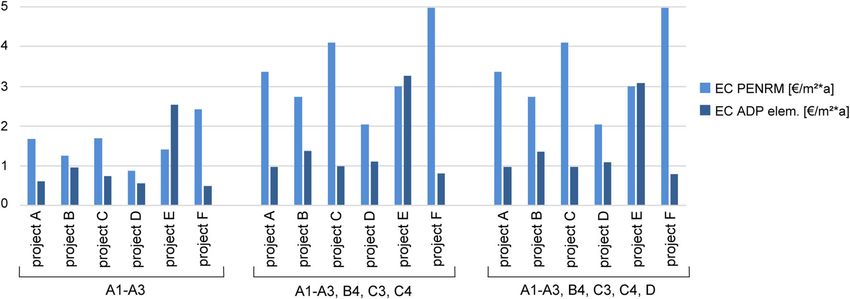
Int J Life Cycle Assess
building needs a custom LCA, requiring detailed knowledge The basic structure and rules for LCA are specified in DIN
about the building in question. To simplify building LCAs, EN ISO 14040 and DIN EN ISO 14044. DIN EN ISO 14044
they are, with very few exceptions, calculated on the basis of does not allow for a weighting of indicators in publicly avail-
aggregated product data in lieu of single processes, as LCA able comparative LCA studies (DIN Deutsches Institut für
calculations would otherwise demand too much time, be open Normung e.V. 2009). Nevertheless, several methods provide
to calculation errors, and lack comparability. end-point and/or single-score conversion of LCA results in
In Germany, building LCA calculations use the publicly order to make indicators commensurable and thereby LCA
available database Ökobaudat (Bundesministerium des Innern, results comparable and easier to understand for stakeholders
für Bau und Heimat (BMI) 2016). This database contains LCI (Pizzol et al. 2017). The weighting step is a value choice of the
(life cycle inventory) and LCIA (life cycle impact assessment) stakeholders and hence has to be carefully considered (Steen
data for over 1000 different building products and building- 2006; Bengtsson and Steen 2000). End-point systems, such as
related processes. Each product or process is evaluated in terms ReCiPe (Goedkoop et al. 2013) or UBP (Ahbe 2014), estab-
of 8 input categories (e.g., energy, material), 8 output categories lish a scoring system that assesses the potential damage (or
(e.g., exported energy, waste), and 7 environmental impact cate- benefit) to humans, ecosystems, and resources. Building cer-
gories (e.g., global warming potential (GWP), acidification po- tification systems, such as the DGNB1 system, assign percent-
tential (AP)). The choice of indicators contained in Ökobaudat age values to the indicators, e.g., 40% to GWP. These percent-
originates from LCA’s original application in product develop- age values are choices of the respective certification system
ment. Therefore, it might not reflect those environmental prob- and reflect the relative importance of an indicator assigned by
lems for which the building industry is most relevant for, but is the certification organization. Single-score systems aggregate
simply a consequence of data availability. either LCIA data and/or mid-point indicators, e.g., the
Consequently, the full results of building LCA studies con- Austrian OI3 (IBO—Österreichisches Institut für Bauen und
taining all individual 23 indicators are difficult to comprehend Ökologie GmbH 2016), or end-point indicators to a single
for stakeholders in the building industry. The multitude of value allowing comparison of options.
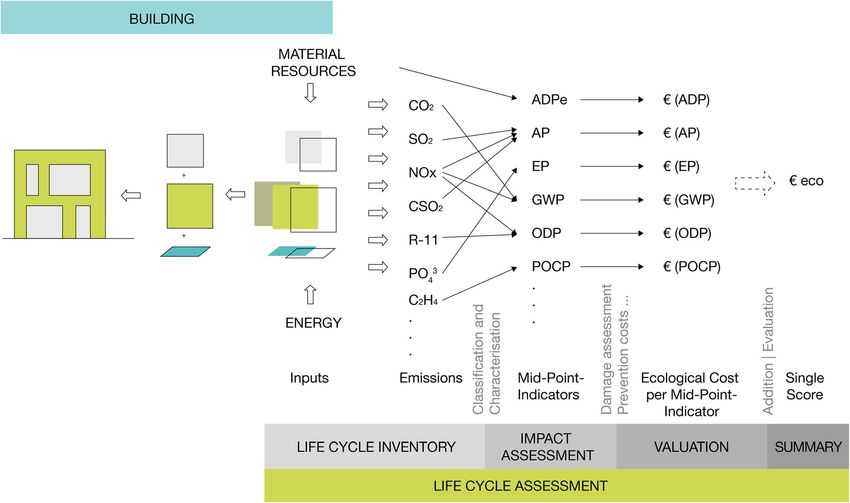
indicators does not lend itself readily to decision-making in Monetary valuation of LCA results (Fig. 1) is such a single-
the planning process as the indicators show a variety of issues: score indicator method that is increasingly used by stake-
various environmental problems, resource consumption, and holders, as it provides ecological costs (EC) as an easy-to-
waste generation. These are measured in terms of incommen- understand basis for decisions. Its main critique is that it is
surable units and, in addition, might show very different ten- regarded as questionable from a sustainability accounting
dencies depending on the building materials used. Therefore, point of view: assigning monetary values to environmental
results for different indicators often contradict each other. problems might suggest that by paying for the “cost” of the
Overall optimization is thus impossible when different indica- pollution, it is possible to compensate for the impact of the
tors do not share a common measure of evaluation and move pollution in question (Vogtländer and Bijma 2000). It is thus
independently of one another. criticized to be an instrument of “weak” sustainability, as it
A widely used work-around is restricting the assessment to suggests that monetary means can compensate for the loss of
one or a few indicators that are deemed most crucial, for in- ecological quality (Rennings and Wiggering 1997). Monetary
stance, global warming potential and/or primary energy use valuation methods should take this critique seriously and al-
(non-renewable/renewable). The obvious downside is ways reveal their background and purpose.
that other potentially important environmental impacts Monetary valuation’s advantage is that it can provide valu-
are ignored and trade-offs involving them cannot be able information to stakeholders and policy makers when
considered (Ströbele 2013). assessing the overall environmental quality of projects, prod-
The nature of the building design process requires ucts, or services (Swarr et al. 2011). In addition, monetary
multi-criteria decision-making support and optimization valuation facilitates comparing EC to current market prices
of many aspects such as structural safety, fire safety, of products and services. Moreover, assigning monetary
and costs. In such an inevitably complex context espe- values to environmental factors enables environmental criteria
cially, a simple, readily comprehensible, single indicator to be taken into account in business decisions (Reid et al.
of environmental impacts would enable decision-makers 2005) and it can be applied in cost-benefit analyses.
to take such impacts into consideration—where, in the None of the existing monetary valuation methods is specif-
absence of such an indicator, environmental impacts, for ically geared towards LCA in the building industry. Adensam
practical reasons, often are ignored, in part or entirely. et al. (2002) have previously studied monetary valuation of
In this regard, Kägi et al. (2016) argue that there is a environmental impacts of buildings applying (fixed) cost
“need for end-point or single-score assessment (and
transparent communication of the same) for sound and 1
Deutsche Gesellschaft für nachhaltiges Bauen; German Sustainable Building
effective decision-making support.” Council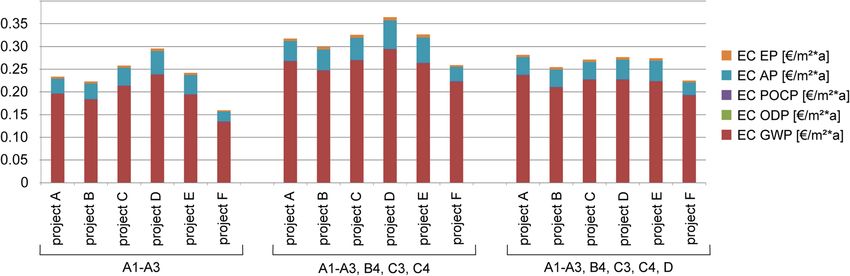
Int J Life Cycle Assess

Fig. 1 Building LCA and monetary valuation of mid-point indicators to arrive at a single score

parameters to two sample projects. The study concludes that                   Foundation 2019), monetary valuation is not common
the external costs of the building materials amount to approx-                practice in building LCA studies in Germany.
imately 3% of the two sample buildings’ construction cost and                    A monetary valuation approach in the construction indus-
that, based on the Austrian database used, CO2 pricing has the                try has a two-fold advantage:
greatest influence. Ulmer et al. (2010) take their valuations for
ODP, POCP, and EP from Adensam et al. (2002) and use                          –   Aggregation of a multitude of environmental indicators
Friedrich et al. (2007) valuations of AP and GWP in their                         into one, easy-to-understand measure
study of six (residential) sample projects. They conclude that                –   Comparability of alternative solutions in terms of eco-
internalizing external costs increases construction costs by an                   nomic and ecological aspects
average of approximately 35%, differing from Adensam et al.
(2002) by a factor of more than 10. This is in part due to the
fact that primary energy demand is valued in addition to en-
vironmental indicators, but, to a larger extent, including the                2 Research goals
external costs for the energy demand during building opera-
tion (phase B6) causes this significantly higher value. They                  This study applies different EC models to the embedded en-
agree with Adensam et al. (2002) that GWP valuation highly                    vironmental impacts of six German office buildings. As ag-
influences results. To our knowledge, no analysis exists of                   gregating all environmental impacts to one value allows for
how using a different valuation set affects the assessment                    direct comparison but at the same time loses the detailed in-
and influences the search for more sustainable solutions. In                  formation about single mid-points, we keep this information
addition, previous studies relate external costs mainly to con-               by showing the EC per mid-point-indicator. The results reveal
struction costs, but do not align the life cycle phases consid-               the weights monetary valuation assigns to the different indi-
ered for external costs to those considered for life cycle costs              cators and which environmental indicators are deemed the
of the respective buildings.                                                  most significant for building construction. This offers the pos-
    Since construction costs or, in the context of sustainability,            sibility of reevaluating the choice of currently used indicators
life cycle costs of buildings are an important criterion in the               in light of the particularities of the building industry, as it
design process, calculating the monetary value of environ-                    shows those impacts caused by construction that have a great-
mental impacts to find the most cost-efficient environmentally                er influence than others with respect to the chosen indicators.
friendly solution fits well into the logic of design decisions.                  Showing ranges of valuation makes it clear that EC assess-
However, unlike in the Netherlands, where a monetary                          ment of buildings is quite dependent on the valuation methods
valuation system for buildings and civil engineering                          applied and the resulting weighting of each impact category,
w o r k s ha s b e e n e s t ab l i s h e d ( B u i l d i n g Q u a l i t y   while also indicating areas of the greatest potential for further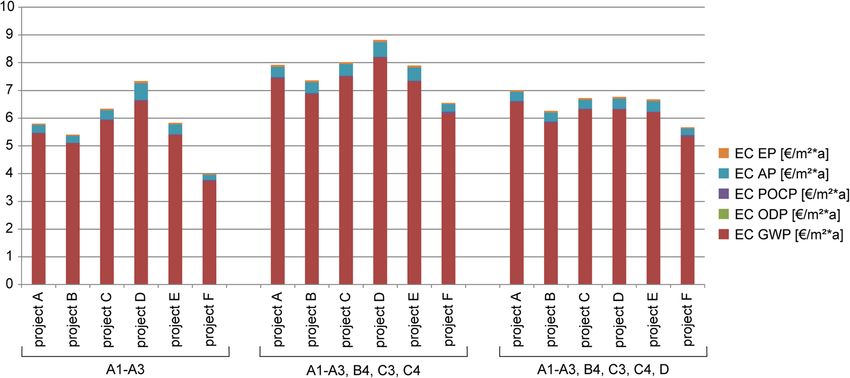
Int J Life Cycle Assess

research into the monetary valuation of environmental im-                  provide information and excludes materials with a share of
pacts of buildings. In addition, we investigate whether the                less than 1% of overall building mass.
valuation has an influence on the ranking of different building                Impact assessment includes the classification of emissions,
projects when comparing their environmental impacts.                       i.e., the grouping of emissions according to their impact on the
    Comparing environmental costs (i.e., external costs) to the            environment. The following step, characterization, entails
life cycle costs (i.e., market prices) of the respective building          assigning a factor to each substance in relation to the reference
shows how significant environmental pricing could be for                   substance for the corresponding environmental impact. There are
various building parts and/or life cycle phases. It raises the             a number of methods for this characterization step, which are
question if and under which circumstances the internalization              continuously further developed and refined. Ökobaudat, the da-
of external costs could lead to a more environmentally friend-             tabase used for this study, prescribes a characterization method
ly solution by expressing its value in monetary terms and                  for each impact category included in the database by referencing
potentially tipping the business scale towards a solution with             DIN 15804 (DIN Deutsches Institut für Normung e.V. 2014).
less environmental impact.                                                     This LCA study is concerned with environmental impacts
    There is significant potential to improve the environmental            and does not include social LCA, wider benefits, or other
quality of buildings if LCA is applied in the planning process.            considerations of sustainability. Hence, environmental impact
As LCA results are communicated to non-expert users in this                categories of DIN EN 15804 (DIN Deutsches Institut für
process, it is vital for environmental issues to be as easily and          Normung e.V. 2014) are evaluated with their corresponding
unequivocally understood as possible to avoid their being                  characterization factors. LCAs are calculated on the basis of
partly or entirely ignored. This does not, of course, prevent              the German database Ökobaudat, version 2016-I, using the
more complex background information and methodological                     tool eLCA.3 When data was not available in the Ökobaudat
choices (e.g., relative weights of indicators) from being pro-             2016-I, we draw on external data (e.g., data for carpets and
vided to expert users.                                                     glue were taken from Ökobaudat 2019-III). For purposes of
                                                                           the analysis, the structure of the cost groups of DIN 276
                                                                           (Deutsches Institut für Normung e.V. 2008) is applied to the
                                                                           LCA results. We excluded the use of other databases, as this
3 Methods                                                                  can skew results (Mahler and Schneider 2017).
                                                                               In order to make the buildings, which are of different sizes,
3.1 Life cycle assessment                                                  comparable, results are normalized to 1 m2 usable floor area
                                                                           (UFA). The reference study period used for comparisons, in-
Life cycle assessment in general consists of the four steps of             cluding the building use phase, is 50 years. We worked with
goal and scope definition, inventory, impact assessment, and               fixed scenarios and background data for both LCA and LCC
interpretation (DIN Deutsches Institut für Normung e.V.                    to investigate the influence of monetary valuation on the over-
2009). The goal of this study is the comparison of environ-                all ecological cost independently of LCA/LCC uncertainties.
mental impacts of a sample set of six different construction
projects (see Section 3.4). The scope of the LCA study is                  3.2 Monetary valuation of environmental impacts
aligned with the framework provided in the German sustain-
able building certification systems DGNB1 and BNB.2 These                  The recently established ISO 14008 (monetary valuation of
prescribe a study period of 50 years and reference service lives           environmental impacts and related environmental aspects)
according to Bundesinstitut für Bau-, Stadt- und                           provides a framework for monetary valuation (International
Raumforschung (BBSR) im Bundesamt für Bauwesen und                         Organization for Standardization 2019) and shows that the
Raumentwicklung (BBR) (2011). They also entail that inputs,                method of monetary valuation of environmental impacts has
outputs, and environmental impacts are calculated for life cy-             attained recognition internationally.
cle phases A1-A3, B4, C3, and C4 (Fig. 2) according to DIN                    Monetary valuation of environmental impacts determines
15978 (DIN Deutsches Institut für Normung e.V. 2012). As                   currency values, sometimes denoted as the “shadow price”
phase D is only included in overall sums for the DGNB sys-                 (Bickel and Friedrich 2005), of environmental damages (or
tem, it is investigated separately. For this study, the embedded           benefits) caused by economic activities such as constructing,
impacts of the buildings’ construction are calculated exclud-              maintaining, and disassembling an office building, the subject
ing the buildings’ operational phase (B6) and their mechani-               of this study. Environmental impacts include impacts to eco-
cal, electrical, and plumbing (MEP) systems. The inventory                 systems, human health, or human possessions. If damages
includes all building parts for which the execution drawings               caused and/or benefits accrued are not compensated for, they
                                                                           are known in environmental economics as externalities.
2
  Bewertungssystem Nachhaltiges Bauen (Evaluation System for Sustainable
                                                                           3
Building)                                                                      www.bauteileditor.de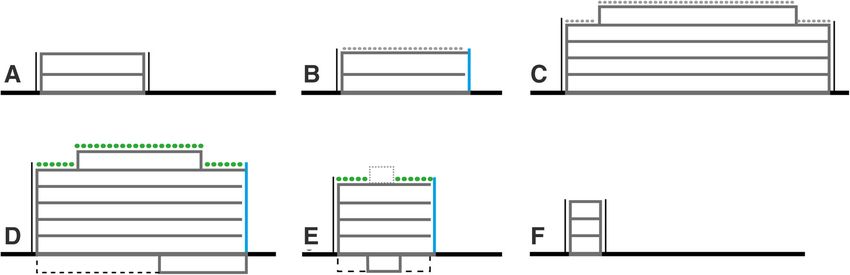
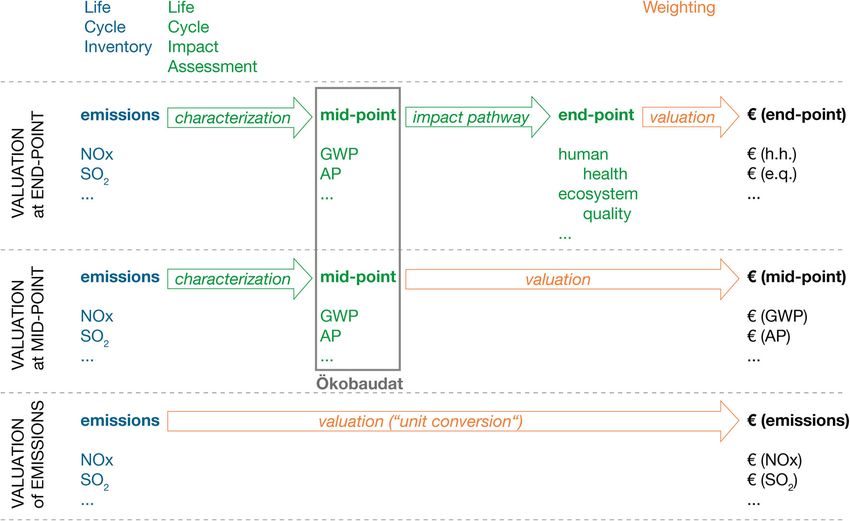
Int J Life Cycle Assess

Fig. 2 Life cycle phases according to BS EN 15978 (British Standards Institution 2011), highlighting of phases considered in LCA/LCC calculations by
authors

Although these externalities are not included in the (market)                   We do not propose a new valuation set but rather vary the
price of the product, several methods of quantifying them                   monetary values within the range provided by previous stud-
exist. Tekie and Lindblad (2013) provide a comprehensive                    ies in order to analyze which weights result for the different
overview. Not all monetary valuation methods are equally                    impact categories. Additionally, large uncertainties are inher-
applicable to LCA studies (Pizzol et al. 2015), as LCA re-                  ent within monetary valuation methods (Pizzol et al. 2015).
quires the valuation specifically of environmental impacts.                 This study gives an indication as to which differences in val-
   Valuation can be applied at different steps in the LCIA (Fig.            uation play an important role for the resulting weighting in
3). Some methods quantify directly the cost of emissions by                 building LCA calculations. The studies and methods consid-
assessing the external cost caused by the emission of single sub-           ered for this study are shown in Table 5.
stances, e.g., the method used by the ExternE project (Bickel and               A number of methods have been developed to assess external
Friedrich 2005). It is also possible to valuate impacts at mid-             costs of environmental problems or qualities either by quantify-
point, as done by Vogtländer (2017). Other methods provide                  ing willingness to pay (WTP) or avoidance costs (Ahlroth et al.
values for end-point categories, e.g., Weidema (2009),                      2011). WTP can be revealed (e.g., damage costs), expressed
Murakami et al. (2018), with or without disaggregation into cor-            (stated preference), imputed (e.g., substitution), or politically de-
responding mid-points. As Ökobaudat, the database used for this             termined (e.g., in terms of taxes) (Ahlroth et al. 2011; Mishra
study, provides aggregated mid-point-indicators without full in-            2006). Revealed WTP uses market prices as a basis. To deter-
ventory data, we are limited to valuation systems providing                 mine expressed WTP, surveys need to be conducted in which
values for mid-point indicators. There are overlaps with the sys-           individuals are asked to state their preferences, e.g., their WTP to
tems that provide costs of emissions directly (Fig. 3: “unit con-           avoid a marginal deterioration in environmental quality or quality
version”), when the reference substance for a mid-point indicator           of life. Imputed WTP methods investigate the prices an individ-
is valuated, such as SO2 (reference substance for acidification             ual is willing to pay for the replacement of an environmental
potential). Ideally, the characterization factors (CF) for the sub-         good or service or to avoid damages to it. Lastly, taxes can be
stances contributing to a mid-point indicator are identical with            used to estimate external costs, as they represent society’s WTP
the ratio of the costs of emissions of the substances in question, or       to reach environmental targets (Finnveden et al. 2006).
CF (substance A) = EC (substance A)/EC (reference substance).               Avoidance, prevention, or abatement costs are calculated costs
To give an example, the sum of the cost of SO2 and NOx emitted              for measures that avoid emissions, e.g., the use of renewable
by a process should equal the cost of acidification po-                     energy sources in lieu of fossil energy sources in order to avoid
tential measured in SO2-equivalent. This only holds true                    CO2 emissions. For avoidance costs, a target amount of
if the characterization model and the unit conversion                       emissions and either average or marginal costs to reach the set
(nomenclature from ISO 14008 (International                                 target need to be defined. There are differences between
Organization for Standardization 2019)) are aligned.                        countries in how the economic value of damages and/or
Int J Life Cycle Assess

Fig. 3 Monetary valuation at different levels of aggregation in life cycle impact assessment (LCIA)

avoidance is assessed, i.e., equity weighting. Likewise, the ques-          values used. If applicable, values were inflation adjusted per
tion of whether and how future emissions should be discounted is            (OECD 2019) to the base year 2015 to match the LCC study.
answered differently. Hellweg et al. (2003) recommend that                  This method accepts the fact that the resulting minimum and
discounting should be subject to sensitivity analysis.                      maximum values mix different valuation models. The goal is
    For this study, we consider environmental criteria, i.e., re-           to determine the effect of higher/lower valuation of environ-
sults from the LCIA. As energy is an input value into the                   mental impacts in order to prioritize the reduction of uncer-
system (Fig. 1) and therefore part of the life cycle inventory,             tainty in valuation.
it is not considered in our study. Adding a valuation for energy               As the effects of global warming gain political importance,
consumption double counts the valuation of the environmen-                  global warming potential (GWP) is by far the most discussed
tal impacts caused by energy consumption for the materials                  indicator in the recent literature. Twelve recent valuation
contained in the building. Comparing a monetary valuation of                models were considered for this study in conjunction with
the mid-point impacts to a monetary valuation of the energy                 CO2 pricing models currently on the market, such as the
consumption related to the production and end of life of build-             European Union Emissions Trading System (EU ETS), and
ing materials is subject of further research. However, for the              implied pricing derived from NGOs offering CO2 compensa-
valuation of resources, we do consider the primary energy                   tion for individual emissions, e.g., atmosfair (Germany) and
contained in a material (PENRM), as this energy is not con-                 MyClimate (Switzerland). The minimum valuation consid-
sumed and hence has no environmental impact other than                      ered in this study4 is the recent pricing for CO2 compensation
resource depletion.                                                         by atmosfair (atmosfair gGmbH 2019). This valuation is low
                                                                            because compensation projects seek out the most cost-effi-
3.2.1 Valuation of mid-point impacts                                        cient, “low-hanging fruits” for CO2 prevention (Schultz
                                                                            et al. 2015). As, in nominal terms, this price has not changed
For this study, we draw a worst-case scenario for determining               from 2007 until now, we use this valuation for our study. In
the maximum values of the environmental costs of the build-
ing: for this, we apply the greatest valuation found in literature          4
                                                                              Even lower valuations, e.g., 0.0024€/kg CO2-eq. by Friedrich et al. (2001),
for the mid-point indicator in question. As such, we determine
                                                                            were not used here, as such low assessments largely seem to reflect the dates of
if a high value for one impact category would lead to a more                these studies and appear outdated, as more recent updated (higher) values have
significant contribution to the overall external cost from the              become available for each system. Likewise, the recent CO2-pricing plan
same. On the other end of the spectrum, we utilize the mini-                issued by the German government BMU (2019) starting at 0.01€/kg CO2
                                                                            emissions for transport and space heating in 2020 was excluded as it does
mum values calculated in recent studies to define a best-case               not apply to the embedded emissions in the building sector. Lastly, the EU
scenario, yielding a range of estimates. Table 1 shows the                  ETS was excluded as prices for the certificates are highly volatile.
Int J Life Cycle Assess
Table 1 Monetary valuation of mid-point indicators used in this study; global warming potential (GWP), ozone depletion potential (ODP), photo-
chemical creation potential (POCP), acidification potential (AP), eutrophication potential (EP)
Environmental Unit Min. valuation Source of min. valuation Max. valuation Source of max. valuation
indicator per unit per unit
GWP kg CO2-eq. 0.02 € atmosfair gGmbH 2019 0.65 € Matthey and Bünger (2019)
ODP kg R11-eq.; kg FCKW-eq.; 0.00 € Vogtländer 2016 30.00 € the Bruyn et al. (2018)
kg CFC11-eq.
POCP kg C2H4 eq. 0.28 € Adensam et al. 2002 10.02 € Vogtländer (2016)
AP kg SO2-eq. 1.77 € Adensam et al. 2002 15.04 € Bünger and Matthey (2018),
Matthey and Bünger (2019)
EP kg PO43-eq. 1.78 € Adensam et al. 2002 18.52 € Ahlroth (2009)
reality, the fact that the nominal price has not been adjusted The potential for summer smog or the formation of tropo-
implies that the inflation-adjusted price for the compensation spheric ozone known as POCP (Photochemical Ozone
of CO2 emissions has decreased over the last 13 years. The Creation Potential) is considered to cause respiratory diseases
highest valuation for the emission of greenhouse gases is tak- and damage to agriculture and forests. The model of Adensam
en from a recent report issued by the German Federal et al. (2002) values POCP lower than all other studies considered.
Environmental Agency (Matthey and Bünger 2019) and rep- Their valuation includes health costs caused by exposure to high
resents the (maximum) value recommended for sensitivity ozone values. The authors state that additional potential damage
analyses with a base year of 2016. This valuation model does to agricultural production and forestry is currently not
not discount future emissions and makes its evaluation based quantifiable. Vogtländer (2016) values the marginal prevention
on a damage cost model. costs of POCP significantly higher. As this contradicts the theory
Ozone depletion potential (ODP) is not intensely discussed that prevention is more economical than repair, it seems to sug-
in the recent literature, as the Montreal protocol has success- gest that the damage costs might be valued too low or incom-
fully regulated and reduced ozone-depleting substances. The pletely by the former model. Nevertheless, we used them as the
eco-cost-value ratio (EVR) model by Vogtländer et al. (2001) lowest estimate for the EC of POCP.
valuates 1 kg CFC11-equiv. at zero eco-cost (Vogtländer For Acidification Potential (AP) and Eutrophication Potential
2016), as the substances causing ozone depletion are (EP), the lowest values are again from Adensam et al. (2002). Both
accounted for in the global warming prevention costs values represent the costs of damage. For AP, these include dam-
(Vogtländer 2017). This model determines marginal preven- age to human health, forests, and buildings. EP also causes health
tion costs, which do not allow for double counting and always costs as it influences drinking water quality. Potential economic
use the higher valued prevention costs. The highest valuation disadvantages to tourism caused by the eutrophication of water
is taken from the Bruyn et al. (2018), who valuate 1 kg bodies were not quantified. The high estimate of the EC of AP
CFC11-equiv. at 30.00 €. Their model uses ReCiPe charac- is from Matthey and Bünger (2019). They valuate SO2 emissions
terization factors in conjunction with the NEEDs model. The using the average damage costs of air pollution (emission) by
costs in this method are prevention costs, defined as “the unknown sources. Characterization was applied according to
highest permissible cost level … for the government per unit DIN 15804 (DIN Deutsches Institut für Normung e.V. 2014), as
of emission control” (the Bruyn et al. 2018). It is tailored to no conversion is available in the study. The upper limit for EP is
Dutch conditions and has to be modified for use in Germany, taken from (Ahlroth 2009), representing damage cost estimates
especially if ODP proves to be a relevant indicator considering using individual willingness to pay and market prices.
the maximum values in this study. When using the maximum The range of values of the environmental impacts is sur-
valuation for ODP and GWP in this study, there could be prisingly large. All studies stress the high degree of variance in
some double counting of the effects of emissions causing both damage or prevention cost models. But, with the exception of
ozone depletion and global warming. This has to be kept in Ahlroth (2009), who provides minimum and maximum values
mind when evaluating the results. for abiotic resources, GWP, POCP and human toxicity, and
The remaining three categories differ from GWP and ODP some studies using minimum and maximum values for GHG
insofar as they cause local rather than global effects. emissions, none of the studies cited provides a range of values
Therefore, resulting potential damages are more trace- for all indicators.5
able but are also dependent on local circumstances, such
as population density, the state of the local economy, or 5
The ranges provided by Ahlroth (2009) lie within the ranges considered in
the type of adjacent land use. this study.Int J Life Cycle Assess
3.2.2 Valuation of resources indicator. Alternatively, evaluation of the depletion of antimo-
ny (Sb), the reference substance for ADPelem, can be found in
As the building sector consumes a large share of the world’s the EPS 2015d method (Steen and Palander 2016). This val-
resources (Klaassens 2014; Hegger et al. 2012), resource con- uation (Table 2) is applied and results are compared.
sumption is an indicator that should be considered when eval-
uating the ecological qualities of buildings. The question of
whether and how to assess resources within the LCA frame- 3.3 Life cycle costs
work is subject to controversy, and different methods have
been developed for this assessment (Klinglmair et al. 2014; Life cycle cost (LCC) calculations consider all costs related to the
Giljum et al. 2011). As the extraction of natural resources entire life cycle of the building, i.e., initial investment, costs
affects the ecosystem and at the same time provides the basis during operation, and demolition costs. They are based on market
for human economic activities, a complete valuation includes prices and subject to price increases and discounting. For the life
economic, socioeconomic, and ecological aspects. If resource cycle of buildings, we use the life cycle phases according to DIN
depletion is evaluated from an ecological point of view, it 15978 (DIN Deutsches Institut für Normung e.V. 2012) (Fig. 2)
relates to the overall (natural) availability of a given resource. to align LCC with LCA calculations. Building life cycle costs
Economic evaluation includes scarcity by relating the resource (LCC) include construction, use and end of life—that is, life
to the total stock available with current and/or future technol- cycle phases A1-A3, B2-B4, and C1. Phases A4 and A5 are
ogies of extraction. Socioeconomic aspects focus on a combi- indirectly included in construction cost as they are generally
nation of a resource’s scarcity and its importance to society to included in the contractors’ prices. For the same reason, they
assess how critical it is. are not listed separately. Standardized data for C3, C4, and D is
Environmental impacts of resource extraction should be currently not available by product but is estimated on a building
assessed in the impact assessment, whereas economic and level. For the parameters discounting and price increase, the
social impacts should be modeled separately (Weidema et al. BNB certification system framework is used with an annual
2005). As life cycle phase A1 assesses environmental impacts 2% price increase for building materials and services and a
from resource extraction itself, they are already included in the 1.5% discount rate for the evaluation of future investments.
above life cycle assessment. Therefore, the valuation of re- The base year used is 2015, the same as for the LCA calculations.
sources in addition to the five impact categories described in LCC reflect market prices for building products and ser-
Section 3.2.1 includes resource depletion as related to the vices. In light of the presence of the European Emissions
natural availability of resources only. Van Oers and Guinée Trading System (EU ETS) for greenhouse gases, the question
(2016) argue that ADPE/ADPelem (abiotic depletion of ele- arises if some or all of the external costs of GHG emissions
ments) is therefore the only purely environmental indicator have already been internalized and are therefore included in
to be included in LCA calculations. the life cycle costs of buildings. Freeman et al. (1992) argue
We calculate the ecological costs related to resource deple- that tradable emission permits ensure the internalization of
tion separately from the costs of emissions to analyze the externalities under optimal trading rules (i.e., the marginal
potential weight this indicator takes in building LCA evalua- damage is equal for all sources). This means that the EU
tion. Ökobaudat (Bundesministerium des Innern, für Bau und ETS would ensure that the external costs of GWP are already
Heimat (BMI) 2016) provides values for ADPF (abiotic de- factored into the LCC. Under this circumstance, the price of
pletion of fossil energy sources) in Megajoule (MJ) and the permit proves to be the marginal avoidance cost, as emit-
ADPelem in kg antimony-equivalents (Sb-eq.) as indicators ting facilities will avoid emissions if this can be achieved at a
of resource depletion. Both of these indicators are related to lower price than buying permits (Freeman et al. 1992).
abiotic resources only and take into account the overall re- Although the first condition applies, as greenhouse gases
source stock (DIN Deutsches Institut für Normung e.V. cause the same amount of global warming regardless of their
2014). The underlying methodology and characterization source, the EU ETS does not adhere to optimal trading rules.
was developed by the Institute of Environmental Sciences Firstly, in 2015, the base year of this study, the manufacturing
(CML) (van Oers et al. 2002). An updated indicator has been industry received on average 66% of certificates free of charge
developed by van Oers and Guinée (2016), but is not included
in Ökobaudat yet. Table 2 Valuation of abiotic resource depletion *1 ELU
Little data is available regarding the valuation of resource (environmental load unit) = 1 €2016
depletion. The work-around suggested by Vogtländer (2016)
Indicator Valuation Source
is to value the non-renewable primary energy embedded in the
material (PENRM) where detailed data about the resource PENRM 0.0167 €/MJ Vogtländer (2016)
depletion related to a particular material is not available. We ADPelem 18,190 ELU/kg Sb* Steen and Palander (2015)
use this as a test value to determine the relative weight of thisInt J Life Cycle Assess
(European Commission 2020). Secondly, this percentage For all projects, LCA and LCC calculations were per-
varies significantly between industries, insofar as industries formed according to the framework described in Sections
subject to an exposure to carbon leakage received emissions 3.1.and 3.3. Base data for the LCA and LCC calculations of
certificates equal to their predicted emissions free of charge. projects A to E are taken from a previous study conducted by
This applies to most of the industries manufacturing construc- the authors and colleagues (Schneider-Marin et al. 2019).
tion materials, e.g., the manufacturing of cement, steel, alumi- Figure 4 shows the sizes, number of floors, exterior wall,
num, and glass (European Commission 2014). Therefore, it is and roof types of the case study projects. In Table 3, general
concluded for the purpose of this study that the external costs characteristics of the projects are listed.
of direct GHG emissions caused by the manufacturing of con- Project F, the FTmehrHaus of Tausendpfund GmbH, was
struction materials have not been factored into the LCC. calculated additionally for this study providing different ma-
However, as power generators in most EU countries including terial options keeping everything else, e.g., energy standard,
Germany have to buy emission allowances, manufacturing spatial organization, and geometry, the same between varia-
processes buying electricity are subject to indirect price in- tions. The built structure uses three different exterior wall
crease due to GHG emissions of electricity generation. types for the three floors, as it serves as a test case for the
Unfortunately, data to track the electricity used by the owner, assessing thermal comfort in spaces with concrete,
manufacturing of construction materials is not available. masonry, and sand-lime brick exterior walls. We varied insu-
Therefore, we excluded this factor from this study also con- lation materials of each of these three wall types (variations F1
sidering the low price of traded certificates in 2015 (between 7 to F10) and also calculated 3 different subtypes of a wood
€ and 8 € per ton of CO2-eq). frame construction for the exterior wall (variations F11 to
In order to normalize results and make them comparable to F13). For comparison with projects A to E, an exterior glazed
the LCA results, we used the usable floor area (UFA) as the curtain wall was considered (variation F14). Greenhouse gas
functional equivalent, although LCC studies per the BNB emissions emerged as a preponderant factor in the impact
framework use the gross floor area. The reference study period assessment (see Section 4). We therefore also calculated a
is the same as for the LCA calculation: 50 years. As the pur- wood structure (variation F15), adding up to a total of 15
pose of the LCC assessment in this study is to provide com- construction material types.
parison values for the external costs, the same constant bound-
ary conditions as for the LCA apply (e.g., products’ standard
service lives).
4 Results
3.4 The case study projects 4.1 Environmental costs for five mid-point indicators
A set of six recent office buildings serves as a case study. They The LCA results of the case study project LCAs lay within a
were built after 2009 and adhere to the German energy stan- range considered acceptable by the DGNB system. For exam-
dard EnEV (Energieeinsparverordnung = energy saving ple, results for GWP for life cycle phases A1-A3, B4, C3, C4,
ordinance) 2009. The construction type is similar, with and D lie between 8.32 kg CO2/m2 *a and 10.27 kg
concrete as the main structural material and either CO2/m2 *a, averaging 9.5 kg CO2/m2 *a. This is very
glazed curtain walls or facades made of concrete with close to the DGNB benchmark of 9.4 kg CO2/m2 *a
exterior insulation and windows. (DGNB GmbH 2018).
Fig. 4 Simplified representation of the case study projects showing size and number of floorsInt J Life Cycle Assess
Table 3 Characteristics of the sample projects
Project UFA (m2) Number of floors Structure Exterior walls Window- Energy standard
to-
wall ratio
A 2.512 2 Reinforced concrete Reinforced concrete 0.41 EnEV 2014
Exterior cladding: steel
Windows/curtain wall: aluminum frame
B 3.039 2 Reinforced concrete Reinforced concrete 0.37 EnEV 2014
Exterior cladding: steel
Windows: aluminum frame
C 15.006 5 Reinforced concrete Reinforced concrete 0.27 EnEV 2014
Ext. cladding: aluminum
Windows: aluminum frame
D 13.685 6 Reinforced concrete Reinforced concrete 0.25 EnEV 2009
Ext. cladding: aluminum
Windows/curtain wall: aluminum frame
E 4.504 4 Reinforced concrete Reinforced concrete 0.28 EnEV 2014
Ext. cladding: aluminum/concrete
Windows/curtain wall: aluminum frame
F 1.060 3 Reinforced concrete Reinf. concrete, 0.27 EnEV 2014
Ext. cladding: EIFS (EPS)
Windows: PVC frame
The EC for all sample projects were calculated according to AP is the second largest contributor, accounting for a min-
the parameters described in Section 3. They are represented imum of 14% of the overall EC for phase A1-A3 (project F),
for three choices of life cycle phases: initial material use (prod- 12% if end of life is included (project F), and 12% if phase D
uct: A1 to A3), whole life cycle including use and end of life is included (project F). It can be responsible for up to 18% for
(A1 to A3 + B4 + C1 + C3), and additionally including end- phase A1-A3 (project E), 17% if end of life is included (pro-
of-life credits (A1 to A3 + B4 + C1 + C3 + D). The environ- ject D), and 16% if phase D is included (project E).
mental impacts are converted into EC for the minimum and It is interesting to see, however, that accounting for AP
maximum EC values shown in Table 1. In general, most en- does not change the ranking of the projects significantly.
vironmental impacts and therefore the larger share of EC oc- Project F emits the least greenhouse gases and also shows
cur in the product phases A1 to A3. This can be explained by the lowest EC whereas project D shows the highest values
the assumptions going into the calculations and by the data for both depending on the life cycle phases considered. For
background: According to Ökobaudat, for all building mate- the projects in mid-range, A and E, accounting for AP has an
rials, the product phase causes more environmental im- influence, as their GWP values are very close. If life cycle
pacts than the end-of-life phase. Additionally, life cycle phase D is considered, the ranking changes between projects
lengths of building materials vary between 15 and 50 C, E, and D, as their GWP values are again within a very close
years. With the bulk of the materials having a reference range or even equal. GWP, in other words, is the preponderant
service life of 50 years or more, phase B4 causes fewer factor in determining the ranking of the case study buildings’
impacts than A1 to A3. The exchange and end-of-life environmental impact.
phases add impact, whereas phase D contains some ODP does not contribute to the overall EC, as its EC are set
credits, i.e., overall impact decreases if phase D is to zero. POCP contributes between 0.2 and 0.8% and EP
considered. between 1.5 and 2.0% for all projects. This indicates that when
EC is set to its minimum value found in the literature, the
4.1.1 Minimum valuation environmental impacts that should be considered first and
foremost when constructing, maintaining, and demolishing
Figure 5 shows that for the minimum valuation of all indica- buildings are GWP and AP, whereas ODP, POCP, and EP
tors, GWP dominates the overall EC for all projects. GWP are almost negligible.
contributes a minimum of 80% for phase A1-A3 (project E),
81% including end of life (projects D, E), and 81% including 4.1.2 Maximum valuation
phase D (project E) to the overall EC. Its overall contribution
can be up to 84% for phase A1-A3 (project F), 86% including Assuming maximal EC estimations (Fig. 6) does not change
end of life (project F), and 85% including phase D (project F). this picture fundamentally, although GWP is even moreInt J Life Cycle Assess Fig. 5 Total minimum EC of the case study projects in € per m2 UFA and depletion potential (ODP), and global warming potential (GWP); corre- year; subdivided in EC for eutrophication potential (EP), acidification sponding numbers are listed in Table 6 potential (AP), photochemical creation potential (POCP), ozone preponderant. GWP contributes between 92 and 94% to the projects A and C if phase D is not considered, and, if overall EC, while AP is responsible for between 4 and 6%. phase D is considered, projects C, D, and E. None of Although the valuation of ODP, POCP, and EP is significantly the other indicators change any rankings. higher than when minimal valuation is assumed (see Table 1), Comparing minimum and maximum EC assessments, none of these indicators contributes more than 1.2%. This is overall EC increase by a factor of 24.6 to 25.8 depending on interesting in light of the question if there might be some the projects and the life cycle phases considered. About 93% double counting of substances that contribute to both GWP of this increase is due to the 28-fold increase in the valuation and ODP, as we are using maximum valuation for both (see of GWP. About 5% of the variance is due to the 8-fold in- Section 3.2.1). The extremely low contribution of ODP, less crease in the valuation of AP. The large increases of the other than 0.000011%, indicates that, if there is some double indicators (e.g., ECmax (POCP) = 36 × ECmin (POCP); ECmax counting, it is irrelevant to the overall result. (EP) = 10 × ECmin (EP)) do not contribute significantly to the Using maximum values yields again almost the same overall increase. ranking of the projects as ranking them according to GWP only, with the exception of projects that emit 4.1.3 Influence of global warming potential almost the same amount of GWP per m 2 and year. The only differences in ranking that result from includ- As the minimum and maximum valuation reveals the im- ing AP are between projects A and E for phase A1-A3, portance of GWP, we reduced GWP valuation to the point Fig. 6 Total maximum EC of the case study projects in € per m2 UFA and depletion potential (ODP), and global warming potential (GWP); corre- year; subdivided in EC for eutrophication potential (EP), acidification sponding numbers are listed in Table 7 potential (AP), photochemical creation potential (POCP), ozone
Int J Life Cycle Assess

when its EC would cease to be as unequivocally impor-                    using ADPelem and the lowest EC using PENRM, i.e., the
tant: GWP’s contribution to overall EC is so preponderant                points of the ranking are reversed. With the exception of pro-
that it only drops to about 50% when GWP’s EC is set to                  ject E, valuation of ADPelem yields lower EC results than
0.039 € per kg CO2-eq. while all other ECs are kept at                   valuation of PENRM. Lastly, while employing ADPelem sub-
their maximal assessments. For this specification, AP con-               stantially lowers the cost assessment of all other projects com-
tributes 35 to 54%, EP between 6 and 8%, and POCP                        pared with their evaluation using PENRM, this change in
between 3 and 8%. ODP is still not relevant, with a contribution         method increases the cost assessment of project E.
of 0.000041% or less to the overall EC. Alternatively,                      We also see that, using the PENRM method, life cycle
for AP to consistently account for 50% or more of the                    phases A1-A3 cease to be the dominant life cycle phases,
overall EC, GWP valuation would have to drop to 0.016                    with their maximum contribution to EC being 49.7% in
€ per kg CO2-eq. The fact that GWP overwhelmingly deter-                 project A. Phase D is insignificant, as there are no
mines the overall EC of all case study projects also broadly             PENRM credits for any of the projects. This stems from
resonates with the fact that building construction contributes           the fact that the Ökobaudat 2016-I contains very few (a
approximately 11% of global CO2 emissions (International                 total of 21) building materials receiving a PENRM credit
Energy Agency (IEA) 2018).                                               in phase D and none of them is used in any of the case
                                                                         study projects. When using ADPelem, life cycle phases
4.2 Taking resource depletion into account                               A1-A3 contribute between 52 and 82% of EC, and phase
                                                                         D provides a maximum credit of 6%.
In the previous section, Ökobaudat’s five indicators directly               In the context to the ECs calculated in Section 4.1, re-
related to environmental damage were considered. This sec-               source depletion EC is of significant magnitude. If the min-
tion tackles the question of, in addition, taking resource deple-        imal valuation for all environmental impact indicators is
tion into account. Although only a few methods evaluating                used, EC of resource depletion adds at least 193% to the
resource depletion at the mid-point level exist                          minimum EC (project D, LC phases A1-A3, APDelem) and
(Section 3.2.2.), an assessment on their basis nonetheless               can add up to 2212% (project F, all LC phases, PENRM).
yields insights into the relative importance of this indicator           Assuming maximal cost assessment, resource depletion
while also highlighting differences in valuation.                        adds between 7.4% (project F, all LC phases, APDelem)
    Figure 7 shows a comparison between the direct valuation             and 74.6% to total EC (project F, LC phases A1-A3, C3,
of ADPelem and the work-around of valuating PENRM. In                    C4, D, PENRM).
general, there are more significant differences between pro-                For a more detailed analysis of the materials causing
jects on the resource depletion count than on the other indica-          high values of the resource depletion indicators, we
tors considered in Section 4.1. However, the ranking of the              looked at the materials used in project E and project F.
projects is entirely dependent on the valuation method used,             Project E stands out in its assessment under ADPelem and
i.e., it changes almost completely depending on the method.              project F in its assessment under PENRM. The former is
Most notably, irrespective of the phases considered, Project F           also the only project for which ADPelem yields higher EC
shows the highest EC using PENRM and the lowest EC of all                than PENRM, the latter yields the highest values of all
projects using ADPelem while Project E has the highest EC                projects for PENRM.

Fig. 7 EC of resource depletion of the case study projects in € per m2 UFA and year; comparison between EC for non-renewable primary energy for
material resources (PENRM) and abiotic depletion potential elements (ADPelem.); corresponding numbers are listed in Table 8
Int J Life Cycle Assess
PENRM generates an extraordinarily high portion of construction cost for phases A1-A3 and even less (0.66 to
project F’s EC because of that project’s exterior walls, 0.80%) if life cycle costs and the full life cycle is considered
namely, its EPS and XPS insulation and its PVC win- (phases A to C). EC using maximal cost assumptions, how-
dow frames. These elements have to be exchanged once ever, is equal to between 26 and 37% of construction costs, 16
during the reference study period, almost doubling the to 20% of total LCC, and 23 to 34% to LCC disregarding
EC of the exterior walls. XPS and EPS are also applied phases B2 and B3. The difference between EC and LCC in-
in other projects causing high shares of PENRM, as do creases for the full life cycle, as the use phase (not including
bituminous materials, but not to the extent as in project energy use for building operation) adds more costs than envi-
F. The high ADPelem values for project E, by contrast, ronmental impacts.
can be traced back almost exclusively to the stainless It is evident that EC and LCC are not inversely correlated,
steel enclosure of some of the building’s mechanical i.e., projects with lower EC are not necessarily more expen-
systems placed on the roof. The fact that this material sive. On the contrary, Project F, for instance, shows both low
is used in none of the other projects explains why pro- EC for phases A1-A3 and low construction costs. For the full
ject E yields an anomalous (because greater than under life cycle (excluding B2 and B3), project F has the second-
PENRM) EC when employing ADPelem. lowest LCC and the lowest EC. On the other end, project E,
with the highest construction and life cycle costs, shows a
mid-range EC.
4.3 Relationship between environmental costs and
life cycle costs
4.4 Minimizing environmental costs
Fully internalizing EC into the life cycle costs of build-
ings allows for a better-informed cost-benefit analysis of Different variations of project F (Table 4) were investi-
more environmentally friendly, but potentially more cost- gated in order to minimize its EC. As GWP appears to
ly, alternative building designs and construction methods. be the preponderant indicator, variation F15 replaces the
To see under which circumstances EC may influence such reinforced concrete structure with a wood structure in
choices, we compared investment costs (costs for phases order to realize the large GWP dividend implied by this
A1-A5) to EC for phases A1-A3, as well as life cycle change. In particular, Ökobaudat attributes a GWP cred-
costs (LCC) for all phases considered in standard LCC it to wood in phase A1-A3 for carbon storage, allowing
calculations to life cycle EC. Phase D is excluded from project F15 to show negative EC for these phases.
this comparison, as no cost credit data exist for benefits F15 contains approximately 225 metric tons of wood
and loads outside of the system boundary. As phases B2 (and equal amounts of concrete for the base plate), com-
(maintenance) and B3 (repair) are not accounted for in the pared with approximately 1412 tons of concrete in ver-
LCA calculations (Fig. 2), we show the costs of these sions F1-F3, not considering reinforcement. (These varia-
phases separately from other phases. tions contain the highest amount of concrete, as their ex-
Figure 8 illustrates that EC derived from minimal cost as- terior walls are made of this material.) This choice comes
sumptions account for a mere 1.04 to 1.46% of building without clear trade-offs in terms of the other, non-GWP,
Fig. 8 Comparison of EC and
LCC of the sample projects in €
per m2 UFA and year; LCC are
subdivided into (partial life cycle)
costs for maintenance (B2) and
repair (B3) and (partial) life cycle
costs A1-A3, B4, and C1; corre-
sponding numbers are listed in
Table 9Int J Life Cycle Assess
Table 4 Characteristics of variations on project F
Variation Structure Exterior walls Window frames
F1 (project F) Reinforced concrete Reinf. concrete + EIFS (185 mm EPS) PVC
F2 Reinforced concrete Reinf. concrete + EIFS (185 mm mineral wool) PVC
F3 Reinforced concrete Reinf. concrete + EIFS (185 mm EPS, lightweight plaster) PVC
F4 Reinforced concrete Masonry + EIFS (65 mm EPS) PVC
F5 Reinforced concrete Masonry + EIFS (65 mm mineral wool) PVC
F6 Reinforced concrete Masonry + EIFS (65 mm EPS, lightweight plaster) PVC
F7 Reinforced concrete Masonry + EIFS (65 mm wood fiber) PVC
F8 Reinforced concrete Sand-lime brick + EIFS (190 mm EPS) PVC
F9 Reinforced concrete Sand-lime brick + EIFS (190 mm mineral wool) PVC
F10 Reinforced concrete Sand-lime brick + EIFS (190 mm EPS, lightweight plaster) PVC
F11 Reinforced concrete Wood frame + fiber cement siding PVC
F12 Reinforced concrete Wood frame + EIFS (wood fiber) PVC
F13 Reinforced concrete Wood frame + ext. plaster (ventilated) PVC
F14 Reinforced concrete Aluminum/glass curtain wall N/A
F15 Wood; Wood frame + ext. plaster (ventilated) Wood
Base plate: concrete
indicators (Fig. 9). Looking at the underlying indicators, As wood receives GWP credits for A1-A3, emissions
F15 ranks are lowest for both GWP and POCP. While it from the end-of life scenario of combustion (for energy
shows by far the highest values for ODP (7 to 12 times generation) are accounted for in phase C3. Therefore,
the lowest values) and the second highest values for EP the EC of project F15 are closer to other variants if
(F14 yields the highest value), these impacts are almost the full life cycle without phase D taken into account.
negligible in terms of the overall EC. As a result, F15 It is interesting to see that variant F14 (glazed curtain
emerges as the lowest overall EC option for phases A1 wall) shows lower EC than the variants with wood ex-
to A3 and full life cycle (including D). Other variations terior walls F11 to F13 for the full life cycle without D.
with wood exterior walls (F11 to F13) also substantially This is due to the end-of-life scenario (recycling) of the
reduce EC during these phases. curtain wall system.
Fig. 9 Total maximum EC in € per m2 and year of different variations of ozone depletion potential (ODP), and global warming potential (GWP);
project F; subdivided in EC for eutrophication potential (EP), corresponding numbers are listed in Table 10
acidification potential (AP), photochemical creation potential (POCP),You can also read