Apple Inc. Equity Valuation - International ...
←
→
Page content transcription
If your browser does not render page correctly, please read the page content below

Apple Inc. Equity Valuation
 Investment Analysis Dissertation Report

 Maria Vasilaki
 Georgios Tsakalidis

SCHOOL OF ECONOMICS, BUSINESS ADMINISTRATION & LEGAL
 STUDIES
 A thesis submitted for the degree of
 Master of Science (MSc) in Banking & Finance

 July 2018
 Thessaloniki - Greece

Student Name: Maria Vasilaki
 Student Name: Georgios Tsakalidis

 SID: 1103160025
 SID: 1103160019
 Supervisor: Prof. Apostolos Dasilas

We hereby declare that the work submitted is ours and that where we have made use
of another’s work, we have attributed the source(s) according to the Regulations set
in the Student’s Handbook.

 July 2018

 Thessaloniki - Greece
Abstract
This dissertation was written as a part of the MSc postgraduate program in Banking
and Finance held at the International Hellenic University.

The topic of this dissertation is the equity valuation of Apple Inc. The first part of this
report contains general information about the firm’s operations and its peer
companies as well as a SWOT analysis referring to the sector and industry in general.
The second part includes some key financial ratios of the firm and a comparison with
its main competitor, Samsung. By using the ratio indicators of the firm, an estimation
of the financial condition and the possible short-term future potentials of Apple is
attempted. The third part comprises of Apple’s forecasts, where information about
the future expectations are provided. The fourth part consists of the different
valuation models that we used (DCF, DDM, RIM and P/E ratio) and the outcome of
each model. Each outcome represents an estimation of the intrinsic value of Apple’s
share price. The last part of this dissertation is the literature review containing all
academic papers and researches for the topic. It starts with a brief introduction of
each valuation model, then a comparison between the alternative valuation models
and a final overview and connection of the empirical results with the pertinent
literature. Finally, all papers, databases and sources that were used in this
dissertation, are stated at the appropriate form each time throughout the report and
on the final bibliography.

We would like to thank Mr. Apostolos Dasilas for his contribution to the completion
of this dissertation.

 Student Names

 Maria Vasilaki

 Georgios Tsakalidis

 i
Contents

Abstract ...................................................................................................................................i
Contents .................................................................................................................................ii
1. Company Introduction .............................................................................................. 1
 1.1 Company Overview ....................................................................................................... 1
 1.2 Sector Analysis .............................................................................................................. 5
 1.2.1 SWOT Analysis......................................................................................................... 5
 1.3 Competition Analysis .................................................................................................... 9
2. Company Assessment ..................................................................................................... 15
 2.1 Porter’s Five forces Analysis ....................................................................................... 15
 2.2 Risk analysis ................................................................................................................ 17
 2.3 Ratio Analysis .............................................................................................................. 18
 2.3.1 Liquidity and Solvency Analysis ............................................................................. 19
 2.4 Efficiency Analysis ....................................................................................................... 25
 2.5 Profitability Analysis ................................................................................................... 33
 2.6 Financial Ratio Analysis with the Competitor ............................................................. 35
 2.6.1. Profitability and Asset Utilization......................................................................... 36
 2.6.2 Efficiency ............................................................................................................... 38
 2.6.3 Leverage and liquidity ........................................................................................... 41
 2.6.4 Growth rate ........................................................................................................... 43
3. Forecast and Assumptions.............................................................................................. 46
 3.1 Forecast Income Statement ........................................................................................ 47
4. Company Valuation ........................................................................................................ 48
 4.1 Dividend Discounted Model (DDM) ............................................................................ 48
 4.2 Residual Income Model (RIM) .................................................................................... 49
 4.3 Discounted Cash Flow Model (DCF)............................................................................ 51
 4.4 Price to Earnings Ratio................................................................................................. 52
5. Recommendation, Valuation, Reconciliation and Conclusion ...................................... 54
6. Review of Academic Literature on Valuation ................................................................ 56
 6.1 Description of valuation models ................................................................................. 57
 6.2 Implementation and comparison of the models ........................................................ 63
7. References....................................................................................................................... 66

 ii
1. Company Introduction
Apple Inc. is an American multinational technology company headquartered in
Cupertino, California. It was founded by Steve Jobs, Steve Wozniak and Ronald Wayne
in April 1976. Apple Inc. is trading in the NASDAQ Stock Market and has a market
capitalization of $ 898.35 billion.1

Its main operations are the design, manufacturing and marketing mobile
communication and media devices, like personal computers and portable digital music
players to consumers, small and mid-sized businesses and government customers
worldwide. The company also sells related software, services, accessories, networking
solutions and third-party digital content and applications.

It offers a variety of products such as iPhone, a line of smartphones, iPad, a line of
multi-purpose tablets and Mac, a line of desktop and portable personal computers.
The company also provides iLife, a consumer-oriented digital lifestyle software
application suite. iWork, which is an integrated productivity suite that helps users
create, present and publish documents, presentations and spreadsheets, available for
its MacOS and iOS operating systems. Another application software for its users are
the Final Cut Pro, Logic Pro X, and FileMaker Pro. An additional product is Apple TV
that connects to consumers TV and enables them to access digital content directly for
streaming high definition video, playing music and games and viewing photos. Apple
Watch, a personal electronic device and iPod, a line of portable digital music and
media players. Furthermore, the company sells Apple-branded and third-party Mac-
compatible, and iOS-compatible accessories, such as headphones, displays, storage
devices, Beats products, and other connectivity and computing products and supplies.
Additionally, it offers iCloud, a cloud service and Apple Pay, a mobile payment service.
The company sells and delivers digital content and applications through the iTunes
Store, App Store, Mac App Store, TV App Store, iBooks Store, and Apple Music.

1.1 Company Overview
It is essential that we proceed with a segmental analysis based on a geographic basis.

1
 As of 27/11/2017. Source: https://www.marketwatch.com/investing/stock/aapl).

 1
Table 1: Net sales by Operating Segment, Source: Apple Annual Report 2017

 Net Sales by Operating Segment 2017 Change 2016 Change 2015
 Americas $96,6 12% $86,613 -8% $93,864
 Europe 54,938 10% 49,952 -1% 50,337
 Greater China 44,764 -8% 48,492 -17% 58,715
 Japan 17,733 5% 16,928 8% 15,706
 Rest of Acia Pacific 15,199 11% 13,654 -10% 15,093
 Total Net Sales $229,234 6% $215,639 -8% $233,715

The Company’s reportable segments consist of Americas, Europe, Greater China,
Japan and Rest of Asia Pacific. Americas includes both North and South America.
Europe includes European countries, as well as India, the Middle East and Africa.
Greater China includes China, Hong Kong and Taiwan. Rest of Asia Pacific includes
Australia and those Asian countries which are not included in the Company’s other
reportable segments. Below you can observe a more detailed analysis of net sales per
area.

The following table presents net sales information and a percentage of the total net
sales by operating segment during the years 2017, 2016 and 2015. (in millions of
dollars):

Table 2: Percentage of total net sales by operating segment, Source: Apple’s Annual Report 2017

 America 2017 Change 2016 Change 2015
 Net sales $96,6 12% $86,613 -8% $93,864
 Percentage of total net sales 42% 40% 40%
 Europe 2017 Change 2016 Change 2015
 Net sales $54,938 10% $49,952 -1% $50,337
 Percentage of total net sales 24% 24% 22%
 Greater China 2017 Change 2016 Change 2015
 Net sales $44,764 -8% $48,492 -17% $58,715
 Percentage of total net sales 20% 22% 25%
 Japan 2017 Change 2016 Change 2015
 Net sales $17,733 5% $16,928 8% $15,706
 Percentage of total net sales 8% 8% 7%
 Rest of Asia Pacific 2017 Change 2016 Change 2015
 Net sales $15,199 11% $13,654 -10% $15,093
 Percentage of total net sales 7% 6% 6%

 2
As it is observed, America’s net sales increased during 2017 compared to 2016 due
primarily to higher net sales of iPhone, Services and Mac while net sales decreased
during 2016 in comparison to 2015 due primarily to lower net sales of iPhone. In
Europe, net sales increased during 2017 compared to the previous year primarily
because of higher net sales of iPhone and Services. The weakness in foreign currencies
relative to the U.S. dollar had an unfavorable impact on Europe net sales during 2017
compared to 2016. Europe net sales decreased during 2016 compared to 2015 driven
primarily by the effect of weakness in foreign currencies relative to the U.S. dollar and
a decrease in net sales of Mac, largely offset by an increase in iPhone unit sales and
Services.

In Greater China, Apple’s net sales decreased during 2017 as compared to those in
2016 due primarily to lower net sales of iPhone, partially offset by higher net sales of
Services. On the other hand, net sales in Greater China decreased during 2016
compared to 2015 because of lower net sales of iPhone and the effect of weakness in
foreign currencies relative to the U.S. dollar. The year-over-year increase in Japan net
sales in 2017 and 2016 can be primarily attributed to the higher net sales of Services
and the strength in the Japanese yen relative to the U.S. dollar.

For the rest of Asia Pacific, net sales increased during 2017 compared to 2016 due
primarily to higher net sales of iPhone, Services and Mac. The strength in foreign
currencies relative to the U.S. dollar had a favorable impact on Rest of Asia Pacific net
sales during 2017 compared to 2016. However, its net sales decreased during 2016
compared to 2015 as a consequence of lower net sales of iPhone and the effect of
weakness in foreign currencies relative to the U.S. dollar.

Segmental Analysis per product

Table 3: Net sales by Product, Source: Apple Annual Report 2017

 Net Sales by Product 2017 Change 2016 Change 2015
 iPhone $141,319 3% $136,700 -12% $155,041
 iPad 19,222 -7% 20,628 -11% 23,227
 Mac 25,850 13% 22,831 -10% 25,471
 Services 29,980 23% 24,348 22% 19,909
 Other products 12,863 16% 11,132 11% 10,067
 Total net sales $229,234 6% $215,639 -8% $233,715

 3
The following table depicts net sales and unit sales information by product for the
years 2015, 2016 and 2017 (dollars in millions and units in thousands):

Table 4: Net sales, unit sales and percentage of total net sales by Product, Source: Apple Annual Report 2017

 iPhone 2017 Change 2016 Change 2015
 Net sales $141,319 3% $136,700 -12% $155,041
 Percentage of total net assets 62% 63% 66%
 Unit sales 216,756 2% 211,88% -8% 231,218
 iPad 2017 Change 2016 Change 2015
 Net Sales $19,222 -7% $20,628 -11% $23,227
 Percentage of total net assets 8% 10% 10%
 Unit sales 43,753 -4% 45,59 -17% 54,856
 Mac 2017 Change 2016 Change 2015
 Net Sales $25,850 13% $22,831 -10% $25,471
 Percentage of total net sales 11% 11% 11%
 Unit sales 19,251 4% 18,484 -10% 20,587
 Services 2017 Change 2016 Change 2015
 Net sales $29,980 23% $24,348 22% $19,909
 Percentage of total net sales 13% 11% 9%

For the purpose of our analysis, we should mention that iPhone net sales increased
during 2017 compared to the previous year, due to higher iPhone unit sales and a
different mix of iPhones with higher average selling prices. The weakness in foreign
currencies relative to the U.S. dollar, though, had an unfavorable impact on iPhone
net sales during 2017 compared to 2016. iPhone net sales decreased during 2016
compared to 2015. The Company considered that as an outcome of a lower rate of
iPhone upgrades and challenging macroeconomic conditions in a number of major
markets in 2016. Average selling prices for iPhone were lower year-over-year during
2016 because of a different mix of iPhones, including the iPhone SE introduced in 2016
and the effect of weakness in most foreign currencies in comparison to the U.S. dollar.

As far as iPad’s net sales is concerned, they presented a decline during 2017 compared
to 2016 due to lower iPad unit sales and a different mix of iPads with lower average
selling prices. The weakness in foreign currencies relative to the U.S. dollar had a
negative impact on iPad net sales during 2017 compared to 2016. Also, iPad net sales
decreased during 2016 compared to 2015 primarily due to lower unit sales and the

 4
effect of weakness in most foreign currencies relative to the U.S. dollar, partially offset
by a higher average selling price due to a shift in mix to higher-priced iPads.

Net sales of Mac products presented an increase in 2017 compared to 2016 mainly
because there was a different mix of Macs with higher average selling prices and
higher Mac unit sales. Also, the weakness in foreign currencies relative to the U.S.
dollar had an unfavorable impact on Mac net sales during 2017 compared to 2016.
Mac net sales declined during 2016 compared to 2015 primarily due to lower year-
over-year Mac unit sales, which decreased at rates similar with the overall market.
The effect of weakness in most foreign currencies relative to the U.S. dollar also
negatively impacted Mac net sales.

What is more, Apple presented growth in the net sales of Services in each year,
primarily due to increases in App Store and licensing sales. Services net sales in the
fourth quarter of 2017 included a favorable one-time adjustment of $640 million due
to a change in estimate based on the availability of additional supporting information.
The year-over-year increase in Services net sales in 2016 was due primarily to growth
from the App Store, licensing and AppleCare sales, partially offset by the effect of
weakness in most foreign currencies relative to the U.S. dollar. During the first quarter
of 2016, the Company received $548 million from Samsung Electronics Co., Ltd.
related to its patent infringement lawsuit, which was recorded as licensing net sales
within Services.

1.2 Sector Analysis

1.2.1 SWOT Analysis
As far as the sector analysis is concerned, it is important that a definition of sector
analysis is given. Basically, it is a review and assessment of the current condition and
future prospects of a specified sector of the economy. In our case the sector under
scrutiny is the Computers/Consumer Electronics which belongs to the technology
industry. Sector analysis facilitates the investors as it provides them with an idea of
how well a given group of firms are expected to perform as a whole. The analysis will
be mainly held through a SWOT analysis, a presentation of the basic competitors and
some future prospects for the firm.

 5
To begin with, SWOT analysis is the acronym for Strength, Weaknesses, Opportunities
and Threats and is applied in the strategic planning of a firm. It is a method that
assesses those four elements and studies the firm on the whole. That is the
specification and identification of the internal and external factors of the company in
case it needs to make a decision regarding the goals that it has established. This is
quite crucial for the company because these SWOT elements can inform later steps in
planning to achieve the objectives.

Strengths and Weaknesses of the company arise from its internal operation, as well
as the management of its sources. It actually refers to some key characteristics of the
business that give it an advantage and a disadvantage over others. On the other hand,
opportunities and threats are related with the conformation of its external factors and
environment where it performs and is developed. Those factors should be defined and
adjusted to the firm because they are essential for the company’s growth.

To be more specific, Apple Inc. current success is linked to the ability of the company
to use its strengths to overcome weaknesses and threats and to exploit
opportunities. SWOT analysis, therefore, highlights the most significant strengths that
Apple can use to improve its position and financial performance, as well as the
weaknesses and threats that should be tackled through innovative strategies. Thus,
Apple’s SWOT analysis will be of practical use for investors and the company’s
managers, shareholders or other individuals.

Apple’s Strengths (Internal strategic elements)

This part of Apple’s SWOT analysis indicates the biggest strengths that make the
company withstand threats in its internal environment which are factors that decrease
its business performance. Apple’s most noteworthy strengths can be described below:

 • Strong brand name as it is one of the most prestigious and valuable brands in
 the world which means that it can introduce new profitable products in the
 market using the strong brand name that it possesses.
 • High profit margins. This strength arises from the premium pricing strategies
 for high-end products which are accompanied by high profit margins. This gives

 6
the company a high level of flexibility because it can adjust the prices ensuring
 a high profitability at the same time.
 • Effective innovation process. Apple has the capability to innovate using
 intensive growth strategies. Hence, the firm is up to date with the latest
 technologies and ensures a competitive advantage.

Having these aspects of SWOT analysis on mind, it comes as a rational conclusion that
it is difficult to compete with Apple’s strengths and thus Apple will continue to have a
leadership in the industry.

Apple’s Weaknesses (Internal strategic elements)

In this part of the SWOT analysis, the main focus is on the inadequacies or weaknesses
that reduce the firm’s growth. Some of the most notable are:

 • Limited distribution network. This weakness arises from Apple’s policy about
 exclusivity. There are specific authorized sellers that the company chooses to
 provide its products. In this case, such an exclusive strategy restricts the
 market reach.
 • High pricing. Furthermore, due to its higher pricing policy, Apple has the
 weakness of having most of its profits from the high-end market and wealthy
 customers.
 • Sales limited mainly to high-end market. This market includes only people from
 middle and higher classes, thus it excludes the financially weaker classes from
 purchases of its products which is one of the most significant drawbacks of the
 firm.

Opportunities for Apple Inc. (External Strategic Elements)

In this section, we indicate the most significant opportunities that Apple can reach. It
is well known that the strategic direction of businesses is affected by opportunities. In
Apple’s case the most important opportunities are the following:

 • Distribution network expansion. Apple has the opportunity to make its
 distribution network greater, since it prefers to have a restricted distribution
 network. At this part of SWOT analysis, the need of Apple to change its

 7
distribution strategy arises since using a different and more efficient network
 could be more useful in order to reach more customers in the global market.
 • Rising demand for tablets and smartphones. As we can notice from the annual
 report of Apple Inc., the revenues from sales coming from tablets and
 smartphones could be increased at a higher amount. In this case, the
 marketing department should promote more the product lines of new tablets
 and smartphones so that the consumers can become more familiar with these
 new commodities.
 • Creation of new product lines. Another notable opportunity that Apple meets
 is related to its product lines. These product lines are pretty successful, which
 gives Apple an adequate amount of time needed to implement new elements
 on new product lines. Through further innovation (like iWatch), Apple has the
 ability to launch new products to the global market and support its growth.

Threats Facing Apple Inc. (External Strategic Elements)

At this part of SWOT analysis, we detect the threats arising from various sources. If
threats are not eliminated or reduced, then the danger of decreased financial
performance of companies is growing. In Apple’s case, the following threats are
among the most significant:

 • Aggressive competition. In the technology industry tough competition is
 something anticipated because of the aggressiveness of the firms. Well-known
 companies like Samsung, LG and Google constitute this industry which uses
 rapid innovation technologies. Apple needs strong fundamentals in order to
 maintain its competitive advantage for the purpose of competing the
 aggressive behaviors.
 • Imitation. This threat is quite considerable, as many small-sized companies can
 attempt to imitate easily Apple’s product design and even the whole product.
 • Rising labor cost in countries where Apple plants are located. As it is already
 known, most of Apple’s products are designed in California and assembled in
 China. In some countries, like China, labor costs are constantly rising which can

 8
cause reduced profit margins or even push selling prices even higher, a
 negative repercussion for Apple’s customers.

Recommendations based on Apple’s SWOT Analysis.

Taken all this analysis under consideration, it is evident that the company possesses
considerable strengths that can be exploited in order to overcome its weaknesses. For
instance, it can expand its distribution network through the strengths that already has.
In addition, given the powerful brand name, superior design techniques and the rapid
innovation methods being used, can impact on Apple’s developing and launching new
product lines. Nevertheless, the firm addresses serious threats of aggressive
competition and imitation. One way to tackle this problem is to enhance its patent
portfolio along with continuous innovation so as to reserve the competitive advantage
even when the competition is tough.

1.3 Competition Analysis
Apple is considered as one of the most valuable and prestigious companies in the
global market. The markets for the firm’s products are excessively competitive in each
sector it operates and include rapid technology advances and product innovations. It
is important to mention that the competitors which sell mobile phones and computers
have decreased the prices and product margin in order to compete against Apple and
gain market share. These opponents in the industry are well funded and experienced
participants who aim to intensify the competition by introducing new products,
enhancing the design as well as the pricing of their products which is more affordable
than Apple. Below, some major data of Apple and its competitors are being presented.

 9
Net income Growth Comparison Y-Y
 20,00%
 12,15%
 10,00%

 0,00%

 -10,00%

 -20,00%

 -30,00%

 -40,00%

 -43,58%
 -50,00%

 Apple Competitors

Apple Inc net income grew by 12,15% in the 4th quarter of 2017, while most of its
competitors experienced a decline in their net income by 43,58%. Also, in terms of
profitability, Apple had a better financial performance than its competitors since in
the 4th quarter of 2017, revenues grew approximately by 12,69% year on year. This
growth was lower than the average revenue growth of the competition which was
around 34,48%.

 10
Revenue Growth Y/Y
40,00%
 34,48%
35,00%

30,00%

25,00%

20,00%

15,00% 12,69%

10,00%

 5,00%

 0,00%

 Apple Competitors

 Revenue Growth Q/Q
80,00%
 67,92%
70,00%

60,00%

50,00%

40,00% 33,88%
30,00%

20,00%

10,00%

 0,00%

 Apple Competitors

 11
Total Segment Market Share

 18%

 82%

 Company Competition

These measures consist the comparison between the performance of firms that report
and operate within the same industry. Apple managed to increase its market share
during the 4th quarter of 2017 due to a high increase in its revenues by 58,82%. From
this graph it is evident that Apple is the prevalent participant of the sector.

Source: https://dazeinfo.com/2017/05/01/worldwide-smartphone-shipments-q1-2017/

In the 1st quarter of 2017, according to a report by market research firm Gartner,
Samsung and Apple lost market share due to some Chinese firms like Huawei, Oppo

 12
and Vivo who managed to gain market share. While Samsung continued to have the
largest market share, it appears that it declined during the first quarter of 2017
compared to the previous year from 23.7% to 20.7%. Apple’s market share decreased
as well, from 14.8% to 13.7% primarily because of the flat sales in iPhones during the
quarter. While Samsung and Apple remained leaders in the sector, these Chinese
brands intensified the competition with their combined market share of 24% in 2017,
higher than the previous year. Market analysts point out that Chinese brands
managed to be competitive in the mobile sector through affordable prices, high
quality and innovative features that attract customers all over the world. Some
competitors that provide various products will be examined in more details in the
following section. Some of them might be:

1) Samsung

Samsung is one of the oldest technology companies and one of the major competitors
of Apple in products like smart phones, personal computers and gadgets in general.
Also, Samsung produces goods, like tablets and televisions, at a lower standard price
than that of Apple’s, iPads and Apple TVs. It is worth mentioning that electronic
devices of Samsung use Android operating systems, which are licensed by Google and
many competitors of Apple take advantage of this particular operating system in order
to weaken Apple’s market share.

2) PayPal

During the last three years, Apple also operates in the sector of online payment
business. In this particular sector PayPal is the leading company that offers online
payment services, with a value of 46 billion dollars approximately. Even though
Apple’s online payment service is quite decent, it is not still so much recognizable as
PayPal since it is only available in few nations. However, it is likely that Apple will see
further growth in the upcoming years as the online payment system has just started.

3) amazon.com

Amazon produces devices like Kindle fire, invading on Apple’s territory. Amazon’s
video streaming service competes with Apple’s iTunes with the logic outcome;

 13
Amazon stopped selling Apple TV and started producing their own brand of TV. But
Amazon didn’t stop there. It also intends to sell smartphone applications and it is likely
that Amazon will develop their own smartphone and enter dynamically into the
smartphone market, threating Apple’s dominance.

4) Dell

Dell is one of the most important computer company of 90’s and their current main
operation focuses on laptops which makes it a direct competitor of Apple’s Mac
computers. The company presents a significant advantage over the other PC
companies which is nothing else than the production of its own operating system -the
others are known as having bad operating systems- which actually threats Apple’s
market share.

5) Sony Mobile

Sony is one of the toughest competitors for Apple and its iPhones. Sony is a successful
brand which was the 4th largest producer of cell phones a few years ago. In our days,
Sony Xperia smartphone competes against iPhone and presents two major
advantages. Firstly, it is waterproof and secondly it is shock proof. However, Sony is in
a downward trajectory since their peak in 2007 but still, remains a major competitor
of Apple Inc.

6) Fitbit

Fitbit is a leading company in wearable technology and is known for electronic devices
which people use to exercise. This kind of technology existed even before Apple had
announced the release of iWatch. Fitbit in response to iWatch, produced a smart
watch of their own which is more affordable, giving the company a competitive
advantage over Apple. Wearable technology is still a new sector, and no one could
predict a winner yet.

7) Bose

In 2015, Apple purchased Beats electronics in a 3 billion-dollars deal and hence, it
automatically had to face a significant competitor in the sector of headphones. This
competitor is called Bose. In fact, the dispute between them is so intense that Bose

 14
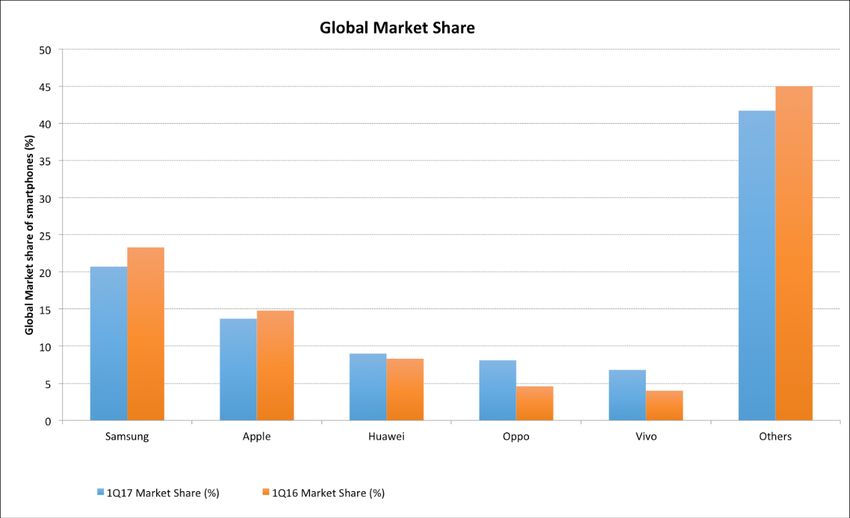
accused Apple of trespassing a kind of patent they held. Bose until now remains a
multi-billion-dollar corporation and a huge challenger for Apple.

8) Google

Google is an evident competitor to Apple in many ways. Firstly, the company develops
its own operating system, Android, which is in direct conflict to the operating system
of Apple iOS. In addition, Google distributes this operating system to other companies
that are related to smartphones like Samsung and LG. Google also competes Apple in
the sector of Media Player. Google Play is their own version of iTunes. Furthermore,
Google makes Apple a competitor through its online payment system with the main
battleground taking place to emerging markets like China and India.

9) Microsoft

Microsoft is a major competitor of Apple in the computer’s category. In spite the fact
that computers of Microsoft were not as well made as Apple’s, sales of Microsoft
computers outperform Apple’s sales in their own Macs, since they are much cheaper.
This changed when Apple moved to the production of smartphones and gained a
material advantage against Microsoft which already had its own brand of
smartphones.

2. Company Assessment
We will now present the five forces framework stated by Porter in order to be able to analyze
a bit further the competition in terms of profitability in the industry that Apple operates. Also,
a risk assessment later on is considered significant for our analysis.

2.1 Porter’s Five forces Analysis
 1. Rivalry among existing firms: high

In all markets that Apple operates competition is high. In desktop computing market,
the main competitors are PCs running Microsoft operating system such as Dell, Asus,
Hewlett Packard and Acer while in mobile computing industry are Google, Samsung
and Nokia. Also, the firm offers iOS which competes with Google’s Android one of the
most powerful operating systems globally which runs in most tablets and phones of
the competitors. Apple Pay lastly, competes with Paypal and Google. Other strong and

 15
aggressive competitors of Apple are LG, Samsung and Blackberry. Despite the fierce
competition, Apple remains a leader in consumer electronics and e-commerce
industry. As it is shown in the figure below, iPhone market share of new smartphone
sales has a steady percentage around 15% since its launch in the market.

 Figure 1 Apple iPhone’s market share of new smartphone sales worldwide from
 2007 to 2016, by quarter.2

 2. Bargaining power of buyers (customers): High

That is due to the great amount of choices that customers have as they are free to
change brand (low switching costs) so their satisfaction should be a priority to Apple
when developing strategies. Also, their purchase of products is relatively low
compared with the revenues of the firm.

 3. Bargaining power of suppliers: low

There are numerous suppliers for Apple’s components for its products all over the
world, thus the bargaining power of them is relatively low. In other words, suppliers
are not able to negotiate the prices with a firm like Apple and as a result they have to

2
 Statista (2017) Available at: https://www.statista.com/statistics/216459/global-
market-share-of-apple-iphone/
 16
accept the market price since generally there is a growing supply for most components
of its products.

 4. Threat of substitutes: low

Regarding the substitutes of Apple, it is believed that there are plenty of them but
without the same advanced characteristics as Apple. Hence, consumers do not prefer
the substitutes due to their restricted features and low performance. For example,
landline phones are a substitute of mobiles, but they are not so comfortable to use.
One could use digital cameras instead of iPhone apps for camera or use an alternative
music tool like CDs, DVDs and entertainment sources such as TV, Ps2 instead of game
apps. But this threat is negligible.

 5. Threat of new entrants: moderate

In order to set a new business in the industry of consumer goods and electronics and
compete against a multinational company like Apple, a high capital is required. Also,
the cost of developing a new brand against large and well-established companies like
Apple will be tremendous costly which makes it difficult for new firms to enter the
market. Nevertheless, there are strong companies that entered the market and
directly competed Apple with new products like Samsung and Google. As a result of
these moderate threats of new market participants, Apple needs to innovate and
invest in marketing so as to have the competitive advantage and remain powerful
against the competition.

2.2 Risk analysis
In this section, the business risk that Apple faces will be discussed a bit further. Some
key risk factors will be presented at this point. Firstly, the company’s operations and
performance are dependent on global and regional economic conditions that can
cause a material adverse effect in the demand for Apple’s products. These global and
regional economic conditions could be financial market volatility, high levels of
unemployment, or overall financial uncertainty and political instability that can affect
the anticipated profits of the firm. Another risk that Apple has to take under
consideration is the highly competitive environment where it operates and the
constant need of innovative and new products, services and technologies to the

 17
market. However, the Company believes that it has to offer unique products in terms
of design and the fact that it manufactures nearly everything that is suitable for its
products such as the hardware, the operating system, various software applications
and related services makes them optimistic about the future. It also holds various
patents and copyrights thus the competitive advantage is upon its willing to keep
investing in R&D.

Apple’s risk profile attempts to define how a willingness to tolerate risk or be risk
averse will affect the overall decision-making strategy. It is basically an evaluation of
the potential risks that a company may confront.3 Issues of volatility, economic
exposure through foreign currency are crucial for our analysis. Foreign currency risk
exists because of the transactions of Apple with currencies other than US dollars. The
company is a net receiver of foreign currencies. Thus, changes in exchange rates and
more specifically a stronger U.S. dollar will cause a negative effect in the net sales and
gross margins which are expressed in terms of U.S. dollars. The risk lies in the fact that
the company may need to adjust its local prices in order to be competitive in the
market.

What may be essential in this analysis is the acknowledgement that Apple is subject
to risks of international operations as they are the main source of its revenues and
earnings. There is a need of compliance with existing U.S. laws and regulations such
as import and exports requirements, anti-corruption laws, tax laws, environmental
laws, labor laws and anti-competition regulations. Violations on these laws could
negatively impact on company’s brand, growth and profitability. Another potential
risk could exist due to a change in tax rates in the US and many foreign jurisdictions,
including Ireland where many Apple’s subsidiaries are concentrated. The company’s
effective tax rates could be altered by changes in earnings in countries with different
legal tax rates.

2.3 Ratio Analysis
A ratio analysis is a quantitative analysis of information contained in a company’s
financial statements. It is used to evaluate various aspects of a company’s operating

3
 https://www.investopedia.com/terms/r/risk-profile.asp

 18
and financial performance such as its efficiency, liquidity, profitability and solvency.
Investors and analysts usually talk about fundamental or quantitative analysis,
referring to the ratio analysis. It involves evaluating the performance and financial
health of a company by using data from the current and historical financial
statements. The data retrieved from the financial statements are used to compare a
company's performance over time and is a way of assessment of whether the
company is improving or deteriorating. It can also be used by practitioners and
analysts to compare a company's financial standing with the industry average or to
compare a company to other companies operating in its sector to see how the
company stacks up.

2.3.1 Liquidity and Solvency Analysis
In terms of liquidity some key metrics are the liquidity ratios. They measure a
company's ability to pay off its short-term debt as it comes due using the company's
current or quick assets. This type of ratios, include current, quick and working capital
ratio.

Table 5: Liquidity Ratios, Source: Bloomberg

 2017 2016 2015 2014 2013
 Current Ratio 1.28 1.35 1.11 1.08 1.68
 Quick Ratio 0.91 1.05 0.73 0.67 1.23
 Cash Ratio 0.74 0.85 0.52 0.40 0.93

 19
Current Ratio
 2,5

 2

 1,5

 1

 0,5

 0
 2017 2016 2015 2014 2013

 Apple Sector (Technology Hardware & Equipment) Industry (Technology)

Current Ratio is a liquidity ratio that measures a company’s ability to pay short-term
and long-term obligations. A ratio over one, indicates that a company’s assets are
greater than its liabilities, which means that the company is able to pay off its debt
obligations. The higher the current ratio the more capable is the company to pay off
its obligations. In Apple’s case, a peak is observed in 2016 and the lowest price in 2014.
It is also clear that in all years under scrutiny, Apple’s Current Ratio is lower than that
of the sector and the industry except for year 2016, which means that in general,
Apple’s competitors have better capability to pay off their debt obligations. In
addition, there’s not a fixed trend for the values of this ratio, but the decline in last
year can be attributed to the fact that the increase in current liabilities is higher than
the corresponding increase in current assets for 2017. More specifically, the increase
in current liabilities is 21.808 billion dollars while the increase in current assets is
21.776 billion dollars. Current liabilities were probably increased due to the raise in
Accounts Payable and Commercial paper.

 20
Quick Ratio
 2,5

 2

 1,5

 1

 0,5

 0
 2017 2016 2015 2014 2013

 Apple Sector (Technology Hardware & Equipment) Industry (Technology)

Quick Ratio is an indicator of a company’s short-term liquidity and measures a firm’s
ability to meet its short-term obligations with its most liquid assets. Inventories are
excluded from the calculation because they’re not used as current assets. The quick
ratio measures the dollar amount of liquid assets available for each dollar of current
liabilities. A quick ratio that has a price lower than one, shows a company heavily
dependent on inventory or other assets to pay off its short-term liabilities. As it can
be observed from the above table, that’s the case with Apple in two consecutive years,
(2014 and 2015), with a price of 0.64 and 0.73 respectively and 0.91 in 2017. A quick
ratio over one, on the other hand, indicates that the company is relying less on
inventory or any other non-quick assets to pay off its debt. Apple’s quick ratio is over
one in years 2013 and 2016 which was a good sign of liquidity for the firm. It is worth
mentioning that Apple’s quick ratio decreased in 2017. This can be explained through
some balance sheet figures such as the inventory and the current liabilities.
Inventories have largely increased since 2016 and there was also a rise in the current
liabilities.

 21
Cash Ratio
 1,8
 1,6
 1,4
 1,2
 1
 0,8
 0,6
 0,4
 0,2
 0
 2017 2016 2015 2014 2013

 Apple Sector ( Technology Hardware & Equipment) Industry (Technology)

Cash Ratio is ratio of a company’s total cash and cash equivalents to its current
liabilities. This ratio is used to calculate a company’s ability to repay its short-term
debt. The cash ratio excludes some assets, like accounts receivable, from the
company’s ability to cover its liabilities. It is basically a more conservative liquidity
ratio and contains information about the firm in case it forced to pay all the current
liabilities without selling or liquidating other assets. Apple has a quick ratio under one
in all years under scrutiny. This means that there are more current liabilities, than cash
and cash equivalents, thus in this condition there is a cash insufficiency to pay off the
short-term debt. In addition, the competitors of Apple in general have cash ratio
higher than Apple’s and most of the years, higher than one. But maybe Apple has a
specific strategy of holding low cash reserves and maybe invest more its money than
retain them as reserves and also have higher amount of current liabilities. To support
this point, a slight decrease in the amount of “Cash and cash equivalents” in the
balance sheet explains this lower cash ratio.

Solvency Ratios:

Solvency ratios are used to measure an enterprise’s ability to meet its debt and other
obligations. The solvency ratio indicates whether a company’s cash flow is sufficient
to meet its short-term and long-term liabilities. The lower a company’s solvency ratio,
the greater the probability that it will default on its debt obligations. Some other

 22
solvency ratios are debt to equity, total debt to total assets and interest coverage
ratio.

Table 6: Solvency Ratios, Source: Bloomberg

 Apple Inc. 2017 2016 2015 2014 2013
 Total Debt to 86.3% 68% 54% 31.7% 13.7%
 Common Equity
 Total Debt to Total 30.8% 27% 22.1% 15.2% 8.1%
 Assets
 Interest Coverage 26.41 41.23 97.18 136.73 360.29

 Debt to Equity Ratio
 100,00%
 90,00%
 80,00%
 70,00%
 60,00%
 50,00%
 40,00%
 30,00%
 20,00%
 10,00%
 0,00%
 2017 2016 2015 2014 2013

 Apple Sector (Technology Hardware & Equipment) Industry (Technology)

Debt to Equity (D/E) is calculated by dividing a company’s total liabilities by its
stockholder’s equity. D/E is a debt ratio which indicates how much debt a company is
using to finance its assets relative to the value of the shareholder’s equity. In other
words, it basically indicates the capital structure of the firm. A high D/E ratio generally
means that a company has been aggressive in financing its growth with debt.
Aggressive leveraging practices are often associated with prominent levels of risk. This
may result in volatile earnings as a result of the additional interest expense. Analyzing
Apple, in the period under scrutiny (2013-2017), we observe that D/E ratio is lower,
relatively to shareholders’ equity, lower than 90% in 2017 and under 70% rest of the
period. The lowest price is in 2013 (13.7%) and since then, it increases with almost
constant rate. The interpretation of D/E ratio is that Apple does not rely so much to

 23
external funding for the expansion of its operations. On the other hand, the
competitors of Apple in general, use less debt to finance their operations than Apple
does, apart from 2013. During these five years D/E ratio continuously increases. This
happens because total shareholder’s equity is not constant every year, while Apple
issues more debt every year in order to expand its operations.

 Total Debt to Total Assets
 40,00%

 35,00%

 30,00%

 25,00%

 20,00%

 15,00%

 10,00%

 5,00%

 0,00%
 2017 2016 2015 2014 2013

 Apple Sector (Technololy Hardware & Equipment) Industry (Technology)

Total Debt to Total Assets is a leverage ratio that defines the total amount of debt
relative to the assets. The higher the D/A ratio, the higher the degree of leverage and
consequently the financial risk. This is a broad ratio that includes long and short-term
(borrowing maturity one year) debt, as well as assets – tangible and intangible. In case
of Apple, D/A ratio has the lowest price in 2013 (8.1%) and since then, it increases
constantly, until 2017 (30.8%). In other words, Apple financed 8.1% of its assets by
debt in 2013 and after 4 years 30.8% of its assets are financed by debt. Apple’s
competitors in the same period, in general, used more debt to finance their
operations. The constant increase in D/A ratio can be attributed to various indicators
like short-term debt, long-term debt and total assets. Total assets increase each year
but as we mentioned before, Apple issues more debt every year, leveraging its
position, so as to expand its operations and production.

 24
Interest Coverage
 400

 350

 300

 250

 200

 150

 100

 50

 0
 2017 2016 2015 201 2013

 Apple Sector (Technology Hardware & Equipment) Industry ( Technology)

Interest Coverage Ratio is a debt and profitability ratio used to determine how easily
a company can pay interest on its outstanding debt. The interest coverage ratio
measures how many times over, a company could pay its current interest payment
with its available earnings. Interest Coverage ratio shows the ability of a company to
meet its obligations. It is an aspect of a company’s solvency and thus a highly
important factor in shareholders’ returns. In Apple’s case, there is a peak in 2013
(360.29) and in the following years an exponentially decline is observed, until 2017
(26.41) which means, that since Apple increased the borrowing funds in those years,
the interest payments have been increased as well. Apple’s competitors, in general,
have an interest coverage ratio lower than Apple’s, in all years under scrutiny, which
means, that they have reduced their capability to pay off their interest payments by
using only their earnings. From year 2013 until 2017, the interest coverage ratio shows
a quite significant decline, which can be explained by the consolidated statements of
operations of Apple. More specifically, Apple’s EBIT were lower every year, except for
2017, where EBIT figure is almost at the same level as it was in 2016, but the interest
payments that Apple completes are increasing exponentially every year.

2.4 Efficiency Analysis
Table 7: Efficiency Ratios, Source: Based on data from Apple Inc. Annual Reports & Bloomberg

 Apple Inc., efficiency ratios 2017 2016 2015 2014 2013
 Inventory turnover (days) 40.37 58.64 62.82 57.94 83.45

 25
Receivables turnover (days) 13.63 13.23 13.62 11.96 14.22
 Payables turnover (days) 3.33 3.60 4.27 4.28 4.94
 Working capital turnover (times) 8.24 7.74 26.66 35.96 5.77
 Operating Cycle (days) 41 33 32 42 34
 Cash conversion cycle (days) -86 -71 -60 -56 -41
 Total asset turnover (times) 0.66 0.7 0.89 0.83 0.89

 Inventory Turnover
 90
 80
 70
 60
 50
 40
 30
 20
 10
 0
 2017 2016 2015 2014 2013

 Apple Sector (Technology Hardware & Equipment) Industry (Technology)

(For year 2017 there are not available data about the sector & industry)

Inventory turnover is a ratio which is used to measure how many times a company’s
inventory is sold and replaced over a period of time. Using the inventory turnover
ratio, we can see how fast a company is selling its inventory and is generally compared
against industry averages. Particularly, Apple has an inventory turnover ratio which
constantly declines in all years under scrutiny (2013-2017). However, Apple’s
competitors have an inventory turnover ratio, which remains much lower than
Apple’s. In other words, Apple is more capable to sell and replace its inventory for a
given period of time.

 26
Receivables Turnover
 16

 14

 12

 10

 8

 6

 4

 2

 0
 2017 2016 2015 2014 2013

 Apple Sector (Technology Hardware & Equipment) Industry (Technology)

(For year 2017 there are not available data about the sector & industry)

Receivables turnover is a ratio which quantifies a firm’s policy in extending credit and
collecting debts on that credit. In other words, it shows how efficient is a company in
collecting the credit that issues to customers. The lower amount of the ratio, the
better for the company, since its collecting money faster. In Apple’s case, receivables
turnover ratio remains almost constant in all years under scrutiny (2013-2017), but is
higher in all years, relatively to its competitors, which means that the competitors
have a tighter policy about their credit and so, they collect money faster than Apple.

 27
Payables Turnover
 7

 6

 5

 4

 3

 2

 1

 0
 2017 2016 2015 2014 2013

 Apple Sector (Technology Hardware & Equipment) Industry (Technology)

(For year 2017 there are not available data about the sector & industry)

The payable turnover ratio is a short-term liquidity measure which is used to show the
rate at which a company pays its debt to its suppliers or generally its short-term
obligations. The payables turnover exhibits the time-period that the company uses to
pay off its short-term debt or obligations. In Apple, with respect to the payable
turnover ratio, we observe a consistent decline in all years under analysis. This means
that Apple pays off its short-term obligations faster than any other company within
the same industry or sector in general (less days).

 28
Working Capital Turnover
 40

 35

 30

 25

 20

 15

 10

 5

 0
 2017 2016 2015 2014 2013

 Apple Sector (Technology Hardware & Equipment) Industry (Technology)

(For the year 2017 there are not available date about the sector & industry)

The Working Capital Turnover Ratio is a metric of the efficiency of a firm to use its
working capital to create revenues. Generally, it is used to show the relationship
between the money that support operations and the revenues that are generated
from these operations. As we can notice from the diagram above, Apple’s working
capital turnover is relatively low in years 2013, 2016 and 2017 and shows two peaks
in 2014 and 2015. However, it is higher than any other company’s working capital
turnover ratio in all years that we examine, which means that Apple is using better its
short-term assets and liabilities to support sales better than any other company in the
sector and industry.

 29
Operating Cycle
 80

 70

 60

 50

 40

 30

 20

 10

 0
 2017 2016 2015 2014 2013

 Apple Sector (Technology Hardware & Equipment) Industry (Technology)

(For year 2017 there are no available data about the sector & industry)

The Operating Cycle Ratio gives us information on how well a company is managing
its operational capital assets. In order to calculate this ratio, we used three
components (receivables, inventory and payables). In general, a shorter price of this
ratio is better, but not always. The formula of the Operating Cycle Ratio is: Operating
Cycle (days)= DIO + DSO – DPO, where DIO = Days Inventory Outstanding, DSO = Days
Sales Outstanding and DPO = Days Payable Outstanding. However, we can have a
general perspective that since Apple has a lower operating cycle ratio than any other
company in all years (2013-2017), it also has the capability to handle better these
three components and consequently Apple manages its operational capital assets
more efficiently.

 30
Cash Conversion Cycle
 20

 0
 2017 2016 2015 2014 2013
 -20

 -40

 -60

 -80

 -100

 Apple Sector (Technology Hardware & Equipment) Industry (Technology)

(For year 2017 there are no available data about the sector & industry)

The Cash Conversion Cycle Ratio shows the length of time that a company needs to
convert resources into cash flows. In other words, it is the amount of time (in days)
which is needed for the money related to the production and sales process, before
they are converted into cash through customer’s sales. The mathematic formula for
this particular ratio is: CCC = DIO + DSO – DPO, where DIO = days inventory
outstanding, DSO = days sales outstanding, DPO = days payable outstanding. A low
cash conversion cycle signifies a well-managed company. Apple Inc. presents a cash
conversion cycle which is constantly increasing in absolute value since the CCC is
negative, in all years under scrutiny (2013-2017). A negative cash conversion cycle
indicates that Apple doesn’t have to pay for its inventory or materials used for the
production until, after has sold the final product associated with them. As we notice
from the diagram above, Apple’s cash conversion cycle is the most negative than any
other company in the sector and as a result Apple’s management uses more efficient
methods to convert expenses into revenues.

 31
Asset Turnover
 1
 0,9
 0,8
 0,7
 0,6
 0,5
 0,4
 0,3
 0,2
 0,1
 0
 2017 2016 2015 2014 2013

 Apple Sector (Technology Hardware & Equipment) Industry (Technology)

The Asset Turnover Ratio is used to measure the value of a company’s generated sales
relative to the value of its assets. In other words, it shows how efficiently a company
uses its total assets to support its sales. In general, the higher the Asset Turnover Ratio
the better the company’s performance is as a higher ratio is due to high revenues per
dollar of assets. As we can notice from the above graph, Apple has higher asset
turnover ratio in all years under scrutiny (2013-2017), compared to any other
company in general, which means that Apple is more capable to use its assets to
support sales than any other company in the same sector. However, the other
companies perform just as well in terms of efficiency, meaning that they also use
efficiently their assets to support revenues.

 32
2.5 Profitability Analysis
Profitability ratios measure a company’s ability to generate earnings from its
resources (assets) during a period of time. Some notable profitability ratios are the
profit margin, return on assets (ROA) and return on equity (ROE).

Table 8: Profitability Ratios, Source: Bloomberg

 Apple Inc., profitability ratios
 Return on Sales 2017 2016 2015 2014 2013
 Gross profit margin 38.47% 39.08% 40.06% 38.59% 37.62%
 Operating profit margin 26.76% 27.84% 30.48% 28.72% 28.67%
 Net profit margin 21.09% 21.19% 22.85% 21.61% 21.67%
 Return on Investment 2017 2016 2015 2014 2013
 Return on equity (ROE) 36.87% 36.90% 46.25% 33.61% 30.64%
 Return on assets (ROA) 13.87% 14.93% 20.45% 18.01% 19.34%

To begin with the profitability analysis and interpretation of the performance of the
company, a definition of some basic ratios is highly important. Gross profit margin is
used to evaluate a firm’s financial health by indicating the percentage of remaining
money over revenues after the subtraction of cost of goods sold. That is the division
of gross profit over the revenues. Apple Inc. gross margin percentage decreased in
2017 compared to 2016 due primarily to higher product costs. During 2013 to 2016
there is an increase in gross profit margin mainly because of a shift in mix to services
and an overall increase in product volumes.

Regarding the operating margin, it is a ratio of operating income (which is given by
deducting operating expenses from gross profit) over revenues and indicates the
proportion of a company’s remaining revenues after covering various costs and
expenses. Operating profit margin gives analysts an idea of how much a company
makes (before interest and taxes) on each dollar of sales. In Apple’s case the operating
margin is relatively low over the years under analysis because it invests a large amount
of money in R&D. More specifically, there was a growth in R&D expense in years 2015
to 2016 and 2016 to 2017 because the company believes that focused investments in
R&D are critical to its growth and competitive position in the markets. Also, some
other operating expenses such as infrastructure-related costs and selling costs caused
the operating income to reduce. Thus, as the operating income decreased, there was

 33
You can also read