Equity Valuation - Hermès International SCA - Universidade ...
←
→
Page content transcription
If your browser does not render page correctly, please read the page content below

Equity Valuation – Hermès International SCA

 Joana Maria Araújo Simões Marçal Gabirra

 Supervisor: José Carlos Tudela Martins

 International MSc in Management

Dissertation submitted in partial fulfilment of requirements for the degree International MSc
 in Management at the Universidade Católica Portuguesa, 30th December 2016
Abstract

In this dissertation, a valuation of Hermès International is performed. Hermès is an apparel and
accessories company, present in the luxury goods industry. Four methods were applied –
Discounted Cash Flows using WACC, Dividend Discount Model, Economic Value Added and
a Relative Valuation – after which, a sensitivity analysis was performed. As a result of the
Discounted Cash Flows approach, a share price of 413,58€ was reached, whereas with Dividend
Discount Model and Economic Value Added the share prices were 185,65€ and 344,21€,
respectively. Accordingly, a Market-Perform recommendation was given. The Relative
valuation is considered only as a validation tool, thus, there is no recommendation based on its
results. To conclude, a comparison between the dissertation’s values and Bernstein’s report of
September 15th 2016 was made, stressing the major differences between both.

 2
Resumo

Nesta dissertação é apresentada a avaliação da Hermès International. A Hermès é uma empresa
de vestuário e acessórios, presente na indústria de bens de luxo. Quatro métodos de avaliação
foram usados – Fluxos de Caixa Descontados usando o custo médio ponderado do capital,
Desconto de Dividendos, Valor Económico Acrescentado, e uma Avaliação Relativa – depois
das quais, uma análise de sensibilidade foi realizada. Como resultado do método de Fluxos de
Caixa Descontados, um preço de 413,58€ por ação foi alcançado, enquanto com o Desconto de
Dividendos e Valor Económico Acrescentado foram alcançados preços por ação de 185,65€ e
344,21€, respetivamente. De acordo com os resultados, a recomendação de manter aplica-se. A
Avaliação Relativa foi considerada somente como uma ferramenta de validação, portanto
nenhuma recomendação advém dos resultados obtidos por este método. Em jeito de conclusão,
foi feita uma comparação dos resultados obtidos nesta dissertação com os do relatório da
Bernstein de 15 de Setembro de 2016, realçando as diferenças entre os dois.

 3
Acknowledgements

The support of several people was crucial to the successful development of not only this
dissertation, but of my entire Master Program.

First, I want to thank all my family, for the support and motivation they always gave me in
successfully completing my studies.

Secondly, I want to thank my supervisor, Professor José Carlos Tudela Martins, for his
availability and all the valuable insights during this process.

Thirdly, I want to thank Francisco Seixas, Rita Sequeira, Inês Matos, Bárbara Cardoso and
Beatriz Gonçalves, for all the support and help in the most challenging moments. I also want to
thank to Paulo Matos Mateiro, for all the discussions and valuable insights that were crucial for
the completion of this dissertation.

Additionally, I want to thank to my friends Inês Serra, Pedro Ferraz, João Antunes Gonçalves,
João Canedo, Patricia Assunção, Fabio Giacomo, Alexandre Lancastre, Catarina Ponte de
Lima, Francisco Rodrigues, Beatriz Barreiros Cardoso, Francisca Empis and Margarida Rosado
Pereira for all the help and support during these last two years, always challenging me and
making me a better student and friend.

 4
List of abbreviations

 APV Adjusted Present Value
 CAGR Compounded Annual Growth Rate
 CAPEX Capital Expenditure
 CAPM Capital Asset Pricing Model
 D&A Depreciation and Amortization
 DCF Discounted Cash Flows
 DDM Dividend Discount Model
 EBIT Earnings Before Interest and Taxes
 EBITDA Earnings Before Interest, Taxes, Depreciation and Amortization
 EV Enterprise Value
 EVA Economic Value Added
 FCFE Free Cash Flows to Equity
 FCFF Free Cash Flows to the Firm
 GDP Gross Domestic Product
 PER Price/Earnings
 ROE Return on Equity
 ROIC Return On Invested Capital
 WACC Weighted Average Cost of Capital
 WC Working Capital

 5
Index

1. Introduction ................................................................................................................................... 9
2. Literature review ......................................................................................................................... 10
 2.1 Valuation approaches................................................................................................................ 10
 2.2 Discounted Cash Flows ............................................................................................................. 10
 2.2.1. Cash Flows ..................................................................................................................... 11
 2.2.2. Discount rates ................................................................................................................ 12
 2.2.2.1. Weighted Average Cost of Capital ........................................................................ 12
 2.2.2.2. Cost of Equity ......................................................................................................... 13
 2.2.2.2.1. Capital Asset Pricing Model .............................................................................. 13
 2.2.2.2.2. Fama French Three Factor Model ..................................................................... 16
 2.2.2.2.3. Arbitrage Pricing Theory................................................................................... 17
 2.2.2.3. Cost of Debt ............................................................................................................. 17
 2.2.3 Time Frame ..................................................................................................................... 17
 2.2.4 Terminal Value ............................................................................................................... 18
 2.2.5 Growth rate ..................................................................................................................... 19
 2.2.6 Adjusted Present Value.................................................................................................. 19
 2.2.7. Dividend Discount Model ............................................................................................. 20
 2.2.8. Economic Value Added ................................................................................................. 21
 2.3. Relative Valuation .................................................................................................................... 21
 2.4. The case of Hermès International ........................................................................................... 23
3. Industry Overview........................................................................................................................... 24
 3.1 Luxury Goods Industry ............................................................................................................ 24
 3.2 Drivers for growth ..................................................................................................................... 25
 3.3 Geographic analysis .................................................................................................................. 26
 3.4 Future of the Industry............................................................................................................... 29
4. Company Overview ......................................................................................................................... 31
 4.1 History ........................................................................................................................................ 31
 4.2 Products Offered ....................................................................................................................... 31
 4.3 Shareholders’ structure ............................................................................................................ 32
 4.4. Financial Analysis..................................................................................................................... 33
5. Company Valuation ........................................................................................................................ 40
 5.1 Explicit period and Terminal Growth Rate ............................................................................ 40
 5.2. Stores growth ............................................................................................................................ 40
 5.3. Operational Forecasts .............................................................................................................. 41
 5.3.1. Sales .................................................................................................................................... 41
 5.3.2. Operating expenses.............................................................................................................. 43

 6
5.3.3. Operating Margin ................................................................................................................ 44
 5.3.4. Capital Expenditures and D&A ........................................................................................... 44
 5.3.5. Working Capital .................................................................................................................. 45
 5.3.6. Dividends............................................................................................................................. 45
 5.3.7. Net Financial Income .......................................................................................................... 46
 5.4. Discounted Cash Flows Valuation .......................................................................................... 46
 5.4.1. Cost of Capital ..................................................................................................................... 46
 5.4.2. Free Cash Flows to the Firm ............................................................................................... 48
 5.4.3. Dividend Discount Model ................................................................................................... 50
 5.4.4. Economic Value Added....................................................................................................... 50
 5.5. Relative Valuation .................................................................................................................... 51
 5.6. Sensitivity Analysis ................................................................................................................... 53
 5.7. Recommendations .................................................................................................................... 54
6. Equity Research Comparison......................................................................................................... 55
7. Conclusion ........................................................................................................................................ 57
8. Appendixes ....................................................................................................................................... 58
9. Bibliography .................................................................................................................................... 77

 7
Index of Graphs

Graph 1: Share of Global Revenue across the different distribution channels. Source: Goldman Sachs
Equity Research 2015............................................................................................................................ 26
Graph 2: Consumption in Luxury Goods by country in 2015. Source: Bain&Co 2015 ....................... 27
Graph 3: Luxury Goods Sales by Region 2015-2020. Source: Bain&Co, 2015 ................................... 30
Graph 4: Hermès Stock Performance 2011-2016. Source: Reuters ...................................................... 33
Graph 5: Revenue and EBITDA margin 2011-2015. Source: Annual reports ...................................... 34
Graph 6: Revenues breakdown by geography 2012-2015. Source: Annual reports.............................. 35
Graph 7: Breakdown of operating expenses 2011-2015. Source: Annual reports ................................ 36
Graph 8: Capital expenditure and D&A 2011-2015. Source: Annual reports....................................... 36
Graph 9: Net Debt 2011-2015. Source: Annual reports ........................................................................ 37
Graph 10: Working Capital 2011-2015. Source: Annual reports and own Calculations. ..................... 38
Graph 11: Operating expenses. Source: Own calculations.................................................................... 43
Graph 12: Capital Expenditure and D&A 2011-2026. Source: Annual Reports and Own calculations 44

Index of Tables

Table 1: Methods of valuing a company. Source: Fernandéz (2007) .................................................... 10
Table 2: Hermès Competitors. Source: Reuters. Extracted at 16/11/2016 ............................................ 39
Table 3: Revenues growth 2011-2015. Source: Annual reports............................................................ 40
Table 4: Number of stores forecast 2016-2026. Source: Own calculations .......................................... 41
Table 5: Revenue breakdown by region 2011-2016. Source: Annual reports....................................... 42
Table 6: Hermès and Gucci market share 2011-2015. Source: Barclays (2016)................................... 42
Table 7: Breakdown of sales growth forecast 2016-2026. Source: Own calculations, OECD data...... 43
Table 8: EBITDA Margin 2016-2026. Source: Own calculations ........................................................ 44
Table 9: Working capital 2016-2026. Source: Own calculations.......................................................... 45
Table 10: Net Financial Income Calculation. Source: Own calculations .............................................. 46
Table 11: Beta calculation: Bottom-up approach. Source: Reuters and own calculations .................... 47
Table 12: Levered cost of equity calculation. Source: Own calculations.............................................. 47
Table 13: WACC Calculation. Source: Own calculations .................................................................... 48
Table 14: FCFF Calculation 2016-2026. Millions of Euros. Source: Own Calculations ...................... 48
Table 15: Output of FCFF Valuation. Source: Own calculations ......................................................... 49
Table 16: Output of DDM Valuation. Source: Own calculations ......................................................... 50
Table 17: Output of EVA valuation. Source: Own calculations ........................................................... 51
Table 18: Peer group analysis. Source: Reuters .................................................................................... 52
Table 19: Multiples. Source: Reuters .................................................................................................... 52
Table 20: Multiples’ calculation. Source: Own calculations ................................................................. 53
Table 21: Sensitivity Analysis with WACC and growth rate. Source: Own calculations ..................... 53
Table 22: Sensitivity Analysis. Source: Own calculations .................................................................... 54
Table 23: Comparison with equity research report. Source: Bernstein report 15/09/2016 ................... 55

 8
1. Introduction

The recent financial crisis has changed the consumer behaviors, being a challenge for
companies to overcome this shift.

Especially in the Apparel and Accessories sector, consumers are more focused on lower prices,
even in the Luxury Goods industry. They still want high-value products, but are more attentive
to prices. Additionally, the idea of a world with traveled consumers, always connected to each
other due to new technologies, is also an interesting challenge for Hermès

Here lies the interest in valuing Hermès International, to understand how the company has
adapted its products to the new consumer demand.

This dissertation is structured as follows: the first chapter is the “state of the art”, with
descriptions of the models presented through different authors’ perspectives. Secondly, a
Luxury Goods Industry overview; thirdly, a company overview, where the past financial
performance is presented; fourthly, the company valuation, based on own assumptions and
forecasts, including a sensitivity analysis; and lastly, a comparison with a report of an equity
research company, were the main differences are highlighted.

 9
2. Literature review

 2.1 Valuation approaches

 A valuation can be used for several purposes: either buying/selling operations, mergers or
 acquisitions or simply to know how much the company is worth. In listed companies, valuation
 is typically performed to relate the value one obtains, to the value of the stock in the market and
 therefore make a decision to buy, sell or hold the shares. (Fernandéz, 2007)

 Additionally, according to Fernandéz (2007), the methods for valuing a company can be
 classified in six groups:

Balance Sheet Income Mixed Cash Flow Value Options
 Statement (Goodwill) Discounting Creation
Book Value Multiples Classic Equity cash EVA Black and
Adjusted Book Price/Earnings Union of flow Economic Scholes
Value Sales European Dividends Profit Investment
Liquidation P/EBITDA Accounting Free Cash Cash Value Option
value Other experts Flow Added Expand the
Substantial multiples Abbreviated Capital Cash CFROI project
value Income Flow Delay the
 Others Adjusted investment
 Present Value Alternative use
 Table 1: Methods of valuing a company. Source: Fernandéz (2007)

 In the sections below, one will describe the most common approaches used in equity valuation:
 the Discounted Cash Flows, Adjusted Present Value, Dividend Discount Model, Economic
 Value Added and the Relative Valuation technique.

 2.2 Discounted Cash Flows

 The Discounted Cash Flows Valuation is the basis on which several valuation methods are built
 on. It expresses the value of an asset as a function of the future cash flows it is predicted to
 generate, discounted at a rate that reproduces the riskiness of the cash flows. The value of the
 asset does not depend on someone’s perception but it depends on cash flow forecasts. Thus,
 one will have higher valuations on assets with higher or more foreseeable cash flows than on
 assets with lower or unpredictable cash flow forecasts (Damodaran, 2006).

 10
Fernandéz (2007) states that the company is viewed as a “cash flow generator” and therefore,
its value is achieved by discounting the forecasted cash flows at an appropriate discount rate.
This cash flow forecast is based on a complete analysis of the financial statements of the
company, along with a close look at the environment surrounding the company so that one can
estimate company’s operations reliably, such as for example, sales, cost of goods sold,
administrative expenses.

In the following chapters will be presented the phases to estimate the discounted cash flows and
examine in detail the three methods deriving from this concept: Discounted Cash Flows using
Weighted Average Cost of Capital, Adjusted Present Value (APV), Dividend Discount Model
(DDM) and Economic Value Added (EVA).

2.2.1. Cash Flows
According to Damodaran (2006) estimating the cash flows has to do with the intrinsic value of
the assets. It is the value of an asset, calculated by an analyst who possesses all the knowledge
and information needed, and a perfect valuation model. Thus, one has two ways of estimating
cash flows, one is valuing the entire business and the other is to value the equity portion of the
business.

In the first method, valuing the entire business, one uses the assets’ cash flows before debt
payments but after the reinvestment needed; the discount rate used is the cost of capital, as it
reflects the cost of financing with both equity and debt, taking into account the proportions of
their use.

These cash flows are called Free Cash Flows to the Firm (FCFF) and the discount rate used is
the Weighted Average Cost of Capital (WACC). These Free Cash Flows to the Firm are also
the after tax cash flows from operations, or the money that the company have left after the
required investments and working capital. (Damodaran 2006 and Fernandéz 2007). This
valuation method will, from now on, be called DCF.

 = × 1 − + −
 ∆ − (1)

 11
The value of the business can, therefore, be written as:

 =∞
 = =1 (1+ ) (2)

The second method of measuring cash flows is to value just the equity portion of the business,
which means that one considers cash flow from assets, after debt repayments and after the
reinvestment needed; the discount rate to use, on the other hand, is the cost of equity (re), as it
reflects just the cost of equity financing. These cash flows are called Free Cash Flows to the
Equity (FCFE).

 = − × 1 − + ∆ (3)

The Equity Value could, therefore, be written as:

 =∞
 = =1 (1+ ) (4)

If the assumptions and calculations are made in an accurate way, the equity value should be the
same either valuing the entire business and then subtracting the non-equity claims or by valuing
directly the equity (Damodaran, 2006).

2.2.2. Discount rates
As Fernandéz (2007) states, an appropriate discount rate is the one who reflects the risk
associated with the forecasted cash flows. Calculating this rate is probably the most challenging
and significant step in firm valuation, because it measures the risk, volatility and returns of the
forecasted cash flows.

The discount rate computed takes into consideration the origin of the capital, if it is from debt,
equity or both.

2.2.2.1. Weighted Average Cost of Capital
The WACC is the most common discount rate used in equity valuation. It weights the cost of
equity and debt in its proportion used in the capital structure of the firm.

As stated by Koller, Goedhart and Wessels (2005), it represents the opportunity cost investors
face for investing in one particular business instead of another with similar risk. It is computed
as:

 12
 = × 1 − + (5)

Where:

D is the Market Value of D

E is the Market Value of E,

V is Debt plus Equity,

rd is the Cost of Debt

re is the Cost of Equity

t is the Tax Rate

When calculating WACC, one should take into account some important details. Fernandéz
(2011) identified some common errors when performing a valuation. Firstly, one should use the
market values of both equity and debt and not their book values. Additionally, using debt and
equity ratios that are neither the actual ones neither the forecasted; the proportion of debt and
equity should be revised frequently and the WACC changed if needed, to provide an accurate
measure of the cost of capital.

Although widely used in Finance, WACC is not the most accurate methodology. As Luehrman
(1997) states, WACC fails at treating financial side effects in companies with a complex capital
structure since it only recognizes tax benefits. Another critic from Luehrman (1997) is that
WACC operates with market values of debt and equity, which are not always easily observable.

In the next chapters, will be described the several methods to measure cost of equity and the
cost of debt.

2.2.2.2. Cost of Equity
Regarding the cost of equity, there are three major models to compute it. The most common is
the Capital Asset Pricing Model (CAPM), the Fama-French Three-Factor Model and the
Arbitrage Pricing Theory (APT).

2.2.2.2.1. Capital Asset Pricing Model
As introduced by Sharpe (1964) in the CAPM, the investor faces two prices, given by the
market: the price of time, also known as the usual interest rate, and the price of risk, the return

 13
one can obtain per additional unit of risk. The cost of capital corresponds to the return required
by the investors to compensate the risk they are undertaking.

This risk can be divided into two sub categories: the systematic risk (β), the risk of being
exposed to the market or the volatility, and the unsystematic risk, the portion of risk that does
not depend on the market but it is company specific. The systematic risk will vary across
companies and will show how the company responds to changes in the market. The formula
can be described as follows:

 = + × ( − ) (6)

Where:

rf is the risk-free rate, the theoretical return of an investment with zero risk,

rm is the market risk, risk that investors undertake for being present in a certain market, and

β is the systematic risk

To use this model, one should accurately estimate the Risk Free rate (Rf), the Market Risk
Premium (Rm-Rf) and the systematic risk (β).

Risk-free Rate

In finance, risk is viewed as the difference between the expected returns and the actual returns
of an investment. Therefore, a risk free investment should be one whose actual returns are equal
to the expected returns (Damodaran, 2008).

There are two conditions for risk free investments: no risk of default associated with the
investments’ cash flows and no reinvestment risk. Therefore, one looks at government default-
free bonds, with maturities from 5 to 20 years as it is the closest to a risk free rate. If one is
valuing companies based in the United States, the typical bond to use is a 10-year government
bond; if one is valuing a European company, the common proxy is a 10-year German Eurobond
(Koller, Goedhart, & Wessels, 2005).

Market Risk Premium

“The most important number in Finance” (Zenner, 2008)

The Market Risk Premium is the additional return expected by investors in a specific portfolio,
relatively to risk-free assets.

 14
The expected return of the market is not evident, thus there are several methodologies to
measure it, proposed by Koller, Goedhart and Wessels (2005).

The first method is estimating the future risk premium by analyzing historical excess returns. It
is a method often used but has some limitations, namely the time horizon. If one chooses a more
expansive or more restrictive time horizon it will conduct to different market risk premiums.
(Zenner, 2008)

The second method proposed by Koller, Goedhart and Wessels (2005) is estimating market
ratios as dividend-to-price or book-to-market, and with a regression analysis deriving the
market risk premium estimate. One of the limitations of this type of approach is that it assumes
a specific beta, which may not be the most accurate measure.

Estimating Beta

Estimating the Beta is also an important action when estimating the cost of capital as it
represents the systematic risk of the investment. As Koller, Goedhart and Wessels (2005) state,
it measures the volatility of the stock’s return in relation to the market’s return.

A levered or unlevered beta should be used, according to the capital structure of the firm as
follows:

 = + × ( − ) (7)

 = + × ( − ) (8)

The first equation is used when the DCF applies, whereas the second is used in the APV
valuation, as one is only valuing equity.

If one assumes that debt carries no market risk, the levered beta can be written as a function of
the unlevered beta:

 = × 1 + (1 − ) × (9)

The levered beta is the unlevered beta times the riskiness of the amount of leverage. Therefore,
as Damodaran (2002) states, as the amount of leverage increases, the more it will make net
income fluctuate, making the investment riskier.

 15
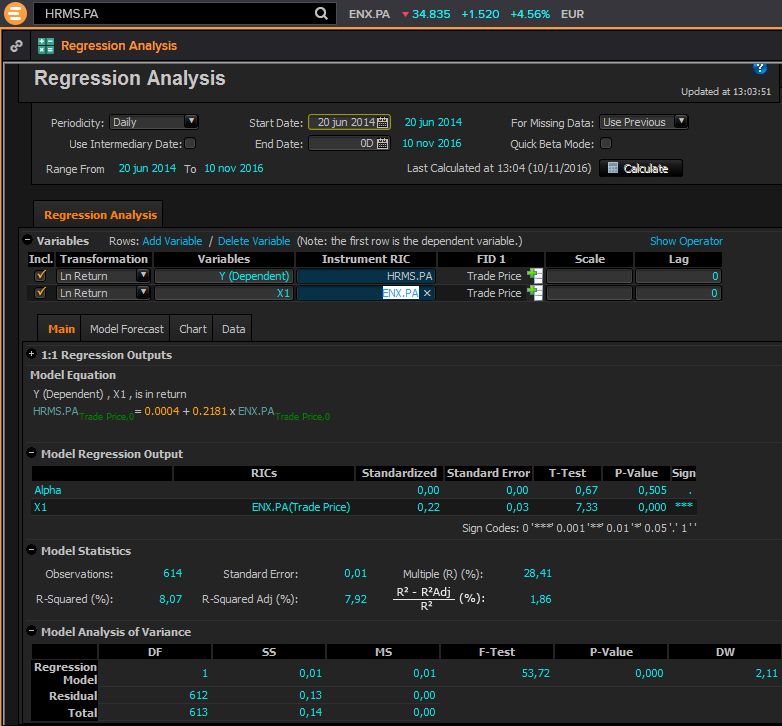
Two of the methods for estimating beta proposed by Damodaran (2002) are to do a regression
analysis and to analyze comparable companies.

The first is to do a regression analysis with historical returns on the investment and the historical
returns on a market index. This approach is relatively easy to use for companies that are public
for a considerable time but has some limitations regarding the choice of period and the market
index to use.

Additionally, a service beta can be used in this method. This beta, provided by Bloomberg (for
example), is estimated through a regression, and adjusted to reflect what analysts feel are better
estimates of future risk. The adjusted beta is calculated as follows:

 2 1
 = + (10)
 3 3

The second method is determining beta by looking at the fundamentals of the business the
company is operating in, also known as the Bottom-up Beta. It has five steps: 1) Identify the
business the company is in; 2) Finding other listed firms in the same business areas, extract
their betas, and their amount of leverage; 3) Estimate the unlevered beta for the business, by
dividing the beta of the comparable firms by their D/E ratio; 4) Estimate the unlevered beta for
the company, by performing an average of the unlevered betas calculated; 5) Using the debt
and equity proportions and this unlevered beta for the company, one can derive the value of the
levered beta for the company.

An alternative to these methods is to look at Damodaran’s beta for the industry where the
company operates. This approach is the least reliable from the three, as one is assuming the
company being studied is comparable to every company in that industry, which might not be
true.

2.2.2.2.2. Fama French Three Factor Model
This model was introduced in 1996 by Fama and French and it suggests that other variables
should be accounted for, when calculating the cost of capital. Such as the market’s return, the
company size and the market to book value. The equation is as follows:

 = + − + + + (11)

Where E(rHML)is the difference between the high and low returns, E(rSMB)is the difference

 16
between the returns of small and big companies and α is the specific non-systematic risk of
company. (Fama & French, 1996)

2.2.2.2.3. Arbitrage Pricing Theory
Ross (1976) proposed an alternative method for CAPM. The Arbitrage Pricing Model states
that two investments subject to the same risk exposure should have the same expected return.
This method has been subject to several critics, therefore is rarely used when computing the
cost of equity.

2.2.2.3. Cost of Debt
One has already analyzed the cost of equity and the required estimations one must do to
compute it. Nevertheless, another important part of the cost of capital is the cost of debt, where
one needs into take in consideration the required returns asked by the lenders, proportionally to
their stake in the company.

As stated by Hitchner (2006), the cost of debt is the rate a company pays on interest bearing
debt, the pre-tax cost of debt.

 − = − × 1 − (12)

According to Damodaran (2002), the cost of debt is determined by three variables: the riskless
rate, the default risk and the tax benefits associated with debt. Firstly, the higher the risk-free
rate (rf), the higher the cost of debt (rd). Additionally, as the default risk of the firm increases,
the cost of borrowing will as well increase, as the firm has less likelihood to pay for its
liabilities. Lastly, interest is tax deductible; therefore, the tax benefit deriving from paying
interest makes after-tax cost of debt lower than pre-tax cost of debt.

 = + (13)

2.2.3 Time Frame
To perform a reliable valuation, one needs to estimate cash flows during a certain period. It is
important to devote some time estimating the optimal forecasted period, as one will assume the
company will grow at a constant rate after this period.

As stated by Damodaran (2002), the forecasted period should be equal to the time a company
takes to reach a steady state, namely by a stable growth and capital structure. On the other hand,

 17
one is not able to estimate cash flows infinitely, so this time frame should not be extended
beyond the time frame where one can do projections reliably.

According to Koller, Goedhart and Wessels (2005), the time frame should be long enough to
attain a steady state, fulfilled by three requirements: 1) the company is growing at a constant
rate, reinvesting the same proportion of earnings every year 2) the return on invested capital is
constant 3) the return on new capital invested is also constant. These three conditions will able
the cash flows to grow at a constant rate and, therefore, one will be able to apply a perpetuity
when estimating the terminal value.

Numerous authors find that a reasonable time should be between five and ten years, depending
on the structure and characteristics of the firm (Damodaran 2002). Authors as Koller, Goedhart
and Wessels (2005), recommend a period of ten to fifteen years or even longer “for cyclical
companies or those experiencing very rapid growth”.

Furthermore, Myers (1974) demonstrated that increasing the number of years of forecasts could
decrease estimation or assumption errors.

2.2.4 Terminal Value
The terminal value is the final stake of the valuation, where one projects cash flows to grow as
a perpetuity.

According to Damodaran (2002) there are three ways to estimate the terminal value of a
company: liquidation value, multiple approach and stable growth model.

In the first method, the liquidation value, one assumes that at a certain point in time, the
company will terminate its activity. Therefore, one estimates the value of selling all the assets
of the firm – liquidation value.

The second approach is to estimate the terminal value by using a multiple to firm’s revenues.
Besides being the simplest alternative, it is not the most accurate. If the multiple is estimated
by looking at comparable firms, it is not a discounted cash flow valuation but a relative
valuation. If, on the other hand, the multiple is estimated using fundamental information on the
company, it becomes the Stable Growth Model, the third approach proposed by Damodaran
(2002).

In this last method, one assumes that cash flows will grow forever, the opposite of liquidation
value method where one assumed the firm had a finite life. The terminal value can be written
as follows:

 18
 ℎ +1
 = (14)
 −

Where it is assumed the company will grow forever at a stable growth rate, and where the cash
flows and discount rate will depend if the method of valuation is considering the whole business
or only equity.

2.2.5 Growth rate
The growth rate has a fundamental role in estimating the terminal value, as a small change will
significantly influence its value.

As recognized by Damodaran (2002), the fact that the growth rate is constant endlessly has
some constraints on forecasting its value. It is unmanageable for a firm to grow at a higher
growth than its economy, thus the growth rate assumed for the firm cannot be higher than the
economy’s growth rate.

Additionally, Koller, Goedhart and Wessels (2005) consider that the best estimate for the
growth rate is the expected long-term rate of consumption growth for the industry, plus
inflation.

2.2.6 Adjusted Present Value
As Damodaran (2006) states, in the adjusted present value one separates the effects of debt
financing from the effects of equity financing of a business. According to Luehrman (1997), it
values the business as a sum of parts taking into consideration two main classes of cash flows:
associated with the business operation, such as revenues and capital expenditures; and the side
effects associated with the financing program the firm is expected to use, such as interest tax
shields. The company is firstly valued as if it was entirely equity financed; then one adds the
benefits of debt and lastly, one deducts the expected bankruptcy costs.

 = ℎ 100% +
 −
 (15)

Moreover, APV appears to be a better tool to measure a company’s value. As stated by
Luehrman (1997), not only the APV method is more responsive to changes in the capital
structure of the company, as it helps managers to see where the value of the business comes
from.

 19
Lastly, and according to Damodaran (2006), one of the limitations of this approach is related
with bankruptcy, neither the probability nor the costs of bankruptcy can be predicted or
estimated reliably.

Interest Tax Shields

The value of interest tax shields is the increase in the company’s value as a result of interest
being tax deductible. In other words, the tax benefit deriving from paying interest makes after-
tax cost of debt lower than pre-tax cost of debt. There is no consensus about the correct way of
measuring it, nevertheless, Modigliani and Miller (1958), Myers (1974), Luehrman (1997) and
Damodaran (2006) propose discounting the tax savings due to interest payments on debt at the
cost of debt.

 =∞ × ×
 = =1 (16)
 (1+ )

2.2.7. Dividend Discount Model
The Dividend Discount Model is the oldest discounted cash flow method and has the main
advantage of being simple and relatively intuitive, as stated by Damodaran (2006).

There are two main reasons why investors buy stocks: to receive dividends during the holding
period and to receive the expected price when the stock is sold. As this expected price is
determined by the amount of dividends, the value of a firm can be estimated through
discounting dividends, as follows:

 =∞ ( )
 ℎ = =1 (1+ ) (17)

Where E(DPSt) are the expected dividends per share and re is the cost of equity.

According to Damodaran (2006), and as stated before, to calculate the expected dividends of a
stock, one needs to do assumptions on earnings and growth rates, nevertheless one cannot make
assumptions infinitely. To overcome this obstacle, some variations of the primary model of
DDM have arisen.

The simplest method is the Gordon Growth Model, developed by Gordon and Shapiro (1956),
which assumes that a firm has well established dividend payout policies and intend to continue
in the future. Thus, the value of the firm per share of stock can be written using the expected
dividends of next time period, as follows:

 20
 = ( − ℎ )
 (18)

Besides being the most accepted variation of Dividend Discount Model, the Gordon Growth
Model has its limitations. Namely, the assumption that dividend payout ratio will grow at a
constant rate forever. It is very unusual for a company to keep a constant growth rate of
dividends, as companies have business cycles and unexpected events may occur. Other
limitation is the fact that companies may pay higher dividends than they have availability for,
often being funded with equity or debt. Obviously, from this last case derive too optimistic
assumptions, as it assumes the firm will be able to rely on external funds to meet dividend
payment deficits infinitely, which is not true. (Damodaran 2006)

2.2.8. Economic Value Added
The EVA is a measure for excess return calculation, it represents the surplus of value created
by an investment. Cash flows are, therefore, separated into excess return cash flows and
normal return cash flows. (Damodaran, 2006)

The value of a company can, thus, be written as following:

 = ℎ +
 ℎ (19)

And where = − ∗ (20)

Besides being a good tool to evaluate a company, as it takes into consideration all the actions
management undertake, sometimes the ROIC or WACC estimated do not reflect the actual
return and cost of capital of the company. (Damodaran, 2006)

2.3. Relative Valuation
An alternative to the Discounted Cash Flows techniques described before is the relative
valuation or multiples valuation.

In a Discounted Cash Flow approach, one is valuing an asset based on its ability to produce
cash flows in the future. In relative valuation, one is valuing an asset by looking to the price of
similar assets in the market. If both valuations are made correctly, valuations might converge.
(Damodaran, 2002)

As stated by Damodaran (2006) assets are valued based on comparable assets priced in the
market. Thus, one can determine the value of a firm by looking at the value of similar firms.

 21
Three crucial steps need to be made while performing a relative valuation: 1) Find comparable
assets that are priced in the market; 2) Scaling the market prices to common variables to able
comparison, which may not be needed if assets are identical but is crucial when comparing
assets that vary in size or units; 3) Adjusting for differences in standardized values. As an
example, higher growth companies should have higher multiples, and this should be taking in
consideration when making comparisons. (Damodaran 2002)

According Koller, Goedhart and Wessels (2005), a comparison of a firm’s multiples to a
comparable firm’s multiples is a major tool to test validity of projected cash flows and to search
for strategic potential of the company, in relation to the set of firms.

Nevertheless, performing a relative valuation can be a challenging job. Not only with the choice
of comparable firms but also which multiple to use.

As stated by Damodaran (2006), the simplest and primary assumption is that firms in the same
sector have similar growth, risk and cash flow projections, enabling a reliable comparison.

After identifying the company industry’s players, Koller, Goedhart, and Wessels (2005)
recommend a four step process to identify comparable firms reliably: choose companies with
similar ROIC and growth, use forward-looking multiples, use enterprise-value multiples based
on EBITDA to diminish problems with capital structure and unexpected events, and finally,
adjust the enterprise-value for non-operating items such as excess cash.

Supporting the use of forward-looking multiples is Liu, Nissim, and Thomas (2001), who
provided evidence that multiples based on future earnings are more accurate than historical
multiples, which might seem realistic, as the cash flows projections reflect better the future
performance of the firm. Moreover, a valid reason to use these multiples would be the
increasing accessibility of earnings’ projections.

According to Fernandéz (2001), multiples rely on three categories: based on the company’s
equity value such as PER or Price to Sales, based on the enterprise value (debt and equity) such
as EV/EBITDA and growth-reference multiples such as EV/EG (EBITDA Growth).

Koller, Goedhart, and Wessels (2005) defend one should use enterprise multiples rather than
equity multiples, because of the easy manipulation of equity multiples when changes in the
capital structure of the firm occur.

In his findings, Fernandéz (2001) showed that PER and EV/EBITDA are the most widely used
multiples for valuing firms. Nevertheless, PER has its limitations. As stated by Koller,

 22
Goedhart, and Wessels (2005), it is systematically affected by the chosen capital structure.
Additionally, it includes non-operating gains or losses, which can be one-time events, and
mislead the over or undervalue the multiple. Regarding EV/EBITDA, it is a good alternative to
PER ratio as it is less dependent on the capital structure of the company.

A drawback of this approach, as mentioned by Koller, Goedhart, and Wessels (2005) is the
assumption that returns and growth are typically similar for companies in the same industry.
Differences in accounting methods, effects of inflation, the stage of the company or unexpected
events may mislead the result of the multiples and thus, result in an inaccurate valuation.

2.4. The case of Hermès International
After analyzing the present literature, one is now prepared to choose the methods to value
Hermès International.

Regarding the Discounted Cash Flows Method, the Discounted FCFF appear as the most
suitable method. The APV technique does not seems reasonable, as the company has a very
low volume of debt and its D/E has been quite constant over the past years, suggesting that
there were not significant changes in the capital structure of the firm.

Furthermore, one will also apply the DDM, as the company’s dividends almost totaled the
FCFE. The dividend policy is not expected to change, as the company pays dividends as a
strategy to reduce the amount of retained cash.

Moreover, one will perform an EVA valuation, as it is a performance measure widely used in
finance. It is important to analyze the creation of value for Hermès’ shareholders

Lastly, one will conduct a relative valuation, with the P/E, EV/EBITDA and EV/EBIT
multiples, since they are common multiples used for companies in the apparel industry.

 23
3. Industry Overview
In this chapter, one will start by introducing the luxury goods industry; secondly, will describe
the drivers for growth in this industry, followed by a geographic analysis. Finally, the future
of the industry is going to be presented.

3.1 Luxury Goods Industry
“Something inessential but conductive to pleasure and comfort. Expensive and hard to obtain”
– American Heritage Dictionary

Luxury can be seen as an industry with “a strong branding that relates to an exclusive lifestyle,
superior quality and timeliness, premium pricing and stylish and extravagance when comes to
design” Comité Colbert (2001). Goods are distinguished by their uniqueness and intrinsic value.
They are often associated with apparel, jewelry and perfumes but the sector is much wider,
from yachts to cars and furniture.

Luxury goods companies’ value chain comprises manufacturing, production, distribution and
retailing. While several luxury companies as Guess or Max Mara, tend to focus on design and
retail, many companies control the entire value chain, as it is the case of Louis Vuitton or
Hermès.

There are three main segments when defining the luxury industry: absolute luxury, aspirational
luxury and accessible luxury.

The first segment, absolute luxury, is characterized by unique items, made with precious
materials, often inaccessible and related with the brand’s heritage. The high quality and price
of products, combined with these high principles, results in a sense of exclusivity and
uniqueness given by the brand.

Furthermore, in the second segment, the aspirational luxury, there is a limited production in
series, the quality and style remain in the front line and each product represents the brand’s
reputation. Advertising, in contrary of the absolute luxury where there is no advertisement,
plays an important role.

Lastly, the accessible luxury segment, where standardized products and more affordable prices
take place. Customers have a notion of status and membership of the brand. The advertising
needs to be regular and the aspirational advertising is used, where the customer wishes to own
the product, regardless of its price.

 24
Bearing in mind these three segments in the luxury goods industry, Hermès International is
positioned in the absolute luxury segment. It is a brand with an unmeasurable heritage and
several iconic products, as we will examine in the next chapter.

3.2 Drivers for growth
The luxury goods industry has three main drivers for growth: the continuously
internationalization of companies, brand and line extension, and the distribution channels.

As a company becomes internationally developed, it deals with different cultures and values
widely distributed between countries. While in traditional markets, consumers expect quality
and innovative products, with some degree of exclusivity; consumers in emerging markets
search for extravagance and ostentation.

Being able to serve both types of customers is a good source of potential growth, as the company
expands its activities to a wider range of markets. Nevertheless, it is a big challenge to try to
please such different customers, without diluting the brand awareness.

Additionally, the global tourism is a booming trend. The demand for health and wellness
tourism destinations increased significantly in the last years, with the desire for VIP treatment.
There is an increase in women travelling alone or in groups, looking for SPAs and shopping
destinations. Meeting these new demand trends, is nowadays a big growth opportunity for
companies. (Bain&Co, 2015)

Furthermore, the brand and line extension have a positive impact on consumers’ perception of
what the meaning of luxury is today. Many luxury brands that started with apparel and
fragrances have expanded to accessories, sportswear, furniture, home wear, cell phones or
cafés.

Lastly, the distribution strategy is an important driver of growth because it impacts the brand
recognition and the margins of the products sold. If a consumer buys a product in a retail store,
it has a more impacting contact with the brand’s image, it engages in the retail experience
through the store. Furthermore, typically retail business give higher margins than wholesale
business.

On the opposite, in the wholesale business there is a high number of brands selling in the same
physical space. Therefore there is a high diffusion of brands and a lower brand image, being
harder to give a customer the true shopping experience. This type of distribution has lower
margin of contribution to the business but it has also lower investment risk.

 25
Besides these two distribution strategies, a new tendency is arising: the e-commerce. Many
luxury brands have for a long time, resisted to this channel because it was associated with
discounts or counterfeiting products. Nowadays, with the increasing presence of the internet in
people’s life, luxury brands felt the need to adopt this new distribution channel. In most of the
times, it is not used to sell products but to announce fashion shows and to show collections.

According to Goldman Sachs, it is predicted that e-commerce represents the same percentage
of revenues as wholesale, in 2025.

 100%
 80%
 60%
 40%
 20%
 0%
 2006 2014 2025

 Retail Wholesale Online

Graph 1: Share of Global Revenue across the different distribution channels. Source: Goldman Sachs Equity Research 2015

As showed in the graph 1, e-commerce’s percentage of revenues shows a small increase in the
period 2006-2014, decreasing the market share from retailer and wholesales.

A strategy performed by several companies, namely Hermès, is to combine wholesale, e-
commerce and retail. This strategy, called Omnichannel, has high growth potential for a
company being the only challenge, to find an optimal point between the three channels.

3.3 Geographic analysis
“With luxury goods, we are seeing the emergence of a new normal: The global market is
maturing, stabilizing and consolidating. It is becoming more resilient to economic crises, more
responsive to a demanding and highly mobile global consumer base, and less reliant on market
booms for growth. For all these reasons, luxury brands everywhere should be focusing on how
to build growth organically.” (Claudia D’Arpizio, Bain&Company)

In the past, luxury companies’ main activity was in the US and in Europe. Nowadays, almost
all luxury companies’ activity is spread worldwide, therefore, companies need to change
practices to meet consumer demand.

 26
As one can see by graph 2, USA remains a significantly big market. Nevertheless, Japan and
China also represent a high level of consumption, and according to Bain&Co (2016), their
markets are predicted to grow even more.

 100
 78,6
 80
 in billions of €
 60

 40
 20,1 17,9 17,3 17,1
 20

 0
 USA Japan China Italy France

 Graph 2: Consumption in Luxury Goods by country in 2015. Source: Bain&Co 2015

For the sake of this work, one will analyze geographic trends in Europe with a special focus in
France; Japan, Asia-Pacific and Americas.

Europe

Europe maintains a leading position in the luxury goods industry, as it entails five of the seven
top luxury markets: France, Italy, Switzerland, United Kingdom and Spain. (Global Powers of
Luxury Goods, Deloitte 2016)

A big consumption trend in Europe is related to tourism, as 58% of total luxury goods
consumption is made by tourists, primary Chinese. Chinese consumers increased by 64% as
they prefer to shop in foreign countries where they have tax-free shopping. (Deloitte, 2016)

France

France has a natural heritage in the luxury goods industry has many headquarters of luxury
companies were, and still are, located in Paris. As one is going to see in the following chapter,
it is the case of the company studied, Hermès International.

The year of 2015 was specially challenging for the country, as Paris was the target of a terrorist
attack. This event affected the performance of the country, as France recorded a lower growth
compared to previous years. (See table 5)

According to Deloitte’s report on Global Powers of Luxury Goods in 2016, France entails the
headquarters of ten of the top 100 companies in the industry, where the first three – LVMH,
Kering and L’Óreal Luxe – represent 78% of total sales.

 27
Japan

Japan’s relation with luxury goods began in the 1970s, where Japanese consumers’ belief
European products had higher quality and were longer-lasting than local ones. According to
McKinsey, Japanese consumers possessing a European luxury good sensed an emotional
connection with the luxury brand and it was a symbol of economic success and social
recognition.

It is expected, therefore, that these consumers spend a considerable amount of income in luxury
goods. Actually, they are one of the “world’s biggest spenders” according to McKinsey.

As one can see in graph 2, Japan is the second biggest market in the luxury goods industry. It
represented 12% of Hermès International’s revenues in 2015.

Another growth driver of this country is the amount of tourists it receives every year. Tourists
find Japan an attractive destination for shopping.

Asia-Pacific

The Asia-Pacific region, excluding Japan, represented 35% of Hermès International total
revenue in 2015.

Historically, the luxury goods sector has considerably high growth rates in this region, mainly
due to the expansion in emerging luxury markets.

China a big responsible for this growth. In 2010, the country was the fifth biggest market in
luxury goods. It is now the third biggest market, representing about one third of global market,
according to Bain&Co (2015).

Another factor driving this region’s growth is the increased number of High Net Worth
Individuals, with higher purchasing power. Nevertheless, the increase in import tariffs and the
well-known counterfeiting luxury goods in this region, represent a challenge for growth.

Americas

Enhanced by a strong dollar, the Americas are the biggest global market for luxury goods. The
USA alone, represents a higher percentage of the total market than the combination of Japan,
China, Italy and France.

 28
New York is an unavoidable city to mention, when the matter is luxury goods. According to
Bain&Co (2015), the amount spent in luxury goods in New York City, is greater than the total
amount spent in Japan.

In 2014, the total number of High Net Worth Individuals was 33 million, 16 million of this were
Americans.

3.4 Future of the Industry
"I think this year could be a low point for the industry," Claudia d'Arpizio, Bain&Company
Partner 2016.

Besides a lower expected growth for this year, the luxury goods industry is predicted to increase
its growth pace in the next few years.

Additionally, consumers are changing. They are being shaped by several trends, which are
creating better-informed and more demanding consumers. Two crucial trends are the tourism
and the new digital era.

The increase in tourism affects the luxury goods industry, as it becomes a global integrated
market. In the past, companies would implement pricing strategies based on the country they
were selling in. International travel is, thus, a challenge to this strategy. Specifically, Chinese
consumers are transforming travel in a synonym of shopping, as they are buying the majority
of luxury goods abroad. By 2020, is expected that luxury brands are able to smooth international
price differences. (Bain&Co, 2015)

Additionally, it is inevitable to discuss how much technology has changed the world. It has
shaped consumers and their needs. With digital technology the consumer is always connected
to his favorite brands, increasing the brand awareness and customers’ expectations.

Moreover, the digital consumer is also influenced by social media. Social media as Instagram
or Facebook are filled with shopping on the Fifth Avenue, hotel stays at Ritz-Carlton or Chanel
purses. This increases even more the brand awareness and desire on consumers.

It is estimated by Deloitte (2016) that the percentage of sales influenced by digital technology
is around 40% and it is expected that e-commerce reaches 10% of sales by 2020.

Geographically, the United States market is declining, without the support of tourism or local
demand. However, the spending on luxury goods in Latin America is contributing to a slightly
increase in the growth in this region.

 29
You can also read