EXTENDED STAY AMERICA DON'T CHECK OUT

Page created by Jessie Rose
 
CONTINUE READING
EXTENDED STAY AMERICA DON'T CHECK OUT
I N V E S T O R P R E S E N TAT I O N

EXTENDED STAY AMERICA
   DON’T CHECK OUT

    P R E S E N T E D B Y TA R S A D I A C A P I TA L   |   MAY 2 0 2 1
EXTENDED STAY AMERICA DON'T CHECK OUT
DISCLAIMERS
Tarsadia Capital, LLC (“Tarsadia”), Ravi Bellur, Michael Ching and Vikram Patel (collectively, the “Participants”) have filed with the Securities and Exchange Commission (the “SEC”) a definitive proxy statement and
accompanying form of proxy to be used in connection with the solicitation of proxies from the shareholders of the Company for the Special Meeting. All shareholders of the Company are advised to read the definitive proxy
statement and other documents related to the solicitation of proxies by the Participants, as they contain important information, including additional information related to the Participants. The definitive proxy statement and an
accompanying GOLD proxy card will be furnished to some or all of the Company’s shareholders and will be, along with other relevant documents, available at no charge on Tarsadia’s campaign website at:
www.ABetterFutureForStay.com and the SEC website at http://www.sec.gov/. Information about the Participants and a description of their direct or indirect interests by security holdings is contained in the definitive proxy
statement filed by the Participants with the SEC on May 7, 2021. This document is available free of charge on the SEC website.

This material does not constitute an offer to sell or a solicitation of an offer to buy any of the securities described herein in any state to any person. In addition, the discussions and opinions in this letter and the material
contained herein are for general information only, and are not intended to provide investment advice. All statements contained in this letter that are not clearly historical in nature or that necessarily depend on future events
are “forward-looking statements,” which are not guarantees of future performance or results, and the words “anticipate,” “believe,” “expect,” “potential,” “could,” “opportunity,” “estimate,” and similar expressions are generally
intended to identify forward-looking statements.

The projected results and statements contained in this letter and the material contained herein that are not historical facts are based on current expectations, speak only as of the date of this letter and involve risks that may
cause the actual results to be materially different. Certain information included in this material is based on data obtained from sources considered to be reliable. No representation is made with respect to the accuracy or
completeness of such data, and any analyses provided to assist the recipient of this material in evaluating the matters described herein may be based on subjective assessments and assumptions and may use one among
alternative methodologies that produce different results. Accordingly, any analyses should also not be viewed as factual and also should not be relied upon as an accurate prediction of future results.

All figures are unaudited estimates and subject to revision without notice. Tarsadia disclaims any obligation to update the information herein and reserves the right to change any of its opinions expressed herein at any time
as it deems appropriate. Past performance is not indicative of future results. Tarsadia has neither sought nor obtained the consent from any third party to use any statements or information contained herein that have been
obtained or derived from statements made or published by such third parties. Except as otherwise expressly stated herein, any such statements or information should not be viewed as indicating the support of such third
parties for the views expressed herein.

                                                                                                                                                                                                                                       2
EXTENDED STAY AMERICA DON'T CHECK OUT
TABLE OF CONTENTS

                                                                                    Page

       I     Executive Summary                                                       4

       II    STAY Has Been a Perennial Underperformer                                17

      III    Sale of STAY – Wrong Time                                               34

      IV     Sale of STAY – Wrong Price                                              41

       V     Sale of STAY – Wrong Sale Process                                       49

      VI     Company and Deal Process Suffered from Apparent Fiduciary Disloyalty    70

      VII    Better Alternatives Exist                                               84

      VIII   Refuting STAY’s Arguments                                               88

      IX     Conclusion                                                              91

       X     Appendix; Extended Stay’s Paired-Share Structure                        95
                                                                                           3
EXTENDED STAY AMERICA DON'T CHECK OUT
Executive Summary

 II    STAY Has Been a Perennial Underperformer

III    Sale of STAY – Wrong Time

IV     Sale of STAY – Wrong Price

 V     Sale of STAY – Wrong Sale Process

VI     Company and Deal Process Suffered from Apparent Fiduciary Disloyalty

VII    Better Alternatives Exist

VIII   Refuting STAY’s Arguments

IX     Conclusion

 X     Appendix; Extended Stay’s Paired-Share Structure
                                                                              4
EXTENDED STAY AMERICA DON'T CHECK OUT
About Tarsadia Capital
Tarsadia Capital, LLC is the New York-based investment management company of a family office. Tarsadia Capital has a
flexible and long-duration investment mandate that focuses on equities and commodities globally. Our investment process
employs deep fundamental research on secular inflections to identify and build conviction around asymmetric risk/reward
opportunities that will play out over multi-year time horizons.
Tarsadia and various of its affiliates have been investors and operators in the hospitality and lodging industry for over four
decades.

                                                                                                                                 5
EXTENDED STAY AMERICA DON'T CHECK OUT
Extended Stay America (NYSE: STAY) Snapshot
      Extended Stay America, Inc. (“ESA”, “STAY” or the “Company”) is the largest integrated owner/operator of
     company-branded hotels in North America and operates in the extended-stay segment of the lodging industry

                  Asset Footprint                     Customer Base – Avg. Length of Stay                                            Summary Financials ($mm) (a)
 -    Owns and operates 563 hotel properties in 40                                     1-6                                   Market Cap (b)                     $3,462
      US states, consisting of approximately 62,700                                   Nights
      rooms                                                                                                                  Net Debt (c)                       2,326
 -    Franchises 83 hotel properties for third                              28%
                                                        30+                                                                  Enterprise Value                   $5,789
      parties, consisting of approximately 8,500                51%
                                                       Nights
      rooms                                                                                                                  Sales
                                                                            21%
                                                                                                                             2019A                              $1,218
                                                                                   7 - 29
                                                                                   Nights
                                                                                                                             2020A                              $1,042
                                                                                                                             2021E                              $1,134
                                                                                                                             2022E                              $1,223
                                                                                                                             Adj. EBITDA
                                                                                                                             2019A                              $535
                                                                                                                             2020A                              $374
                                                                                                                             2021E                              $434
                                                                                                                             2022E                              $506

                                                                   Note: For further details of Extended Stay’s shareholding structure, please see appendix.
                                                                   a)     Estimated 2021 and 2022 results from STAY definitive proxy filed on April 26, 2021.
                                                                   b)     Market cap assumes $19.50 share price
                                                                   c)     Net Debt as of March 31, 2021                                                                  6
EXTENDED STAY AMERICA DON'T CHECK OUT
Executive Summary

Extended Stay shareholders have                    The proposed sale of Extended                   Better alternatives exist and Extended
suffered through years of poor                     Stay comes at the wrong time, with              Stay shareholders should oppose the
strategic decisions, bad performance               the wrong price and after the                   sale to The Blackstone Group, Inc.
and a multitude of management                      wrong process                                   (“Blackstone”) and Starwood Capital
changes                                                                                            Group (“Starwood”)

•   At its IPO, Extended Stay garnered a           •   The lodging industry is on the cusp of a    •   Tarsadia is committed to replacing the
    premium multiple because shareholders              major rebound in demand; history                Board with independent, experienced
    recognized its unique model should have            suggests significant value is about to be       lodging executives who can help Extended
    durable cash flows                                 created for owners                              Stay realize its full potential
                                                                                                   •   A combination of asset sales, franchise
•   Extended Stay’s Boards failed to attract and   •   Transaction price is well below                 development, and optimized capital
    retain strong leaders, address key strategic       comparable deals, including prior               structure present near-term opportunities to
    opportunities and correct poor performance         acquisitions of Extended Stay itself by         realize value and close STAY’s discount to
                                                       Blackstone, and intrinsic value                 its lodging peers
•   The Company missed key strategic
    opportunities and public guidance,             •   The process to sell Extended Stay was       •   Adopting a more conventional corporate
    resulting in the loss in investor confidence       rushed and inadequate; no other buyers          structure for a lodging company would
    and its premium valuation                          were even contacted                             unlock significant value

•   To benefit all shareholders, Tarsadia          •   Management suddenly became bearish on       •   There are further strategic opportunities
    nominated three exceptional lodging                STAY’s standalone prospects, after the          including industry consolidation and
                                                                                                       partnerships that a new board should review
    executives to the board to bring the               Board provided significant bonuses for a        with management
    required expertise to evaluate strategic and       sale
    operational options                                                                            •   Extended Stay shareholders should vote
                                                   •   Goldman Sachs’ fairness opinion is              AGAINST the inadequate Blackstone /
•   To sidestep accountability, we believe the         flawed                                          Starwood transaction
    Extended Stay Board rushed to sell the
    Company                                        •   The Extended Stay Board is conflicted and
                                                       was not unanimous in its decision                                                              7
EXTENDED STAY AMERICA DON'T CHECK OUT
STAY Has Underperformed
   STAY has been the worst performing lodging stock since its IPO in 2013 as its multiple contracted 33% while peers
                                          experienced multiple expansion1

             Total Shareholder Returns from STAY IPO up to Deal
                                                                                                                                      Historical Valuation Multiple (EV / NTM EBITDA)2
                               Announcement
                                        Lodging REITs                                 Lodging C-Corps                               Contraction                                           Expansion
                                                                                                                        18.0x
                                                                                                     251%                                                                                                 16.3x
                                                                                            221%                        16.0x
                                                                                                                                                                                                  14.6x
                                                                          179%                                                       14.0x
                                                                                                                        14.0x                                13.3x
       STAY is the worst                                                           157%
      performer compared                                                                                                                                             12.4x                12.4x
      to its lodging peers                                                                                              12.0x                                                     11.4x

                                                                  64%
                                                                                                                        10.0x                     9.3x
                                                         36%
                                       23% 23%
                      2%       8%
                                                                                                                          8.0x
   (1)% (1)%
                                                                                                                          6.0x
  STAY RLJ CLDT PEB DRH HST SHO INN RHP CHH HLT MAR                                                                                        STAY             Full Serv. REITs      Select Serv.    C-Corps Avg.
                                                                                                                                                                  Avg.            REITs Avg
Source: Bloomberg.
1) Total shareholder returns between November 13, 2013 through March 12, 2021. Assumes dividends reinvested in security.
2) As of December 30, 2013 and 2019. Full Service REITs include: DRH, HST, RHP, RLJ and SHO; PEB is excluded because it was not a public company in 2013.       Dec. '13       Dec. '19                           8
    Select Service REITs include: CLDT and INN. C Corps include: CHH, HLT and MAR.
EXTENDED STAY AMERICA DON'T CHECK OUT
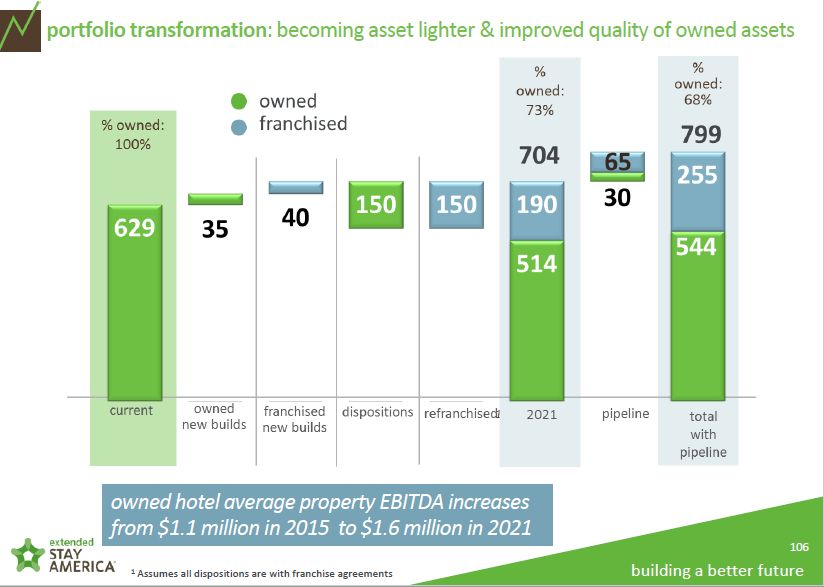
Tarsadia’s Unsuccessful Attempts to Engage Constructively

                   Tarsadia has attempted to engage constructively with the Boards and management of STAY

   May 2020                   October 6, 2020                                          February 11, 2021             March 15, 2021                May 7, 2021
  Tarsadia first         Tarsadia shares 43-page                                  Tarsadia conducts call with    STAY cancels scheduled            Tarsadia files
 acquires stock           presentation with STAY                                 Mr. Geoga and suggests the      interviews with Tarsadia         definitive Proxy
     in STAY               management entitled                                      STAY Board should add         director nominees and         Statement to solicit
                             “Extended Stay –                                      directors with lodging and      announces entry into           against merger
                          Undervalued”, warning                                  asset management expertise       Merger Agreement with              approval
                         STAY it was susceptible to                                                             Blackstone and Starwood
                         receiving vulture bids for
                            the entire company.

        August 2020                    December 22, 2020                   January 26, 2021                  February 23, 2021             March 22, 2021
     Tarsadia begins to              Tarsadia requests a call   Tarsadia conducts meeting with STAY      Tarsadia privately submits    Tarsadia sends letter to
        engage with                     in January 2021 to        leadership to discuss Company’s        notice to STAY of intention      STAY shareholders
    management of STAY                review the Company’s      real estate and franchise strategies.        to nominate three          opposing transaction
   and over next 6 months                long-term strategy     Tarsadia requests call with Chairman      independent candidates         with Blackstone and
   conducts over 20 calls                                             of the Board, Doug Geoga           with lodging experience to           Starwood
       and meetings                                                                                           the Board of STAY
                                                                                                                                                                       9
STAY’s Sale is the Result of a Board Hiding From Accountability
     Tarsadia’s engagement and nomination of directors led STAY’s Boards to run an abrupt sale process to avoid a
                          shareholder meeting that would remove existing Board members

Tarsadia Actions
December 22, 2020          January 26, 2021          February 11, 2021            February 23, 2021
Tarsadia requests a      Tarsadia requests call    Tarsadia conducts call     Tarsadia privately submits
call in January 2021      with Chairman of the      with Mr. Geoga and        notice to STAY of intention                      STAY stalls on
     to review the        Board, Doug Geoga       suggests the STAY Board         to nominate three                        interviewing Tarsadia
Company’s long-term                               should add directors with    independent directors to                          nominees
        strategy                                     lodging and asset             the Board of STAY
                                                   management expertise

                        Oct. ‘20                        Jan. ‘21                                            Feb ‘21                                       March ‘21

 January 19, 2021              February 8, 2021                                        March 2, 2021         March 6, 2021        March 10, 2021          March 15, 2021
  Blackstone orally          STAY executes a new                                  BX submits first letter in Minority of STAY      STAY executes          STAY enters into
expresses interest in       employment agreement                                   writing to acquire STAY directors object        confidentiality       Merger Agreement
 acquiring STAY for         with CEO Bruce Haase,                                        for $18.75          to BX proposal       agreement with        with Blackstone and
   “$17.00 plus”          awarding shares that would                                                                                 Starwood                Starwood
                          increase his compensation
                           upon a change in control

STAY Board and Blackstone Actions                                                                            13 Days from written offer to definitive agreement
                                                                                                                                                                              10
Historical Price Performance
            The proposed sale to Blackstone and Starwood at $19.50 per paired share (the “Sale”), if completed, would
           conclude STAY’s more than seven years as a public company at a price below its original IPO price of $20.00

                                                        Historical Price Chart of STAY
                                                                                                           March 15, 2021:
                     $30.00                                                                       Blackstone and Starwood
                     $28.00                                                                            announce acquisition
                     $26.00                                                                        agreement at $19.50 per
                                                                                                share, a mere 15% premium
                     $24.00
                                                                                                     to the prior trading day
                     $22.00
                     $20.00
                     $18.00
                     $16.00
                     $14.00
                                 November 13, 2013:
                     $12.00
                                 STAY’s IPO at
                     $10.00      $20.00 per share
                      $8.00
                      $6.00
                      $4.00
                          2013             2014       2015       2016      2017          2018        2019              2020

Source: Bloomberg.                                                                                                              11
Wrong Time to Sell

           It is the wrong time to sell STAY and end the Company’s existence as a publicly traded company

Category                                                             Detail                                         Page(s)
                              After experiencing a substantial decline in demand in 2020, industry forecaster
Beginning of Lodging Cycle    STR, Inc. projects record-setting increases in demand over the next several years     35 – 36
                              and STAY management projects Hotel EBITDA / Key to rebound 57%
                              US lodging stocks have historically generated the highest returns in the first two
Lodging Stock Returns                                                                                                 37
                              years after a lodging recession
                              Blackstone purchased STAY twice (2004 and 2010), each time at the beginning of
Blackstone Has Previously     a lodging cycle, and sold at a substantial gain after Hotel EBITDA / key recovered.
Opportunistically Acquired    It is an odd coincidence that Blackstone has taken the opposite approach to the       38 – 39
STAY Twice                    Boards’ guidance at major inflection points in STAY’s history; Blackstone has been
                              right every time

Post-COVID, US Real Estate    We analyzed 7 post-COVID U.S. real estate M&A situations and observed that 5
Boards Recognize it is Not    of the deals were stock transactions, while one cash deal was rejected despite a        40
Time to Sell                  65% premium and the other cash deal was bumped to a 63% premium

                                                                                                                              12
Wrong Price at Which to Sell

       The proposed transaction price significantly undervalues STAY and is at a substantial discount to peers

Category                                                                Detail                                          Page(s)
                                  Proposed transaction multiple of 12.0x NTM EBITDA is the lowest in the U.S.
Lowest Acquisition Multiple in
                                  lodging space in more than 5 years and lower than the acquisition multiple of prior     42
Recent History
                                  Blackstone acquisitions of STAY

                                  The acquisition multiple of 11.6x 2022E EBITDA values STAY at a 32% discount to
Valuation Discount to Peers                                                                                               43
                                  its REIT peers

STAY Share Buybacks Have
                                  During 2018, STAY repurchased $68mm of stock above the $19.50 deal price                44
Been Above $19.50

Real Estate Value Substantially   Based on a 2007 appraisal and more recent selected property appraisals, we
                                                                                                                        45 – 48
Higher than Deal Price            believe fair value of STAY’s real estate is between $28 and $31 per paired share

Precedent Transaction and
                                  Performing a basic precedent transaction and comparable companies’ analysis
Comparable Companies                                                                                                      66
                                  arrives at values ranging from $27.90 to $33.96 per STAY paired share
Analysis

                                                                                                                                  13
The Sale Process Was Inadequate and Suffered From Fiduciary Disloyalty

                              The process to sell Extended Stay suffered from numerous failures

Category                                                                   Detail                                      Page(s)
No Other Parties Were
                                   Goldman Sachs, STAY’s financial advisor, explicitly noted that it did not solicit
Contacted During the                                                                                                   50 – 58
                                   interest from any parties, and the deal includes a no-shop provision
Abbreviated Process
Boards Did not Negotiate a         The Boards’ “negotiated” increase in the deal price lagged the contemporaneous
                                                                                                                       59 – 60
Good Price                         performance of publicly traded peers and delivers a cash windfall to the buyers
Asset Sales Alternative Not        The Boards did not complete an assessment of the strategic value of STAY’s real
                                                                                                                       61 – 62
Thoroughly Vetted                  estate assets and the potential value accretion to STAY
                                   Goldman Sachs’ fairness opinion deviated from its typical methodology and
Flawed Fairness Opinion                                                                                                63 – 68
                                   excluded important analyses typically included in lodging industry transactions

Boards Have Conflicts of           The STAY board has several individuals with significant connections with
                                                                                                                       71 – 76
Interest                           Blackstone or strong personal relationships with Chairman Doug Geoga

Two Independent Directors          Two directors voted against the deal and explained the specific reasons why STAY
                                                                                                                       77 - 78
Voted Against the Transaction      shareholders should oppose the transaction

After Management Team was
                                   During merger negotiations with Blackstone, the STAY Board increased the CEO’s
Incentivized to Sell, it Changed                                                                                       79 - 83
                                   change-in-control package, twice, for no consideration
its Standalone Outlook
                                                                                                                                 14
Better Alternatives Exist
 With a credible, independent board aligned with shareholders, STAY will be able to unlock its full potential via both
                 strong standalone execution and a thorough exploration of all strategic alternatives

Category                                                                Detail                                           Page(s)
                                 STAY is well positioned relative to peers to benefit from a number of emerging
Future Lodging Trends Will
                                 themes that will serve as tailwinds in the lodging space: affordable housing              85
Benefit STAY
                                 policies, infrastructure bills and post-COVID travel preferences
                                 With the right board composition, management team and strategy, STAY has a
Standalone Value Creation
                                 variety of value levers across asset sales, franchise growth, capital structure and       86
Opportunities Exist
                                 redeployment of capital
Tarsadia Has Recruited World     When the deal is voted down, Tarsadia intends to run a partial or full slate of
                                                                                                                           87
Class Candidates for the Board   directors for election to the Board that can help ensure a profitable future for STAY

                                                                                                                                   15
Fair Value is Substantially Higher
  The proposed transaction materially undervalues STAY compared to accepted valuation methods, comps and an
                                         improved standalone strategy.
▪ Please see “Page Detail” for Tarsadia’s analysis

                      Method            $15.00             $20.00                $25.00                 $30.00            $35.00   Page Detail

                Comparable Companies                                                      $27.90                          $33.89       66

        Precedent Lodging Transactions                                                              $29.91                $33.96       66

 Extended Stay Industry Peer Cap Rates                         $21.90                      $26.28                                      68

 2007 Appraisal Value (Adj. for Portfolio)                                                $27.88                 $31.44                48

          Improved Standalone Strategy                                  $23.50                          $29.00                         86

                                                 Deal Price = $19.50
                                                                                                                                                 16
I     Executive Summary

 II    STAY Has Been a Perennial Underperformer

III    Sale of STAY – Wrong Time

IV     Sale of STAY – Wrong Price

 V     Sale of STAY – Wrong Sale Process

VI     Company and Deal Process Suffered from Apparent Fiduciary Disloyalty

VII    Better Alternatives Exist

VIII   Refuting STAY’s Arguments

IX     Conclusion

 X     Appendix; Extended Stay’s Paired-Share Structure
                                                                              17
STAY Has Been The Worst Performing Lodging Stock
 STAY significantly underperformed its lodging REIT and C-Corp peers from its IPO until its announced deal with
                                           Blackstone and Starwood

                   Total Shareholder Returns from STAY IPO up to Deal Announcement(1)
                                                                        Lodging REITs                                                         Lodging C-Corps

                                                                                                                                                           251%
                                                                                                                                                    221%

                                                                                                                                   179%
                STAY is the worst                                                                                                            157%
               performer compared
               to its lodging peers

                                                                                                                      64%
                                                                                                        36%
                                                                            23%           23%
                                                 2%            8%

                    (1)%          (1)%

                    STAY           RLJ          CLDT          PEB           DRH           HST           SHO            INN             RHP   CHH    HLT    MAR
            Source: Bloomberg.
            1) Total shareholder returns between November 13, 2013 through March 12, 2021. Assumes dividends reinvested in security.
                                                                                                                                                                  18
Current STAY Board Oversaw the Company’s Valuation Derating
    STAY’s Board argues that the Sale values Extended Stay at a premium to the Company’s historical trading multiple,
                      but that multiple was depressed because of poor performance and oversight

 ▪ STAY’s Boards point out that the Blackstone-Starwood                                                                                The Boards’ years of strategic missteps and poor
   transaction multiple of 11.6x 2022E EBITDA “represent                                                                              execution have directly led to the derating of STAY’s
   significant premiums to where Extended Stay has consistently                                                                          valuation multiple. Specific examples include:
   traded over its time as a public company, averaging a 9.5x NTM
   EBITDA multiple over the five years prior to the pandemic and
   9.1x NTM EBITDA for the year prior to the pandemic”1                                                                               ▪ Three consecutive quarters of guidance downgrades
                                                                                                                                        after IPO
 ▪ What the Board fails to recognize is that STAY has historically
   traded at a discounted valuation multiple relative to peers                                                                        ▪ Long history of underperforming industry RevPAR
   because of failures in oversight by existing board members                                                                           growth

                                                                                                                                      ▪ Long history of underperforming industry EBITDA
 ▪ STAY was not always valued below its lodging peers
                                                                                                                                        margins

                                                                                                                                      ▪ STAY has failed to execute on its franchise strategy

                                                                                                                                      ▪ Revolving door of senior executives

1) STAY press release dated May 14, 2021: “Extended Stay America Responds to Tarsadia and Highlights Compelling Reasons to Support the Transaction with Blackstone and Starwood Capital”
                                                                                                                                                                                               19
STAY Was Not Always Valued Below its Lodging Peers

                                                In December 2013, STAY was valued above or in-line with lodging peers

   ▪ In December 2013, after STAY’s IPO, the Company was valued at 14.0x NTM EBITDA, above nearly all of its lodging REIT peers
   ▪ STAY also was valued just below the C-Corps average multiple of 14.6x

                                                          Lodging Industry Comparables (EV / NTM EBITDA)
                                                  Select Serv. REITs                  Full Serv. REITs                       Lodging C-Corps

                                                                                                                 15.7x                         15.7x
                                                                                                                         Avg = 14.6x 14.6x
                                        14.0x
                                                                        Avg = 13.3x   13.3x    13.5x     13.6x              13.6x

                                                Avg = 11.4x12.2x              11.9x
                                                                   11.5x
                                                  10.6x

                                        STAY       INN     CLDT        RLJ    RHP     HST       DRH      SHO     PEB        MAR      HLT       CHH

Source: Bloomberg, as of December 31, 2013.                                                                                                            20
Valuation Multiple Contraction
     Between 2013 and 2019, STAY’s EV / EBITDA multiple contracted 33%, whereas select service REITs and C-Corps
                                              saw multiple expansion

                                                               Historical Valuation Multiple (EV / NTM EBITDA)1
                                                                                                                                                                             +12%
                                                             STAY                                                                                                      Multiple Expansion
                                 18.0x                      (33)%
                                                           Multiple                                                                                                                        16.3x
                                 16.0x                    Contraction
                                                                                            (7)%                                      +9%
                                                                                    Multiple Contraction                                                                 14.6x
                                                  14.0x                                                                        Multiple Expansion
                                 14.0x                                                    13.3x
                                                                                                            12.4x                                  12.4x
                                 12.0x                                                                                            11.4x

                                 10.0x                               9.3x

                                   8.0x

                                   6.0x
                                                           STAY                         Full Serv. REITs Avg.                 Select Serv. REITs Avg                         C-Corps Avg.

                                                                                                         Dec. '13        Dec. '19
Source: Bloomberg as of December 31, 2013 and 2019.
1) Full Service REITs include: DRH, HST, RHP, RLJ and SHO. PEB is excluded because it was not a public company in 2013. Select Service REITs include: CLDT and INN. C-Corps include: CHH, HLT and MAR.
                                                                                                                                                                                                         21
3 Consecutive Quarters of Reduced Guidance After IPO
      In STAY’s first three quarters as a public company, it lowered is full year 2014 net income guidance every quarter,
                           resulting in a 21% decline from the $192mm midpoint of its initial guidance

                                            STAY FY 2014 Net Income Guidance History

                           $176 - $207mm     $174 - $205mm
                                              (1)% decline
                                                             $164 - $194mm
                                                              (7)% decline

                                                                              $146 - $155mm        $151
                                                                               (21)% decline   (21)% decline

                            Feb. 26, 2014      May 7, 2014    July 31, 2014     Nov. 7, 2014    FY 2014 Actual

Source: Company filings.
                                                                                                                            22
History of Underperforming Industry RevPAR Growth

             STAY RevPAR has underperformed its peers in 17 of 24 quarters from its IPO in 2014 through 2019

▪ The only period of outperformance was from Q2 ‘15 to Q4 ‘16, when STAY’s then controlling shareholders (including Blackstone) were
  selling

                                                                      STAY Relative RevPAR Performance vs Peers1
                                                                                                         Controlling shareholder sell-downs

                                                800
                                                           Periods of
                 Basis Points of Change (bps)

                                                600     underperformance                                                                                                                                      Periods of underperformance
                                                400

                                                200

                                                  -

                                                (200)

                                                (400)

                                                (600)

                                                                                                                                                                                                                  3Q19
                                                        1Q14

                                                               2Q14

                                                                      3Q14

                                                                             4Q14

                                                                                    1Q15

                                                                                           2Q15

                                                                                                  3Q15

                                                                                                         4Q15

                                                                                                                1Q16

                                                                                                                       2Q16

                                                                                                                              3Q16

                                                                                                                                     4Q16

                                                                                                                                            1Q17

                                                                                                                                                   2Q17

                                                                                                                                                          3Q17

                                                                                                                                                                 4Q17

                                                                                                                                                                        1Q18

                                                                                                                                                                               2Q18

                                                                                                                                                                                      3Q18

                                                                                                                                                                                             4Q18

                                                                                                                                                                                                    1Q19

                                                                                                                                                                                                           2Q19

                                                                                                                                                                                                                         4Q19
        1) STR Extended Stay – Lower Segment RevPAR performance.                                                                                                                                                                            23
History of Underperforming Industry EBITDA Margins

   Between 2013 and 2019, STAY saw its EBITDA margins decline 186bps while most peers saw an expansion

                                             Lodging REITs - 2013 to 2019 EBITDA Margin Change (bps)1

                                                Select Service Lodging REITs                                                     Full Service Lodging REITs

                                                                                                                                                              581

                                                                                                                                                   314
                                                                                                                    265          277
                                                                                      247

                                                        (86)
                        (186)

                        STAY                          CLDT                            INN                          SHO           HST              DRH         RHP

    Source: STR and company filings
    1) PEB and RLJ excluded because of large scale acquisitions made during this time period that make results not comparable.                                      24
STAY Has Failed to Execute its Franchise Strategy

      STAY’s franchise efforts have disappointed as franchise unit openings have vastly underperformed targets

                                                                     STAY – 2016 Investor Day New Franchise Strategy Plan
▪ At STAY’s June ‘16 investor day, the Company
  launched a new franchising strategy and set out
  a target that by 2021, STAY would have 40 new
  build franchise units and 150 refranchised units
  from sales of existing owned properties

▪ As of Q4 ‘20, STAY had only opened 5 new
  build franchise units (13% of target)

                                                      Target of 40                                                          Target of 150
                                                     franchise new                                                          refranchised
▪ As of Q4 ‘20, STAY had only sold 73 units to be        builds                                                                 units
  refranchised (49% of target)

▪ STAY has never hired a full, competent team to
  execute on its franchise strategy

                                                                                                                                            25
Revolving Door of Senior Executives

              Between July 2014 and September 2020, STAY employed 4 different CEOs and 4 different CFOs

▪ The constant executive turnover led to confusion over the Company’s long-term strategic goals and questions about the Company’s
  governance by public investors

▪ The three prior CEOs all resigned from the Company on their own accord

                        Start                 Tenure
        CEO             Date      End Date    (Years)                     Prior Experience                         Decision
     Jim Donald        Nov. ’13   Aug. ‘15      1.8             CEO of Starbucks and Pathmark Stores            Resigned as CEO

    Gerry Lopez        Aug. ’15   Dec. ’17      2.4      CEO of AMC Entertainment and President of Starbucks    Resigned as CEO

 Jonathan Halkyard     Jan. ’18   Nov. ’19      1.9     CFO of Extended Stay and CFO of Caesars Entertainment   Resigned as CEO

                                                          CEO of Woodspring Hotels and EVP Global Brands at
    Bruce Haase        Nov. ’19   Present       1.1                                                               Current CEO
                                                                           Choice Hotels

                                              Tenure
       CFO           Start Date   End Date    (Years)                    Prior Experience
   Peter Crage        Nov. ’13     July ’14     0.7                      CFO of Cedar Fair

Jonathan Halkyard     Aug. ’14     Jan. ’18     3.4                CFO of Caesars Entertainment

  Brian Nicholson     May ’18      Sept ’20     2.3      CFO of The Fresh Market, VP Finance Extended Stay

  David Clarkson      Sept ’20     Present      0.3                 VP Finance – Extended Stay
                                                                                                                                    26
STAY Underperformed the Board’s Own EBITDA Target Every Year

            For 7 years, the Board set a low bar for performance and yet the Company missed these lowered targets

▪ EBITDA performance missed the Boards’ targets / expectations every year from 2013 to 2019

▪ Nevertheless, the Board lowered its compensation threshold, sending a message to management that lower EBITDA was acceptable

($mm)                                   2012   2013     2014     2015     2016     2017     2018     2019
Actual EBITDA ($mm                      $434   $518     $557     $603     $616     $623     $600     $535
 % vs Threshold                                12.9%    (0.3)%   2.6%     2.6%     4.0%     0.0%     (2.7)%
 % vs Target                                   (1.3)%   (7.8)%   (0.6)%   (2.7)%   (1.1)%   (6.3)%   (8.7%       Perennial Underperformance

Threshold                                      $459     $559     $588     $600     $599     $600     $550
 % vs Prior Year Actual EBITDA                 5.8%     7.8%     5.6%     (0.5)%   (2.7)%   (3.7)%   (8.3)%      Low Expectations

Target                                         $525     $604     $607     $633     $630     $640     $586
 % vs Prior Year                               21%      16.5%    9.0%     5.0%     2.3%     2.7%     (2.3)%

  Sources: STAY annual proxy filings.                                                                                                         27
STAY Has Missed Out on Major Lodging Industry Trends
 Over the past 7 years, lodging companies have used one of three well understood strategies to enhance value, but
                                  STAY has not adopted any of these approaches

▪ The major lodging industry strategic trends over the past
                                                                                1             2             3
  several years have included:                                               Franchise    M&A / Capital   Opco /
                                                                  Company     Growth       Recycling      Propco
  1)    Franchise unit growth,
  2)    M&A or capital recycling programs and
  3)    Migration into asset-light or asset-heavy only business
        strategies (opco or propco)
▪ STAY’s Boards have failed to execute on these
  substantial opportunities

       - STAY had almost no franchise unit growth

       - STAY has conducted a cumulative $650mm in
         dispositions since 2015 and made zero acquisitions

       - STAY has decided to remain an orphan as an owner-
         operator and the only lodging company structured
         as a paired-share

                                                                                                                    28
Missed Strategy Opportunity: Franchise Unit Growth                                                                                                 1

Since the launch of STAY’s franchise program in 2018, the Company has opened 5 new development franchise units
   through Q4 ‘20, while competitor Choice Hotels’ Woodspring brand has opened 50 units over that same period

                                                            Cumulative Organic New Franchise Development (Units Opened)

                                                                                                                                          50
                                                                                                                                 44
                                                                                                                        40
                                                                                                               36

                                                                                                   29
                                                                                         25
                                                                                21
                                                                       15

                                                               8
                                                    6                                                                                          5
                                           4                                                                        3        4        4
                                                                                     1        1         2
                                               0        0          0        0

                                          Q2 '18   Q3 '18     Q4 '18   Q1 '19   Q2 '19   Q3 '19    Q4 '19      Q1 '20   Q2 '20   Q3 '20   Q4 '20
                                                                                CHH - Woodspring        STAY

 Sources: STAY and CHH company filings.                                                                                                                29
Missed Strategy Opportunity: M&A or Capital Recycling Programs                                                  2

 Many lodging companies have either pursued M&A or undertaken multi-billion dollar capital recycling programs

                           M&A Activity                               Capital Recycling
                    Acquirer              Target            Company         Asset Recycling Activity

                                                                        $3.3bn of dispositions and $1.8bn of
                                                                        acquisitions since 2018

                                                                        $1.1bn of dispositions and $1.5bn of
                                                                        acquisitions since 2015

                                                                        $994mm of dispositions and $2.0bn of
                                                                        acquisitions since 2010

                                                                                                                    30
Missed Strategy Opportunity: Splitting the Brand from Real Assets                                                                    3

            Since 2017, several lodging companies have separated their brands from their real assets

    Date                         Jan 2017                   Feb. 2018                May 2018                  June 2018
    Transaction                Opco / Propco              Opco / Propco            Opco / Propco             Opco / Propco

                                                      Woodspring sold brand    LaQuinta brand sold to
                             Hilton spun off asset-                                                      Asset-heavy timeshare
                                                       to Choice Hotels and      Wyndham and real
    Description                heavy hotels and                                                         business spun-off into its
                                                        assets to Brookfield    estate spun-off into
                           timeshares businesses                                                             own company
                                                            Properties            Corepoint REIT

    Consolidated Entity

    Brand (Opco)

    Real Estate (Propco)

                                                                                                                                         31
STAY Has Become an Orphan in the US Lodging Landscape                                                                                   3

 The US lodging market has bifurcated itself into two groups: C-Corps (brand owners) and REITs (property owners)

▪ Extended Stay America and Hyatt (a controlled company) are the only remaining major lodging companies that own brand and properties

▪ Extended Stay America is the ONLY remaining single branded company and the ONLY paired shared publicly traded lodging company

                                               C-Corp (Brands)              Orphans             REITs (Properties)
                   Asset Strategy                 Asset-Light                Hybrid                Asset-Heavy
                   Representative
                   Companies

                                                                                                                                            32
STAY’s New Brand Launch Was Inadequately Planned

    The Premier Suites brand launch had no execution plan and is indicative of poor planning and bad execution

▪ On February 26, 2021, STAY announced the launch of a new brand “Extended Stay America Premier Suites” and renaming the core brand
  “Extended Stay America Suites”

▪ The STAY management team could not answer even the most basic details about the Premier Suites brand launch

   Topic                                                                                  Questions we asked                                                             Company Response1
                                                   How does the “Premier Suites” prototype differ from prior prototypes with respect to construction costs
   Prototype Construction Costs                                                                                                                              No detail
                                                   and format?
   Property returns                                Prior prototype margins were 54% to 61%, what should the new target margins be?                           No detail
                                                   Prior prototype returns targeted unlevered cash on cash returns of 12%, what are the new target
   Franchisee returns                                                                                                                                        No detail
                                                   returns?

                                                   Premier Suites will offer: i) signature bedding and ii) free enhanced breakfast. Who are the sourcing
   Sourcing partners                                                                                                                                         “In negotiations” with potential partners
                                                   partners to ensure consistency and how will they price efficiently on a small unit base of 30 hotels?

                                                   With a target net-unit-growth (“NUG”) of 5% to 7%, which would be above industry peers, does STAY
   Development stimulus efforts                    plan to use any incentives such as key-money, discounted royalties or financing that other branded        No plan to use any incentives
                                                   peers use?
                                                   Beyond the $2mm investment in signage to promote the brand, what is the marketing strategy to
   Marketing Strategy                                                                                                                                        Plan to spend $1mm in incremental digital ads
                                                   promote it to customers?
                                                                                                                                                             Do not have a leader for the franchise
                                                   Have you developed a franchise services organization to support the forecasted new franchise
   Franchise Organization Support                                                                                                                            organization; search is ongoing. Have zero
                                                   development units under the Premier Suites brand?
                                                                                                                                                             franchise support members
                                                                                                                                                             Did not consult with franchisees and have no
                                                   Have you collaborated with current or future franchisees on the brand launch and what is their
   Franchise                                                                                                                                                 feedback as franchisees were posted just before
                                                   feedback?
                                                                                                                                                             market announcement

   1) Tarsadia direct discussion with STAY management on March 2, 2021.                                                                                                                                        33
I     Executive Summary

 II    STAY Has Been a Perennial Underperformer

III    Sale of STAY – Wrong Time

IV     Sale of STAY – Wrong Price

 V     Sale of STAY – Wrong Sale Process

VI     Company and Deal Process Suffered from Apparent Fiduciary Disloyalty

VII    Better Alternatives Exist

VIII   Refuting STAY’s Arguments

IX     Conclusion

 X     Appendix; Extended Stay’s Paired-Share Structure
                                                                              34
U.S. Lodging Industry Demand is Cyclical

        The U.S. lodging industry is characterized by long periods of demand expansion and short, sharp contractions

 ▪ Since 1972, there have been five extended periods of relatively robust room demand growth

 ▪ After experiencing a substantial decline in demand in 2020, industry forecasts are for record-setting increases in demand
   in the next three years
                                                                             U.S. Historical Demand Growth (%)
                                     Expansion periods highlighted in gray                                                                      Projected
                                                                                                                                             Expansion Period

                                          1975-1979              1984-1990             1992-2000         2002-2007          2010-2019            21%
                           10%                                                                                            Duration = 10yrs         20%
                                         Duration = 5yrs        Duration = 7yrs       Duration = 9yrs   Duration = 6yrs
                            20%                                                                                                                       13%
                            8%
                            6%
                            4%
                            2%
                            0%
                          (2)%
                          (4)%
                          (6)%
                          (35)%
                          (8)%
                                                                                                                                             (36)%
                         (10)%

                                   2023E
                                   2021E
                                   2022E
                                    1973
                                    1974
                                    1975
                                    1976
                                    1977
                                    1978
                                    1979
                                    1980
                                    1981
                                    1982
                                    1983
                                    1984
                                    1985
                                    1986
                                    1987
                                    1988
                                    1989
                                    1990
                                    1991
                                    1992
                                    1993
                                    1994
                                    1995
                                    1996
                                    1997
                                    1998
                                    1999
                                    2000
                                    2001
                                    2002
                                    2003
                                    2004
                                    2005
                                    2006
                                    2007
                                    2008
                                    2009
                                    2010
                                    2011
                                    2012
                                    2013
                                    2014
                                    2015
                                    2016
                                    2017
                                    2018
                                    2019
                                    2020
                                                                                                                                                                35
Source: BofA Global Research and STR Global
STAY Hotel EBITDA / Key Grows Significantly During Cyclical Recoveries
       STAY Hotel EBITDA / key has rebounded between 46% to 108% in prior lodging cycles and STAY management
                                         projects it to rebound 57% this cycle

                                                                                     STAY Annual Property Level EBITDA / Key ($)

                                                                          2002-2007                                                             2010-2019                                    STAY – Mgmt Projections
                                                                         Lodging Cycle                                                         Lodging Cycle
                                  $12,000

                                  $11,000
                                                                                                                         108% increase                                                        57% increase
                                  $10,000

                                    $9,000
                                                                  46% increase
                                    $8,000

                                    $7,000

                                    $6,000

                                    $5,000

                                    $4,000

                                    $3,000
                                                 2000

                                                        2001

                                                               2002

                                                                      2003

                                                                             2004

                                                                                    2005

                                                                                           2006

                                                                                                  2007

                                                                                                         2008

                                                                                                                2009

                                                                                                                       2010

                                                                                                                              2011

                                                                                                                                     2012

                                                                                                                                            2013

                                                                                                                                                   2014

                                                                                                                                                          2015

                                                                                                                                                                 2016

                                                                                                                                                                        2017

                                                                                                                                                                               2018

                                                                                                                                                                                      2019

                                                                                                                                                                                             2020

                                                                                                                                                                                                    2021E

                                                                                                                                                                                                            2022E

                                                                                                                                                                                                                    2023E

                                                                                                                                                                                                                            2024E

                                                                                                                                                                                                                                    2025E
Sources: Historical results through 2020 based on various Company filings, including April 9, 2004 proxy, April 8, 2010 bankruptcy examiner report (Docket #0913), annual reports and IPO prospectus.
Projections between 2021E and 2025E based on Company’s definitive proxy statement filed on April 26, 2021.
                                                                                                                                                                                                                                            36
Lodging Stock Returns Are Best After a Significant Contraction
U.S. lodging stocks generate the highest returns in the first two years after a lodging recession, and are followed by
                                    an additional 2 to 3 years of positive returns

                                                           U.S. Lodging Stocks Annual Share Performance (%)1
                                                                                 During prior cycles, the first two years after a
                                                                                  contraction generated the highest returns,
                                                                                 followed by several years of positive returns
                                                                                        2002-2007                                                  2010-2019
                                  60%
                                                                                       Lodging Cycle                                              Lodging Cycle
                                                                        45% 46%                                     47% 46%

                                  40%                                                                                                     36%
                                                                                                                                                 30% 32%                      29%            30%
                                                                                                                                                                       25%
                                                                                      21% 20%
                                  20%             14% 13%                                                                                                                                                   13%

                                           0%
                                   0%

                                                                (8)%                                                                                                                 (11)%
                                (20)%                                                                                                                          (13)%                                (13)%
                                                                                                                                  (19)%
                                                                                                    (25)%
                                (40)%

                                                                                                            (47)%
                                (60)%
                                           1999

                                                  2000

                                                         2001

                                                                 2002

                                                                        2003

                                                                               2004

                                                                                      2005

                                                                                             2006

                                                                                                     2007

                                                                                                             2008

                                                                                                                    2009

                                                                                                                           2010

                                                                                                                                   2011

                                                                                                                                          2012

                                                                                                                                                 2013

                                                                                                                                                        2014

                                                                                                                                                                2015

                                                                                                                                                                       2016

                                                                                                                                                                              2017

                                                                                                                                                                                      2018

                                                                                                                                                                                             2019

                                                                                                                                                                                                     2020

                                                                                                                                                                                                            YTD 2021
                                             Expansion periods highlighted in gray
Source: Bloomberg.
YTD 2021 as of May 14, 2021. Returns are average stock performance of MAR, CHH, HST, RHP and SHO. Assumes dividends reinvested in security.                                                                            37
Blackstone’s Investing History in the Lodging Cycle With STAY
     Blackstone has already purchased STAY twice (2004 and 2010) at the beginning of a lodging cycle and sold at a
               substantial gain near the end of the lodging cycle, after Hotel EBITDA / key had recovered

          Date                                                        May 2004                      April 2007                    May 2010                        November 2013                                March 2021
          BX Transaction                                                     Buy                         Sell                        Buy                                   Sell                                    Buy

                                                                     BX Acquires                    BX sells to                 BX consortium                                                            BX and Starwood
                                                                                                                                                              STAY conducts IPO at
                                                                      STAY for                      Lightstone                  acquires STAY                                                            propose acquiring
          Description                                                                                                                                          $20.00 and trades to
                                                                     $19.625 per                      in M&A                        out of                                                              STAY for $19.50 per
                                                                                                                                                              $23.87 on the first day
                                                                        share                        process                      bankruptcy                                                                paired share

          Ent. Value                                                   $3.0bn                           $8.0bn                     $3.9bn                                 $7.8bn                                 $5.8bn
          EBITDA Mult (x)1                                              13.1x                           12.7x                       14.7x                                 12.9x                                   11.6x

                                                                               2002-2007                                                                      2010-2019                                                          New Lodging Cycle
                                      $12,000                                 Lodging Cycle                                                                  Lodging Cycle
                                      $11,000
                                                                                                 BX Sells                                                 BX Sells
            STAY Hotel EBITDA / Key

                                      $10,000
                                       $9,000
                                       $8,000
                                                              BX Buys
                                       $7,000                                                                                      BX Buys                                                                             BX Attempts
                                       $6,000
                                       $5,000
                                                                                                                                                                                                                         to Buy
                                       $4,000
                                       $3,000
                                                2000

                                                       2001

                                                              2002

                                                                      2003

                                                                                   2004

                                                                                          2005

                                                                                                 2006

                                                                                                          2007

                                                                                                                  2008

                                                                                                                         2009

                                                                                                                                   2010

                                                                                                                                            2011

                                                                                                                                                   2012

                                                                                                                                                           2013

                                                                                                                                                                   2014

                                                                                                                                                                            2015

                                                                                                                                                                                   2016

                                                                                                                                                                                          2017

                                                                                                                                                                                                 2018

                                                                                                                                                                                                        2019

                                                                                                                                                                                                                2020

                                                                                                                                                                                                                                  2022E
                                                                                                                                                                                                                         2021E

                                                                                                                                                                                                                                          2023E

                                                                                                                                                                                                                                                  2024E

                                                                                                                                                                                                                                                          2025E
Historical results through 2020 based on various Company filings, including April 9, 2004 proxy, April 8, 2010 bankruptcy examiner report, annual reports and IPO prospectus.
Projections between 2021E and 2025E based on Company’s definitive proxy statement filed on April 26, 2021.                                                                                                                                                        38
1) Estimated enterprise value to current calendar year EBITDA, except for 2010 (because of bankruptcy) and 2021 (because of COVID), in which cases we used a normalized EBITDA (forward calendar year EBITDA).
STAY Board Guidance is a Contrarian Indicator to Blackstone Actions
       It is an odd coincidence that Blackstone has taken the opposite approach to the Boards’ guidance at major
                        inflection points in STAY’s history… and Blackstone has always been right

                   IPO                                   Investor Day                                   Current

Date               November 2013                         June 2016                                      March 2021

Board Outlook      BULLISH                               BULLISH                                        BEARISH

Strategy                                                                                                Concerns around business plan
                   Above market earnings growth          Asset recycling and unit growth
Conveyed                                                                                                execution risk and capital needs
                                                         -   150 dispositions to new franchisees        Uncertainty around asset sales,
Management         2013 to 2015E 2-Year EBITDA CAGR
                                                         -   40 franchise new builds                    $750mm of capex required over next 3
Guidance           of +13.7%
                                                         -   35 owned new builds                        years, reducing cash flow
                   Disappointing growth that missed      Substantial shortfall from operating targets
                   target by 43%                         -  73 dispositions to new franchisees
Actual Results                                                                                          TBD
                   2013A to 2015A 2-Year EBITDA CAGR     -  5 franchise new builds
                   of +7.8%                              -  9 owned new builds
Blackstone Buy
                   BLACKSTONE SELLS                      BLACKSTONE SELLS                               BLACKSTONE BUYS
or Sell
                   Blackstone sells down equity stake    Blackstone sells down equity stake from 21%
Blackstone
                   from 33% to 23% during STAY’s first   down to 0.1% over the next 12 months between   Proposing to acquire STAY
Detailed Action
                   year as a public company              June 30, 2016 to June 30, 2017

                                                                                                                                               39
Boards of U.S. Real Estate Companies Are Rejecting Cash Deals
       Boards are accepting equity transactions because cash deals do not allow shareholders to participate in the
                                 potential stock appreciation of a post-COVID recovery
▪ Of the other 7 real estate related M&A situations that we reviewed since COVID, all have been unanimous board decisions and 5 have been
  stock transactions
▪ There have been two attempted cash deals
    ▪ Paramount Group’s board of directors unanimously rejected a cash proposal that would be a 57% to 65% premium because it was
       “Inadequate and Not in the Best Interest of shareholders”
    ▪ Front Yard Residential buyer had to bump deal price to 63% premium

                                     U.S. Real Estate and Lodging M&A Activity Since COVID (March 2020)
                                                                                  Deal
  Announce                                                                        Value
    Date                         Target                        Acquirer          ($mm)        Payment Type        Status         Premium           Board Decision

 May 4, 2021      Monmouth Real Estate Investment Corp   Equity Commonwealth     $2,809           Stock           Pending                             Unanimous

 April 29, 2021               VEREIT Inc.                 Realty Income Corp.    $16,394          Stock           Pending                             Unanimous

 April 15, 2021        Weingarten Realty Partners         Kimco Realty Corp.     $5,644    Cash and Stock (91%)   Pending                             Unanimous

                                                            Brookfield Asset
 April 1, 2021       Brookfield Property Partners LP                             $6,420    Cash and Stock (50%)   Pending           26%               Unanimous
                                                             Management
March 15, 2021         Extended Stay America, Inc.       Blackstone & Starwood   $5,789           Cash            Pending           15%            2 directors oppose

 Dec. 7, 2020         Ainworth Mortgage Asset Corp        Ready Capital Corp.    $2,145    Cash and Stock (79%)   Closed                              Unanimous

 Nov. 16, 2020             Paramount Group                 BOW Street LLC        $5.685           Cash            Rejected      57% to 65%            Unanimous
                                                                                                                             36% at launch, then
 Oct. 19, 2020           Front Yard Residential            Ares and Pretium      $2,491           Cash            Closed                              Unanimous
                                                                                                                               bumped to 63%

                                                                                                                                                                        40
I     Executive Summary

 II    STAY Has Been a Perennial Underperformer

III    Sale of STAY – Wrong Time

IV     Sale of STAY – Wrong Price

 V     Sale of STAY – Wrong Sale Process

VI     Company and Deal Process Suffered from Apparent Fiduciary Disloyalty

VII    Better Alternatives Exist

VIII   Refuting STAY’s Arguments

IX     Conclusion

 X     Appendix; Extended Stay’s Paired-Share Structure
                                                                              41
Lowest Lodging Cash Acquisition Multiple in Recent History
       Proposed transaction multiple of 12.0x NTM EBITDA is the lowest cash acquisition multiple in the U.S. lodging
                    space in more than 5 years and lower than prior acquisition of STAY by Blackstone

                                                 Historical Lodging Cash Acquisitions (EV / NTM Adj. EBITDA)
                                                                                                                                                                     20.1x

                                         Prior Acquisitions                                    17.8x             17.8x                                                                 17.7x     Avg = 17.4x
                                          of STAY by BX1                      16.5x
                                                                                                                                  16.0x             15.9x
                                                            14.7x
                                                                                                                                                                                                  Current
                                           13.1x                                                                                                                                                   Deal
                                                                                                                                                                                                    12.0x

                                          May '04          May '10          Sept. '15         Mar. '16          May '16          Feb. '18          May '18          Oct. '18         Dec. '18      Mar. '21

                                                                          Strategic        Strategic         Morgans              Hyatt
                      Target             STAY              STAY                                                                                     LaSalle         Two Roads          Belmond       STAY
                                                                           Hotels           Hotels            Hotels             Portfolio

                                                                                           Anbang            SBE Ent.
                      Acquiror         Blackstone       Blackstone       Blackstone                                            Host Hotels        Blackstone       Hyatt Hotels         LVMH       Blackstone
                                                                                          Insurance           Group

                      Value
                                          $3.0             $3.9              $5.6            $8.1              $0.6                $1.0$              $4.5             $0.4              $3.2         $5.9
                      ($bn)
Sources: Belmond proxy filed January 8, 2019, historical transaction multiples provided by Goldman Sachs and J.P. Morgan. STAY company filings.
1) Uses estimated enterprise value to current calendar year EBITDA because NTM estimates were not available and is conservative versus using NTM estimates due to rising earnings environment.                  42
Acquisition Multiple is at a Discount to Public Peers

The acquisition multiple of STAY at 11.6x FY ‘22E EBITDA still values the Company at a 32% discount to its REIT peers

                                          Lodging Industry Comparables (EV / FY ‘22E EBITDA)
                                                                       Lodging REITs                                            Lodging C-Corps

                                                                                                                20.1x
                                                                                                                                              19.6x
                                                                                                18.8x   18.9x           Avg = 17.8x 18.5x
                                                                                        18.2x
                                                                                17.4x                                           17.7x
                                 Avg = 17.0x                            17.1x

                                                       15.1x   15.3x                                                    15.2x
                                14.6x      14.9x

                     11.6x

                     STAY APLE              INN        RLJ     XHR      SHO     HST      PK     RHP     DRH     PEB     WH      MAR     HLT   CHH

              Source: Bloomberg, as of May 14, 2021.
                                                                                                                                                      43
Buybacks Were Conducted Above $19.50 Deal Price
    For 8 out of the first 9 months in 2018, the STAY board endorsed share buybacks that averaged above the $19.50
                                                        deal price
▪ Over the course of 2018, STAY’s Boards authorized the repurchase of $68mm in stock at a price above $19.50

                                                   Average Price of Share Buybacks ($)
                                                                                                  $21.55
                                                                                      $21.35
                                                                                                               $21.08

                             $19.86                          $19.94                                                     $19.88
                                                 $19.67                  $19.70
       Deal Price = $19.50
                                      $19.36

                             Jan-18   Feb-18     Mar-18      Apr-18      May-18       Jun-18      Jul-18       Aug-18   Sep-18
Amount ($mm)                  $10.0              $13.9       $16.7       $12.3         $3.8       $2.3         $6.5     $2.8

% of 2018 Total               12%                 16%         20%         14%          4%          3%           8%      3%

Source: Company filings.
                                                                                                                                 44
Real Estate Appraisal from 2007 Indicates Inadequate Value
In 2007, HVS International, performed an appraisal on STAY’s assets; even assuming no appreciation in 14 years, the
                         2007 appraisal implies a real estate value of $27.37 per share value
▪ In 2007, HVS International (“HVS”), a division of H&R Valuation Services, Inc. performed an appraisal on each of STAY’s hotels as part of
  the CMBS acquisition financing when Blackstone sold STAY to Lightstone Group
▪ HVS valued STAY’s 683 properties at $8.155 billion
▪ As of Dec. 31, 2020, STAY owned 545 of these hotels and the 2007 appraisal value of these remaining properties was $6.9bn
▪ The 18 new properties STAY has added have a book value of $222mm, implying a total value of $7.2bn for the Company’s 563 properties,
  which implies a share price of $27.37

                                                         Real Estate Appraisal Value
                                         $8,155          $1,191

                                                                                            $222             $7,187
                                                                          $6,964

                                      STAY (2007)     Properies Sold     Remaining      New Properties   STAY (Today)
                                                                         Properties
                       Hotels             683              138              545              18               563
                                                       Properties                                        2007 Appraisal
                       Method        2007 Appraisal                    2007 Appraisal    Book Value
                                                          Sold                                              + Book
                       Per Share                                                                            $27.37
                                                                                                                                              45
2007 Appraisal is Conservative
 STAY has executed on 4 deals and is under contract to sell an additional 4 units at attractive values well above the
                                            2007 real estate appraisal
▪ In 2018 and 2020, STAY sold two assets for valuations 2.2x to 3.0x above the 2007 appraised values
▪ STAY recently disclosed in its definitive proxy that it had an additional 6 properties for sale; we believe the valuation is 1.14x above the 2007
  appraised values to buyers that would not keep the property as a hotel. Through our industry research, we believe we have correctly
  identified these 6 properties
▪ The valuation of the sold properties is $132,296 per key and 1.14x above the 2007 appraisal values

                                                                                  Net       $ / Key    2007 Appraised      Sale Value vs
  Status       Date          Location                                 Keys     Proceeds      Value      Value ($mm)       2007 Appraisal
  Closed       March ’18     600 Guadalupe Street Austin, TX           101       $44.1     $436,535        $20.4              2.16x
  Closed       Nov. ‘20      1000 Hillview Court Milpitas, CA          146       $63.6     $435,315        $21.0              3.02x
                             Subtotal Sales Prior to 2021              247      $107.7     $436,032        $41.4              2.60x

  Closed       Mar. ’21      9100 Waterford Centre Blvd. Austin, TX    126
  Closed       Mar. ’21      2700 Gracy Farms Lane Austin, TX          115
                                                                                           Information Not Provided
  Pending      Q2 ‘21E       507 S. First Street Austin, TX            130
                                                                                                by the Company
  Pending      Q2 ‘21E       2300 W. Loop S. Houston, TX               136
  Pending      Q2 ‘21E       4701 Westheimer Road Houston, TX          110
  Pending      Q2 ‘21E       7979 Fannin St. Houston, TX               154
                             Subtotal Definitive Proxy Deals           771       $102      $132,296        $89.4              1.14x
                                                                                                                                                      46
New Independent Appraisal Suggests Value is Higher than 2007 Appraisal
    An independent appraisal company, Berkadia, that we engaged, valued 6 properties at $227mm (+51% higher than
        the 2007 appraised values) and indicated there would be significant interest in STAY’s real estate portfolio

▪   While STAY has refused to retain a real estate
                                                                                                                                   Advisor
    broker to help it assess asset sale potential in its                                                       2007      Advisor    Value    % Uplift
    portfolio, Tarsadia retained national commercial                                                         Appraisal    Value     $/Key    vs 2007
    real estate broker, Berkadia, to help us assess the    Address                    City, State     Keys    ($mm)      ($mm)     ($000s)    Value
    potential value of certain STAY hotel assets to a
    multi-family developer                                 15805 NE 28th St.         Bellevue, WA     163      $38.4      $46.8    $287k      +22%
▪   Berkadia undertook a bottoms-up analysis on 6
                                                           11400 Main St.            Bellevue, WA     148      $29.4      $38.5    $260k      +31%
    specific properties assessing local market rents,
    expense ratios and potential market demand to
    estimate the earnings potential of these assets as a   1830 Gateway Dr.          San Mateo, CA    137      $20.1      $49.9    $364k     +148%
    multi-family property
                                                           330 Cypress Dr.            Milpitas, CA    161      $29.0      $47.6    $296k      +64%
▪   The valuation assumes the developer can generate
    a mid-teens 3-year IRR using local cap rates to        7444 Mission Valley Rd.   San Diego, CA    141      $22.1      $25.5    $181k      +16%
    estimate exit values
                                                           3560 N. Marshall Way      Scottsdale, AZ   121      $11.3      $18.2    $151k      +61%
▪   Berkadia’s valuations imply a $260k / key value (vs
    Blackstone-Starwood deal at $92k / key) and are        Total                                      871     $150.3     $226.6    $260k      +51%
    51% higher than the 2007 appraised values

                                                                                                                                                        47
Real Estate Liquidation Value Substantially Higher than Deal Price

                               Our real estate liquidation value implies a share price of $28 to $31 per paired share

▪ We have estimated that STAY’s real estate values have increased between 15% to 25% in the 14 years since the 2007
  appraisal
▪ We have also assumed a 12% of gross proceeds tax leakage

                                                         2007 Appraisal   15% Appreciation   25% Appreciation
                             Real Estate Value              $7,187             $8,265             $8,984
                             Tax Leakage (12%)               (862)             (992)             (1,078)
                             Net Value                      $6,325             $7,273             $7,906
                             Net Debt                       (2,323)           (2,323)            (2,323)
                             Equity Value                   $4,001             $4,950             $5,582

                             $ / Share Value                $22.531            $27.88             $31.44        Implied Share Value

                             Keys                           62,700             62,700             62,700
                             Ent. Value / Key              $114,625          $131,819           $143,281

   1) Equal to $27.37 estimated value less tax leakage
                                                                                                                                      48
I     Executive Summary

 II    STAY Has Been a Perennial Underperformer

III    Sale of STAY – Wrong Time

IV     Sale of STAY – Wrong Price

 V     Sale of STAY – Wrong Sale Process

VI     Company and Deal Process Suffered from Apparent Fiduciary Disloyalty

VII    Better Alternatives Exist

VIII   Refuting STAY’s Arguments

IX     Conclusion

 X     Appendix; Extended Stay’s Paired-Share Structure
                                                                              49
STAY Made No Effort to Invite Potential Acquirors Into the Process
                Since July of 2017, the STAY Boards have instructed its financial advisers to reach out to a total of 2 potential
                                               acquirers other than Blackstone and Starwood
    ▪ The supposed two “potential” acquirers that the STAY Board and its financial advisers reached out to did not even sign a confidentiality
      agreement to review STAY’s prospects

                                                                                                                                                        May 2021
                                                                                                                                                       Present day
                                                                                                                        March 2020
                                                           July 2017                                                    World Health Organization
                                                           Approached 1 potential                                       declares COVID-19 a
                                                           acquiror, which declined                                     “pandemic”. U.S. hotel
                                                           engagement                                                   industry experiences largest
                                                                                                                        YoY RevPAR declines in
                                                                                                                        history

           2017                                                   2018                               2019        2020                          2021

                                                                                      July 2018
                                                                                      Approached 1 potential
                                                                                      acquiror, which declined
                                                                                      engagement

Source: Company’s definitive proxy filed April 26, 2021.                                                                                                             50
No Solicitation of Bids Since July 2018
            Goldman Sachs was retained as STAY’s financial adviser on June 1, 2020, but did not reach out to a single party
                                                  about acquiring the Company

                                               Goldman Sachs was not requested to solicit, and did
                                             not solicit, interest from other parties with respect to an
                                              acquisition of, or other business combination with, the
                                               Paired Entities or any other alternative transaction.”

Source: Company’s definitive proxy filed April 26, 2021.                                                                      51
STAY’s Approach to this Sale Process Differs Markedly From Its 2007 Process
When Blackstone controlled the sale process of Extended Stay in 2007, the Company conducted a very different and
                                                thorough process

▪ Despite the deal being $2 billion smaller in 2021 than in 2007, the Company is claiming there were no parties to contact to test interest in the
  transaction

                                                                     (Blackstone)                         (NYSE: STAY)
                                                                  2007 Sale Process1                    2021 Sale Process2          Commentary

                                                            ~150 potential investors                                                Boards did not make any effort to solicit bids
Parties Contacted                                                                                     Zero outreach to parties
                                                            contacted                                                               for the Company

                                                                                                                                    When Blackstone sold the Company, it was
                                                                                                      Zero parties outside of the   able to find over 30 parties to review an
NDAs Executed                                               Over 30 parties signed NDAs
                                                                                                      two buyers signed NDAs        acquisition, but the Boards claim they couldn’t
                                                                                                                                    find a single potentially interested party

                                                            Sellers arranged for staple                                             The prior sale process supported bidder
Availability of Financing                                   financing up to $6.8bn                    No financing offered          interest by arranging financing, this time the
                                                            available to any potential buyer                                        Boards did nothing to attract buyer interest

  1)   Information from Extended Stay, Inc. April 8, 2010 bankruptcy examiner report (Docket #0913)
  2)   Information from STAY proxy filed April 26, 2021.
                                                                                                                                                                                      52
In Recent Lodging Transactions, There Has Always Been Significant Outreach and
Interest
Other sale processes involved substantial outreach and bidder interest, as indicated in the proxy statements of prior
                                                   transactions
▪ The number of parties contacted range from 17 to 180

▪ When Blackstone sold STAY to Lightstone Group in April 2007, that process involved reaching out to 150 potential acquirers

                                                            Parties Contacted During Sale Process
                                                                                                                                             180
                                                                                                                               150
                                                                                                                  127

                                                                                                      30
                                                               17           20          20
                                                    0

                      Ann. Date                  March
                                                  STAY’21   Sept.
                                                              BEE’15     May
                                                                          LHO’18     April ’17
                                                                                      Felcor     March
                                                                                                   HOT‘16       Dec. ’18
                                                                                                                Belmond     April
                                                                                                                              ESA ‘07    May ‘16Hotel
                                                                                                                                        Morgans
                                                 Extended   Strategic    LaSalle      Felcor     Starwood                   Extended       Group
                                                                                                                Belmond                  Morgans
                      Target                       Stay     Hotels &      Hotel      Lodging     Hotels &                     Stay
                                                                                                                  Ltd.                  Hotel Group
                                                 America    Resorts     Properties    Trust       Resorts                   America
                                                                                     BCAP,                                 BAML, Bear
                      Adviser(s)                   GS         JPM        GS, Citi                Citi, Lazard   GS, JPM                     MS
                                                                                     BAML                                   Stearns

                      Deal Value ($bn)             $5.9       $5.6        $4.5         $2.5         $13.0        $3.2         $8.0         $0.6

Sources: Definitive Proxy of each transaction.                                                                                                          53
Low Rate Environment Makes STAY Attractive to Investors
With record low interest rates and compressed credit yields, STAY’s durable free cash flow should be attractive to a
                                broad set of institutional investors and pension funds

                    US 10-Year Treasury Rate (%)                                  US Credit Spreads (bps) 1
                                                             2500
      6.00%

      5.00%                                                  2000

      4.00%
                                                             1500

      3.00%
                                                             1000
      2.00%

                                                              500
      1.00%

      0.00%                                                     0

                                                                    2006

                                                                           2007

                                                                                  2008

                                                                                         2009

                                                                                                2010

                                                                                                       2011

                                                                                                              2012

                                                                                                                     2013

                                                                                                                            2014

                                                                                                                                   2015

                                                                                                                                          2016

                                                                                                                                                 2017

                                                                                                                                                        2018

                                                                                                                                                               2019

                                                                                                                                                                      2020

                                                                                                                                                                             2021
 1) ICE BofA US High Yield Index Spreads
                                                                                                                                                                                    54
Private Equity Dry Powder For Acquisitions Has Increased
 Private equity has over $1.9 trillion in dry powder available to make acquisitions and should have been contacted
                                               about STAY’s sales process

Global Private Equity Dry Powder ($USD bn)                                                                                                                  N. America Private Equity Dry Powder ($USD bn)
$2,000                                                                                                                                                       $1,000

$1,800                                                                                                                                                        $900

$1,600                                                                                                                                                        $800

$1,400                                                                                                                                                        $700

$1,200                                                                                                                                                        $600

$1,000                                                                                                                                                        $500

 $800                                                                                                                                                         $400

 $600                                                                                                                                                         $300

 $400                                                                                                                                                         $200

 $200                                                                                                                                                         $100

   $0                                                                                                                                                           $0
         2000
                2001
                       2002
                              2003
                                     2004
                                            2005
                                                   2006
                                                          2007
                                                                 2008
                                                                        2009
                                                                               2010
                                                                                      2011
                                                                                             2012
                                                                                                    2013
                                                                                                           2014
                                                                                                                  2015
                                                                                                                         2016
                                                                                                                                2017
                                                                                                                                       2018
                                                                                                                                              2019
                                                                                                                                                     2020

                                                                                                                                                                      2000
                                                                                                                                                                             2001
                                                                                                                                                                                    2002
                                                                                                                                                                                           2003
                                                                                                                                                                                                  2004
                                                                                                                                                                                                         2005
                                                                                                                                                                                                                2006
                                                                                                                                                                                                                       2007
                                                                                                                                                                                                                              2008
                                                                                                                                                                                                                                     2009
                                                                                                                                                                                                                                            2010
                                                                                                                                                                                                                                                   2011
                                                                                                                                                                                                                                                          2012
                                                                                                                                                                                                                                                                 2013
                                                                                                                                                                                                                                                                        2014
                                                                                                                                                                                                                                                                               2015
                                                                                                                                                                                                                                                                                      2016
                                                                                                                                                                                                                                                                                             2017
                                                                                                                                                                                                                                                                                                    2018
                                                                                                                                                                                                                                                                                                           2019
                                                                                                                                                                                                                                                                                                                  2020
  Source: Preqin                                                                                                                                                                                                                                                                                                         55
STAY’s Sale Process Was Rushed

                                      STAY’s sale process was the shortest of any lodging company since at least 2015

▪ The median duration of comparable lodging sale processes was 174 days, 3.2x as long as the abridged 55 day process
  that STAY’s Boards oversaw

                                                                      Duration of Sale Process (Days)
                                                                                                                                            614

                                                                                                                             217
                                                                                                             200

                                                                                                                                                   Median = 174 Days
                                                                               144            148

                                                                77
                                                 55

                                           Extended Stay   LaSalle Hotel   Belmond Ltd. Strategic Hotels Starwood Hotels Felcor Lodging Morgans Hotel
                                              America       Properties                     & Resorts        & Resorts         Trust        Group

Sources: Definitive Proxy of each transaction.                                                                                                                         56
Removal of Go-Shop Provision For De Minimis Value
 After not reaching out to any potential competing acquirers, the STAY Boards’ gave up the “go-shop” provision for
                         25 cents per paired share, a de minimis 1% increase in the deal price

▪ At the March 6, 2021 meeting when it was decided that STAY would engage Blackstone in discussions, the Boards’ insisted that a “go-shop”
  provision was to be included in the agreement, permitting the Paired Entities to solicit alternative proposals, in recognition of the Boards’
  intention not to solicit any other potential buyer interest prior to signing

▪ But, on March 13, 2021, Blackstone orally conveyed to STAY’s financial advisor, Goldman Sachs, that it would increase its bid from $19.25 to
  $19.50 in exchange for the elimination of the “go-shop” clause

▪ In return for $0.25 (a +1.3% increase in the bid price), the STAY Boards gave up their opportunity to reach out to any potential competing
  bidders

                                                                                                                                                  57
Starwood Capital Has Strong Strategic Interest in Acquiring STAY
          Starwood is a strategic buyer that can generate synergies from an acquisition of STAY, but the Boards’ allowed
                  Starwood to partner with Blackstone rather than soliciting Starwood as a competing bidder

          Starwood History in Extended Stay Industry                                                               STAY and InTown Suites Synergies
   ▪ May 2010: After 19 hours and 11 rounds of bidding, Starwood                                         ▪ The strategic rationale of an InTown Suites and STAY merger
     loses bankruptcy court auction for Extended Stay America to a                                         would be to rebrand STAY’s lowest Average Daily Rate (“ADR”)
     Blackstone, Centerbridge Partners and Paulson & Co. consortium1                                       rooms into InTown Suites branded properties
   ▪ October 2012: Starwood acquires InTown Suites portfolio from                                        ▪ STAY’s brand would benefit from removing brand diluting properties
     Kimco Realty Group for $735mm, comprised of 138 extended stay                                         from its system and reducing its capex needs
     properties with ~18,000 rooms across 21 states.                                                     ▪ InTown would benefit by increasing the number of units in its
                                                                                                           system, cost savings from economies of scale and leveraging
   ▪ May 2015: Starwood acquires InTown Suites portfolio from Mount                                        STAY’s infrastructure
     Kellett Capital Management LP, comprised of 50 extended stay
     properties with ~6,106 rooms
                                                                                                                  2019A Results
   ▪ April 2020: Starwood files a 13D in STAY, announcing it holds
     8.5% of the Company’s shares                                                                                 Properties             196                557
                                                                                                                  ADR                  $40.67              $67.97
   ▪ March 10, 2021: Starwood negotiates a confidentiality agreement
                                                                                                                  Occupancy             82.1%              76.7%
     with STAY and completes its due diligence of the Company in
     4 days and joins Blackstone in acquisition of the Company                                                    RevPAR               $33.39              $52.16
                                                                                                                  Room Sales            $304               $1,196
                                                                                                                  NOI (a)               $162                $590
1) https://www.travelweekly.com/Travel-News/Hotel-News/Starwood-Capital-fails-in-bid-for-Extended-Stay
                                                                                                                  % margin              53.3%              49.3%
                                                                                                                                                                                58
You can also read