METHODS AND TOOLS FOR MORE AND BETTER URBAN NATURE
←
→
Page content transcription
If your browser does not render page correctly, please read the page content below
METHODS AND TOOLS
                        FOR MORE AND BETTER
                             URBAN NATURE

                         More Green Cities for Europe, January 2021

    CAMPAIGN FINANCED      THE EUROPEAN UNION SUPPORTS
    WITH AID FROM THE   CAMPAIGNS THAT PROMOTE RESPECT
E   EUROPEAN UNION                 FOR THE ENVIRONMENT
2   GREEN NORM 2.0

         CONTENTS

         A GREEN NORM FOR URBAN NATURE                                                     3
            Why Do We Need a Green Norm?                                                   3
            This Is How Danish Municipalities Work with Urban Nature                       5
            Green Square Metres in the Municipalities                                      6
            Estimates of the Municipalities                                                7

         TEN METHODS FOR CREATING MORE AND BETTER URBAN NATURE                             8

         MORE URBAN NATURE                                                                9
         01 Green Square Metres                                                          10
         02 Biofactor                                                                    13
         03 Distance to Green Areas                                                      18
         04 Green Infrastructure                                                         20
         05 Trees in the City                                                            24

         BETTER URBAN NATURE                                                             30
            Ecosystem Services                                                           30
            Quality of Nature                                                            31
            Economy                                                                      31
         06 Map Ecosystem Services                                                       32
         07 Mitigation Hierarchy                                                         36
         08 Ecological Offsetting                                                        38
         09 Wild Nature and Quality of Nature                                            40
         10 Economy of Urban Nature                                                      42

         CITIZENS AND URBAN NATURE                                                       46

         SOURCES                                                                         49

         METHOD
         Green Norm 2.0 is a follow-up to the first proposal for a Green Norm for urban nature, which
         Green Cities, Denmark, published in August of 2019. As a basis for the Green Norm, Green
         Cities, Denmark, collected knowledge from 29 Danish municipalities with cities of more than
         20,000 inhabitants. In addition, Green Cities, Denmark, collected statistics, professional and
         scientific reports as well as knowledge from organisations, professionals and companies.

         Green Cities, Denmark, has prepared the proposal for Green Norm 2.0 under the campaign
         “Green Cities for a Sustainable Europe” in February 2020.

         Green Cities, Denmark, is a collaboration between five trade associations: The Association of
         Danish Landscape Gardeners, The Association of Danish Landscape Architects, The Association
         of Danish Nurseries and The Association of Danish Park and Nature Keepers.
GREEN NORM 2.0   3

A GREEN NORM FOR
URBAN NATURE
In the summer of 2019, Green Cities presented the first proposal for a Green Norm, which
prompted good and constructive feedback. Both the feedback and many comments have
been valuable to the work on this extended proposal for a Green Norm.

Green Norm 2.0 is Green Cities’ proposal for how we can work, in practice, to incorporate
more and better nature into the larger cities in Denmark. The norm is particularly aimed
at politicians, civil servants, professionals and other urban development officials.

WHY DO WE NEED A GREEN NORM?
More and more people are moving to the big cities. This puts enormous pressure on
the acreage that can be developed for urban nature and on the existing green spaces
that are often sought used for house building.
Furthermore, our society faces critical challenges such as climate change, stress
and biodiversity loss. Many of these challenges can be solved by including more and
better urban nature in development and urban planning.

    “      The investment in a green environment is demanded by
    citizens and house hunters alike. A green environment makes
     for a more beautiful city, creates better physical and mental
          health, supports the development of good communities,
       provides a number of environmental benefits and increases
         the number of plants and animals – and on top of that it
           creates social value. Overall, the investment in a green
                                      environment is a good idea.”
                                                                                  Jane Jegind
                                    City and Culture Councillor, the city of Odense, Denmark

  With Green Norm 2.0, Green Cities proposes
  that we set ambitious goals for the state of
  urban nature in the cities of Denmark.
4   GREEN NORM 2.0

           THE DANISH MUNICIPALITIES WANT
           TO BE GREENER
           Our studies indicate that the Danish municipalities want to be
           greener and that they want more and better urban nature. At the
           same time, however, they often lack concrete guidelines and tools
           to achieve this. Also, as the competition over the available square
           metres is fierce, especially in the large cities, the municipalities find
           it difficult to speed up their green initiatives, which may result in
           green initiatives being left out for the sake of development.

           Our research of 29 municipalities with cities of more than 20,000
           inhabitants clearly shows that the way the municipalities go about
           implementing green initiatives varies greatly.

           A green norm, with standards and guidelines for how to work on
           establishing more good quality green urban spaces, could help the
           municipalities to prioritise and focus their work on bringing more
           nature into the cities. At the same time, a green norm will provide
           politicians and other people responsible with a tool with which to
           create comparable initiatives in the larger Danish cities.

           In the Green Norm, we present different examples of how muni-
           cipalities work today with urban nature in Denmark and in other
           countries.

           We propose a number of different methods that could be included
           in a green norm. The proposals are based on an interplay between
           science and proven experience – and touch on policy, urban plan-
           ning, design and day-to-day operations.

           In general, the Danish municipalities
           clearly want more and better urban
           nature but often there is a lack of ideas
           for which concrete initiatives to
           implement to accomplish this.

           Green Cities believes that a green norm
           containing concrete methods and tools
           can help fulfil the wish for more nature
           in the cities.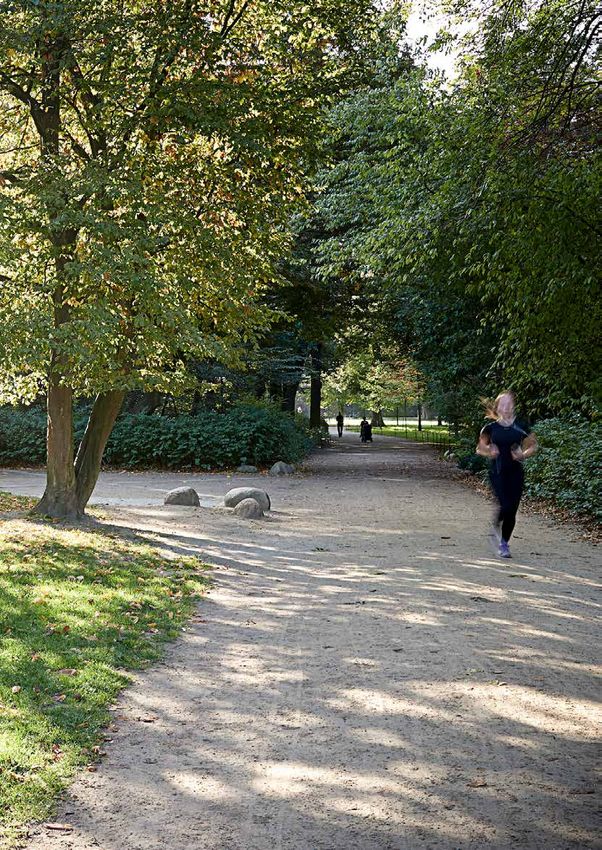
GREEN NORM 2.0   5

THIS IS HOW DANISH MUNICIPALITIES WORK
WITH URBAN NATURE
We have been in contact with 29 municipalities that have cities with a population of over 20,000
inhabitants. Furthermore, we have read and studied their portals to gain insight into their strategies,
policies and plans. Based on this, we have created an overview of how the major cities in Denmark
work with urban nature.

The study should be seen as providing an overview – an indication of how the municipalities work
– since not all municipalities have responded to our request. In addition, the municipalities may
have policies, strategies and initiatives that we have not had access to.

We have been able to locate a policy, a strategy or a plan with an independent focus on urban
nature in three of the 29 municipalities examined – and one municipality has a strategy for urban
nature on the way in 2020.
In the remaining municipalities, urban nature is most often included in other policies and strategies
– such as municipal development plans, municipal policies for nature development, strategies for
climate proofing or long-term visions for the development of the city.

These are our findings:

DISTANCE
Seven municipalities have defined how far their inhabitants should live from an urban green space.

WILD URBAN NATURE
Ten municipalities have identified initiatives that create more wild urban nature.

GREEN CLIMATE PROOFING
20 municipalities want to include more nature in their climate proofing projects, however, only
three have described how to do this.

MORE GREEN
21 municipalities would like more elements of urban nature, such as trees and green roofs, but only
nine of them have a plan for how to achieve it.

BIODIVERSITY
27 municipalities focus on biodiversity. 14 of these municipalities have a plan for ensuring or in-
creasing biodiversity in the municipality.

TREES
Seven municipalities have an independent tree policy or strategy and another municipality relea-
ses one in 2020. Three municipalities have a concrete plan for increasing the number of trees.

PARKS
Six municipalities have a public park policy or strategy while two municipalities have one in the
works.
6   GREEN NORM 2.0

         GREEN SQUARE METRES IN
         THE MUNICIPALITIES
         We have tried to establish how many green square metres are available
         per inhabitant in the 29 municipalities. We have succeeded in getting          CONCRETE
         estimates from 16 municipalities. Several of these municipalities have         OBJECTIVE
         inquired which types of areas to include as green square metres since          The Danish city of Odense
         they usually do not make this type of estimate.                                wants to increase the num-
                                                                                        ber of green areas in the
         Also, there is no single uniform definition of green square metres,            extended city centre from
         green areas or green spaces.                                                   264,911 square metres in
                                                                                        2018 to 266,911 square
         Therefore, the figures of the municipalities should not be compared unless     metres in 2021.
         the same types of areas are included. However, the figures, such as the goal   Source: The Park and Road Operations
         of the Danish city of Odense, can be compared over time in the individual      of the Danish city of Odense
         municipality and can thus also be used as baseline and target figures.
GREEN NORM 2.0   7

ESTIMATES OF THE MUNICIPALITIES
The municipalities calculate their green spaces very differently. As can be seen from the overview,
it varies considerably which areas are included as green square metres.

Some municipalities have made an estimate for the whole municipality, some for a single city and
others for a part of town. The estimates are therefore divided into three categories, depending on
which area they are calculated for.

Urban municipalities, in which the entire municipality is a city, are included in the category “city”.

                                                                                                      GREEN SQUARE METRES
                                                                                                                    PER
 MUNICIPALITY IN DENMARK                                                                              TOTAL         INHABITANT
 The Municipality of Herning: forest, nature, landscape, parks and landscape, play-                    32,331,321          364
 grounds, allotment gardens, schools, outdoor sports facilities, municipal roads and
 verges, road closures, roads, flower beds etc, area with street trees, parking spaces,
 municipal property, Herning Square, nursing homes, schools, miscellaneous
 The Municipality of Lyngby-Taarbæk: parks and green areas, nature areas, play-                        15,032,000          276
 ground areas (minus roads and areas close by institutions) + non-municipal areas:
 green spaces, natural resorts, castle park
 The Municipality of Aalborg: institutions and municipal buildings, leisure facilities and             41,191,003          193
 ports, green area, outdoor sports facilities, cemeteries, allotment gardens, natural
 resorts, parks, schools, forests, beaches, undeveloped area, paths, nursing homes
 The Municipality of Rudersdal: public green space                                                      7,500,000          135
 The Municipality of Høje-Taastrup: public green space incl buildings. Buildings                        6,700,000          132
 are schools, institutions, city hall and the like
 The Municipality of Randers: parks, small facilities, natural resorts, plant zones,                    9,307,000           95
 village ponds, outdoor sports facilities
 The Municipality of Esbjerg: parks and green spaces                                                   10,480,000          90
 The Municipality of Odense: parks and green spaces                                                    17,500,000           86
 CITY IN DENMARK
 The city of Herning: forest, nature, landscape, parks and landscape, playgrounds,                      7,835,411          157
 allotment gardens, schools, outdoor sports facilities, municipal roads and verges,
 road closures, roads, flower beds etc., area with street trees, parking spaces, muni-
 cipal property, Herning Square, nursing homes, schools, miscellaneous
 The city of Holbæk: recreational areas with urban nature, parks and recreational use                  4,291,600           152
 The Municipality/city of Gladsaxe: public recreational use, allotment gardens,                       10,021,816           144
 public urban nature and outdoor sports facilities
 The cities of Aalborg/Nørresundby: administrative building, childcare centres, green                  15,418,858          111
 area, outdoor sports facilities, cemeteries, allotment gardens, parks, schools/af-
 ter-school care facilities, natural resorts, parks, forests, undeveloped area
 The city of Roskilde: municipally and nationally operated areas. The estimate                         2,196,363            43
 includes publicly owned and operated green areas. The areas of housing associati-
 ons and roads have not been included
 The city of Kolding: green areas. However not forest, football fields, green areas of schools etc.    2,384,195            39
 The Municipality/city of Copenhagen: public, private and national green areas.                       20,024,426            36
 The estimate includes natural resorts, parks, cemeteries, public gardens, outdoor
 sports facilities and smallish green urban spaces (from 2013)
 The Municipality/city of Gentofte: public gardens, parks, natural resorts, cemeteries and              1,686,000           22
 beach parks
 CITY CENTRE IN DENMARK
 The city centre of Vejle: Parks account for 922,218 square metres. Apart from                          1,057,791          n/a
 that the estimate includes an extensive number of subcategories, detailing hedges,
 perennial flower beds, ornamental lawns, natural grass, cut shrubbery etc.
 The estimate also includes stairs, pavement, soft surfaces
 The city centre of Aarhus: lawns, perennial flower beds, flower meadows, bushes,                        897,000           n/a
 scrubs,
Source:   hedges.
        Grønt Indeks.Trees, forests,
                      Green Cities for afootball  fields,
                                         Sustainable      sheltered housing etc. are not included
                                                     Europe.

 The city centre of Odense: green areas                                                                  264,911           n/a
8   GREEN NORM 2.0

           TEN METHODS
           FOR CREATING MORE AND
           BETTER URBAN NATURE
           Below, we present ten methods that can create more and better urban nature in
           Denmark.

           The methods are Green Cities’ substantiated suggestions for elements that can
           potentially be integrated into a green norm for urban nature.

           At the same time, hopefully, they can inspire the people involved to enter into a
           dialogue about urban nature and to make concrete objectives, tools and standards for
           urban nature in Denmark.

           The effort for more and better urban nature must of course be seen in relation to
           – and coordinated with – local conditions in the individual cities.

           Each method is associated with one or more examples of how the method is used or
           can be used.

           Urban nature is the necessary and decisive
           counterbalance to urban densification
           Green Cities, Denmark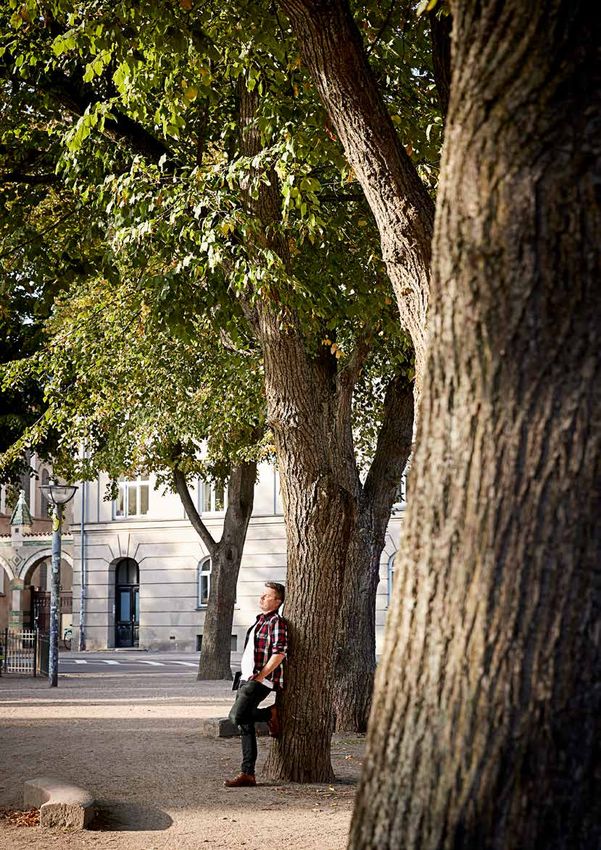
GREEN NORM 2.0   9

FIVE METHODS THAT CAN CREATE MORE
URBAN NATURE
1. NUMBER OF GREEN SQUARE METRES
   The municipalities can be required to estimate the number of green square
   metres in their cities according to a uniform definition.

2. BIOFACTOR
   An ambitious minimum requirement for a biofactor for building and renova-
   ting in cities can be provided at a national level.
   This factor must apply to both private and public projects.

3. DISTANCE TO GREEN AREAS
   The maximum walking distance for inhabitants in metres to a green area,
   which is public and of a certain size, can be established.

4. GREEN INFRASTRUCTURE
   Requirements can be made along the lines that new buildings must, as far
   as possible, have green roofs and that the municipalities must prioritise and
   encourage the construction of green infrastructure, such as green facades
   and nature-based climate adaptation.

5. TREES IN THE CITY
   All municipalities can develop a tree policy which protects existing trees and
   which at the same time focuses on species diversity. The policy can also include
   a concrete plan for increasing the number of trees in the city.

FIVE METHODS THAT CAN CREATE BETTER
URBAN NATURE
6. MAP ECOSYSTEM SERVICES
   Requirements can be made for the ecosystem services to be mapped before
   an urban area is developed or transformed and for a report to be made of how a
   given project may affect the ecosystem services. This can apply to both private
   and public projects.

7. MITIGATION HIERARCHY
   When building or renovating, an evaluation based on the mitigation hierarchy can
   be carried out regarding which initiatives to launch in order to avoid, minimise,
   restore and offset the impact of the initiatives on the value of nature and the
   ecosystem services. This can be a prerequisite for the approval of the project.

8. ECOLOGICAL OFFSETTING
   Municipalities and private developers can be obliged to fully offset the damage
   they cause to the ecosystem services and the value of nature in urban develop-
   ment. Compensation must only be a last resort after the parties involved have
   sought to avoid, minimise or restore the damage.

9. WILD NATURE AND QUALITY OF NATURE
   The municipalities can be required to switch to more nature-like operations on
   the areas of the municipality where recreational use is not significantly in the
   way. They can also be required to measure the quality of nature in the cities’
   green areas on an ongoing basis.

10. ECONOMY OF URBAN NATURE
    Requirements can be made to examine the economic value of relevant green areas
    and urban nature before decisions are made on how to develop the city’s areas.
10   GREEN NORM 2.0

            MORE URBAN NATURE
            FIVE METHODS FOR MEASURING, MAINTAINING OR

           1
            INCREASING THE AMOUNT OF URBAN NATURE

                          GREEN SQUARE METRES
                          Several Danish municipalities already have experience with measuring
                          green areas. The areas can be measured relatively easily, using existing
                          aerial photos. But the definitions of green square metres and areas,
                          and thus what is included, vary greatly1 – see overview on page 7.

                          For example, some municipalities include private areas while others
                          do not. Therefore, it is difficult to compare numbers across cities,
                          municipalities and countries.

                          To find a uniform definition, we could use the publicly accessible green
                          areas as a starting point – like Berlin does – since these are for all inhabi-
                          tants of the city and are not reserved for certain groups or individuals.

                          Such an estimate would show how many green square metres the city
                          offers its inhabitants – no matter whether you own a garden or live in an
                          apartment. It would be possible to monitor the development, identify
                          concrete goals and compare cities.

                          This would give an overall picture of how green a city is. But, as a study
                          from 20162 points out, an objective for increasing green square metres
                          should not stand alone as green square metres say nothing about the
                          quality of the areas. For example, a city without a single tree but with
                          many well-trimmed lawns would appear to be very green if only the
                          number of square metres were evaluated. Therefore, this method
                          should be used together with other methods that can ensure quality.

            GREEN CITIES PROPOSES that the municipalities be required to measure their green square metres in
            the cities in order to follow-up on the development of the cities’ areas and available green square metres
            per inhabitant. A uniform definition of green square metres should be laid down. The definition should cover
            publicly accessible areas which are not reserved for specific individuals or groups and from which everyone
            can therefore benefit.

            Based on the research2 and the experience collected from the Danish municipalities1, we propose the follow-
            ing definition:

            Green square metres in cities equal publicly accessible green areas, which are not reserved for individuals or
            groups, such as parks, roadsides, paths, flower beds, city trees, school areas, playgrounds, gardens of public institu-
            tions, cemeteries, outdoor sports facilities, green spaces, urban forests, natural resorts, green areas close to industry
            and production, green roofs, roof gardens and green facades.
GREEN NORM 2.0 11 EXAMPLES OF OBJECTIVES FOR GREEN SQUARE METRES Germany In 1973, local authorities working with green areas came together and defined some common goals that are still in use today and that many big cities follow. Among the goals is a goal of a minimum of 6-15 green square metres per inhabitant, depending on the conditions of the cities2,3. Berlin, Germany In Berlin, the goal is a minimum of six or seven square metres per inha- bitant, depending on the plot ratio. This goal has been established since the beginning of the 20th century. Both public and private areas are included but they must be accessible to the public. The areas comprise parks, forests and agricultural areas but not private gardens. Berlin maps places where there is a lack of green square metres, and then the city seeks to create parks in publicly owned areas or order inhabitants to ensure space for urban nature if the area is developed3,4. Romania According to an Act from 2015, all cities must have at least 26 green square metres per inhabitant. However, there are no uniform definitions within the country to ensure accurate figures2. Copenhagen, Denmark citat The Municipality of Copenhagen has previously had a goal that the number of green square metres should at least correspond to the number in 2008. This goal was cancelled in 2015 when Copenhagen published a strategy for urban nature5.
12 GREEN NORM 2.0
2
                                                                                                      GREEN NORM 2.0   13

                    BIOFACTOR
                    Biofactor is an expression of the biological activity that an area leaves room for – in
                    other words: how green it is. The biofactor is relatively easy to calculate and although
                    the method is available in different versions, and therefore may have different calcula-
                    tion models and scales, the basic principle is the same. Biofactor is used in Gladsaxe,
                    Denmark, Seattle, USA, Berlin, Germany, and several places in Sweden.

                    The total score of an area is calculated by multiplying the size of the different smaller
                    area types by their respective biofactor point, and then dividing this number by the
                    total acreage.
                    See examples on the following pages.

                    In its basic form, the biofactor is calculated by using a spreadsheet. An area is given
                    an overall biofactor score based on the different types of areas in the area – such as
                    asphalt, grass, scrub, green roofs or trees.
                    Each area type is associated with a certain number of biofactor points, depending on
                    the amount of biological activity.
                    For example, forests get many points, lawns get few and asphalt none at all.
                    Therefore, it can be said that the greener an area is, the higher a score it will get.
                    BUILD – the Department of Construction, City and Environment has a freely available
                    spreadsheet at sbi.dk.

                    Biofactor Can Be Used as a Tool
                    The biofactor can be used in the planning phase of new areas and it gives flexibility
                    in achieving a given factor. In addition, it is possible to require a minimum factor for
                    buildings and the areas are easily compared.

                    However, the biofactor should not stand alone as it does not say anything about, for
                    example, biodiversity or how an area is experienced6.

                           “        Biofactor is a very flexible framework to work with.
                                   It provides a focus both on maintaining the existing
                                     nature and on being aware of including even more
                                                       green areas from the beginning.”
                                                                                                  Tine Sand Gybeck
                                                        Landscape architect, the Municipality of Gladsaxe, Denmark

GREEN CITIES PROPOSES that an ambitious minimum requirement for a biofactor for building and
renovating in cities is provided at a national level.

The minimum requirement may depend on the type of buildings, for example, whether they are residential
or commercial, as well as the plot ratio of the area, with which the city of Berlin, Germany, has experience7.
A minimum requirement will serve as a common starting point for the municipalities, which then can define
additional and more ambitious goals for the biofactor.

In addition, it is recommended to require that a landscape architect, a designer or a certified gardener be
included in the planning of the buildings’ outdoor areas. This is a recommendation with which the city of
Seattle, USA, has experience8.
14 GREEN NORM 2.0
YARDS, THE HEDEBYGADE BLOCK, COPENHAGEN
Gårdanlæg - Hedebygadekarréen,
Source: Notat vedr. biofaktorberegning. 2012. Naturstyrelsen og Friluftsrådet.
Før: Efter:
Be- Year Year After
Base Areas Score fore 0 10
Asphalt, pavement etc. (sqm) 0.0 3,226 2,529 2,529
Gravel areas, grass reinforcement (sqm) 0.3 0 376 376
Mowed grass/playing fields (sqm) 0.5 1,380 1,218 1,218
Shrubs and shrubs under two metres (sqm) 0.5 395 629 629
Natural grass (sqm) 1.0 0 200 200
Shrubs and bushes over two metres (sqm) 1.5 181 190 190
Tree and forest plantations (sqm) 2.0 0 0 0
Water area, not permanent 0.5 0 0 0
Lake area, permanent 1.0 0 40 40
Gårdanlæg - Hedebyg
Total outdoor area (sqm) 5,182 5,182 5,182 Noter:
Enkeltstående nye træers kronea
Biofactor 0.22 0.33 0.30 Før:
Se signaturforklaring på side 21
Enkeltstående nye træers kronea
Efter:
Facadebeplantning er ansat til 0%
Before
Additional areas
Roof and facade plants (sqm) 0.5 0 0 348
Crown area of individual trees (sqm) 2.0 365 288 855
Rainwater percolation from covered area (sqm) 0.5 0 1,284 1,284
Area covered by own compost (sqm) 0.5 0 819 819
Added biofactor 0.14 0.31 0.57
Biofactor incl added biofactor 0.36 0.62 0.87
Notes:
Crown area of new individual trees “year 0” is set at 3 sqm
Crown area of new individual trees “year 10” is set at 30 sqm
Facade plants are set at 0% in “year 0” and 100% in “year 10”
Se signaturforklaringGREEN NORM 2.0 15
THE CITY OF MALMÖ, SWEDEN
– GOAL OF BIOFACTOR 0.6 FOR HOUSING
The example is based on an existing area of 479 square metres, of which 279 are developed.
The area has a biofactor of 0.05 as the outdoor areas consist of 140 square metres of asphalt,
59 square metres of gravel and a single square metre of lawn.
The example shows what a transformation of the area could look like if it were to achieve a
biofactor goal of at least 0.6. The table shows how different types of areas are weighted accor-
ding to the Swedish green-space-factor model (the grönytefaktor-model) so that a weighted
number of green square metres is obtained.
The total score is calculated, as shown, by dividing the weighted green square metres by the
total acreage of the area.
Added Weighted
Area/Base Area Sqm x Biofactor = Green
Verges, lawn/green on 130 1.0 130.0
the ground
Climbing plants on the
facade of the front 80 0.7 56.0
and back of the house/
green on the facade
Sedum matting on the
roof/green roof 40- 8 0.4 3.2
80 mm depth
Medium-sized (=2sqm)
ornamental trees/trees 4
with a trunk circumfe- trees 8x1.6 51.2
rence between 16 og
20 cm (=1.6)
Perennial flower and 74 0.4 29.6
shrub planting
Drainage from
walkway area and 70 0.2 14.0
terrace to surrounding
green on the ground
Concrete slabs / hard 70 0.2 14.0
surface with joints
298.0
CALCULATION OF THE SWEDISH
GREEN-SPACE-FACTOR MODEL (GF):
298 sqm weighted green area
GF= 479 sqm acreage of the area
= 0.6216 GREEN NORM 2.0
OTHER EXAMPLES
OF THE USE OF BIOFACTOR
Berlin, Germany - Biotopfächenfaktor (Biotope areas factor). Scale 0.0-1.0.
A requirement for a minimum of 0.6 – the highest score is 1.0 – in new residential areas and
0.3-0.6 for changes in existing residential areas, depending on plot ratio7.
Malmö, Sweden - Grönytefaktor-model (green-space-factor model). Scale 0.0-1.0.
Until 2015, the Swedish city of Malmö had an ambitious framework for housing, containing,
among other things, a requirement for the use of a biofactor. An amendment to the law meant
that the municipalities were not allowed to make special requirements for development and the
framework was abandoned9.
“ When we required the use of the Grönytefaktor-model,
the comparison of green environments and habitats of different
projects became possible because everyone used the same model
of calculation. It was positive, and it meant, among other things,
that the green elements and their significance to the city and the
inhabitants were made visible to both building professionals,
planners and decision-makers – and this boosted green
initiatives in planning and design.”
Maria Olsbäck
Environmental construction strategist, The City Planning Office, Malmö, Sweden
The framework included the following:
The construction planned had to have a biofactor of at least 0.5 for homes, institutions and
mixed housing and a minimum of 0.4 for commercial areas/offices. However, the biofactor had
to be at least 0.6 and 0.5, respectively, for the areas mentioned above to achieve the highest
possible environmental certification10.
After the amendment to the law, the Grönytefaktor-model (green-space-factor model) is still
used diligently, however, it is no longer a requirement and the requirement for a minimum is
therefore not the same either.
Although Malmö does not require that a landscape architect or the like is included in the con-
struction process, it is still close to a de-facto requirement in connection with larger projects –
for example when building multi-family houses – because in this case, the municipality requires
that the outdoor areas be accounted for in a professional manner11.GREEN NORM 2.0 17 Seattle, USA – Green Factor. Scale 0.0-1.0. The city of Seattle, USA, based their Green Factor on the Berlin example and adapted it to Seattle. The model requires a minimum of 0.5-0.6 for residential housing, depending on the height of the buildings. It also requires a minimum of 0.3 for businesses, mixed housing and other urban development. However, certain urban areas are exempt from the requirement12. Gladsaxe, Denmark – Biofactor. Scale 0.0-2.0. In the Danish city of Gladsaxe, the biofactor must be applied in urban transformation projects. The requirement for a biofactor is relatively low at 0.3 – the highest possible score is 2.0. The biofactor is especially used as a tool for dialogue between the parties in the planning of a project to ensure that nature is considered from the beginning13. Copenhagen, Denmark – Begrønningsværktøj (Greening Tool). Scale 0.0-2.0. The Greening Tool calculates the biofactor, which is then weighted with the quality obtained in the area. The quality factors, which are also given a score, are: individuality, climate adaptation, biodiversity and recreation. It is used as a dialogue tool before, during and after a project. There is no requirement for a minimum factor14.
3
18   GREEN NORM 2.0

                               DISTANCE TO GREEN AREAS
                               In our cities, the residents’ distance to green areas is of great importance. The
                               closer people live to a green area, the more often they use the area. And the more
                               often people use a green area, the less stress they feel.

                               People who live less than 300 metres from a green area use it significantly more
                               often than people who live at a greater distance to a green area15.
                               Parks and green spaces also increase the property value if the properties are
                               located within a certain distance16.

                               Some Danish municipalities have already established goals for how far their
                               inhabitants should live from green areas or nature. However, it is not always
                               clear what type of green area they have in mind – and there is no arguing that
                               there is a difference between a large park and a small lawn with a few trees1.

                         “      It makes sense to work with the distance to green areas
                               because it is easy to relate to and because science points
                                                        out that it is of great importance.
                               Estimating green areas is a good tool which can back up
                               choices factually in the planning process and bring focus
                                    to concrete green initiatives in urban development.”
                                                                                                   Bo Seidelin Hune
                                                         Landscape architect, the Municipality of Odense, Denmark

            GREEN CITIES PROPOSES that a goal, like that of the Danish city of Odense, be established along the
            lines that all inhabitants of Danish cities should live at the most 300 metres on foot from a green area of
            at least 2,000 square metres in size and with public access. However, in particularly dense, existing urban
            areas, the requirement should only be 1,000 square metres.

            In addition, like in Berlin3, there should be a maximum of 500 metres on foot to a publicly accessible area of
            5,000 square metres or more.
GREEN NORM 2.0 19 EXAMPLES OF OBJECTIVES REGARDING DISTANCE At present, we have been able to locate a goal in seven of the 29 municipalities with larger cities in Denmark. However, it is not clear what constitutes a green or recreational area, and only the Danish city of Odense has a minimum requirement for the size of the areas included1. Esbjerg, Denmark Has a goal of distance, but it is unclear what it is and whether it is met? Herning, Denmark All inhabitants must live within 300 metres from a green area. Høje-Taastrup, Denmark Goal of a maximum of 300 metres to a green area. Copenhagen, Denmark Everyone must be able to walk to a park, beach or natural resort in less than 15 minutes – a new goal of a maximum of 300 metres is on the way. Odense, Denmark All households must live within 300 metres from a publicly accessible green area of at least 2,000 square metres – however, only 1,000 square metres in the city centre as it is particularly densely populated. Silkeborg, Denmark A maximum of 500 metres to nature for all residential areas. Aalborg, Denmark A maximum of 300 metres to a recreational area. Berlin, Germany Has a goal of a maximum distance of 500 metres to a publicly accessible green area of at least 5,000 square metres.
4
20 GREEN NORM 2.0

                                               GREEN INFRASTRUCTURE
                                               Green infrastructure is a way of protecting and improving nature’s processes,
                                               by strategically integrating them in the planning and development of physi-
                                               cal spaces – such as our cities, for example.
                                               Various elements of infrastructure, such as green roofs, rainwater systems,
                                               hives, fauna bridges or flourishing roadsides, can be included in the design
                                               and planning of the city18.
                                               Here, we focus on three elements: climate adaptation, green roofs and green
                                               facades.

                                               CLIMATE ADAPTATION
                                               In 2013, the Danish municipalities were put under the obligation to prepare
                                               plans for climate adaptation to cope with the increasingly frequent cloud-
                                               bursts and heavy rainfall19. Since then, many projects regarding climate
                                               protection have been carried out in Danish cities and more are on the way.
                                               Nature-based climate adaptation has great potential because nature can
                                               handle rainwater – and at the same time, nature beautifies the cities and
                                               supports biological diversity20.

PHOTO: In connection with establishing
urban nature on a high-rise building
in Nørrebro, a part of Copenhagen,
Denmark, a green roof was created to
function as a residence-friendly roof
garden. The emphasis was on achieving
lush and robust planting. The plants help
create a pleasant microclimate, which
also provides space and environment.
At the same time, the plants provide
space for the birds and insects of the city.
GREEN NORM 2.0 21
GREEN ROOFS AND FACADES
In recent years, green roofs have been more in focus, but some cities abroad
have been at it for a long time and basically compete with each other for
having the largest number of green roof square metres per inhabitant21.
Although, in a way, green roofs and facades create an artificial environment
and are no match for nature on earth in terms of providing well-being, quali-
ty and support for biodiversity, they still have many positive characteristics22:
Square metres of green roofs in selected cities, figures from 2015
City Green Roof, Sqm Sqm Per Inhabitant
Basel, Germany 1,000,000 5.71
Stuttgart, Germany 2,000,000 3.38
Malmö, Sweden 400,000 1.32
The centre of London, Great Britain 205,000 1.21
London, Great Britain 1,500,000 0.17
Copenhagen, Denmark 40,000 0.07
Source: Living Roofs and Walls – from policy to practice. 2019
` Roofs and facades can reduce the so-called Urban Heat Island Effect
(UHIE). If the vegetation in a city is increased by 20 per cent, UHIE
decreases by about 1 degree Celsius.
` Green roofs can reduce noise experienced indoors by 3-10 dB. Green
walls can reduce noise by 2-5dB.
` Green roofs have a significantly increased service life compared to
standard roofs and they insulate well.
` Green roofs contribute to cleaner air in the cities, manage rainwater and
provide hiding places for birds and insects.
` Green roofs contribute to increasing the property value of buildings.
A Canadian study has estimated that the property value of buildings in
Canada with recreational green roofs increases by up to 11 per cent.
In addition, the property value of buildings overlooking green roofs
increases by up to 4.5 per cent23.
` Several researchers point out that a green view, including green roofs and
facades, reduce stress.
“ The fact that we have made a lake surrounded by
24 native plant species does more than just handle
the amount of rainwater. It also promotes the
biodiversity of the area and the plants are of use to
the CO2-balance. And it provides recreational
experiences and beautifies the area.”
Ida Vestergaard
Landscape architect mdl, the Municipality of Lyngby-Taarbæk, Denmark22 GREEN NORM 2.0
DIFFERENT TYPES OF ROOFS AND FACADES
Intensive Green Roofs
Also called roof gardens, typically have a soil substrate of over 20 centimetres.
They usually need to be watered and require maintenance several times a year.
Extensive Green Roofs
Are sedum roofs based on the plants of the stonecrop family and/or meadow vegetation.
The roofs typically have between 4-15 centimetres of soil substrate.
In Addition, Green Roofs Can Be:
Biodiversity-promoting: With special native plant species or specifically designed habitats
Blue-green: Designed for rainwater management
Biosolar: The soil substrate forms a solid foundation for the placement of solar cells
Green facades: The vegetation has its roots at the ground level and climbs up the facade.
Living walls: A wall designed with small “pockets” containing soil substrate for plants,
which can therefore grow “directly” on the wall.
Bioactive facades: Built from a material designed to support mosses and algae, which
therefore grow on the wall itself21.
PHOTO: Green roof with insect hotel on the PwC building,
London, Great Britain – a mixture of sedum and wildflowers
support insects and breeding birds – for example, the black
redstart.
PHOTO: Green wall at the Rubens Hotel at the Palace, London. The
The composition of plants is designed to support biodiversity. wall is a vertical rain garden which is watered with rain from the roof.
GREEN CITIES PROPOSES that new buildings, like in the Swiss city of Basel and the German city of
Stuttgart, must have green roofs when the roof pitch allows it. Also, urban planning and development must
promote and encourage the construction of green infrastructure, such as green facades and nature-based
climate adaptation.
This could, for example, be achieved by setting up a fund that provides financial support to promote green
infrastructure. Basel, Stuttgart and the Australian city of Melbourne have experience with this.
In addition, green roofs and facades should be an integral part of the biofactor tool. However, the weighting
of points per square metre should be adjusted so that the plot ratio does not increase when the green areas
“are moved” from the ground level up higher.GREEN NORM 2.0 23 EXAMPLES OF GREEN INFRASTRUCTURE London, Great Britain In 2008, London implemented a policy for living roofs and walls, which had an impact on the district plans of the city. The total size of green roofs in the city increased from 715,000 square metres in 2010 to 1,510,000 square metres in 2017 – which means that the total size of green roofs was more than doubled in just seven years21. London is creating – in a co-creative process with its inhabitants – a green infrastructure which, among other things, helps to handle the rainwater. A busy road in London that was closed to cars is an example of one such project. The asphalt was replaced with permeable pavement and the rainwater from the roofs was retained in boxes and used for irrigating small gardens, wildflowers, herbs and insect-friendly plants planted along the old road20. The City of Virum, Denmark In a project on climate adaptation, Virum laid out varied perennial flower beds along the residential roads. In addition to absorbing rainwater, the perennial flower beds also beautify the area. Excess rainwater is led to a man-made lake surrounded by 24 native plant species that promote biodiversity, help sustain the CO2-balance and provide recreational opportunities and beautification24. Melbourne, Australia Melbourne has a fund that helps to finance green infrastructure in private areas, which make up 75 per cent of the city’s area. The rationale behind this initiative is that green infrastructure is a common good. Financial support is given to projects that plant trees, create green areas, green roofs and green facades, for example. The fund can finance 50 per cent – the rest must come from private investors20. Singapore For several years, Singapore has worked with the LUSH initiative, which contributes to making Singapore “a city in a garden”. Among other things, LUSH requires that nature removed at ground level due to a new building must be integrated as vertical gardens, green facades and/or green roofs. The city has about 100 hectares of green facades and green roofs25,26. Stuttgart, Germany Stuttgart requires green roofs on all new buildings. At the same time, the city runs an initiative that subsidies green roofs and facades in up to 50 per cent of the projects up to a maximum of EUR 11,50021. Basel, Schwitzerland The city requires green roofs on new buildings with flat roofs. The roofs must be designed to promote biodiversity. The vegetation must consist of native species that are characteristic of Basel27.
5
24 GREEN NORM 2.0

                              TREES IN THE CITY
                              Trees are important urban nature because they have a wide range of positive
                              properties for the climate, the city and the people.

                              According to the UN organisation FAO, trees contribute to limiting climate
                              change as they absorb and store CO2 from the atmosphere. For example,
                              throughout its lifetime, an adult beech tree collects and stores about 4.3
                              tons of CO2 in its roots, trunk and branches28.

                              We must adapt to larger amounts of rainwater and trees play a role in the
                              solution. An evergreen tree can absorb and evaporate about 15,000 litres of
                              water a year.
                              Urban trees act as a filter for air pollution, support biodiversity and counter-
                              act the higher temperatures in the cities – the so-called Urban Heat Island
                              Effect.
                              In addition to the trees’ more practical functions, they also have sensory and
                              architectural qualities that help to create positive experiences and beautify
                              the city29.

                                 “      If you look at it in a nuanced way, the city’s trees
                                        have an enormous value – they handle rainwater,
                                       provide shade, absorb CO2, are habitats for other
                                      organisms and they beautify the city. Therefore, we
                                           should take care of them and become better at
                                       showing and documenting their value so that they
                                              are not just felled for the sake of buildings.”
                                                                                                   Oliver Bühler
                                                    Associate professor at UCPH Forest and Landscape College,
                                                                         the University of Copenhagen, Denmark

          GREEN CITIES PROPOSES that all municipalities should develop a tree policy that, inspired by the Muni-
          cipality of Frederiksberg, Denmark, protects existing trees, both young and old, as well as demands that if a
          tree is felled, two new trees are planted. The policy also has a focus on species diversity by prioritising native
          species and aims at increasing the number of trees in the city – also in existing quarters.
          In addition, we propose that the use of valuation tools should be required to include the economic aspect
          when deciding whether existing trees should be felled for the sake of the city’s development.
GREEN NORM 2.0 25 Valuation of Trees To put monetary value on the properties of trees is complex, however, the economic argument may be the one that determines whether the trees are allowed in the city. Fortunately, there are models that can calculate the economic value of trees. One of these is the Danish norm, VAT1930. It is based on a method that assesses the overall economic value of an individual tree by looking at five factors: startup expenses if the tree must be replaced with a new one, the size of the tree, its health, location and age. The norm is published by the publisher “Green Environment”. Another and internationally recognised model is iTree, which is freely available at itreetools.org. This model can assess the value of ecosystem services provided by the trees – such as CO2 uptake, rainwater management and the benefit of biodiversity. Tree Policy Despite a high population density, the Municipality of Frederiksberg, Denmark, has many large trees. The small municipality, which, in terms of population, is still growing, has developed an ambitious tree policy to help preserve the existing trees and find room for new ones as the municipality is developing31. The tree policy contains, among other things32: ` The goal that any home in Frederiksberg has a view of at least one tree ` Protection of trees over 25 years of age ` Prioritising native species and ensuring a high level of species diversity. ` Guidelines to ensure that new trees have a trunk circumference of at least 18-20 centimetres measured one metre above the ground when they are planted out ` A prerequisite for construction and building is that trees are not damaged – and should it happen, they must be replaced
26 GREEN NORM 2.0
EXAMPLES
OF INITIATIVES FAVOURING TREES
IN THE CITY
Odense, Denmark
Each time a tree is felled, two new ones must be planted.
The initiative is part of Odense’s plan to become “Denmark’s Greenest
City”33.
Copenhagen, Denmark
Copenhagen has a tree strategy from 2018 that protects existing trees
and requires that trees felled be replaced. A concrete goal of the strategy
is that the tree crowns should cover 20 per cent of Copenhagen’s total
area. In 2015, that number was 16 per cent.
In addition, the strategy aims at ensuring good growth conditions and
species diversity34.
The municipality has a goal from 2015 of planting 100,000 trees by
2025. The municipality’s inhabitants have been invited to come up with
proposals for where the trees should be planted35.
In 2019, approximately 36,000 of the trees had been planted. However,
about 25,000 of these trees were planted as small trees of less than 20
centimetres in the newly laid out urban forest on Amager, which is a good
distance away from housing.
At the time of writing, the project is lacking around EUR 134,400 million
in funding to reach the goal36,37.
Berlin, Germany
Berlin counts the city’s street trees in the different parts of the city.
The city, which is known for its many trees, has 431,000 trees along the
streets, which gives an average distance of 13 metres between each tree38.
The trees are also numbered and digitally mapped – accessible to all39.
Aarhus, Denmark
In 2017, Aarhus launched a project to plant 10,000 trees by 2025.
Inhabitants can submit requests for where the trees should be planted
in public areas, and every time a tree is felled in the city centre, two new
trees must be planted.
However, Aarhus is a bit behind the scheduled goal. In early 2019, the
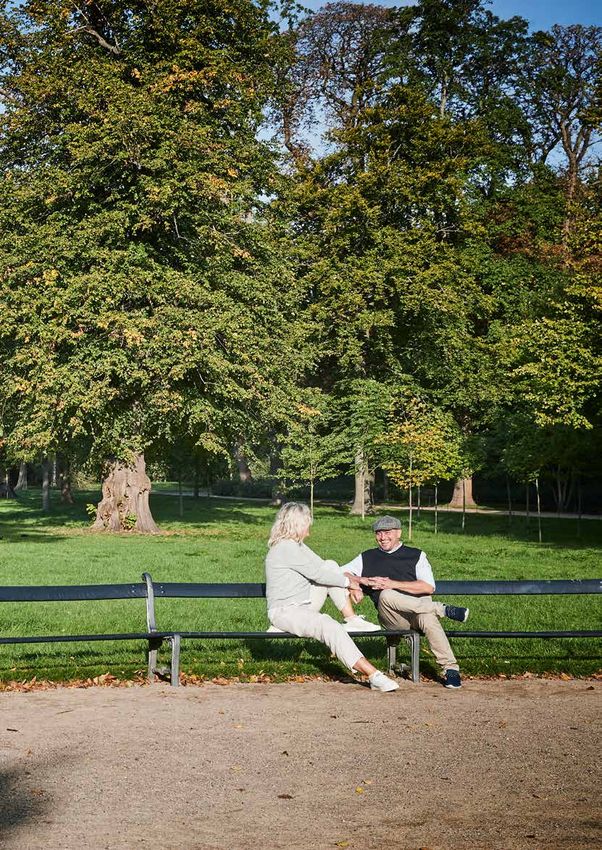
city had only reached tree number 50040,41.GREEN NORM 2.0 27 A walk in the city park, trees along the streets and green oases. That is all it takes to affect our health and well-being in an often hectic and overstimulated everyday life. Therefore, the arguments for creating more green areas and more nature in the cities are manifold and compelling. Green Cities, Denmark
28 GREEN NORM 2.0

          BETTER URBAN NATURE
          One thing is to increase the number of green square metres in the city, another to increase the
          quality of the green space.

          The quality of urban nature is complex because there is a big difference between the qualities offered
          by a short-cut lawn, a forest or a roof garden.

          The parameters to measure are many. Different types of areas have different values and functions in
          the city – qualities that are not necessarily taken into account when estimating acreage.

          The quality of nature, seen from a biological perspective, should also be evaluated. Is the animal and
          plant life diverse and does it thrive?

          Urban nature also has an economic significance. The ecosystem services have great social and
          economic value, parks have a positive impact on the value of surrounding properties and there
          may be expenses associated with maintenance and operation.

          Based on science and experience from cities and municipalities, the Green Norm focuses on three
          aspects of quality, namely: the ecosystem services, the quality of nature and the economy.

          ECOSYSTEM SERVICES

              “      An ecosystem comprises the interaction between living organisms
                   and their physical environment. Ecosystems can be defined in many
                   ways. The earth can be considered as one large ecosystem. A type of
                     habitat, such as a forest, can also be viewed as an ecosystem that
                                      may contain other or parts of other ecosystems.”
                                                                     Denmark’s Environmental Protection Agency, mst.dk

          Ecosystems as such are important but our livelihoods and societies also depend on the ecosystems
          and their services and benefits, from which we humans benefit.

          Ecosystem services can be divided into four categories:
          ` Natural goods can be described as natural resources, such as food, water, raw materials and building
             materials
          ` Regulatory services are, for example, climate control, CO2 uptake and noise reduction
          ` Cultural services include recreational options, aesthetics and health
          ` The support services include, for example, biodiversity, nutrient cycle and pollination. They are
             important as they help maintain the well-being of the ecosystems42.
GREEN NORM 2.0 29
QUALITY OF NATURE
“ In our work with biodiversity in urban areas, our starting point is an
analysis of the quality of nature that maps existing nature and its
quality as well as the larger biological context. This provides the best
starting point for estimating how much biodiversity we can create.”
Rasmus Vincentz
Co-founder of the company Habitats
The quality of nature is mainly about biological diversity and different species’ opportunities for growth
in an area. However, there are various methods that measure the quality of nature.
For example, the Danish company Habitats improves their quality-of-nature analysis on an ongoing
basis. In Sweden, a standardised analysis for the value of nature has been developed, and a researcher
from Aarhus University has described and tested an analysis in a report from 2011 43.
According to the report from Aarhus University, the quality of nature can be determined based on the
composition of plants and the physical structure of an area. It could also be called the “biological quality
of nature”.
An area is given an overall score of the quality of nature based on the number and types of plant species,
the structure of the area and the vegetation as well as the conditions of water and humidity.
ECONOMY
“ Economic incentives discourage cities from prioritising space for
nature. But it is short-sighted to calculate the value of the areas
only as floor area for housing. We need to make sure that the
balance between development and urban nature is better.”
Susanne Renée Grunkin
Chairman, The Association of Danish Landscape Architects
When making decisions on how cities should develop, the economy plays a significant role. Therefore,
we believe that a focus on the economic qualities of urban nature is important.
There is no market value for nature as there is for flats, parking spaces or a litre of milk, for example.
However, this does not mean that nature has no value.
On the contrary, several studies indicate that urban nature has great monetary value – we just need
the tools to measure it.
Recognising the value of nature is important. We do not want to risk assigning a lower priority to
urban nature for the sake of the economy because we do not know any better. In fact, it may be the
wrong choice altogether – in economic terms.30 GREEN NORM 2.0
GREEN NORM 2.0   31

  Urban nature is an important focus for
politicians who have ambitions to achieve
benefits on behalf of the citizens from an
          economic, environmental, social
     and aesthetic perspective all at once.
                          Green Cities, Denmark
6
32 GREEN NORM 2.0
MAP ECOSYSTEM SERVICES
A study of 25 urban areas in the United States, Canada and China has
shown that the economic value of just five ecosystem services, that is, the
regulation of air pollution, temperature and stormwater as well as CO2
uptake and recreational function, far exceeds the costs of restoring and
maintaining, for example, parks.
In addition, the value of all the ecosystem services that the study did not
calculate should be considered, such as the significance of biological
diversity, health and noise reduction44.
The Municipality of Lomma in Sweden has developed a method for mapping
the ecosystem services and the value of nature in a given area. The method
is used in urban development and transformation to gain insight into which
values are affected, thereby making it possible to protect them.
“ Working with ecosystem services has helped
to make the Municipality of Lomma attractive.
People move here because it is green.”
Helena Björn
Environmental Strategist, the Municipality of Lomma, Sweden
The mapping takes place at the very beginning of a building project based
on special forms developed for the purpose45.
The value of the ecosystem services in the area must be stated in the form
as well as how the services will be affected by the project and what measu-
res can be taken to protect them.
Values of nature and ecosystem services mapped by the Swedish Munici-
pality of Lomma
Ecological Value Biological diversity, valuable habitats
Supporting Ecosy- Food production, water supply, pollination, pest control, raw
stem Services material, energy potential
Local climate regulation, regional/global climate regulation, protecti-
Regulatory Ecosy- on against extreme weather, improvement of air quality, purification
stem Services of water, noise reduction, water management, erosion protection,
nutrient turnover
Recreation and outdoor life, health, exercise and training, social
Cultural Ecosystem
interaction, teaching and knowledge, intellectual and spiritual
Services
inspiration, natural heritage, aesthetics
Other Important Continuity, landscape, strategic location, potential for future
Functions value
Source: Underlag til Miljövärdesbedömning (Basis for Environmental Value Assessment), the
Municipality of Lomma, Sweden.GREEN NORM 2.0 33
INSPIRATION FOR MAPPING ECOSYSTEM
SERVICES
In the Municipality of Lomma in Sweden, they use six focus points when
examining the ecosystem services that exist in an area45:
1. Is the ecosystem service present in the area and how?
2. A description of the value of the ecosystem service in the area
3. To what extent is the ecosystem service impacted by a given project?
4. A description of how the ecosystem service is impacted
5. What legal protections are present?
6. What measures are put in place to counterbalance the impact?
GREEN CITIES PROPOSES that a mapping of ecosystem services be required at the beginning of a project
when an urban area is developed or transformed – whether it is private or public.
The mapping can be carried out by the developer or the municipality, depending on the area’s ownership,
allowing for the adaptation of the project to the area’s existing values.
At the same time, the mapping serves as a starting point for requirements regarding protection and offset-
ting measures, which is reviewed on the following pages.34 GREEN NORM 2.0
OTHER EXAMPLES
OF HOW TO WORK WITH
ECOSYSTEM SERVICES
The Municipality of Copenhagen, Denmark
Copenhagen has developed a Greening Tool which is based on biofactor
but also assigns points to the quality achieved. It is used as a dialogue
tool before, during and after a project14.
Quality factors that give points:
` Individuality – urban nature is based on the special character and
plants of a neighbourhood
` Climate adaptation – infiltration and delayed release of rainwater
as well as evaporation from roofs and plants
` Biodiversity – habitats, structural variation, native species and
wildlife corridors
` Recreation – larger grass areas, ecological connectivity, terrain
variation, public accessibility
The City of Seattle, USA
In 2012, Seattle mapped the ecosystem services provided by the city’s
trees and vegetation, the totality of which the city calls a dynamic,
urban forest. Although the report focuses on simple ecosystem services,
it concludes that the urban forest is a vital resource and an element of
the city’s infrastructure, which has significant value, and that this should
be recognised.
The report also concludes that:
` The trees in the city store a total of two million tonnes of CO2,
which is the equivalent of EUR 9,950 million if the CO2 had to
be stored in a different way.
` Trees and shrubs remove 725 tonnes of pollution each year, which
saves EUR 5,100 million a year.
` If the city’s trees and shrubs were to be replaced, they would cost
EUR 4,5 billion and the report further concludes that, although
not often perceived as such, the city trees are a valuable asset46.GREEN NORM 2.0 35
“ The developed environment can greatly impact
the diversity of ecosystems, species and gene pools.
We want to contribute to speeding up the
maintenance, establishment and expansion of
biological diversity in Danish cities.
When we certify the sustainability of urban
areas, land use and biodiversity are part of the
assessment. We set goals for the quality, thus giving
developers and municipalities a concrete tool with
which to promote and maintain their ambitions to
ensure a high and site-specific biodiversity.”
Mette Qvist
CEO, Green Building Council Denmark7
36 GREEN NORM 2.0
MITIGATION HIERARCHY
The mitigation hierarchy is a four-step approach
used to better prevent damage to the environment MITIGATION
and nature caused by human activity. HIERARCHY
Some may recognise the mitigation hierarchy from 1. Avoid damage
the Danish legal requirement for environmental 2. Minimise damage
assessments, which according to the Danish 3. Restore damage
Planning Act must be in place before certain types 4. Offset damage
of construction can be approved – for example Source: Aarhus University report, 2018
motorways, factories and large-scale buildings47.
The mitigation hierarchy helps to protect an area’s existing nature, but it is also impor-
tant to remember to consider how much nature an area can potentially accommodate
– and to include this potential in the design and planning.
However, the principles of the hierarchy can also easily be used to prevent damage to
the value of nature and the ecosystem services in the cities – also in small-scale building
projects.
If an area is to be developed, renewed or the like, the project’s impact on the area can
be examined by going through the four steps of the mitigation hierarchy – to draw up
concrete measures that will prevent damage to the area’s existing values.
If the hierarchy is used for ecosystem services, the steps could look like this:
` How is damage avoided, first and foremost through planning, for example
by moving the project’s location
PHOTO: During the construction of ` If damage cannot be avoided, how is it minimised as much as possible, for
a new school in the Municipality of
Lomma in Sweden, the construction example by minimising the size of the construction site
site was planned according to the
existing nature. Thus, it was avoided ` How can the damage, which the project is expected to cause, be repaired, for
to fell the area’s trees and the da- example by restoring nature
mage to the ecosystem services was
minimised. ` How is the damage caused compensated – for example by creating nature of the
It is unusual to have so many old same quantity and quality elsewhere
trees close to a new building, which
also made the school popular. More-
over, the buildings have green roofs Offsetting should only take place when the previous steps have been followed and the
which will evolve over time. area’s ecosystem services have still been damaged. Thus, offsetting is a last resort48.You can also read