A LIVEABLE METRO AREA - Case for Change: Shaping Waikato Metropolitan Area

Page created by Margaret Arnold
 
CONTINUE READING
A LIVEABLE METRO AREA - Case for Change: Shaping Waikato Metropolitan Area
A LIVEABLE
METRO AREA
Case for Change: Shaping
  the Future Hamilton-
Waikato Metropolitan Area
A LIVEABLE METRO AREA - Case for Change: Shaping Waikato Metropolitan Area
Contents
Executive summary                                       4

1.   A plan for liveability                             6

     » 1.1 Vision of a liveable future                  6
     » 1.2 Our opportunities                            8
     » 1.3 Tangata Whenua                               8
     » 1.4 Shaping our future: the need to plan         12
     » 1.5 What is the Metro Spatial Plan?              14

2.   Waikato River and ecological areas
     are our heart                                      16

     » 2.1 Healthy Waikato River                        16
     » 2.2 Preserving natural capital                   18
     » 2.3 Emissions and climate change                 21

3.   Harnessing growth for greater liveability          24

     » 3.1 Housing affordability                        24
     » 3.2 Economic performance                         30

4.   Improving access and urban form                    34

     » 4.1 Infrastructure, urban form and land supply   34
     » 4.2 Access                                       38

5.   Conclusion                                         48

                                                             3
A LIVEABLE METRO AREA - Case for Change: Shaping Waikato Metropolitan Area
Executive summary
                                                                                                                                We need to provide for growth in a way that protects          Improving access and urban form
                                                                                                                                and enhances valued water bodies; and restores and
                                                                                                                                enhances ecological resources. If we cannot capture this      We have an opportunity to improve our transport choices
                                                                                                                                opportunity, we face:                                         and the success of our urban form. We need to deliver
                                                                                                                                                                                              infrastructure, transport and services in a way that supports
                                                                                                                                 •   Continued degradation of the Waikato River and           liveable neighbourhoods, community wellbeing, targeted
                                                                                                                                                                                              increased density and high-quality urban environments. If
                                                                                                                                     depletion of valued ecological resources.
                                                                                                                                                                                              we cannot capture this opportunity, we face:
The Hamilton-Waikato Metropolitan Plan                            •   We are well connected by walking, cycling, and             •   Negative impact on community wellbeing as natural
                                                                      public transport, making it easy to get around. Our
(MSP) is our chance to consider how we                                connected, people-friendly urban neighbourhoods
                                                                                                                                     capital is lost and urbanisation continues.               •   Delivery of infrastructure, transport and services

can best plan for our long-term future;                               support a strong city core.                                •   Loss of natural systems, plants, animals, land and            that continues to follow market demand for growth,
                                                                                                                                     waterways to urbanisation unnecessarily.                      resulting in an inability to plan and direct growth in
to maintain and improve our liveability                           •   We are a welcoming community providing choices in                                                                            a way that supports infrastructure, density and high-
                                                                      how we move around, and where we live and work.                                                                              quality urban form.
through the way we grow our sub-region                                                                                          Harnessing growth for greater liveability
                                                                  •   People can afford to live and move around and                                                                            •   Missed opportunities for economic productivity gains if
and how we move around. We know our                                   have opportunities to work and thrive as part of our      We have an opportunity to harness growth to make                   growth is constrained due to infrastructure or land supply.
population will continue to increase and                              community.                                                our urban areas more affordable and attractive. We
we can improve our urban outcomes if                                                                                            can provide for a quality, vibrant metro area where

we manage growth differently. This Case
                                                                 The Metro Area is connected by the Waikato River, the
                                                                 awa which has provided physical and spiritual sustenance
                                                                                                                                communities have choices and easy connections to jobs,
                                                                                                                                affordable homes and recreational opportunities. If we        Where we are now -
for Change explores the need to think                            for Maaori for the past 800 years. Te Ture Whaimana o Te       cannot capture this opportunity, we face:                     current urban form
                                                                 Awa o Waikato – Vision and Strategy for the Waikato River
long-term and explains what the MSP                              has a key role in shaping the future of the area, and that      •   Housing options in the metro area that continue to be    Without timely infrastructure delivery, communities
can accomplish for our communities.                              of the wider region.                                                unaffordable for many.                                   suffer. This can manifest as less affordable housing,
                                                                                                                                                                                              lost productivity opportunities, increased congestion
                                                                 While wishing to develop land in a way that sustains            •   Lack of choice of housing typology and location limits   and transport cost, crowded civic infrastructure, and
                                                                 their economic capacity and provides opportunities for              will affect affordable options.
Urban Growth Agenda                                              iwi members, retaining their historical role as kaitiaki
                                                                                                                                 •   Poor access creating barriers to economic
                                                                                                                                                                                              environmental impacts. While the problem is more complex
                                                                                                                                                                                              than infrastructure alone, we are seeing many of these
                                                                 of the environment is a primary aspiration of tangata                                                                        effects today. The longer we wait to change the way we
The Government’s Urban Growth Agenda (UGA) was                                                                                       opportunities and imposing additional transport costs
                                                                 whenua in the area. Tangata whenua envision a collective                                                                     grow, the more exacerbated these impacts will become.
developed to remove barriers to growth, improve housing                                                                              on households.
                                                                 approach to sustainable land use which allows the mauri
affordability and support thriving communities. The MSP          of ancestral land, waters, cultural sites and taonga to be
was identified as part of the UGA and is a joint-initiative of   restored and enhanced.
the Future Proof sub-regional partnership. The partnership
will also deliver the Hamilton to Auckland Corridor Plan
                                                                                                                                                                                              Conclusion
(H2A) to support sustainable growth and increased                                                                                                Our valued natural resources                 Our current urban form and the way we grow comes with
connectivity between Hamilton and Auckland.                      Opportunities for improved                                                      are being depleted                           challenges, and opportunities. The decisions we make
The MSP seeks to determine a shared 100+ year vision             urban outcomes                                                                  Water quality in the Waikato River is
                                                                                                                                                                                              now will influence our long-term opportunities. With timely
                                                                                                                                                                                              and well-planned infrastructure delivery we will provide
and spatial framework for Hamilton, parts of Waipaa
                                                                 The MSP enables a discussion about how city-shaping                             significantly degraded and does not          for growth in a way that achieves the UGA objectives:
and Waikato. The MSP will respond to the UGA and
                                                                 leading infrastructure can support a preferred form for                         meet expectations                            protect land of significant environmental, cultural or
H2A Corridor Plan by setting out how city-shaping
                                                                 our metro area that results in improved liveability and                                                                      heritage value; build resilience to natural hazards and
infrastructure and land use can support a preferred spatial
                                                                 addresses the UGA objectives. Infrastructure can be a                           Housing options are unaffordable for         climate change; deliver affordable housing; and, respect
form for our metro area to achieve in improved urban
                                                                 serious bottleneck in the supply of residential, commercial                     many                                         and improve the environment. The success of the Maaori
growth outcomes. By changing the way we grow and
                                                                 or industrial development capacity if its delivery is poorly                                                                 economy can continue to be a pillar of our growth.
move around, we’ll improve our liveability and ensure our
people have safe, warm and affordable housing.                   timed or located. The MSP will focus on lead- investment                        We have enough land capacity for the         The sub-region has a history and willingness to work
                                                                 in strategic infrastructure to purposefully shape our urban                     next 30 years, but infrastructure is a       together in a collaborative way on growth management and
                                                                 form and improve how liveable our communities become.                           handbrake on growth.                         strategic planning. There is significant potential within the
                                                                 We have three main opportunities to improve our urban
Metro spatial plan vision                                        outcomes by changing the way we grow.                                           Our economy is underproducing,
                                                                                                                                                                                              metropolitan area and wider regional strength along the H2A
                                                                                                                                                                                              Corridor to provide a better future for our communities. The
                                                                                                                                                 impacting relative housing affordability     MSP will build from the Case for Change to set out how we
Our vision is for the Metro Area to be a highly liveable and
sought-after place to live in New Zealand. In 100+ years                                                                                                                                      deliver on the UGA’s objectives with a strategy for our sub-
                                                                 Waikato River and natural areas are our heart                                   Transport choice and urban form can          region’s long-term success.
we will be a metropolitan area where:
                                                                                                                                                 better improve wellbeing and add
                                                                 We have an opportunity to further embrace the
    •   The natural and built environment co-exist in harmony    Waikato River and natural areas as the heart of the
        and we have a healthy Waikato River as the heart.        Metro Area, that fits with Te Ture Whaimana o Te Awa
                                                                 o Waikato - Vision and Strategy for the Waikato River.

4                                                                                                                                                                                                                                                             5
A LIVEABLE METRO AREA - Case for Change: Shaping Waikato Metropolitan Area
1
1. A plan for liveability
The Hamilton Waikato Metropolitan
Plan (MSP) is our chance to consider
how we can best plan for our long-term
                                                                 1.1 Vision of a liveable future
                                                                 Our vision is for the Metro Area to be a highly liveable
future; to maintain and improve our                              and sought-after place to live in New Zealand. In
                                                                 100+ years we will be a metropolitan area where:
liveability through the way we grow our
sub-region and how we move around.                                •   The natural and built environment co-exist in harmony
We know our population will continue                                  and we have a healthy Waikato River as the heart.

to increase and we can improve our                                •   We are well connected by walking, cycing, and
                                                                      public transport, making it easy to get around. Our
urban outcomes if we manage growth                                    connected, people-friendly urban neighbourhoods
differently.                                                          support a strong city core.

The Government’s Urban Growth Agenda (UGA) was                    •   We are a welcoming community providing choices in
developed to provide long-term changes in response                    how we move around, and where we live and work.
to growth, to improve housing affordability and support           •   People can afford to live and move around and
thriving communities. The Metro Spatial Plan was                      have opportunities to work and thrive as part of our
identified as part of the UGA and is a joint-initiative of the        community.
Future Proof sub-regional partnership, delivering on the
Hamilton to Auckland Corridor Plan. The Metro Spatial
Plan seeks to determine a shared 100+ year vision and            The Metro Area is connected by the Waikato River, the
spatial framework for Hamilton, parts of Waipaa and              awa which has provided physical and spiritual sustenance
                                                                 for Maaori for the past 800 years. Te Ture Whaimana o
Waikato.
                                                                 Te Awa o Waikato – Vision and Strategy for the Waikato           Where is the vision from?
The Metro Spatial Plan is about how city-shaping                 River has a key role in shaping the future of the area, and
infrastructure and land use can support a preferred              that of the wider region. The vision for the river is a future
spatial form for our metro area that results in improved         where a healthy Waikato River sustains abundant life and
                                                                                                                                  The vision statement was initially
urban growth outcomes. This Case for Change explores             prosperous communities.                                          developed in April 2019 at the
the need to think long-term and explains what the Metro
Spatial Plan can accomplish for our communities.                                                                                  Investment Logic Mapping
The decisions we make now will influence our long-                                                                                workshop. Due to the scale of
term opportunities. Without timely infrastructure delivery,                                                                       the projects and the long-term
communities suffer. We can provide for growth in a
way that achieves the UGA objectives: protect land of
                                                                                                                                  aspirations, participants were
significant environmental, cultural or heritage value,                                                                            asked to share their vision.
build resilience to natural hazards and climate change,
deliver affordable housing and respect and improve the
                                                                                                                                  Representatives attended from
environment. Mana whenua aspirations in the Metro Area                                                                            Waka Kotahi NZ Transport
are significant. The success of the Maaori economy will be
an integral part of how we grow.
                                                                                                                                  Agency, Ministry of Housing and
                                                                                                                                  Urban Development (MHUD),
                                                                                                                                  Department of Treasury, Future
                                                                                                                                  Proof, Waikato Regional Council,
                                                                                                                                  Waipaa District Council, Waikato
                                                                                                                                  District Council, and Hamilton
                                                                                                                                  City Council. The vision was
                                                                                                                                  subsequently circulated to Future
                                                                                                                                  Proof Implementation Committee
                                                                                                                                  in November 2019.

6
A LIVEABLE METRO AREA - Case for Change: Shaping Waikato Metropolitan Area
1.2 Our opportunities                                                                       •   Create more efficient growth patterns and reduce our
                                                                                                high dependency on private vehicles. This can lift our
The Metro Area presents strong growth on a national scale.                                      community and environmental wellbeing and better             Four iwi practice ahi kaa within
                                                                                                connect people with economic opportunities.
Population growth can benefit us. We have the opportunity                                                                                                    the Metro Area. Waikato-Tainui is
to make sure the Metro Area remains a great place to live,
but also provides for housing and economic opportunity                                     These outcomes can come about by managing the                     the largest local iwi with a total
that meets the changing needs of our community.                                            growth of our metropolitan area and our infrastructure            of 75,500 members followed by
                                                                                           with a much longer-term timeframe than we currently do.
                                                                                           We want to test how we can do things differently than we          Ngaati Hauaa (8,598 members),
    Figure 1 Change in population                                                          have in the past. A ‘boundaryless’ planning approach is           Raukawa (7,000 registered
                                                                                           one way we can do things differently.
    in past 48 years (1970-2018)                                                                                                                             members, but the majority of the
                                                                                           As a Future Proof partnership, we already work towards
                                                                                           liveability and our communities’ wellbeing. Through the
                                                                                                                                                             Metro Area), and Ngaati Koroki
        450%
                                                                                           Metro Spatial Plan our focus has shifted to the metro             Kahukura (3,388 members)
        400%                                                                               area, a longer aspirational timeframe and within a national
        350%                                                                               context.
        300%
                                                                                                                                                                         The Waikato region has been a desirable
        250%
                                                                                                                                                                       location for settlement since Maaori arrived in
        200%                                                                                                                                                          Aotearoa New Zealand. Offering an abundance
        150%                                                                                    Why focus on liveability?                                of natural resources and fertile land, it has long been
                                                                                                                                                         known as a food basket (rourou) to tangata whenua.
        100%
                                                                                                Liveability expresses the idea of                        Tangata whenua within the Metro Area descended from
         50%                                                                                                                                             the Tainui waka tracing their ancestry back 800 years.
                                                                                                a place that is good to live, work                       Over centuries Maaori have established various paa
          0%
                                                                                                and play-an urban environment                            and kaainga predominantly near areas rich in natural
                 Ngaaruawaahia

                                 Te Awamutu

                                              Hamilton

                                                         Cambridge

                                                                     Wiapaa

                                                                              Waikato DC

                                                                                                where people enjoy a high quality                        resources and alongside rivers, notably their awa tupuna
                                                                                                                                                         the Waikato River. When Europeans arrived, settlers
                                                                                                of life. This is a term that speaks                      developed towns and farms around these populous
                                                                                                to how well our people are doing.                        kaainga. The Kiingitanga movement originated in the
                                                                                                                                                         Waikato region under the first Maaori King Pootatau Te
                                                                                                                                                         Wherowhero to unite iwi and halt land sales.
                                                                                                                                                         The Metro Spatial Plan includes approximately 658
By changing the way we grow and move around to                                                                                                           hectares of land classified as Maaori Freehold Land. The
improve our liveability and ensure our people have safe,                                                                                                 largest clusters of this land are located in Pukemoremore
warm and affordable housing. As growth has occurred.                                                                                                     and Te Kauwhata, and smaller ones in Taupiri,
We can better;                                                                                                                                           Ngaaruawaahia, Te Kowhai, Gordonton, Tamahere, Kihikihi
                                                                                                                                                         and Hamilton City.
    •   Embrace the Waikato River and natural areas as the
        heart of the Metro Area.                                                           1.3 Tangata Whenua                                            Marae are the cultural, social and political hubs that unify
                                                                                                                                                         iwi, hapuu and whaanau. It is at marae that tangata whenua
    •   Harness growth to make our urban areas more                                        The Metro Spatial Plan provides opportunities to improve      hold traditional ceremonies, have intertribal encounters,
        affordable and attractive.                                                         tangata whenua connections to waahi tapu, waahi               debate significant issues and commemorate the
                                                                                           tuupuna, papakaainga, whenua, education and economic          deceased. They are the heart of Maaori communities and
    •   Improve our transport choices and the success of our                               prosperity.                                                   therefore a waahi tapu. Today, marae is often used for civil
        urban form.                                                                                                                                      defence purposes and serve as a place to care for those
                                                                                           While wishing to develop land in a way that sustains their
                                                                                                                                                         experiencing hardship. There are 13 marae in the Metro
                                                                                           economic capacity and provides opportunities for iwi
To achieve these opportunities, we need to work hard to                                                                                                  Area of which eight are located in the Waikato district, three
                                                                                           members, retaining their historical role as kaitiaki of the
make changes to the way our city grows;                                                                                                                  in Hamilton city and two in the Waipaa district.
                                                                                           environment is a primary aspiration of tangata whenua in
                                                                                           the area. Tangata whenua envision a collective approach
    •   Enable our infrastructure services and land use planning                           to sustainable land use which allows the mauri of ancestral
        to accommodate long-term increased population. If we                               land, waters, cultural sites and taonga to be restored and
        cannot successfully plan for growth, we will not be able                           enhanced. This includes enhancing the environmental
        to access the economic opportunities and prosperity                                health of the Waikato River in accordance with the vision
        we could otherwise achieve.                                                        and strategy for the Waikato River, while supporting iwi
                                                                                           access to social and economic opportunities.

8
A LIVEABLE METRO AREA - Case for Change: Shaping Waikato Metropolitan Area
1.4 Shaping our future:                                       environments that are accessible to all, and improved
                                                               access to jobs, services (including social services such as
                                                                                                                                      Figure 2 Where we are now -
                                                                                                                                      current urban form
 the need to plan                                              education and health) and other amenities.
                                                               Now is the time to influence the type and location of land
 The Government’s UGA sets out a strategy to create the        use and infrastructure to avoid some of the negative
 conditions for the market to respond to growth, bring         outcomes of growth experienced in other cities. We
 down the cost of urban land, improve housing affordability    want to maintain and improve our liveability in the face of                                                                        Water quality in the Waikato River
                                                                                                                                        Our valued natural resources
 and support thriving communities. The development             continued growth. We want to avoid the cost of retrofitting                                                                        is significantly degraded and
 of spatial plans for key growth areas is one pillar of                                                                                 are being depleted
                                                               transport corridors into existing urban areas; congestion                                                                          does not meet expectations.
 the Urban Growth Agenda. The main objective of the            that stalls growth and economic productivity; and we want
 UGA is to improve housing affordability underpinned by        to understand where is the most appropriate areas for
 affordable urban land. This will be supported by wider
 objectives to:
                                                               increased density and how best to deliver housing that                    •   Across the Central Waikato Zone, wetland are         •   Land use activities are a main contributor of
                                                               meets our communities’ needs.                                                 2-3% of their estimated historic cover and forests       the nitrogen phosphoros volumes found in the
                                                               Infrastructure can be a serious bottleneck in the supply                      of the basin floor are reduced to less than 1% of        Waikato River.
                                                                                                                                             their former extent.
                                                               of residential, commercial or industrial development                                                                               •   In the lower Waikato River (e.g. from Hamilton
     Urban Growth Agenda                                       capacity if its delivery is poorly timed or located. Our plan             •   Of the approximately 300 threatened species              northwards) 31.6% of test sites are unsatisfactory
                                                               can focus on lead- investment in strategic infrastructure                     currently in the Waikato Region, nearly a quarter        for ecological health and 87.4% are unsatisfactory
     primary objectives                                        to shape our urban form and improve how liveable our                          strongly prefer wetlands and waterbodies, key            for swimmability.
                                                               communities become.                                                           ecosystems of the MSP area.
                                                               Without timely infrastructure delivery, communities
                          Improve choices
                                                               suffer. This can manifest as less affordable housing, lost
                          for the location and
                                                               productivity opportunities, increased congestion and
                          type of housing
                                                               transport cost, crowded civic infrastructure (e.g. parks and
                                                               libraries) and environmental impacts. While the problem
                                                               is more complex than infrastructure alone, we are seeing                                                                           We have enough land capacity
                                                                                                                                        Housing options are
                                Improve access to              many of these effects today. Some of the reasons we                                                                                for the next 30 years of growth,
                                                                                                                                        unaffordable
                                employment, education          need a vision-based long-term plan focused on liveability                                                                          but infrastructure is a handbrake
                                and services                   are shown in Figure 2 (next page).

                                                                                                                                         •   Over 75% of Hamilton / Waikato / Waipaa home         •   We need to ensure this land capacity is in the
                                                                                                                                             owners spend more than 30% of their income on            right location and will deliver the right densities.
                                                                                                                                             housing costs.
           Assist emission                                          “This Government has made                                                                                                     •   We need three waters infrastructure to meet land
           reductions and build                                                                                                          •   The largest city in the metro area, Hamilton, is         supply demands beyond 2027.
                                                                    housing and urban develoment a                                           the third least affordable housing market in New
           climate resilience; and
                                                                                                                                                                                                  •   The Waikato River is nearly fully allocated as a
                                                                    priorty. Everyone on New Zealand                                         Zealand.
                                                                                                                                                                                                      water source during summer low flow conditions.
                                                                    deserves healthy, secure and                                         •   In Hamilton / Waikato / Waipaa collectively
                                                                                                                                             there was a 375% increase in demand on the
                             Enable quality-built
                                                                    affordable homes that provide                                            social housing register from December 2017 to
                             environment, while avoiding            access to jobs, education,                                               December 2019.
                             unnecessary urban sprawl.              amenties and services. When
                                                                    preforming well-being of residents
                                                                    and raise living standards for all”
                                                                                                                                                                                                  Improved transport choice and
 The Metro Spatial Plan enables a discussion about how              From Planning for Successful Cities: A discussion                   Our economy is
                                                                                                                                                                                                  urban form can improve wellbeing
 city-shaping infrastructure can support a preferred form           documentation on a proposed National Policy                         underproducing
                                                                    Statement on Urban Development
                                                                                                                                                                                                  and add to community vitality
 for our metro area that results in improved liveability and
 addresses the UGA objectives. Promoting quality built
 environments can help deliver urban forms with improved
 energy efficiency, less negative impact on the environment,                                                                             •   GDP in the Waikato Region has lagged behind          •   We need to ensure this land capacity is in the
 a wider variety of low emission transport modes, with                                                                                       New Zealand growth in the past 10 years by 5%.           right location and will deliver the right densities.
                                                                                                                                         •   We could be more productive and contribute a         •   We need three waters infrastructure to meet land
                                                                                                                                             greater proportion to the national economy if we         supply demands beyond 2027.

 1 Ministry of Housing and Urban Development. Cabinet Paper:   3 Infrastructure Australia (2018) Planning Liveable Cities: A place-
                                                                                                                                             were a larger economic centre.                       •   The Waikato River is nearly fully allocated as a
                                                                                                                                                                                                      water source during summer low flow conditions.
 Urban Growth Agenda proposed approach retrieved 2020-05-01    based approach to sequencing infrastructure and growth.
 www.hud.govt.nz/assets/Urban-Development/Urban-Growth-
 Agenda/62eeb57f4e/urban-growth-agenda-cabinet-paper.PDF
 2 New Zealand Productivity Commission (2017) Better urban
 planning: Final report

10                                                                                                                                                                                                                                                           11
A LIVEABLE METRO AREA - Case for Change: Shaping Waikato Metropolitan Area
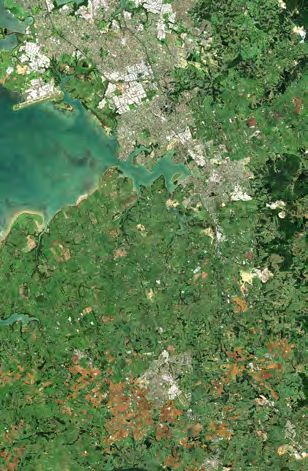
1.4.1 Hamilton to Auckland                                                   Nationally the H2A Corridor is a valued collection of
                                                                              green spaces, towns, marae and settlements that are
 Corridor Plan                                                                connected by Aotearoa New Zealand’s most significant
                                                                              river and the nationally significant parallel inter-city road
 The Hamilton to Auckland (H2A) Corridor Plan is a                            and rail connections; no other corridor contains such a
 high-level initiative to create communities that current                     valuable flow of water, people and goods.
 and future residents want to live in. It’s about our
 wellbeing. The plan’s aim is to help deliver the UGA                         The H2A Corridor Plan seeks to plan for the communities
 by supporting sustainable growth and increased                               of interest in a ‘boundaryless’ way. The Metro Spatial Plan
 connectivity between Hamilton and Auckland.                                  is within the Waikato Region and encompasses Hamilton
                                                                              city and surrounding parts of Waipaa and Waikato districts,
                                                                              where the environment, economy and communities
                                                                              between the three authorities are very much linked4.

     Hwi awarua ki te | Corridor for wellbeing

     The Hamilton-Auckland Corridor is an initiative seeking                   •   Improving access to employment, public services
     to create communities that current and future residents                       and amenities creating employment opportunities in
     want to live in. Its about our wellbeing. The plan’s                          the corridor
     vision is to support sustainable growth and increase
     connectivity between Hamilton and Auckland by:
                                                                               •   Piloting new finance and funding tools to pay for
                                                                                   infrastructure

      •   Improving housing affordability and choices                          •   Trailing new urban planning tools to coordinate
                                                                                   growth development.
      •   Enhancing the quality of the natural and built
          environments and the vitality of Auckland and
          Hamilton and the communities within the corridor

     Hamilton to Auckland Corridor Plan Objectives

     Wāhi Toitū, wāhi toiora                            Awarua                                       Wāhi mahi, wāhi noho
     Places with enduring presence                      Key corridors                                Places to work and live
     places to grow only with great care

     To manage growth in a manner                       To strengthen corridor connections           To grow urban settlements and
     that...                                            that...                                      places...

      •   Protects and enhances                          •   Shape and guide future urban              •   Make efficient use of existing
          the quality of the natural                         growth towards sustainable,                   infrastructure and resources,
          environments and cultural                          resilient and affordable
          heritage                                           settlement patterns, and
                                                                                                       •   Are transit-oriented and
                                                                                                           connected
      •   Anticipates the transition to a                •   Improve access to housing,
                                                                                                       •   Provide affordable housing
          low-carbon future and builds                       employment, public services
                                                                                                           choices that respond to
          climate resilience, and                            and amenities through, along
                                                                                                           demand, including quality
      •   Avoids increasing the impacts                      and within the corridor.                      intensification, and
          and residual risks of natural
          hazards.
                                                                                                       •   Provide high quality live-work-
                                                                                                           play settlements.

 4 Rural-Urban Linkages – Literature Review for Waikato Spatial Plan,         Spatial Plan. Dovetail. waikatoplan.co.nz/assets/Waikato-Plan/About-
 16 March 2015 – Adrian Field and Tanya Perrott (Dovetail) Field, A., &       the-plan-/Our-connections-files/Urban-Rural-Linkages-Literature-
 Perrott, T. (2015). Rural-urban linkages: Literature review for Waikato      Review-for-Waikato-Spatial-Plan.pdf

12
A LIVEABLE METRO AREA - Case for Change: Shaping Waikato Metropolitan Area
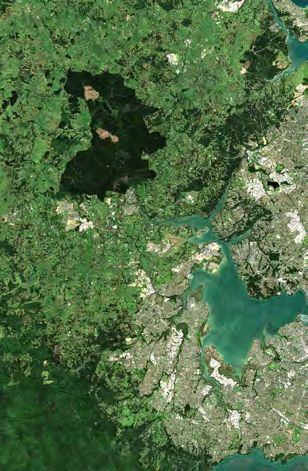
1.5 The Metro                                 Urban Growth Agenda
                                                                                                                                                                                                                                   Figure 3 H2A Corridor
                                                                                                                                                                                                                                        Plan Focus Areas
                                                                                                                                                                  PAPAKURA
Spatial Plan                                  Main objective: to improve housing affordability,
                                                                                                                                                                                         Papakura-Pokeno:
                                                                                                                                                                                         Supporting and unlocking,
                                              underpinned by affordable urban land:
The Metro Spatial Plan is a joint project                                                                                                                                                where appropriate, the
between the Future Proof sub-regional                                                                                                                                                    significant residential and
partnership involving regional and             •   Improve choices for the location and type of housing                                                                                  employment development
territorial authorities, central government    •   Improve access to employment, education and services;                                                            DRURY
                                                                                                                                                                                         potential and iwi aspirations
agencies and iwi. It seeks to determine                                                                                                                                                  for this string of welldefined,
a shared 100+ year vision and spatial          •   Assist emission reductions and build climate resilience; and                                                                          rail-linked settlements
framework for the Metro Area, with a 30-       •   Enable quality-built environment, while avoiding unnecessary                         PUKEKOHE
                                                                                                                                                                                         through integrated growth
year plan for priority development areas           urban sprawl.                                                                                                                         management, funding
and enabling investments.                                                                                                                                                                and financing and key
                                                                                                                                                                                         transformational projects.
This document, A Case for Change,
explores what the Metro Spatial Plan can
                                                                                                                         WAIUKU                                               POKENO
accomplish for our communities. The                                                                                                                  TUAKAU
long-term vision-based Metro Spatial
Plan is ambitious in looking much further     H2A Corridor Plan
forward than current Council resource
management or financial planning can do.      Hei awarua ki te oranga -                                                                                            MEREMERE                                        River Communities:
It builds on existing planning work such      Corridor for wellbeing                                                                                                                                               Supporting community and
as the current Future Proof Strategy and                                                                                                                                                                           iwi-led revitalisation and
planning documents from Hamilton City,        The plan’s vision is to support                                                                                                                                      targeted growth that will
Waipaa and Waikato District Councils.         sustainable growth and                                                                                                                    TE KAUWHATA                realise the full value of the
                                              increase connectivity between                                                                                                                                        natural, transport, marae
                                              Hamilton and Auckland by:               Metro Spatial Plan                                                                                                           and recreational networks
1.5.1 What it will include                     •   Improving housing                  “The Hamilton-Waikato-
                                                                                                                                                                                                                   that braid the area together
                                                   affordability and choices                                                                                                                                       as an asset for its people
The Metro Spatial Plan will includes these                                            Waipaa Metro Area will be a
                                                                                                                                                                                                                   and many others who can
                                                                                      sought-after place to live in
main elements:                                 •   Enhancing the quality
                                                                                      New Zealand”
                                                                                                                                                                                                                   visit and travel through.
                                                   of the natural and built
     •   Critical areas for protection and         environments and the
         restoration, and areas to avoid           vitality of Auckland               We are a metropolitan                                                                   HUNTLY
         developing                                and Hamilton and the               area where:                                 Hamilton-Waikato
     •   Core transport corridors
                                                   communities within the              •   The natural and built                  Metro Area:
                                                   corridor                                environment co-exist in                Supporting and
     •   Blue-green networks and corridors
                                               •   Improving access to                     harmony and we have a                  unlocking the residential
     •   Priority development areas, and,          employment, public                      healthy Waikato River as               and employment                    NGARUAWAHIA                                    MORRINSVILLE
                                                   services and amenities                  the heart of the city.                 development potential
     •   Leading and enabling social and
         network infrastructure.               •   Creating employment                 •   The area is well connected             and iwi aspirations for
                                                                                           by public transport and                this fast-developing
                                                   opportunities in the corridor
                                                                                           easy to get around. Our                metropolitan area
                                               •   Piloting new finance and                connected people-friendly              through joint planning,
                                                   funding tools to pay for                urban neighbourhoods                   integrated growth
                                                   infrastructure                                                                                                        HAMILTON
                                                                                           support a strong city core.            management and key
                                                                                                                                  transformational projects.
                                               •   Trialling new urban                 •   We are a welcoming
                                                   planning tools to                       community providing
                                                   coordinate growth                       choices in how we move
                                                   development.                            around, and where we live
                                                                                           and work.
                                                                                       •   People can afford to live
                                                                                                                                  KEY                                                                                              CAMBRIDGE
                                                                                           and move around and
                                                                                           have opportunities to work                      Existing urban areas
                                                                                           and thrive as part of our                       State Highways
                                                                                           community.
                                                                                                                                           Railway

                                                                                      We will achieve our vision                   (Data source: H2A
                                                                                      by working in partnership to                 Shared Statement of                                 TE AWAMUTU
                                                                                      capitalise on our strengths.                 Intent, Future Proof)

14                                                                                                                                                                                                                                                     15
A LIVEABLE METRO AREA - Case for Change: Shaping Waikato Metropolitan Area
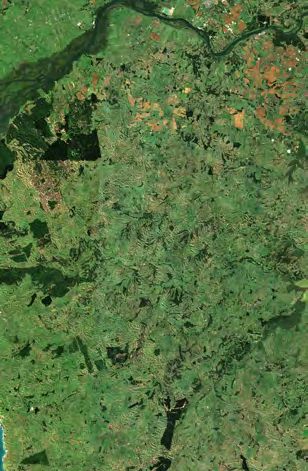
22. Waikato River and
 natural areas are our heart
                                                                                                                               Figure 4 Sources of
                                                                                                                               nutrients, Waikato/ Waipaa
                                                                                                                               Rivers (2003-2012)5

                                                                                                                                                                                                                  NI
                                                                                                                                                                                                                   TR
                                                                                                                                                                                                                    OG
                                                                                                                                                                                                                         EN
                                                                To achieve the Metro Spatial Plan’s vision of a place
                                                                where the natural and built environment co-exist in
     We have an opportunity to                                  harmony and where the river is at the heart of our

                                                                                                                                                                               PHO
     embrace the Waikato River                                  place, we need to plan in a way that proactively seeks
                                                                                                                                                                                                                                             Taupo
     and natural areas as the                                   to achieve better environmental outcomes than we are                                                                PH

                                                                                                                                                                                   S
                                                                currently achieving. In the future, the healthy Waikato                                                                  ORUS                                                Background
     heart of the Metro Area                                    River sustains abundant life and prosperous communities                                                                                                                      Point sources
                                                                who, in turn, are all responsible for restoring and                                                                                                                          Landuse
     We need to provide for growth in a way that
                                                                protecting the health and wellbeing of the River, and all it
     protects and enhances valued water bodies; and
                                                                embraces, for generations to come.
     restores and enhances ecological resources.
                                                                There is extensive evidence in western science and
     What happens if we don’t rise to the challenge?
                                                                maatauranga Maaori that the River is degraded. Over time,
                                                                human activities and land uses through its catchments have
      •   The Waikato River is already significantly            degraded the Waikato River and reduced the relationships
          degraded and valued ecological resources              and aspirations of communities towards the River. The                                                                                                                                         UP
          are being depleted.                                                                                                                                                                                                                     7.3%             PE
                                                                natural processes of the Waikato River have been altered
                                                                                                                                                                                                                                                                     R
      •   Failure to protect and restore the ecological         over time by physical intervention, land use and subsurface
                                                                                                                               Figure 5 Water quality

                                                                                                                                                                                                                                                                     W
          assets will constrain growth and impact on            hydrological changes. The degradation of the Waikato

                                                                                                                                                                                                                                                                      AI
          community wellbeing.                                  River and its catchment has severely compromised iwi in        for ecological health

                                                                                                                                                                                                                                                                        KA
                                                                their ability to exercise mana whakahaere or conduct their     and swimming5                                                                                       31.6%

                                                                                                                                                                                                                                                                          TO
      •   Our natural systems, plants, animals and              tikanga and kawa.

                                                                                                                                                                                                                                                                             R
          waterways are being degraded and land

                                                                                                                                                                                                                                                                            IVER
          lost to urbanisation unnecessarily. We can            It will take commitment and time to restore and protect the
                                                                health and wellbeing of the Waikato River. In biophysical                                                                                        27.3%                       Water quality
          improve environmental outcomes, increase                                                                                                                                                                                           for ecological

                                                                                                                                                                                                                                LO W E R W
          natural capital, and improve the health of the        terms, evidence shows that water quality deteriorates as                                                                                                                         health,
                                                                the River flows from its source to the Tasman Sea. The                                             12.8%                 UP                                                                   43.6%
          Waikato River.                                                                                                                                                                      PE                                               2014-2018
                                                                Waipaa River, the largest tributary to the Waikato River,                                                                       R
                                                                is also a significant source of sediment, nutrients and                                                                                                                AI

                                                                                                                                                                                                W
                                                                                                                                                                                                                                       KA
                                                                pathogens.                                                                                                                                                               TO R I V E R

                                                                                                                                                                                                 AI
                                                                                                                                                                                                                                                                    65.5%

                                                                                                                                                                                                   KA
 A key process is the identification of Waahi toituu areas,
                                                                There are many causes of degradation. Water pollution,
                                                                                                                                                                                                                                   24.8%

                                                                                                                                                                                                     TO
 which are places with enduring presence that should be
                                                                principally from land use, is a very significant source of
                                                                                                                                                                                   12.6%

                                                                                                                                                                                                        R
 protected. In addition there area other areas constrained      pollutants entering the River systems. This has increased

                                                                                                                                                                                                          IVER
 by man made or natural features, potentially limiting future   as land use in some parts of the catchment has intensified                                           Water
 urban development.                                             (for example conversions from forestry to dairy farming).                                          quality for

                                                                                                                                                     LO W E R W
                                                                Land use activities contributed 61% of the nitrogen, and                                           swimming,
                                                                45% of the phosphorous found in the Waikato and Waipaa                                             2014-2018
                                                                                                                                                                                                    30.2%
 2.1 Healthy Waikato River                                      Rivers between 2003 and 2012.
                                                                                                                                                            AI
                                                                                                                                                                  KA
                                                                                                                                                                                                                    Excellent
                                                                                                                                                                    TO R I V E R                                    Satisfactory

 Vision and Strategy for the Waikato River                                                                                               57%                                                                        Unsatisfactory
 / Te Ture Whaimana o Te Awa Waikato                                                                                                                                  87.4%

 ‘Tooku awa koiora me oona pikonga
 he kura tangihia o te maataamuri-

 (“The river of life, each curve more
 beautiful than the last”)
                                                                                                                               5 From Waikato Regional Council: https://waikatoregion.govt.nz/
                                                                                                                               environment/environmental-information/environmental-indicators/
                                                                                                                               river-and-streams/indicator-river-water-quality-ecological-health/river-
                                                                                                                               water-quality-ecological-health-results/

16                                                                                                                                                                                                                                                                        17
A LIVEABLE METRO AREA - Case for Change: Shaping Waikato Metropolitan Area
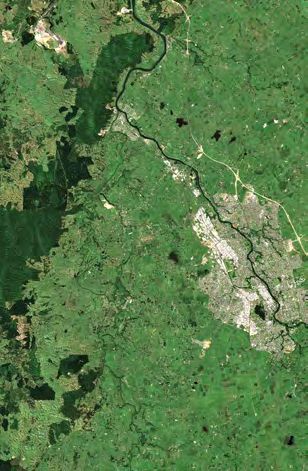
2.2 Preserving natural capital                                             focussed on low density greenfield development.10 We
                                                                           will continue to need new urban land to develop onto,
                                                                           butwe need to change the way we plan to better preserve
We need to change the way we                                               high quality soils and avoid development in sensitive
plan to better preserve high quality                                       environmental, cultural and heritage areas. The Metro
                                                                           Area can develop in a way that will reduce the need to
soils, avoid development in sensitive                                      travel by private car by planning for more compact urban
environmental, cultural and heritage                                       settlements with quality development and amenity levels.
areas. ‘Waahi toituu’ (areas where we                                      When looking at expansion areas in which to grow, we
should avoid urban development) and                                        have identified natural and man-made attributes (areas
‘waahi toiora’ (areas where we should                                      where we should avoid urban development, such as areas
                                                                           with elite soils, or significant natural areas). These areas will
plan with care) will help us to plan                                       help us to plan carefully into the future.
carefully into the future.
The Metro Area is known as New Zealand’s food bowl,
surrounded by soils that are amongst the country’s best.
Current trends show that urban and rural-residential
expansion is reducing the availability of some of our most
                                                                               Natural capital is the region’s
versatile land (land use classifications 1-4).                                 bank balance of mountains,
The Waikato region has about a quarter of New Zealand’s                        forests, soils, rivers, air, habitats,
high-class soils (around 300,000 ha) with class one land
making up only 1.9% of the region’s total land area (about
                                                                               birds, bees, cows and grass.
45,000 ha).6                                                                   The region’s economy and
The creation of lifestyle blocks may pose a greater                            people’s wellbeing rely on an
risk to the availability of high-quality soil resources for                    abundant and healthy natural
the primary sector than does urban expansion. While
the outward growth of urban centres in New Zealand                             capital. Natural capital provides
between 1990 and 2008 consumed 0.5 percent of                                  many necessary services, often
high-class land (LUC 1–2), analysis in the same 2013
study shows that lifestyle blocks had already occupied                         at no charge, such as water for
10 percent of high-class land (data to 2011).7 In Waikato                      drinking, lakes to swim in, soil to
Region between 2001 and 2017, the area of total
residential use on versatile land approximately doubled,                       grow food, microbes to recycle
with an average increase of 542 ha per year – an area                          nutrients and break down waste,
equivalent to more than four average-sized dairy farms.8
                                                                               climate regulatory features,
The councils in the Metro Area have already started
to change their planning so that ‘infill development’                          locations to support cultural and
(occurring inside existing urban areas rather than                             spiritual wellbeing.
extending out into new-build or ‘greenfield’ areas) is
enabled. This has had the effect of reducing the amount                        The Waikato Plan. (n.d.) https://waikatoplan.co.nz/assets/
of new urban land, particularly in Hamilton where around                       Waikato-Plan/About-the-plan-/Our-environment-files/
48% of development over the 10 years to 2016 occurred
within existing city boundaries.9
However, greenfield development in the Metro Spatial Pl
an area is still occurring at relatively low densities, and
development in Waipaa and Waikato is predominantly

6 Kettle, M. (2013). Waikato Spatial Plan: Environmental wellbeing         9 Hamilton City Council. (2017). Hamilton City District Plan Monitoring
working paper. Waikato Regional Council. https://waikatoplan.co.nz/        Strategy. https://www.hamilton.govt.nz/our-council/council-
assets/Waikato-Plan/About-the-plan-/Our-environment-files/5-d-             publications/districtplans/Monitoring%20Report%202017/mobile/
Enviornmental-Wellbeing-Report-December-2013.pdf                           index.html#p=18
7 Statistics New Zealand. (2018). Land cover. http://archive.stats.govt.   10 White, M., & Future Proof Technical Implementation Group. (2015).
nz/browse_for_stats/environment/environmental-reporting-series/            Future Proof monitoring report 2015. Future Proof. http://www.
environmental-indicators/Home/Land/land-cover.aspx                         futureproof.org.nz/assets/FutureProof/Documents/15-future-proof-
8 Waikato Progress Indicators: residential expansion onto versatile        monitoring-report-april-2015-final.pdf
land, retrieved 2020-05-01 from https://www.waikatoregion.govt.nz/
Community/Waikato-Progress-Indicators-Tupuranga-Waikato/Report-
cards/Rural-subdivision/

18
Whi�kahu

                              Taupiri

                                                                                                                         Figure 6 Geographical                                                                                                       Open space access is important for people’s health
                                                                                                                                                                            2.2.1 Biodiversity                                                       and needs to be at the heart of our planning for our
                                                                                                                       features and constraints
                                                                                                                                                                            As rural and urban land uses have expanded and                           metropolitan future. Waikato-Tainui wish to see an
                                                                                                                                                                            intensified in the Waikato region biodiversity has declined,             approach to environmental management that goes
                                                                                                                                                             Morrinsville
                                                                                                                                                                            largely due to ecosystem loss and fragmentation as well                  beyond sustainability, towards an approach that enhances
                                                                                                                                                                            as degradation by contaminants and pest plants and                       the environment. In October 2018, Hamilton City Council’s
           Ngaruawahia                                               Gordonton                                                                                              animals. Wetlands have been reduced to around 2-3%                       Community, Services and Environment Committee set
                                                                                                                                                                            of their estimated historic cover, while the forests of the              a 10% indigenous biodiversity cover target which is
                                                                                                                                                                            basin floor have been reduced to less than 1% of their                   anticipated to include the river corridor and gullies and
                                                                                                                                                                            former extent and now survive only as small isolated                     the surrounds of peat lakes in the urban area.
                                  Horo�u                                                                                                                                    fragments. Surrounding the Metro Spatial Plan area, the
                                                                                                                                                                            hill country forests have fared better, particularly on the
                                                                                                                                                                            steeper hill slopes. There are currently 305 species of
                                                                                                                                                                            native plants and animals threatened with extinction.11
                                                                                                                                                                                                                                                     2.3 Emissions and
                                                                                                                                                                            Open space access is important for people’s health                       climate change
                                                                                                                                                                            and needs to be at the heart of our planning for our
           Te Kowhai

                                                                                                                                                                            metropolitan future. Waikato-Tainui wish to see an                       As we face a future where climate change will bring
                                                                                                                           Eureka
                                                                                                                                                                            approach to environmental management that goes                           increased extremes in weather, including increased
                                                                                                                                                                            beyond sustainability, towards an approach that                          potential for flooding and for droughts, we need to plan
                                                                                                                                                                            enhances the environment.12 In October 2018, Hamilton                    for a low-carbon future and develop in a way that means
                                                                                                                                                                            City Council’s Community, Services and Environment                       even with a changed climate, we are resilient.
                                                                                                                                                                            Committee set a 10% biodiversity target.
                                                                                                                                      Tauwhare

                                                                                                                                                                            The natural ecosystems of the rich alluvial floodplains,
                                                                                                                        Tauwhare Pa
                                                                                                                                                                            swamps and bogs of the lowlands have almost completely                   Figure 7 Waikato Region transport emissions
                                                                                                                                                                            been cleared or drained across the Metro Area. Tawa and                  (GHG inventory: 07-2015 to 06-2016)
                                                                                                             Matangi
                                                                                                                                                                            totara forests would once have covered most of the well-
                                                                                                                                                                            drained and moderately-drained sites across the floor of
                                                                                                                                                                            the basin, whereas tall kahikatea forests and peat bogs
                                                  Templeview
                                                                                                                                                                                                                                                                            0.6%
                                                                                                                                                                            would have grown in the wetter areas. Now only tiny bush                               Jet Kerosene                  0.2%
                                                                                                                                                                            remnants remain scattered sparsely across the Metro                                                                  Av Gas
                                                                                                                                                                            Area. Wetlands have been similarly reduced with the only                                     2.4%                        0.3%
                                                                                                                                                                            large remaining wetland being Moanatuatua on the peat                              Rail emissions
                                                                                                                                                                                                                                                                                                     LPG
      Key:
     Legend                                                    Rukuhia
                                                                                                                                                                            lands between Cambridge and Te Awamutu.

             District Council Boundaries                                                                                                                                    In contrast, most of the peat lakes that formed on the
                                                                                                                                                                            margins of the domed peat bogs still remain, although
             Metro Plan Area of Interest
                                                                                                                                                                            their water quality is generally poor and the wetlands
             Catchments
                                                                                                                                                                            and bush around their margins have mostly been cleared
             LINZ Swamp                                                                                                                                                     or reduced to a narrow fringe. The peat lakes, their
             Reserves
                                   Ngahinapouri
                                                                                                                                                                            catchments and adjacent former peat bog areas offer
             Doc Public Conservation Areas
                                                                                                                                                 Cambridge
                                                                                                                                                                            valuable opportunities for enhancement. Of the 305
                                                                                                                                                                            threatened species currently known to be present in the
             Peat Soils
                                                                                                                                                                            Waikato Region, 69 specialise in this sort of environment,
             Flood Data                                        Ohaupo
                                                                                                                                                                            preferring bogs, swamps, streams, rivers or lakes.
             Rive - Lakes
                                                                                                                                                                            Many of the hills surrounding the basin floor are still forested                                                        42%
             QEII Trust Covernants                                                                                                                                          as are the steeper gully banks of the rivers and the more                              54%
             Designations                                                                                                                                                   incised streams. The banks of the Waikato and Waipaa
             Significant Natural Areas                                                                                                                                      Rivers are together the best current option for restoration of                                                                     Petrol
             Elite Soil (LUC 1)
                                                                                                                                                                            large-scale connectivity for forest birds requiring continuous
                                                                                                                                                                            forest across the Metro Area.                                            Diesel
             Prime Soil (LUC 2, LUC 3)
             Urban Areas
             Slope 15 to 25 degrees
                                                                                                                                                                            11 Leathwick, J., 2016. Opportunity for conservation of primary          14 Stancu, C., & Marquart, M. (2017). Waikato Region greenhouse gas
                                  Pirongia
             Slope greater than 25 degrees
             HCC Water Bulkmain Existing                                                                                                                                    indigenous-dominated ecosystems in the Central Waikato Zone.             inventory - July 2015 to June 2016. Waikato Regional Council. https://
                                                                                                                                                                            Unpublished report to the Waikato Regional Council.                      www.waikatoregion.govt.nz/assets/WRC/WRC-2019/TR201731.pdf
             HCC Wastewater Interceptors                                  Te Awamutu
                                                                                                                                                                            12 Waikato-Tainui. (2013). Chapter 7: Towards environmental              15 2018 Manaaki Whenua - Landcare Research report (LC3348)
     Digital Terain Model (Motoriki
     Datum)                                                                                                                                                                 enhancement - Te Whakapakari i Te Taiao. In Waikato-Tainui               entitled ‘Hamilton Halo Strategic Review: future options for Halo
             RL: 165m                                                                                                                                                       Environmental Plan (pp. 56-57). https://www.waikatotainui.com/           goals and implementation.
                                                                                                                                                                            services/taiao/tai-tumu-tai-pari/13 Stancu, C., & Marquart, M. (2017).
             RL: 10m                                                                                                                                                        Waikato Region greenhouse gas inventory - July 2015 to June 2016.
                                                                                                                                                                            Waikato Regional Council. https://www.waikatoregion.govt.nz/assets/
                                                                                       Kihikihi

                                                                                                                                                                            WRC/WRC-2019/TR201731.pdf
20                                                                                                                                                                                                                                                                                                                        21
2.4.1 Emission sources
Most greenhouse gas emissions in the Waikato region              Potential effects of climate
are from agriculture, accounting for 75% of the region’s         change on the Waikato region
emissions. This includes carbon dioxide from the deep
peat soils that form some of our best agricultural soils.        Changes in weather patterns
When drained for agriculture, the peat is exposed to the
atmosphere and it oxidises, causing the soil to subside at
                                                                 - differences in rainfall,
a rate of about one metre every 50 years.                        temperature and microclimates
Transport is the second highest contributor, at 12% of
                                                                 could affect agriculture and
emissions. Most emissions from transportation sources            horticulture. The location of some
are from on-road transport, contributing approximately           industries, agriculture, horticulture
97% of the total (2015/16 data).13
                                                                 and tourism may change.
The Waikato’s transportation emissions per capita are
higher than the New Zealand average (at 3.61 compared            More turbulent weather - extreme
3.27 with emissions per capita in metric tonnes of carbon        weather can increase flooding,
dioxide equivalent, 2015/16).14 The Metro Area is likely to
be contributing higher transport emissions than the rest of
                                                                 erosion, droughts and damage
the region due to the level of urbanisation in this part of      ecosystems.
the region
                                                                 Sea level rise - higher sea levels
                                                                 will affect coastal communities
2.4.2 Mitigation                                                 increasing coastal flooding and
Reduction in greenhouse gas emissions will happen in the         erosion.
context of nation-wide central Government-led emissions
initiatives, including land and resource uses that are outside   Threats to biodiversity - species
of the focus of the Metro Spatial Plan. In the context of this   that are already under threat or
Plan, we can aim to reduce emissions through approaches
such as making sure urban development reduces the
                                                                 at the limit of their climatic range
need to travel, providing improved travel choice to key          may not be able to survive.
destinations, and transitioning over time to lowering the
need for car-based travel.
                                                                 New diseases and pests may
                                                                 take hold. Tropical pests and
Carbon sequestration is another important element
in mitigating greenhouse gas emissions. In the Metro             tropical diseases like malaria may
Area, we have opportunities to consider the carbon               become established in areas
sequestration role of peat soils. Peat lands store around
800 tonnes of carbon per hectare compared with mature
                                                                 where they currently do not exist.
indigenous forests which store around 250 tonnes of
                                                                 Waikato Regional Council. (2019). Climate change. https://
carbon per hectare across the region, peat soils have            www.waikatoregion.govt.nz/environment/natural-resources/
been estimated to store carbon equivalent to five years of       air/weather-affects-air-quality/climate-change/
New Zealand’s net emissions (source: Waikato Regional
Council). There are substantial opportunities for carbon
sequestration that also delivers habitat restoration.15

22
3
3. Harnessing growth
for greater liveability
                                                                                                                                        “Quality affordable housing is
                                                                                                                                        important for healthy families.
                                                                                                                                        Families and communities can
                                                                                                                                        have better outcomes when
                                                                                                                                        suitable quality housing is
                                                                                                                                        available to all.”
                                                                                                                                                                                                   Figure 8 Social Housing Register

                                                                                                                                                                                                   1,000,000
                                                                                                                                                                                                                     New Zealand
                                                                                                                                                                                                                     Auckland
                                                                                                                                                                                                                     Hamilton
                                                                                                                                                                                                                     Tauranga
                                                                                                                                                                                                                                            Wellington
                                                                                                                                                                                                                                            Christchurch
                                                                                                                                                                                                                                            Dunedin

                                                                The growing gap between incomes and housing costs                       Waikato Region Housing Initiative – 2018 Housing
                                                                means more individuals and households are struggling.                                                                               800,000
     We have an opportunity to                                  The shortage of quality and affordable housing and
     harness growth to make our                                 increasing household stress tends to have the worst
     urban areas more affordable                                impact on the most vulnerable people in the community,                               • Household incomes have not kept up           600,000
                                                                including Maaori, older people, solo parents, students,
     and attractive.                                            children and people with complex physical and
                                                                                                                                                      with house price growth.

     We need to provide for a quality, vibrant metro
                                                                psychological needs.                                                           •      Around 75% of Hamilton homeowners
                                                                                                                                        are spending more than 30% of their incomes on               400,000
     area where communities have choices and                                                                                            housing costs.
     easy connections to jobs, affordable homes and
     recreational opportunities.                                                                                                    •   Rents have also increased significantly. In Hamilton,
     What happens if we don’t rise to the challenge?                 “The liveability of urban areas                                    rents increased by 19% between 2015 and 2018.               200,000
                                                                     stems from unique combinations                                 •   Recent demand for the social housing register has
      •   Housing options in the metro area will                     of amenity values (open
                                                                                                                                        grown dramatically in Hamilton, Waikato and Waipaa:
          continue to be unaffordable for many.                                                                                         from 255 in December 2017 to 1,210 in December                        0
                                                                     space, design features and                                         2019 (an increase of 375 per cent over 2 years).16                         07       09       11       13      15       17      19
      •   Lack of choice of housing typology and
          location limits will affect affordable options.            urban vegetation); historic and                                •   There is an existing housing supply shortfall of around
                                                                                                                                        4,000 houses in Hamilton. The majority of the shortfall
      •   Poor access creates barriers to                            cultural heritage; location; and                                   is in community and social housing.17                         (Data source: The Housing Register, December 2019)
          opportunities and imposes additional                       intangibles such as character,
          transport costs on households.
                                                                     landscape, and ‘sense of place.”                              If we can address our housing challenge it will have
                                                                                                                                   significant flow-on benefits in terms of health, social and
                                                                     Parliamentary Commissioner for the Environment. (1998). The   cultural wellbeing, education and the economy.
                                                                     cities and their people: New Zealand’s urban environment.
3.1 Housing affordability                                            (https://www.pce.parliament.nz/media/pdfs/cities.pdf)

We need to improve liveability, including
affordable housing that meets our
                                                                              The current state in terms of housing in
needs. Without change, housing options                                      the metropolitan area can be summarised as
in the metro area will continue to be                                    follows, by focusing on the main urban centre
unaffordable for many and a lack of                             where we have to best information:
choice of housing typology and location
will further affect affordable options.                          •   Home ownership rates have been declining. In
                                                                     Hamilton, 43% of people owned their own home in
                                                                     2016 compared to 55% in 2001. Maaori and Pacific
Inefficient growth can lead to reduced community
                                                                     peoples have lower household ownership relative to
wellbeing and access to opportunities such as housing,
                                                                     the general population.
jobs, education, health and recreation. These are all
elements that affect liveability and quality of life.            •   Hamilton is the third (after Auckland and Tauranga)
                                                                     least affordable housing market in New Zealand, with
There is the potential for Metro Area to emerge as a
                                                                     a median house price to median household income
significant and thriving metropolitan area, but this will                                                                          16 The Housing Register, December 2019 version, from Ministry   17 Nifa Limited. (2019). Waikato region housing initiative – 2018
                                                                     of 6.8 times (three times is considered affordable).
only work if there is a strong focus on creating a great
                                                                     Waikato and Waipaa districts have similar issues with         of Social Development at: https://www.msd.govt.nz/about-msd-    housing stocktake. The Waikato Plan. https://waikatoplan.co.nz/
place to live. This includes meeting housing needs,                                                                                and-our-work/publications-resources/statistics/housing/index.   assets/Waikato-Plan/Projects/Final-Housing-Stocktake-Report-minor-
                                                                     house price to incomes sitting at between 4.5 and 5.5.
providing affordable housing choices, improving access                                                                             html#LatestresultsndashDecember20191                            change-6-September-2019.pdf
to employment, education and services, addressing                •   Median house prices have risen significantly in all                                                                           Momentum Waikato Community Foundation. (2016). Waikato Vital
deprivation issues and enabling a high-quality built                 three territorial areas over the last five years at a rate                                                                    Signs. https://momentumwaikato.nz/uploads/Waikato_Vital_Signs_
environment. We know that if we can do these things, we              of around 9% per annum. The median house price in                                                                             Report_2016.pdf (Statistics NZ)
can significantly improve the quality of life for our people.        Hamilton is $597,000.

24                                                                                                                                                                                                                                                                          25
1B
                                                                                                     Figure 9 Household incomes      Median Houses Prices – Hamilton,                                             Average Dwelling Value, 2007-201919
                                                                                                        less than national average   Waikato & Waipaa, 2001-201818
                                                                                                                                                                                                                                    New Zealand           Wellington
                                         1

                                                                                                                                                                                                                                    Auckland              Christchurch
                                                                                                                                       $700,000                                                                                     Hamilton              Dunedin
                                             Waikato
                                             District                                                                                                                                                                               Tauranga
                                                                                                                                       $600,000
                                                                                                                                       $500,000                                                                 1,000,000

                                                                                                                                       $400,000
                                                                                                                                       $300,000                                                                   800,000
                                                                                                                                       $200,000
                                                                                                                                       $100,000
                                                                                          1B                                                                                                                     600,000
                                                                                                                                                 0
                                   39A                                                                                                                 Mar 01         Mar 06   Mar 13     Dec 18

                                                                                                                                                                                                                  400,000
                                             1

                                                                                                                                                     Hamilton
                                                                                                                                                     Waikato District
               39
                                                             Hamilton                                                                                Waipa District
                                                               City                                                                                                                                              200,000
                                                                                                26

          23                                                                                                                                                                                                              0
                                                                                                                                                                                                                               07      09       11      13       15      17     19
                                                                            1

                                                                                                               1B

                                                                                                                                                     Within the next 25 years the
                                                                                                                                                     Waikato regions population is
                                                                                                                                                                                                       135%
                                                                                                           1

                                                                                21
                                                                                                                                                     expected to grow by around

                                                                                                                                                     89,000
                                                                                                                                                                                                                      increase indemand on the social
                                                                                                                                                                          people
                                                                        3
                                                                                                                                                                                                       housing registar from December 2017 (361) to
                                                                                                                                                                                                       December 2018 (896) in the Waikato region.

      Key:

                                                                                                                                                                                         8%                                            51,000
               District Council Boundaries
               Railway                                                                                                                                                In 2018, more than            of the                    Roughly
                                                                                                                                                                      population in the Waikato needed financial              houses are needed in the
      Household income                                                               Waipa                                                                            top-ups from the Government to afford                   Waikato region over the next 25
      < 2019 national                                                                District                                                                         their rent or mortgage. Total $9.8m.                    years including approximately
      average ($102,613)                                                                                                                                                                                                      26,000 in Hamilton.

               2500 - 25,000
               25,001 - 40,000                                                                                                                   Source: “The Waikato Plan. (2019). Waikato region
                                                                                                                                                 housing initiative: 2018 stocktake report summar
               40,001 - 55,000
               55,001 - 70,000
               70,001 - 85,000
               85,001 - 100,000
               100,001 - 102,613
               N/A                                                                                                                   18 The Waikato Plan. (2019). Waikato region housing initiative: 2018         19 Data from CoreLogic
                                                                                                                                     stocktake report summary. https://waikatoplan.co.nz/assets/Waikato-
     (Data source: StatsNZ)                                                                                                          Plan/Projects/6320-Housing-Initiative-Summary-Report_WR.pdf                  Future Proof. (2019). Future Proof market indicators report. https://
                                                                                                                                                                                                                  www.futureproof.org.nz/assets/FutureProof/Documents/Housing-and-
                                                                                                                                                                                                                  business-market-indicator-monitoring-report-May-2019.pdf

26                                                                                                                                                                                                                                                                                   27
Figure 10 Index of
3.1.1 Socio-economic deprivation                                                                                         1B

                                                                                                                                                                          social deprivation
The metropolitan area has widely varying levels of                                                      1

socio-economic deprivation. Those who are identified
as deprived experience greater hardships and have
insufficient access to resources such as education,                                                           Waikato
housing and healthcare. This goes to the heart of                                                             District
liveability and quality of life and helps identify areas
that stand to benefit most from investment into better
affordable housing and access driven by improved
transport choice.
The New Zealand Index of Deprivation (2018) combines
nine variables from the 2018 census which reflect nine
dimensions of deprivation as a measure of relative
socioeconomic deprivation.20 Nearly half (47%) of the                                                                                                      1B

Metro Spatial Plan population lives in areas measured
as amongst the 30% most deprived areas in the country.                                            39A

This is particularly acute in Hamilton where 56% of the                                                       1

population fall into this category. In Waikato District a large
part of the population lives in areas of low deprivation
and a large part of the population lives in areas of high                            39
                                                                                                                              Hamilton
deprivation with less in the middle. Waipaa has the lowest                                                                      City
amount of population in deprived areas amongst the three.
                                                                                                                                                                 26

                                                                                23

 Percentage of Population
                                                                                                                                             1

 by Deprivation Index Area
                                                                                                                                                                          1B

 High

                                                                                                                                                                      1

                                                                                                                                                 21

                                                                        Key:
                                                                                                                                         3

                                                                               District Council Boundaries
                                                                               Railway

                                                                        Deprivation Index

                                                                               High

                                                                                                                                                      Waipa
                                                                                                                                                      District

  Low

            0%       5%       10%      15%       20%        25%
                                                                               Low
               Hamilton                   Waipa District
               Waikato District           Total Metro Spatial Plan
                                                                      (Data source: Socioeconomic
                                                                      Deprivation Indexes: NZDep and
                                                                      NZiDep, Department of Public
                                                                      Health, University of Otago online at
20 Socioeconomic Deprivation Indexes: NZDep and NZiDep,               https://www.otago.ac.nz/wellington/
                                                                      departments/publichealth/research/
Department of Public Health, University of Otago online at https://   hirp/otago020194.html#2018)
www.otago.ac.nz/wellington/departments/publichealth/research/hirp/
otago020194.html#2018

                                                                                                                                                                                           29
3.2 Economic performance                                                                          more productive than smaller cities. Broadly speaking, as
                                                                                                  the effective density of a city doubles, the productivity of
                                                                                                  its working population can increase by 3-8%.22
We want to increase economic                                                                                                                                           “A high-performing city balances
                                                                                                  Another larger population centre can support a more
productivity by the way our urban areas                                                           robust national economy. The Metro Area can grow into
                                                                                                                                                                       the benefits and costs of
grow and perform. This can translate                                                              this opportunity.                                                    agglomeration to provide
into higher wages, more and better                                                                Urban places with the right mix of amenities and earning             opportunities for current and
jobs, and greater housing affordability                                                           opportunities benefit the wellbeing of their people.                 potential residents to achieve
                                                                                                  Transport connections, social infrastructure and density
for our people.                                                                                   can contribute positively to earning opportunities and               their goals. By doing so, a
As a hub of agriculture, transport and trade our area
                                                                                                  amenities. If we continue to grow as a spread out,                   high-performing city effectively
                                                                                                  low-density city, it may not achieve the benefits of
offers diverse and growing opportunities for employment,
                                                                                                  agglomeration and is less likely to reach the productivity           contributes to the wellbeing of its
education and investment. As part of the ‘Golden Triangle’
of economy and freight with Auckland and Tauranga,
                                                                                                  opportunities available to a large city in New Zealand.23            residents.”
the Metro Area is well connected to major hubs and                                                There is room for increased productivity in the Metro
other regions. In addition to strong regional connections                                         Area. Growth of per capita Gross Domestic Product in the             Waikato Region Housing Initiative – 2018 Housing
Hamilton’s proximity to Auckland International Airport                                            Waikato has lagged New Zealand growth, increasing only
and the North Island’s ports ensures the city is strongly                                         2% in total over the last 10 years (to 2019), in comparison
linked to the rest of the world. Our sub-region can play an                                       to GDP per capita for the whole of New Zealand which
increasingly significant role in providing for growth in New                                      has increased by about 7% in that period. 24,25
Zealand - to the benefit of our people and our neighbours.
                                                                                                  In Figure 10, Productivity vs importance to local economy
From a national perspective, a challenge facing New                                               the dark line represents the average New Zealand
Zealand’s economic structure is a relative lack of large                                          productivity for an industry. Markers show the relative
population centres within which activities like the creative                                      importance of an industry to the local economy. Those to
sector, research and development, logistics, marketing                                            the right of the line are an industry that is more productive
and sales and technology and innovation can thrive.21                                             than the average, while those to the left are lower than
Larger cities with larger labour markets are generally                                            average. Most markers in Auckland are higher than the
                                                                                                                             average - they have a higher
                                                                                                                              than average productivity. The
                                                                                                                              Waikato region and Hamilton
            Figure 10 Productivity vs                                                                                         city, with a few notable
            importance to local economy                                                                                       exceptions, are typically to the
                                                                                                                              left of the average line, showing
                                                                                                                              room for improvement to GDP
                              14%
                                                                                                                              per capita.
                              12%                                                                                             Improving the participation rate
     Share of local economy

                              10%                                                                                             in employment is an opportunity.
                                                                                                                              There are areas of concentrated
                              8%                                                                                              unemployment, particularly
                              6%                                                                                              Hamilton and parts of Waikato.
                                                                                                                              By fostering the development of
                              4%                                                                                              Hamilton and the wider Metro
                              2%                                                                                              Area as a denser and better-
                                                                                                                              connected metropolitan area
                              0%                                                                                              we can support an increased
                                    0%    20%       40%      60%       80%       100%      120%      140%     160%            amount of high-value economic
                                         Regional productivity as % of New Zealand productivity by industry                   and social activities. Growth
                                                                                                                              done well has been shown to
                                                                                                                              translate into higher wages,
       (Data source: Te Waka (2019 Quarterly Economic Update Q4; and Infometrics)
                                                                                                                              more and better jobs, and
                                                                                                                              greater housing affordability.

21 The Future Hamilton – Role, Function, Purpose, BERL                                            23 The Future Hamilton – Role, Function, Purpose, BERL
22 Rosenthal, S., and Strange, W. (2004), ‘Evidence on the nature                                 24 Te Waka. (2019). Quarterly economic update Q4: 2019. From:
and sources of agglomeration economies’, pp. 2119-2171 in Cities and                              https://www.tewaka.nz/site_files/18710/upload_files/TeWaka_
Geography, Volume 4, edited by V Henderson and J Thisse. Elsevier.                                QuarterlyEconomicUpdate_Q42019_A4_11-251119_final.pdf?dl=1/
2 Maré, D. C, and Daniel, J G. (2009), Agglomeration elasticities in                              Infometrics
New Zealand, NZ Transport Agency Research Report 376. Available                                   25 Te Waka. (2019). The Waikato economy. From: https://www.tewaka.
at: https://www.nzta.govt.nz/assets/resources/research/reports/376/
docs/376.pdf                                                                                      nz/site_files/18710/upload_files/TeWaka_TheWaikatoEconomy_
                                                                                                  Jun19_A4_9-071019_final.pdf?dl=1/Infometrics

30
You can also read