Spatial Equity in Urban Public Space (UPS) Based on Analysis of Municipal Public Policy Omissions: A Case Study of Atizapán de Zaragoza, State of ...
←
→
Page content transcription
If your browser does not render page correctly, please read the page content below
societies
Article
Spatial Equity in Urban Public Space (UPS) Based on
Analysis of Municipal Public Policy Omissions: A
Case Study of Atizapán de Zaragoza, State of México
Elsa A. Pérez-Paredes 1, * and Aleksandra Krstikj 2
 1    Environmental Sciences Department, Instituto de Estudios Superiores de la Ciudad de México Rosario
      Castellanos, 07979 Mexico City, Mexico
 2    Escuela de Arquitectura, Arte y Diseño, Tecnologico de Monterrey, Av. Lago de Guadalupe KM 3.5,
      Margarita Maza de Juárez, 52926 Cd López Mateos, Estado de México, Mexico; sandra.krstik@tec.mx
 *    Correspondence: elsa.perez.paredes@gmail.com; Tel.: +52-15533328177

 Received: 15 November 2019; Accepted: 27 December 2019; Published: 13 January 2020

 Abstract: International agendas, such as the 2030 Sustainable Development Goals, have been
 established as global guidelines for equitable planning of urban centers. However, there is a lack of
 indicators and tools for public policy planning at the local level. Spatial equity in planning has been
 related to the spatial match between public facility level and residents´ distribution. The objective of
 this research was to assess the spatial inequity in urban public space (UPS) of Atizapán de Zaragoza,
 State of Mexico, and analyzed the cause of this phenomenon with a methodological framework
 based on the general indicator omissions in public policy. The indicator, omission of municipal
 public policies associated to UPS, allowed us to explain the existence of the spatial inequity in:
 (1) the conceptualization and interpretation that decision makers have about urban environmental
 development in the territory; (2) the lack of a public discussion about the sustainable vocation of the
 municipality; and (3) the dominant values of the actors involved in the production, planning, and
 installation of UPS. The significance of this phenomenon affects the recognition that UPS is a primary
 element for guaranteeing the rights to a healthy environment in equitable and sustainable cities and a
 resource for strengthening social cohesion, governance, and appropriation of public assets.

 Keywords: urban public space; spatial equity; un-politics; omission; public policy; Atizapán
 de Zaragoza

1. Introduction
     Urban public spaces and spatial equity are articulating elements in the construction of public
problems. The study of urban public spaces (UPS) from a socio-environmental approach allows a
greater understanding of urban contexts and comprehensive and equitable public policies. Lefebvre [1]
discussed the public space of cities as a social creation, signaling that its production and reproduction
has an important influence on social and environmental systems in cities. Considering the central urban
and social functions that UPS perform, we can define them as places that prioritize the infrastructure
and urban equipment over social characteristics and have the purpose of providing open and accessible
environment for social interaction. According to the Mexican Secretariat of Social Development
(acronym in Spanish: SEDESOL) [2], UPS represent ideal places for the development of sports,
recreation, and artistic-cultural activities, as well as for the use and enjoyment of the community.
However, from a socio-environmental aspect, crucial for this study, public spaces are primarily
considered social spaces where social reproduction develops based on power relationships [1,3].
Moreover, previous studies showed that people living close to parks enjoy health benefits including
mental health, stronger social ties, and sense of security [4–7]. Allocating the use of land to public

Societies 2020, 10, 8; doi:10.3390/soc10010008                                 www.mdpi.com/journal/societies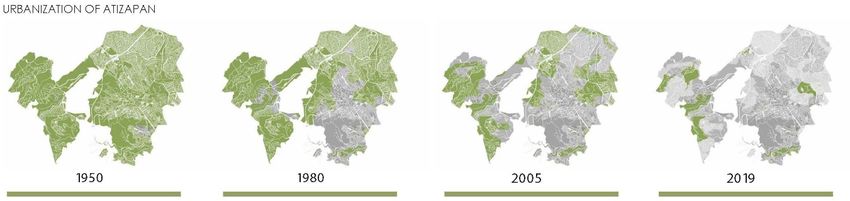
Societies 2020, 10, 8                                                                                2 of 19

spaces in cities promotes coexistence among those who live in the same neighborhood, being the
first step for greater participation of communities, local development, and sustainability [6]. These
benefits often result in an increase of property value [8,9]. Thus, the complexity that urban public
spaces face in public policies is characterized by various aspects, namely the lack and inequality of
their offer, contribution to the quality of life [10–12], privatization [13,14], abandonment or lack of
use [2], inequitable geographical distribution in cities [15], internal insecurity [16], and the lack of
planning in urban policies by governments [17–21]. Due to these complex and systematic aspects, in
recent years the UPS has acquired a significant place in the debates about the city, the agenda of urban,
environmental, and social policies, as well as in the theoretical works from various disciplines.
      Lately, it has been confirmed that the majority of Latin American cities have scarce UPS, with
poor quality and inequitable distribution [2,6]. The UN-Habitat goal for 2030 is to increase the percent
of UPS in areas with 150 inh/ha to 45%, where ideally 15% of that UPS would be shared between open
spaces, green areas, and public equipment [22,23]. The WHO recommends from 9–12 m2 /inh of green
public [24,25] located equitably and in maximum 15 min’ walk from housing. Thus, the social role of
UPS should be analyzed from the aspect of equity in planning. However, very few studies discussed
the equity in distribution of UPS, even though the UPS embodies the democracy of cities and the
expression of rights of its inhabitants [26] and therefore, the guarantee of these rights.

Research Question and Aim
      Equality guarantees that everyone is provided with equal opportunities to fulfill their necessities.
On the other hand, equity deals with understanding and providing people with what they require to
fulfill their necessities [27–29]. The crucial difference lies in understanding the needs of vulnerable
groups to receive disproportionately more benefits [30], thus equity differs from equality in taking
in account the socio-economic profile of different groups of citizens [31]. Kabanoff [32] links the
different aspects of equity and equality with conflict in two basic pressures: (a) one stems from
equity violations and results in overt conflict involving attempts to restore equity and (b) the other
stems from equality violations and results in non-directed conflict that is symptomatic of decreased
social cohesiveness. According to Frederickson [33], social equity in public administration is dealing
with fairness of organization, management and delivery of public services and in the United States
system is considered a third pillar after efficiency and economy [34]. The concept of equity in the
socio-spatial studies has had various handlings from the different disciplinary approaches, with some
problematizing the complex situation faced by equity that leads to other discussions of variables
or indicators, such as: distribution, availability, access, quality of spaces and particularly power,
Governance, and decision-making [15,26,35].
      Our approach is to analyze the UPS from the aspect of spatial equity [28] or providing just
distribution of public facilities as a result of public policies that regulate the spatial planning. In the
context of spatial equity, Yuan et al. [36] defined the equity in terms of service distribution from two
aspects: (1) horizontal equity, in which everyone receives the same public benefit following the concept
of social equality; (2) vertical equity, related to social equity and based on the different ability and
demand of various social groups. Therefore, spatial equity in planning is related to the spatial match
between public facility level of service and the distribution of residents and is intimately related to the
accessibility of public goods, which should exceed the technical, cognitive, physical and socioeconomic
capabilities that the various population groups might have. On the other hand, it is relevant to carry out
research on urban public policies at local level to understand and explain the decision-making process,
public actions or omissions in public problems. The research on public policies regarding the UPS makes
it possible to identify the interaction that exists between the actors involved in the genesis of public
problems, in apparent and manifested conflicts, in the operational and social construction of problems
as well as in the interests and spheres of influence. International agendas, such as the Sustainable
Development Goals (SDGs), the New Urban Agenda and the Intergovernmental Panel on Climate
Change have been established as guidelines for planning of urban centers [37]. However, there is a lack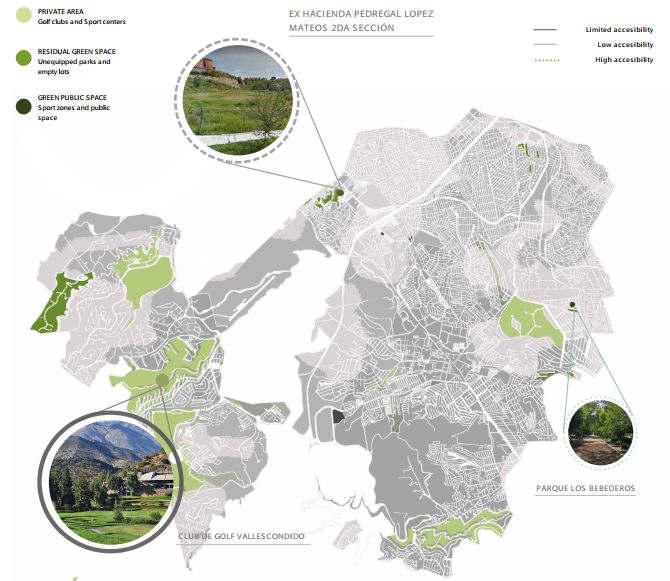
Societies 2020, 10, 8                                                                                3 of 19

of indicators and systems of information associated to UPS at the local level. For example, Mexico City,
until recently, lacked information regarding green public space distribution and socio-demographic
data [38]. In addition, very few methods and instruments of planning exist that can be used by local
governments in equitable distribution planning of UPS. Therefore, there is an urgent need to develop
instruments for public policies that can help local governments in improving the spatial equity of
planning UPS.
      The problem examined in this study is the equitable distribution of green public space in the local
context and recognition of local structures and actions in the process of spatial (in) equity design to
unpack their influences. The main research question that we focused on was: is it possible to explain
the unequal distribution of UPS with the omission of municipal public policy in Atizapán de Zaragoza,
State of Mexico? Public policy scholars [39–41] have not only dealt with the decision as an action.
Numerous studies and analyses have long observed that the public decision can also be expressed in
non-action, that is, omission. The classic work of Crenson [42] highlights how the decision-making
process is guided by the non-decision-making process, on which we base the approach of this case
study. The hypothesis was that if we can clarify the omissions in the process of policymaking, the role
of the active agents and their interests in the UPS planning, then we could provide guidelines for future
planning of UPS based on social equity. Thus, the framework of this research establishes that there is
an omission (un-politics, [42]) in municipal public policies aimed at public spaces that prevents having
an equitable perspective in local organizational processes based on governance [43]. The objective
is to identify the deficit and inequitable distribution of urban public spaces through a diagnosis and
analysis of the municipal policies in Atizapán de Zaragoza, State of Mexico, which can serve as a
guideline for proposing future public policy based on equity. One of the central specific objectives is
to analyze the elements of policy omissions associated with the deficit and unequitable distribution
of the UPS in the municipality, in which three indicators, detailed in the Methodology section, were
established to explore the reasons, the context and the actors that participate in the current planning
of UPS. The aggregated effect that local-level policymaking based on equity concerns can have on
the sustainability of cities and wellbeing in the urban environments is crucial for the achievement of
national SDGs.

2. Method
      The new planning strategies have had to recognize social equity as one of the guidelines in
planning of UPS, in which there is special attention to recognize groups of low income and those
that are most vulnerable. In this work, we focused on two aspects of social equity in the planning
of UPS: the spatial equity and the public policies that set the base for it. The conditions of spatial
equity were clarified by statistical analysis of the amount of UPS area/inh, and a spatial analysis
of the distribution of UPS (GMaps and QGIS) related to socio-demographic data in Atizapán [44].
The National Geographical and Statistical Institute of Mexico (INEGI, [45]) has abundance of useful
socio-demographic data that is open and easily available. However, the information systems and
their updates are complicated at local level due to the management periods in Mexican municipal
governments (3 years), institutional capacities, a lack of strategic vision of the territory, and a lack of
budgets for the generation of information that allows evidence-based decision-making. For example,
the inventory list of UPS that was obtained from the Municipality of Atizapán was formed during the
update of the 2015 Municipal Development Plan, however it is still not officially published. This is the
reason why, in many cases, the research on local level is based on data several years old.
      The analysis of public policies was based on identification of the level and scope of omissions
or inactions manifested in the attention, tensions, interrelations, manipulations, and biases that exist
around a public problem, and allowed for a qualitative analysis of governance with the general
indicator omissions in public policy. It is important to recognize that public policies are not considered
as linear but complex processes [39,40]. This allows us to recognize the social order in which policies
operate, with perceptions, interests, and relationships between various agents and the aspects provided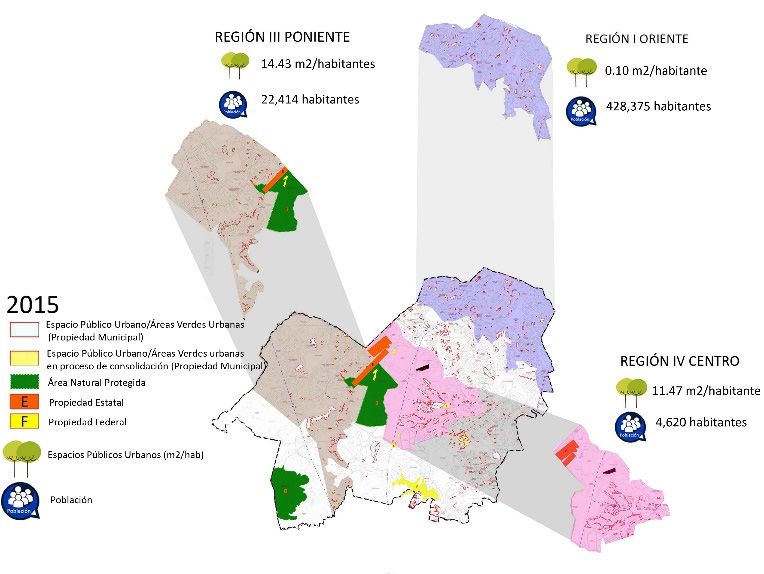
Societies 2020, 10, 8                                                                                          4 of 19

by the value systems, ideologies, beliefs, and discourses [46] that influence the decision making of
public policies and community order [47].
      For the purpose of the analysis, the following indicators were established: Indicator 1. Community
pressure for the resolution of environmental and urban problems associated with UPS and their
governmental response; Indicator 2. Good practices or policies from other municipalities and countries;
Indicator 3. The budgetary allocation of the rescue, maintenance, and installation of existing public
spaces in this municipality.
      As can be seen in Table 1, the indicators that were designed to analyze the omissions were selected
under the criterion of having “measurement” elements and means of verification that allowed their
analysis. The tools and techniques for obtaining data and information on omissions were released
official documents, journal articles, as well as the information generated by interviews of various local
actors (public officials, neighborhood leaders) and the participant observation and fieldwork in the
study zone and was carried out between 2013 and 2015. The interviews were structured based on the
following questions:

            Table 1. Selected indicators for the analysis of omissions in public policy associated to UPS.

                 Indicators                          Objectives                       Verification methods
                                                                               a. Review of newspaper articles in
                                                                                 the journals Periódico Dinamik y
                                                                                     Periódico Adelante between
                                                                                             2013–2015;
                                            Identify priorities, demands,      b. Four interviews with leaders of
    1. Community pressure for the
                                         claims, and complaints regarding          different social organizations,
   resolution of environmental and
                                         urban and environmental public               neighbors, and citizens;
   urban problems associated with
                                           problems in the municipality.           Interviews with three public
     UPS and their governmental
                                         Explore the type of answers from      officials involved in the creation of
               response
                                         the authorities to these demands.      public policy associated to UPS;
                                                                                  c. Document review of inform
                                                                                      bulletins, programs, and
                                                                               governmental actions (2012–2015);
                                                                                   d. Field observation of UPS.
                                                                               a. Review of newspaper articles in
                                                                                 the journals Periódico Dinamik y
                                            To recognize if even with the
                                                                                    Periódico Adelante between
                                         technical information provided to
 2. Good practices or policies from                                                         2013–2015;
                                          decision makers to carry out the
 other municipalities and countries                                                b. Latest research regarding
                                         required public policies, they did
                                                                                   indicators related to UPS on
                                            not act against the problem.
                                                                               national, regional (Latin America),
                                                                                      and international level.
                                           Recognize by means of budget
 3. The budgetary allocation of the
                                         allocation and expenditure, what        a. Document review of budget
      rescue, maintenance, and
                                          level of priority do public spaces       allocation and budget used
 installation of public spaces in this
                                         have in relation to other urban and            (2013/2014/2015).
             municipality
                                               environmental aspects.
                                                 Source: the authors.

2.1. Interviewee Data
     a. Name and training?; b. Area and position in which you work or have worked?; c. Please
indicate your working time period; d. Do you know the municipality well?
     I. Characteristics of the public space
     1. When I say “public space”, what do you think about?
     • What characteristics (attributes) should a public space have?
     II. Public space problem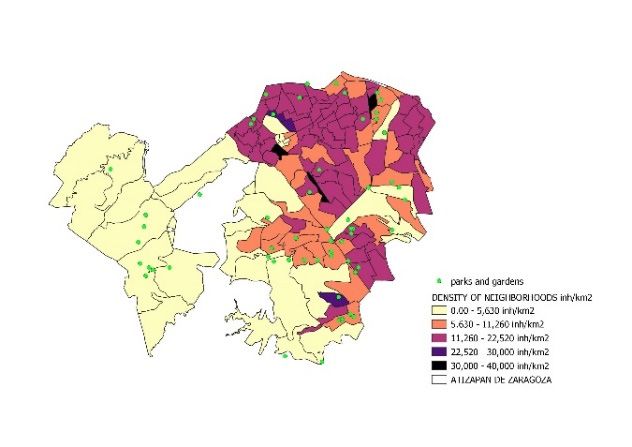
Societies 2020, 10, 8                                                                                 5 of 19

      2. What are the main problems regarding public space in the municipality?
      • What are the problems identified in the most important public spaces and why?
      • Do you consider there is a tendency to decrease public space? If yes, what is the reason?
      • Do you think it is important that public spaces have access roads?
      • Do you consider that public spaces are well distributed in the municipality?
      • Who benefits from having public spaces?
      • Do you think there are population groups that use public spaces more? If yes, why is it so?
      • Do you think there are sectoral groups that need them more?
      III. Public space policy
      3. Considering all the problems that the past administration faced, how relevant do you think the
public space issue was? (The bullet points questions below are control questions to complement the
open question listed, in case the interviewee does not give enough information)
      • Why was it relevant or why wasn’t it?
      • What was the most relevant issue?
      • What were the most important policies of public spaces in this administration and in the previous
one (2012–2015)?
      • What were your successes regarding public space?
      • What did not work in planning the public space?
      • If you were responsible for this policy, what changes would you have made to public space
policies and how important would public space have been in your policies?
      IV. Citizen participation and responsibility of public space
      4. Considering that the public space does not only belong to the government, but also to the
citizens, how do you evaluate the interest of citizens in public spaces?
      • Could you describe the profile of organizations interested in public space? What kind of
complaints/demands did they express (if the interviewee is a citizen or from a social group) or receive
(if the interviewee is from the government)?
      • How has the government’s link with these organizations been? Has your participation
been constructive?
      • What happens to citizens who are not from organizations?
      • Do you identify some other groups or sectors that are particularly interested in public space or
that are more interested than others?
      5. In your opinion, who should be responsible for maintaining public spaces?
      6. When you state that the government does (paraphrase), do you consider that this action benefits
all people, or benefits only some groups?
      For this research, the UPS units of analysis were selected based on the following criteria: (a) spaces
used for recreation, (b) spaces for social coexistence, (c) spaces that have green areas within the
residential zones, and (d) spaces for physical activation and sports recreation of the population. Thus,
a typology was established that include: (1) Urban Green Areas (Areas Verdes Urbanas) that may
contain pastures, shrubs, plants, and to a lesser extent trees, and that are located within the urban
environment [48]; (2) Peri-urban Parks or Forests (Areas Naturales), (3) Communal gardens and
urban parks; (4) Playgrounds, outdoor gyms, and public sports; (5) Traffic islands also used for sports
(Av. Jinetes-Bebederos), and (6) Public neighborhood squares. From this typological set up, it was
possible to obtain the proportion of the total UPS area of the municipality for this study and analyze the
distribution by type of space (Table 2). As can be observed in Table 2, the largest areas are found in the
Urban Parks and the Park “de los Ciervos” that together comprise 0.47% of the total municipal area.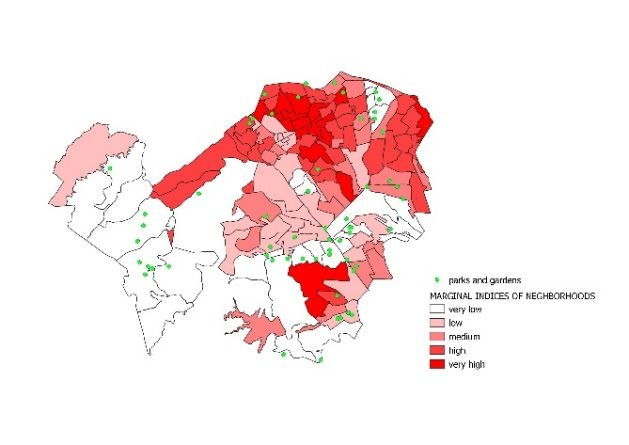
Societies 2020, 10, x FOR PEER REVIEW 6 of 19
the Urban Parks and the Park “de los Ciervos” that together comprise 0.47% of the total municipal
area.
Societies 2020, 10, 8 6 of 19
Table 2. Distribution of UPS area by type (Source: The Municipal development Plan PMDU 2015).
Table 2. Distribution of UPS area by type (Source: The Municipal development Plan PMDU 2015).
Type of space Area (ha) % of area in the total municipal area
ChildrenType
playgrounds
of Space 6.5567
Area (ha) 0.07%
% of Area in the Total Municipal Area
Communal gardens
Children playgrounds 3.42216.5567 0.04%
0.07%
Urban parksgardens
Communal 19.04913.4221 0.20%
0.04%
Urban parks
Park¨de los Ciervos¨ 26 19.0491 0.20%
0.27%
Park de los Ciervos 26 0.27%
Public sport
Public areas
sport areas 6.33876.3387 0.06%
0.06%
Protected natural
Protected area
natural area 274 274 2.81%
2.81%
TotalTotal 61.3666
61.3666
2.2. Atizapán de Zaragoza
Atizapán de Zaragoza is located in the northwest Metropolitan Zone of Mexico City (Figure 1).
The
The distance
distance between the center of Mexico City and the head of of the
the municipality
municipality of Atizapán
Atizapán de
Zaragoza is 23 km [48]. According to the diagnosis of the Regional Program of
Zaragoza is 23 km [48]. According to the diagnosis of the Regional Program of the Tlalnepantla the Tlalnepantla Region
XII (IGECEM,
Region 2012, [49])
XII (IGECEM, to which
2012, [49]) toAtizapan de Zaragoza
which Atizapan belongs,belongs,
de Zaragoza this municipality is in a process
this municipality is in a
of metropolitan
process consolidation
of metropolitan since the
consolidation fifties
since the with
fiftiesrespect to Mexico
with respect City. City.
to Mexico This This
brought about
brought the
about
necessity to generate
the necessity strategies
to generate for the
strategies forurban growth
the urban of Region
growth XII Tlalnepantla
of Region since from
XII Tlalnepantla sincethe 1960´s
from the
to the 1990´s
1960´s the municipal
to the 1990´s population
the municipal has increased
population tenfold,
has increased and especially
tenfold, in thein
and especially period from from
the period 1970
(44,322) to 1980to(202,248)
1970 (44,322) [48]. From
1980 (202,248) 1995
[48]. Fromto 2000,
1995theto municipality of Atizapánofpresented
2000, the municipality Atizapána deceleration
presented a
in its population
deceleration in itsgrowth,
populationand growth,
in 2015 there
and in were
2015489,937 inhabitants
there were 489,937[48]. It is worth
inhabitants [48].mentioning
It is worth
that the proportion
mentioning that thebetween men between
proportion and women menis and
verywomen
similar is
and thatsimilar
very the number of households
and that the number was
of
127,206 with an average size of 3.8 members and, mostly with male house heads.
households was 127,206 with an average size of 3.8 members and, mostly with male house heads.
Figure 1. Location of the municipality Atizapán de Zaragoza in Mexico (by authors, data INEGI).
At the beginning of the 20th century, the municipality of Atizapán de Zaragoza consisted of
villages with rural characteristics, which presented moderate urban growth. From the 1950s, due
to the economic growth of Mexico City, began the concentration of industrial, commercial, and
service activities in Atizapan (Figure 2), mainly along the arterial road to Querétaro in the north [50].
Concurrently, being one of the municipalities near the center of Mexico City, it was also an attractive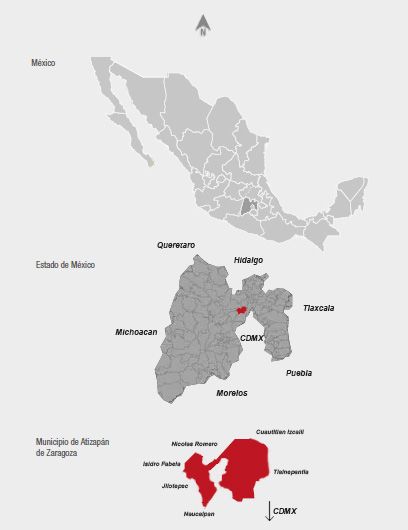
Societies 2020, 10, x FOR PEER REVIEW 7 of 19
At the beginning of the 20th century, the municipality of Atizapán de Zaragoza consisted of
villages
Societies with
2020, 10, 8 rural characteristics, which presented moderate urban growth. From the 1950s, due to7 of 19
the economic growth of Mexico City, began the concentration of industrial, commercial, and service
activities in Atizapan (Figure 2), mainly along the arterial road to Querétaro in the north [50].
destination for thebeing
Concurrently, migration
one ofofthe
Mexico City residents
municipalities near theincenter
search offor a space
Mexico free
City, of atmospheric,
it was acoustic
also an attractive
destination
and visual for theand
pollution migration of Mexicodeterioration
environmental City residents[51].
in search for horn,
Its west a space free of
called atmospheric,
zona Esmeralda, is
acousticone
considered and of visual pollutioninand
the wealthiest theenvironmental
State of Mexico deterioration
and Mexico[51].CityIts west horn, called
Metropolitan, zona
with numerous
Esmeralda, is considered one of the wealthiest in
country clubs, large golf terrains, and private green areas [36]. the State of Mexico and Mexico City Metropolitan,
with numerous country clubs, large golf terrains, and private green areas [36].
Since the 1960s, to avoid the disorderly growth of these areas the government granted facilities
Since the 1960s, to avoid the disorderly growth of these areas the government granted facilities
for the creation of residential and industrial subdivisions. By the 1970s and 1980s, the urban growth of
for the creation of residential and industrial subdivisions. By the 1970s and 1980s, the urban growth
the municipality
of the municipalityhad increased
had increasedsignificantly transforming
significantly transformingsome
some towns intonew
towns into newurban
urban settlements, a
settlements,
situation that generated
a situation that generatedthe the
lacklack
of of
ananurban
urbanstructure thatwould
structure that wouldensure
ensure proper
proper functioning
functioning of theof the
area [41]. It isItinisthis
area [41]. period
in this that
period the
that thegreen
greenareas
areas decreased
decreased inina adrastic
drastic manner.
manner.
Figure 2. Urbanization
Figure process
2. Urbanization of Atizapán
process de Zaragoza
of Atizapán 1950–2019;
de Zaragoza green-natural
1950–2019; areas;areas;
green-natural grey-urbanized
grey-
areasurbanized
(by authors with
areas (by data from
authors PMDU
with 2015,
data from [44]).2015, [44]).
PMDU
It is important
It is important to mention
to mention thatthat
even even though
though in areal
in areal images
images it might
it might seemthat
seem thatthere
thereare
aremany
manygreen
areasgreen
in theareas in the municipality,
municipality, those that those that are
are public, public, accessible,
accessible, and ofare
and of quality quality
muchare much
less. less. In3, we
In Figure
showFigure 3, we show the disproportionate
the disproportionate area allocation
area allocation between privatebetween private
and public andareas
green public ingreen areas Private
Atizapán. in
Atizapán. Private Green areas are considered individually owned properties with strictly regulated
Green areas are considered individually owned properties with strictly regulated access, such as golf
access, such as golf clubs and private sport facilities dominant in the Southwest region. Public green
clubs and private sport facilities dominant in the Southwest region. Public green areas are municipal
areas are municipal public parks and communal gardens with free access. As a result of fragmented
public parks andand
urbanization communal gardens with
lack of integrative free access.
development As aa result
strategy, of fragmented
third category of greenurbanization
areas can be and
lack of integrative development strategy, a third category of green areas can
observed in empty lots or wastelands that we named in this study residual green areas. The update be observed in empty
lots or wastelands that we named in this study residual green areas. The update
of the Municipal Urban Development Plan [52] was very useful to recognize the distribution of land of the Municipal
Urban Development
use. In Figure 4, the Plan [52] land
urban was very
use isuseful
presentedto recognize
consistingtheof:distribution of land use.
1) 34.45% residential In2)Figure
areas; 4.97%4, the
urbanequipment
land use (category
is presentedwithin which UPS
consisting of:is(1)
integrated; 3) 7.09% vacant,
34.45% residential areas;which shouldequipment
(2) 4.97% be evaluated as
(category
residual spaces; 4) 12.07% in process of urbanization which was often
within which UPS is integrated; (3) 7.09% vacant, which should be evaluated as residual spaces; observed as unorderly
development
(4) 12.07% without
in process a sustainablewhich
of urbanization visionwas andoften
care observed
for the environment;
as unorderly and, finally 5) 28.54%
development without a
protected natural areas and 29.28% non-developable land, which if handled properly could be an
sustainable vision and care for the environment; and, finally (5) 28.54% protected natural areas and
opportunity for environmental services that the development plan should consider.
29.28% non-developable land, which if handled properly could be an opportunity for environmental
The zone performs the function of a dormitory municipality, in which most of its inhabitants
services
move that the development
to other areas for work,plan should consider.
do commerce and acquire services. According to the Origin-Destination
The
Survey zone performs
conducted the function
by INEGI of aofdormitory
[49], a total municipality,
607,392 trips were registered in in
which most of itsininhabitants
the municipality 2007,
moveoccupying
to other areas forplace
the fifth work,in do
thecommerce
State of Mexicoand where
acquiretheservices.
survey wasAccording
conducted. to the Origin-Destination
Survey conducted by INEGI [49], a total of 607,392 trips were registered in the municipality in 2007,
occupying the fifth place in the State of Mexico where the survey was conducted.Societies 2020, 10, x FOR PEER REVIEW 8 of 19
Societies 2020, 10, 8 8 of 19
Societies 2020, 10, x FOR PEER REVIEW 8 of 19
Figure 3. Green areas in Atizapán de Zaragoza. (figure by authors, with data from PMDU 2015 [44],
Figure 3. Green areas in Atizapán de Zaragoza. (figure by authors, with data from PMDU 2015 [44],
Google maps,
Figure 3. and
Green fieldinsurvey).
areas Atizapán de Zaragoza. (figure by authors, with data from PMDU 2015 [44],
Google maps, and field survey).
Google maps, and field survey).
Figure 4. Land uses in Atizapán de Zaragoza (figure by authors, with data from PMDU 2015 [44],
Figure 4. Land uses in Atizapán de Zaragoza (figure by authors, with data from PMDU 2015 [44],
Google maps, and field survey).
Google maps,
Figure 4. Landand field
uses in survey).
Atizapán de Zaragoza (figure by authors, with data from PMDU 2015 [44],
Google maps, and field survey).Societies 2020, 10, 8 9 of 19
2.3. The Spatial (in) Equity in Distribution of UPS
As can be seen in Table 3, the municipality is divided into two large populated areas due to
its topographic and density conditions, its road communication structure, and the land uses that
predominate in each of them.
Table 3. Distribution of urban population in Atizapán de Zaragoza (elaborated by the authors, with
data from INEGI 2015).
Urban Area Population Medium Density
Locality
km2 (%) Inhabitants (%) Inh/km2
Northeast 40.9316 (63.32) 462,820 (94.47) 11,307
Southwest 23.7121 (36.68) 27,117 (5.53) 1143
Total 64.6437 (100) 489,937 (100) 100
The high rates of inequality in access and opportunities for urban offers are related to the
socioeconomic status (economic income) of the various social groups that inhabit a territory. Thus,
public space (including urban green areas) is one of the many expressions of social and spatial
fragmentation mechanisms that tend to reinforce each other. This inequality is reflected in the
immediate environment, considering that environmental pressures depend largely on the level of
income and development, leading to the fragmentation, segregation, and privatization of space, as
well as the vulnerability generated by the negative effects of deterioration, environmental, and natural
threats and climate change [53,54].
In order to measure the level of correlation that exists between the socioeconomic level and spatial
inequity, we analyzed the marginalization index as one of the indicators that are available in most
Mexican municipalities. Therefore, we correlated the distribution of public parks and communal
gardens (typologies 2 and 3 in Table 2) with the marginalization and urban density on neighborhood
level to analyze and assess the spatial (in) equity of UPS distribution in Atizapán. For the purpose of
this analysis, we focused only on these typologies of UPS because the inventory that we were able to
obtain from the Municipality of Atizapán was most complete for those types. First, we georeferenced
and mapped all the public parks and communal gardens (58) in QGIS, based on the inventory list
that contains only names and addresses of UPS, using Google Maps, Google Earth, and field survey
observation. Secondly, we added the layer of neighborhood marginalization index, taken as a ready
shapefile from the open map database of Population National Commission (in Spanish, Comisión
Nacional de Población, Conapo, 2015 [44]), and performed a count points in polygon analysis to
estimate the number of parks and gardens in each neighborhood with varied marginalization (Figure 5).
The marginalization index scale is defined by Conapo in very low (most affluent neighborhoods), low,
medium, high, and very high, and is a result of an integral assessment based on 10 separate indicators:
(1) Percent of population aged 6-14 that are not enrolled in a school, (2) Percent of population aged
15 and more that do not have secondary school education, (3) Percent of population without social
security, (4) Percent of child deaths for women aged 15 to 49, (5) Percentage of private homes without
piped water inside the home, (6) Percent of houses without drainage or public network of septic pits,
(7) Percentage of private homes without toilet with water connection, (8) Percentage of private homes
with dirt floor, (9) Percentage of private homes with some level of overcrowding, and (10) Percentage
of private homes without a fridge.
We found that: (1) The majority of high and very high marginalized neighborhoods are located
in the northeastern part of Atizapán and comprise 26.8% of the total urban area (Table 4); (2) only 7
(12%) from the 58 parks in Atizapan (green dots, Figure 5) are allocated in the high and very high
marginalized neighborhoods, while 38 (65.5%) are found in the western and central parts and in
neighborhoods with low and very low marginalization. When we considered the staggering difference
in urban density between the Northeast and Southwest areas in Atizapan (Table 3, medium density),Societies 2020, 10, 8 10 of 19
the need to further analyze the spatial distribution of parks and gardens in relation to neighborhood
Societies 2020, 10, x FOR PEER REVIEW 10 of 19
scale density became evident. For that purpose, we performed a calculation of urban density in all
Societies 2020, 10, x FOR PEER REVIEW 10 of 19
the neighborhoods
population size ofbased eachonneighborhood.
the 2015 data from We Conapo
found that [44] regarding
the majorityarea ofandhigh
population size
marginalized of
each neighborhood.
neighborhoods We found that the majority of high marginalized neighborhoods are also the
population sizeareofalso the most populated ones, with densities more than 11,260 inh/km 2 or 3 times
each neighborhood. We found that the 2 ormajority of high marginalized
most
higher populated ones,
the Municipality with densities
average more than
(5630 inh/km 11,260 inh/km 3 times higher the Municipality
ones,).with
Finally, we overlaid
more thanthe location of 2parks and
2
neighborhoods are also
2 ). the most populated densities 11,260 inh/km or 3 times
average
gardens (5630
with inh/km
the Finally, we
neighborhood overlaid
density in the location
QGIS (Figure of6)
parks
and and
againgardens with the
performed a neighborhood
count points in
higher the Municipality average (5630 inh/km ). Finally, we overlaid the location of parks and
2
density
polygons inanalysis.
QGIS (Figure We 6) andthat
found again performed
only 17 parks a(30%)
countarepoints in polygons
located in analysis. We
neighborhoods with found that
densities
gardens with the neighborhood density in QGIS (Figure 6) and again performed a count points 2 or the in
only
more17 thanparks (30%)
11,260 are located
inh/km 2 or thein neighborhoods areas.with densitiesmostmore than 11,260 inh/km
polygons analysis. We found that most
only populated
17 parks (30%) areThe located discriminated
in neighborhoods areas
within densities
terms of
most populated
proximity to areas.
parks, The
density, mostmarginalization
and discriminated areasare in terms
almost all of proximity
located in the to parks, density,
northeast of and
Atizapán.
more than 11,260 inh/km or the most populated areas. The most discriminated areas in terms of
2
marginalization
If we consider are almost
that all located
the Northeast in the
houses northeast
nearly 95% of
of Atizapán.
the all
total If we consider
population, the that the Northeast
magnitude of the
proximity to parks, density, and marginalization are almost located in the northeast of Atizapán.
houses
spatial nearly 95%
inequitythat of the
in distributiontotal population,
of public parksthe magnitude
and95%communal of the spatial
gardens inequity
in Atizapán in distribution
becomes evident. of
If we consider the Northeast houses nearly of the total population, the magnitude of the
public
The parks
results and
show communal gardens in Atizapán becomes evident. The results show that the level
spatial inequity inthat the levelof
distribution ofpublic
income is correlated
parks and communalwith the allocation
gardens of urbanbecomes
in Atizapán public spaces
evident. in
of
theincome is correlated
municipality, which with thein
results allocation
a of urbanin
differentiation public
the spacestoinenvironmental
access the municipality, which
services of results
public
The results show that the level of income is correlated with the allocation of urban public spaces in
in a differentiation
spaces, confirmingwhich in
thethe access to environmental
unequal services of public spaces, confirming the unequal
the municipality, results distribution of public
in a differentiation in spaces.
the access to environmental services of public
distribution of public spaces.
spaces, confirming the unequal distribution of public spaces.
Figure 5. Marginalization index and public parks. (this figure is by authors, with data from
Figure 5. Marginalization
Municiaplity of Atizapan index
and and public
Conapo parks. (this figure is by authors, with data from Municiaplity
Figure 5. Marginalization index and2015 [44]).
public parks. (this figure is by authors, with data from
of Atizapan and Conapo 2015 [44]).
Municiaplity of Atizapan and Conapo 2015 [44]).
Figure 6. Urban density and public parks. (this figure is by authors, with data from Municiaplity of
Figure 6. Urban density and public parks. (this figure is by authors, with data from Municiaplity of
Atizapan and Conapo 2015 [44]).
Atizapan and Conapo
Figure 6. Urban 2015
density and[44]).
public parks. (this figure is by authors, with data from Municiaplity of
Atizapan and Conapo 2015 [44]).
Table 4. Quantitative distribution of the marginalization in zones (elaborated by the authors with
data
Tablefrom Conapo, 2015
4. Quantitative [44]).
distribution of the marginalization in zones (elaborated by the authors with
data from Conapo, 2015 [44]). Location of Neighborhoods % of Total
Mean Area
Marginalization Index No. of Hoods Municipal
Location of
West Neighborhoods
Central East km2 % of Total
Mean Area Area
Marginalization Index No. of Hoods Municipal
Very low 29 West
7 Central
16 East
5 km
0.982 39
Area
Low 27 1 17 9 0.55 20.25
Very low 29 7 16 5 0.98 39
Medium 24 0 9 15 0.42 13.95
Low 27 1 17 9 0.55 20.25
High 36 3 2 31 0.37 18.27
Medium 24 0 9 15 0.42 13.95
Very high 17 0 1 16 0.36 8.53
High 36 3 2 31 0.37 18.27
Total 133 (53) 11 45 76 (47) 100% (26.8%)
Very high 17 0 1 16 0.36 8.53Societies 2020, 10, 8 11 of 19
Table 4. Quantitative distribution of the marginalization in zones (elaborated by the authors with data
from Conapo, 2015 [44]).
Marginalization No. of Location of Neighborhoods Mean Area % of Total
Index Hoods West Central East km2 Municipal Area
Very low 29 7 16 5 0.98 39
Low 27 1 17 9 0.55 20.25
Medium 24 0 9 15 0.42 13.95
High 36 3 2 31 0.37 18.27
Very high 17 0 1 16 0.36 8.53
Total10, x FOR PEER
Societies 2020, 133REVIEW
(53) 11 45 76 (47) 100% (26.8%)
11 of 19
2.4. The
2.4. The UPS Area/Inhabitant in
UPS Area/Inhabitant in the
the Municipal
Municipal and
and Micro-Regional
Micro-RegionalScale
Scale
We assessed
We assessed thethe deficit
deficitofofUPS
UPSandand green areas
green areasin Atizapán
in Atizapán for for
m2/inhabitant, withwith
m2 /inhabitant, the data
the from
data
the Municipal Development Plan of 2015 [44]. The calculations were based
from the Municipal Development Plan of 2015 [44]. The calculations were based on the simple on the simple formula:
A/B, where: A =where:
∑ UPS A m2=; andUPS
B=∑ minhabitants.
2 ; and B = P The result for all theresult
municipality of Atizapán was
P
formula: A/B, inhabitants. The for all the municipality
1.14 m 2/inh = 613,666 (m 2)/535,435 (inh). This calculation for all types of public
of Atizapán was 1.14 m /inh = 613,666 (m )/535,435 (inh). This calculation for all types of public
2 2 spaces allowed the
verification of the general situation in terms of insufficient amenities provided.
spaces allowed the verification of the general situation in terms of insufficient amenities provided. However, the
perspective
However, theofperspective
global calculation
of globaldoes not allow
calculation doesfor notmicro-regional assessmentassessment
allow for micro-regional of the UPSofarea the
insufficiency in different regions that comprise the municipality. Of the seven
UPS area insufficiency in different regions that comprise the municipality. Of the seven regions of the regions of the
municipality established in the Municipal Development Plan of 2015 [52], the
municipality established in the Municipal Development Plan of 2015 [52], the three most emblematicthree most emblematic
regions were
regions were selected
selected for
for aa more
more detailed
detailed analysis
analysis of
of UPS
UPS area
area sufficiency
sufficiency atat the
the micro-regional
micro-regional level.
level.
These are: Region I. East (ORIENTE in Figure 7); Region III. West (Poniente in Figure
These are: Region I. East (ORIENTE in Figure 7); Region III. West (Poniente in Figure 7); and Region IV. 7); and Region
IV. Center
Center (Centro
(Centro in Figure
in Figure 7). 7).
Figure 7.
Figure Micro-regional distribution
7. Micro-regional distribution of
of UPS
UPS (by
(by Pérez-P,
Pérez-P, 2016).
2016).
The micro-regional analysis of the UPS in the three regions of Atizapán in 2015 was carried out by
The micro-regional analysis of the UPS in the three regions of Atizapán in 2015 was carried out
a quantitative and geo-referential analysis through the specific calculation of UPS surface area in each
by a quantitative and geo-referential analysis through the specific calculation of UPS surface area in
region and per capita. The results indicate the staggering unequal conditions, in which the West region
each region and per capita. The results indicate the staggering unequal conditions, in which the West
with the highest socioeconomic status and least inhabitants is the most privileged with more than 50%
region with the highest socioeconomic status and least inhabitants is the most privileged with more
of the total of existing UPS in the municipality and 14.43 m2 /inh, while the majority of population in
than 50% of the total of existing UPS in the municipality and 14.43 m2/inh, while the majority of
the Northeast has only 0.10 m2 /inh available. The unjust distribution of UPS will be further analyzed
population in the Northeast has only 0.10 m2/inh available. The unjust distribution of UPS will be
from urban planning and equitable governance approach in Section 3.
further analyzed from urban planning and equitable governance approach in Section 3.
2.5. The Omissions of Municipal Public Policies Associated to UPS
The present research considered the variable of “omission of public policies” as the most
pertinent to qualitatively explain how municipal public policies directed to UPS are sustained in the
unjust distribution of UPS. The theoretical framework of omissions was considered optimal becauseSocieties 2020, 10, 8 12 of 19
2.5. The Omissions of Municipal Public Policies Associated to UPS
The present research considered the variable of “omission of public policies” as the most pertinent
to qualitatively explain how municipal public policies directed to UPS are sustained in the unjust
distribution of UPS. The theoretical framework of omissions was considered optimal because it offers a
broad perspective on the processes involved in the interpretation of the problem of UPS (the social
construction of the problem), as well as the social, ideological, environmental, economic, and political
forces that intervene and interact in the public sphere or not. Thus, the analysis considers the context
of intentional burden of the non-decision of actors involved in the public policy decision-making
associated to UPS in the municipality. We argue that although it is the actions that influence the state
of a situation, it is the omissions that can provide other elements of analysis that characterize public
actions; for example: interrelationships of power, biases, and obstacles, among others, that allow a
problem to appear as public and thus, its solution needs to come from the cycle of public policies [41].
The manifestations of municipal public policies omission directed to UPS were analyzed through
indicators developed in the doctoral dissertation of Perez-Paredes, E. [43], whereby the theoretical and
analytical proposals of Crenson [42] and Harvey [26] were reviewed to analyze omissions and spatial
inequalities. For the purpose of the analysis, the following indicators were established: Indicator 1.
Community pressure for the resolution of environmental and urban problems associated with UPS
and their governmental response; Indicator 2. Good practices or policies of other municipalities and
countries; and Indicator 3. The budgetary allocation of the rescue, maintenance and installation of
public spaces in the municipality.
Indicator 1. This indicator identified that the situation and requirements of residential groups
who are motivated to maintain their UPS in order to keep the value of their properties (thus not
involving public good perspective) is moderately articulated, has power, information resources, legal
support, and media impact, which facilitates the dialogue with the local government. Thus, a selective
omission occurs when responding to the demands of mobilized groups, without addressing the urban
environmental needs of disadvantaged groups who have failed to overcome internal conflicts and
tensions. According to the field observation, the review of newspaper articles in local media and
interviews with key actors, it was identified that the actions, carried out by the various government
offices of the City Council of Atizapán de Zaragoza responsible for policies aimed at public space
(maintenance, works, and improvement), are strengthened by the level of neighborhood organizations
with economic, political, and technical-educational power, thus there is omission of public policy
aimed specifically at the population with lower economic resources. This is largely due to sectoring
and discretion of the policy in which the demands and responses to demands of other citizen groups
that are not well organized are not exposed or answered in an articulated and equitable way. We call
this process selective omission, since it depends on the social, economic, and political sector to which
the appropriation of an inclusive public policy with coverage for all sectors of the population belongs.
Extract from an interview: “They want to start again (the consultation of the urban development
plan) because the president has a lot of pressure from the Bellavista ladies group. He wants to start
over ... the plan was completed, but, due to political issues of the state government it has become
complicated.” (Areli, former city hall official)
Extract from an interview: “Here with the ejidatarios an ecological reserve was made and 4
hectares were taken from us. I began to review the papers and I see that 10 years ago, CORETT
(Commission for the Regularization of Land Tenure) designated an ecological reserve with 11 hectars
and said they owned it. And no, it turns out that we have half of this land as an ecological reserve ...
Some ejidatarios do not agree, but the heads do, because they already saw that there is nothing to do.”
(Popeye, community representative)
One of the results that the case study exposed is the absence of a general organized front of citizen
that have an articulated impact on urban environmental policies. On the other hand, exists solid
neighborhood and citizen organizations of specific residential areas in which the central motivations of
their activism and local lobbying is to maintain the land prices of their homes and the surplus value ofSocieties 2020, 10, 8 13 of 19
their residential areas. Thus, the main motivation is based on private interests that represents weak
approach to the right to the city in which the public nature of the urban space is not claimed.
Indicator 2. We analyzed good practices from the neighboring municipality of Tlalnepantla which
is a member of the Northeast Region XII of the State of Mexico and also shares the same regional plan
with Mexico City. This was done for two reasons: the first reason involves reproducing the method
of Crenson [42] established to measure the omission of a city policy compared to a neighboring city
with which it shares the same environmental problem regionally; the second reason was to clarify if
the government of the municipality of Atizapán de Zaragoza recognizes the good practices existing
at local/regional level and manifest omission of policy even if it is aware of good practice close to
its borders. According to the revision of the regulations of Tlalnepantla (Municipal Government of
Tlalnepantla, 2013, [55,56]) and the official documents of the government of Atizapán, it was observed
that the two municipalities describe very differently the vision they have about municipal policy
associated with UPS. The public agenda of Tlalnepantla does have an approach to urban governance
that is embodied in the effectiveness, quality and proximity of public management [57]. This approach
is following the recommendations of international agencies such as UN-Habitat [48] aimed at promoting
sustainability at local level with an urban agenda. On the other hand, the research of public policies
in Atizapán showed the absence of an urban public agenda and a lack of strategic vision on its local
environmental urban development.
Indicator 3. Under the assumption that what is not budgeted is not planned, the budget allocation
and the expenditure allocated to government actions associated to UPS were considered pertinent
for the analysis of omissions. Through document survey of official budget allocation reports in the
period of 2013–2015, it was observed that in the first period of 2013–2014, the UPS with greater public
investment were sports and recreational spaces (7.5 million pesos per work), allocating 30% of the
total investment to only one sports venue (“Ana Guevara”). In the second period of management
(2014), the same items of expenditure were established, which allowed comparing both periods and
identifying increases in maintenance and improvements of public spaces in 115 colonies, without
explicitly declaring the exact location of interventions. Finally, in the last report that corresponds to the
year 2015, we identified that 10 million pesos less were allocated to UPS, while the same public works
were reported as in 2014. Another element that stands out is that in this period the expense of “Sport
and Recreation” was reduced almost 50% without a specific explanation. According to the results
obtained from this information, we concluded that the budgetary reports of the expenditure and the
access system to public information have limitations because they do not have specific information on
the expenditure designated to the production of UPS and the expenses for its maintenance.
We started from the definition of public policies as “guidelines that allow the decision-making
process to achieve the urban development objectives”, defined in our case study through the Municipal
Urban Development Plan (PMDU) of 2015 [52]. Even though the municipality of Atizapán de Zaragoza
does not have an explicit or strategic approach to public policies aimed at UPS, according to documents
review we identified local government actions aimed at public space and urban green areas from the
town hall and decision makers. However, if the policy is considered as a set-sequence of decisions in
response to problems and needs that the action or inaction implies, then we can confirm that there
are only isolated actions to maintain green spaces and renovate sports or leisure facilities but not a
sequential strategy. Although the existence of government actions directed at urban public spaces in
the period 2013–2015 was already verified, it was also found that there are different types of omission
in municipal public policies that have had effects on the time and scenarios projected by the 2003
Development Plan in relation to environmental improvement and urban planning. The review of the
accomplishments reported by the 2015 PMDU allowed us to corroborate the existence of omissions to
develop strategies that achieve municipal sustainability in which urban planning is strategic.Societies 2020, 10, 8 14 of 19
3. Results and Discussion
The results of our study show insufficient area per capita and spatial inequity related to the
UPS planning in the municipality of Atizapán de Zaragoza, Mexico City Metropolitan periphery.
On municipal level, the UPS area per capita is 8 times less than the recommended threshold by the
WHO. Further, the micro-regional analysis shows that this average is grossly uneven between the
Northeast (0.10 m2 /inh, 12% of all public parks) and Southwest and Central (14.43 m2 /inh, 65.5% of
all public parks) regions, thus there is a lack of spatial equity in the distribution of UPS. While the
uneven distribution of UPS can be discussed in terms of lack of horizontal equity or unjust distribution
of public amenities for all, the matter becomes more complex if we consider the vertical equity or
the need to provide disproportionately more public amenities to vulnerable groups. The results of
neighborhood marginalization and urban density show significant concentration of vulnerable groups
in the Northeast, precisely in the areas where UPS is lacking the most. Therefore, the future challenge
to improve the spatial equity gains greater magnitude. Finally, our analysis of the municipal public
policies related to UPS planning and maintenance identified an omission of municipal strategy for
equitable planning of UPS and more specifically, a selective omission resulting from a bias towards less
affluent and poorly organized groups without significant economic and social influence. The omission
indicators provide sufficient evidence to support our hypothesis that today the omissions and the
unclear role of public policy in the equitable planning and distribution of UPS are significant obstacles
to improving the spatial equity. In the larger context of Latin America, our analysis supports the
conclusion by Segura [58] that even though many large cities like San Paolo, Mexico City and Buenos
Aires have managed to reduce the income inequalities, the urban fragmentation and social segregation
of the growing metropolitan periphery persist. Segura points out that a new inclusive land use
policy is urgently needed to improve access to the city and public goods. In this context, we argue
that the aggregated effect of omission of public policy in terms of equitable UPS planning in large
Latin American metropolises can have significant consequences in failing to achieve the globally set
2030 Sustainable Development Goals, specifically the goal 10-Reduce inequality within and among
countries and goal 11- Make cities and human settlements inclusive, safe, resilient, and sustainable.
Moreover, the research by Fjelde [59] indicates that both the form and degree of government have
significant influence on the risk of civil conflict. The conclusion is based on a statistical analysis of
inter-group conflicts in Nigeria, where the patronage politics, or the provision of public goods to retain
the support necessary to stay in power, was found to increase the risk of conflict. Different to our
study, Fjelde based the analysis on the redistribution of large incomes from oil reserves in Nigeria that
has significantly more direct and immediate impact to socio-economic structures. However, since
UPS has been found to have an effect on mental health, social ties, and security, as discussed in the
Introduction, we argue that the spatial inequity in distribution of UPS could potentially generate
risk of conflict between local groups in the long term. On the other hand, Rothstein and Teorell [60]
recently proposed more coherent definition of quality of governance in the “impartiality of institutions
that exercise government authority”, especially relevant to analyze the economic growth and social
welfare in developing countries. In this context, if we consider the UPS as a public good derived from
budgetary provisions, the selective omission in the distribution of this public good can be understood
as patronage politics that can increase inequality and the risk of inter-group conflict.
Since 1916, the Mexican law adopted administrative sanctions for public servants´ omissions that
affect the efficiency of their work [61]. However, there are very few bases to prove the accountability
since the link between the omission of public policy and the resultant spatial inequity is not clear in
previous research. Our study aims to provide that base for discussing and demanding accountability
of public policy in the planning of UPS based on results that clarify the extent and geo-localize the
spatial inequity. From the selective omission indicator, we found that often the blame is placed on
unorganized citizen groups that do not articulate their equity claims clearly, therefore do not obtain
access to public goods. However, Williams [62] argues that spatial equity should be understood “not as
a normative evaluation – as an ethical state in which “space” is just or unjust – but instead as an analyticYou can also read