Nitrogen Emissions, Deposition, and Monitoring in the Western United States
←
→
Page content transcription
If your browser does not render page correctly, please read the page content below
Articles
Nitrogen Emissions, Deposition,
and Monitoring in the Western
United States
MARK E. FENN, RICHARD HAEUBER, GAIL S. TONNESEN, JILL S. BARON, SUSANNE GROSSMAN-CLARKE,
DIANE HOPE, DANIEL A. JAFF E, SCOTT COPELAND, LINDA GEIS ER, HEATHER M. RUETH, AND JAMES O. SICKMAN
Nitrogen (N) deposition in the western United States ranges from 1 to 4 kilograms (kg) per hectare (ha) per year over much of the region to as high
as 30 to 90 kg per ha per year downwind of major urban and agricultural areas. Primary N emissions sources are transportation, agriculture, and
industry. Emissions of N as ammonia are about 50% as great as emissions of N as nitrogen oxides. An unknown amount of N deposition to the
West Coast originates from Asia. Nitrogen deposition has increased in the West because of rapid increases in urbanization, population, distance
driven, and large concentrated animal feeding operations. Studies of ecological effects suggest that emissions reductions are needed to protect
sensitive ecosystem components. Deposition rates are unknown for most areas in the West, although reasonable estimates are available for sites
in California, the Colorado Front Range, and central Arizona. National monitoring networks provide long-term wet deposition data and, more
recently, estimated dry deposition data at remote sites. However, there is little information for many areas near emissions sources.
Keywords: urbanization, animal feeding operations, hotspots, policy implications, regional haze
N itrogen (N) emissions and deposition data in the
11 most westerly contiguous states indicate that N
deposition has steadily increased over most of this region in
Major effects of N deposition have been documented in ter-
restrial and aquatic ecosystems in the western United States,
primarily in response to N enrichment of systems that are nat-
recent years (figure 1; Nilles and Conley 2001, Baumgardner urally N limited (Fenn et al. 1998). These effects include in-
et al. 2002), along with a rapid increase in population of creased greenhouse gas emissions, higher N concentrations
in plant tissues, and increased nitrification rates and nitrate
46.8% from 1980 to 2000, compared with 24.2% for the
(NO3–) levels in soil, streams, and lakes (Riggan et al. 1985,
country as a whole (USCB 2001). Continuing rapid popula- Fenn et al. 1996, Williams et al. 1996, Fenn and Poth 1999).
tion growth in the West highlights the need for greater emis- Elevated NO3– levels in runoff raise concerns about drinking
sions controls. Population projections from 1995 to 2025 water quality and eutrophication of recipient water bodies
indicate that 10 of the 12 lower 48 states with the highest (Fenn et al. 1998). Nitrogen enrichment of these ecosystems,
projected growth rates are western states (Campbell 1996). a result of chronic N deposition, has caused important
Mark E. Fenn (e-mail: mfenn@fs.fed.us) is a research plant pathologist at the US Department of Agriculture (USDA) Forest Service, Pacific Southwest Research
Station, Riverside, CA 92507. Richard Haeuber is a senior policy analyst in the Clean Air Markets Division, US Environmental Protection Agency, Washington, DC
20460. Gail S. Tonnesen is an assistant research professor at Bourns College of Engineering, Center for Environmental Research and Technology, University of Cali-
fornia, Riverside, CA 92521. Jill S. Baron is an ecologist with the US Geological Survey and a senior research scientist at the Natural Resource Ecology Laboratory, Col-
orado State University, Fort Collins, CO 80523. Susanne Grossman-Clarke is a postdoctoral research associate in the Department of Mechanical and Aerospace Engi-
neering, Arizona State University, Tempe, AZ 85287. Diane Hope is an assistant professor and field project manager for the Central Arizona–Phoenix Long Term Ecological
Research Project, Center for Environmental Studies, Arizona State University, Tempe, AZ 85287. Daniel A. Jaffe is a professor of interdisciplinary arts and sciences at
the University of Washington, Bothell, WA 98011. Scott Copeland is a visibility data analyst for the USDA Forest Service, working through the Cooperative Institute
for Research in the Atmosphere at Colorado State University, Washakie Ranger District, 333 East Main Street, Lander, WY 82520. Linda Geiser is an ecologist and air
resource specialist at the USDA Forest Service, Siuslaw National Forest, PO Box 1148, Corvallis, OR 97339. Heather M. Rueth is a postdoctoral scientist at the Ecosys-
tems Center, Marine Biological Laboratory, 7 Water Street, Woods Hole, MA 02543. James O. Sickman is a research scientist with the Institute for Computational Earth
System Science at the University of California, Santa Barbara, and an environmental scientist with the California Department of Water Resources, Division of Envi-
ronmental Services, PO Box 942836, Sacramento, CA 95814. This article was written and prepared by US government employees on official time and is therefore in
the public domain and not subject to copyright.
April 2003 / Vol. 53 No. 4 BioScience 391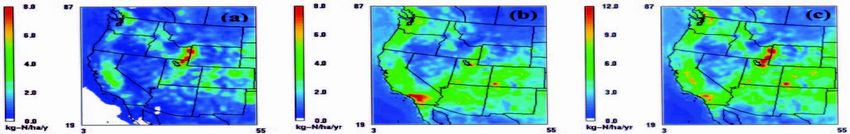
Articles
community changes in vegetation, lichens, mycorrhizae, and often at great distances (e.g., hundreds of kilometers [km])
phytoplankton, sometimes at relatively low N deposition from the emissions source areas; Malm et al. 2000, Tonnesen
levels (3 to 8 kilograms [kg] N per hectare [ha] per year; et al. 2002).
Baron et al. 2000, Fenn et al. 2003a). In urban areas and The effects of N deposition in some areas of the western
downwind of urban areas, emissions of nitrogen oxides (NOx) United States are not as well known or studied as in the east-
frequently lead to elevated concentrations of ozone (O3), a pol- ern United States and in Europe (Aber et al. 1989, Bytnerowicz
lutant that may cause severe injury to sensitive plant species and Fenn 1996, Erisman and de Vries 2000, Driscoll et al.
(Miller and McBride 1999). Nitrogen emissions also con- 2001). Emissions data, deposition modeling studies, demo-
tribute to regional haze and impaired visibility in national graphic trends, and the increasingly urbanized character of
parks and other wildlands, a pollution problem that is evident the West all point to the need for increased monitoring and
studies of ecological effects in the
expanding urban zones and adja-
cent wildlands of the western
United States. Estimates of N de-
a position inputs are generally avail-
able for the most intensively stud-
ied ecosystems in the West, but N
Emissions of N from nitrogen oxides
(thousands of short tons per year)
deposition data are minimal or
completely lacking for many west-
ern sites. Particularly lacking are
data on dry deposition inputs, usu-
ally the largest component of total
atmospheric N deposition in pol-
luted western sites (Bytnerowicz
and Fenn 1996), except in areas
with frequent fog (Fenn et al. 2000).
Deposition rates in the West are
likely to be highest downwind of
large urban areas, but N deposition
rates may also be high in nonurban
areas downwind of agricultural
sources (Tonnesen et al. 2003). In
this article we review current in-
b formation on N deposition sources
and rates in key western ecosystems
and on the current state of N de-
position monitoring in the West.
(thousands of short tons per year)
We also report N deposition rates
Emissions of N from ammonia
from a modeling study of aerosol
formation and regional haze in the
western United States (Tonnesen
et al. 2003).
Nitrogen emissions sources
and trends
Transportation, agriculture, power
plants, and industry are the major
sources of N emissions in the West.
Transpacific transport of N from
Southeast Asia is another source of
atmospheric N along the West
Coast, although the amounts are
uncertain. Nitrogenous emissions
Figure 1. Trends in emissions of nitrogen from nitrogen oxides (a) and from ammonia from the transportation sector in
(b), in thousands of short tons per year (1 short ton = 907.2 kilograms), in 11 western urban areas are dominated by NOx,
states. Data are from the National Emission Trends database (EPA 2003). while emissions from fertilized
392 BioScience April 2003 / Vol. 53 No. 4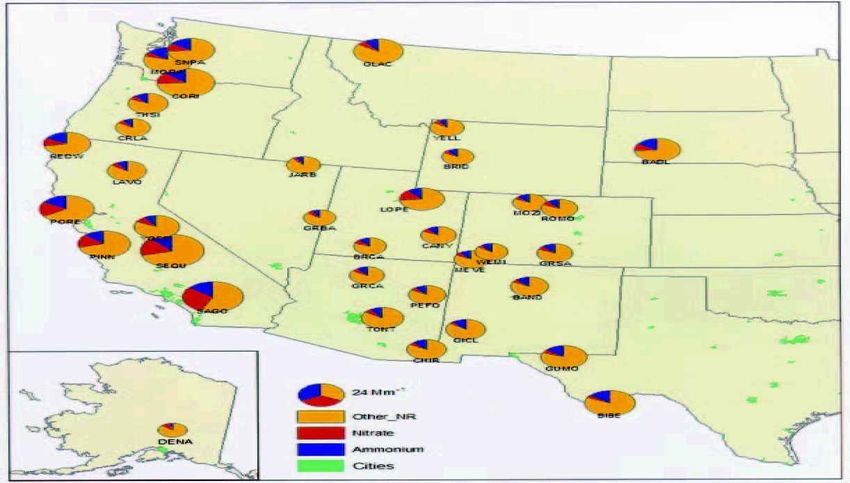
Articles
659,649 metric tons 1,332,071 metric tons
Source (metric tons) Source (metric tons)
762,207 metric tons 958,477 metric tons
Source (metric tons) Source (metric tons)
Figure 2. Estimated total emissions of nitrogen, in metric tons, from nitrogen oxides (NOx–N) and from ammonia (NH3–N)
in 1996 and projected emissions in 2018 in the 11 contiguous western states (Gribovicz 2002). The states include Arizona,
California, Colorado, Idaho, Montana, New Mexico, Nevada, Oregon, Utah, Washington, and Wyoming.
crops and concentrated animal feeding operations (CAFOs) all average increase of 16%; figure 1), based on data from the
are mainly in reduced forms (ammonia [NH3] and ammo- National Emissions Trends database (EPA 2003). The only
nium [NH4+], referred to collectively as NHx). Figure 2 shows western state with a decrease in NOx emissions was Califor-
the estimated total emissions of N from NOx and NH3 in 1996 nia, where annual NOx emissions decreased by 5%. However,
and projected emissions for 2018 for the 11 contiguous west- according to the data published by the state of California
ern states (Gribovicz 2002). Mobile sources, including on-road (Alexis et al. 2001), NOx emissions decreased 28% from 1985
and off-road sources, make up 67% of the anthropogenic NOx to 2000. Emissions of NH3 increased by an average of 19% in
emissions in these states. Industrial and power plant emissions the 11 western states from 1990 to 1999 (figure 1). Precipi-
are also important sources of N pollutants in some areas, tation-adjusted NH4+ and NO3– concentrations in wet de-
accounting for 22% of anthropogenic NOx. Area sources, position increased at 65% and 35%, respectively, of the west-
primarily crop agriculture and livestock, account for 87% of ern National Atmospheric Deposition Program (NADP) sites
the estimated 1996 NH3 inventory. Estimated emissions of from 1985 through 1999, while concentrations were gener-
NH3 (659,649 metric tons N from NH3 per year) were 50% ally stable at the remaining sites (Clow et al. 2003). Nilles and
as high as NOx emissions (1,332,071 tons N from NOx per Conley (2001) reported significantly increasing trends in
year) in the 11 contiguous western states in 1996. However, volume-adjusted NH4+ and NO3– concentrations from 1981
the accuracy of the NH3 inventory is highly uncertain, par- to 1998 at western NADP wet deposition monitoring sites,
ticularly for data on biogenic emissions from soil, which are with no decreasing trends. Emissions of NOx in the western
excluded from the Western Regional Air Partnership (WRAP) United States are projected to decrease 28% by 2018, while
inventory (Gribovicz 2002). NH3 emissions are projected to increase by 16% (figure 2;
Emissions of NOx in 10 of the 11 contiguous western Gribovicz 2002). Projected NOx reductions are expected to
states increased by 8% to 72% from 1985 to 1999 (an over- result largely from reduced mobile emissions as stricter
April 2003 / Vol. 53 No. 4 BioScience 393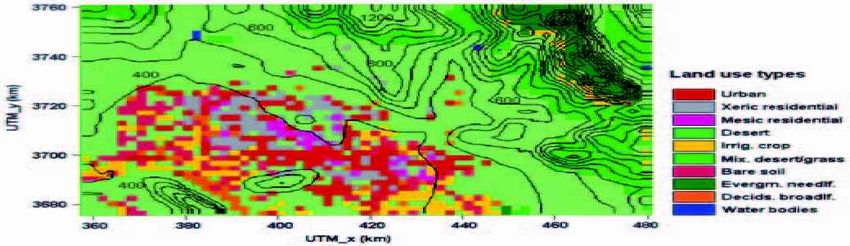
Articles
vehicle emissions controls and technical improvements are im- Colorado. The elevated N deposition in eastern Idaho is con-
plemented. However, N deposition is expected to increase in sistent with large NH3 emissions from livestock operations in
some natural areas as urbanization continues to expand. south-central Idaho (figure 3). There is a high level of un-
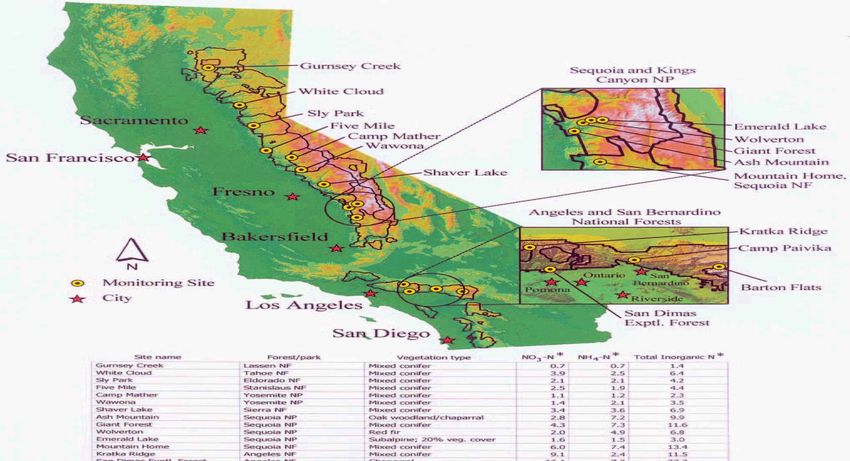
certainty in the model simulations of N deposition because
Modeling chem ical transform ations and deposition of uncertainty in model inputs, especially in the emissions in-
of nitrogen in the West ventories that are key to performing budget analyses. The un-
Long-term atmospheric modeling efforts to study the for- certainties are largest for NH3, which plays a central role in
mation and transport of regional haze in the western United the conversion of HNO3 to aerosols. While absolute values for
States were initiated in 2001 by the Western Governors’ As- N deposition are highly uncertain, the results indicate likely
sociation and WRAP (Tonnesen et al. 2002). Because N com- areas of elevated N deposition in the West. Future modeling
pounds are key components of the regional haze problem, the studies can provide better estimates of N deposition through
haze model simulations also represent the formation and the use of better emissions data and a finer model grid
deposition of N species. The atmospheric budget and depo- resolution.
sition of N are determined by a complex interaction of mul-
tiple processes, including emissions of N species, meteoro- M onitoring nitrogen deposition
logical dynamics, chemical transformation and partitioning Data on N deposition from three networks, IMPROVE (Inter-
of N species, aerosol dynamics, and rates of wet and dry de- agency Monitoring of Protected Visual Environments), CAST-
position of aerosol and gas-phase N species. Net (Clean Air Status and Trends Network), and NADP/NTN
We report selected results here of a larger study of simu- (NADP/National Trends Network), rarely indicate the areas
lated rates of total (wet and dry) N deposition for an annual most affected by N deposition in the West because (a) dry de-
modeling study of aerosol formation and regional haze in the position and fog deposition (including cloudwater), and, in
western United States (Tonnesen et al. 2003). Model simula- particular, deposition fluxes to canopies, either are not mea-
tions were performed using the Models-3/Community Mul- sured or are only partially quantified; (b) monitoring sites are
tiscale Air Quality (CMAQ) model (Buyn and Ching 1999) located in remote locations far from the pollution sources; (c)
and data on emissions from the 1996 National Emissions the number of monitoring sites is insufficient; and (d) sites
Inventory, with many updates made for the western states are rarely located in the highest-elevation areas, where ecosys-
(Tonnesen et al. 2002). The CMAQ model is designed to tems are likely to be of highest sensitivity. The CASTNet sites
represent both wet and dry deposition of aerosol and gas-phase are intentionally located away from major sources of sulfur
species. Although the model simulates the rates of deposition dioxide (SO2) and NOx (Baumgardner et al. 2002). This is also
for individual N species (at 36 km resolution in these simu- true of the IMPROVE sites, because they are intended to ad-
lations), we present summary results in figure 3 for total dress the regional haze problem in federal Class I areas.
NHx (NH3 and NH4+) and for total NOy (nitric oxide [NO], Measurements of deposition must account for fluxes to vege-
nitrogen dioxide [NO2], nitric acid [HNO3], and NO3–). tation, which function as efficient scavengers of N in areas with
Several hotspots for total N deposition stand out in figure high leaf-area index values, particularly in dry forms or in fog.
3, particularly adjacent to urban areas in southern and cen- Bulk deposition and wet deposition measurements that do not
tral California, the Pacific Northwest, Salt Lake City, Phoenix, account for dry deposition or fog or cloudwater deposition
southwestern Utah, northwestern Arizona, and parts of to plant canopies can grossly underestimate atmospheric
a b c
Figure 3. Model-simulated annual nitrogen (N) deposition (kilograms per hectare per year) in the western United States in
1996 for (a) total wet and dry deposition of N from ammonia and ammonium (NHx–N), (b) total wet and dry deposition of
N from nitric oxide, nitrogen dioxide, nitric acid, and nitrate (NOy–N), and (c) total N deposition calculated as the sum of
NHx–N and NO y–N. Note that the scale for the y-axis in (a) and (b) differs from the scale in (c).
394 BioScience April 2003 / Vol. 53 No. 4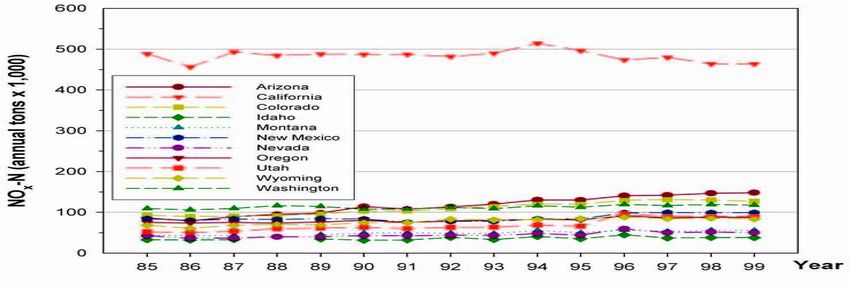
Articles
inputs. For example, throughfall fluxes under ponderosa pine are nonetheless a very useful measure of N deposition in
(Pinus ponderosa Dougl. ex Laws.) canopies at high- and solution to the soil or forest floor. The use of passive through-
low-deposition sites in southern California were 18 times fall collectors, based on retention of ions from throughfall
and 5 times higher, respectively, than bulk deposition in ad- solutions onto ion exchange resin columns (Fenn et al. 2002)
jacent forest openings (Fenn et al. 2002). Nonetheless, NADP’s or resin bags (Kjønaas 1999, Susfalk and Johnson 2002), is an
wet deposition data are frequently cited, because NADP has attractive alternative to more labor-intensive and costly meth-
the most spatially and temporally extensive database on ods, allowing total N deposition to be monitored at a greater
deposition in the United States. number of sites than is practical with conventional through-
Total N deposition at Tanbark Flat in the Los Angeles air fall collectors. In subalpine sites in the Sierra Nevada and in
basin in southern California and in surrounding forests is re- the Colorado Front Range, snowpack samples are often
portedly 20 to 45 kg per ha per year. Wet deposition, at 3 to analyzed for N to estimate total winter deposition (Clow et
5 kg per ha per year, is a very small portion of that total al. 2002, Sickman et al. 2002).
(Riggan et al. 1985, Fenn et al. 2000, 2002). Yet the widely used
NADP map figures represent this region as an area with near- Nitrogen deposition in the West
background levels of N deposition in precipitation. Further- Nitrogen deposition varies widely across the West in terms of
more, fog deposition inputs are often similar in magnitude total amounts, seasonality, physical forms, and effects. For
to dry deposition inputs in southern California forests (Fenn many western areas, N deposition has not been measured.
et al. 2000) and in parts of the Sierra Nevada (Collett et al.
1989). Fog deposition is not measured in the NADP wet/dry The Colorado Front Range. Developments in the Colorado
buckets or in dry deposition networks, but is a major N de- Front Range in recent decades illustrate some of the key fac-
position form wherever fog episodes and N emissions sources tors contributing to increased N deposition in the West: a
coincide. greater prevalence of large animal husbandry operations and
Nitrogen deposition data in rural areas of the West are lim- rapid increases in urbanization, population, and distance
ited in scope, and where data are available, total deposition driven. Nitrogen deposition has increased since the 1980s at
estimates are often underestimated and highly uncertain. high-elevation sites in the Colorado Front Range, and total
This is largely because of the technical difficulties and expense deposition values currently range from 4 to 8 kg N per ha per
associated with measuring the atmospheric concentrations and year (Baron et al. 2000). The Continental Divide is an oro-
deposition of the array of dry-deposited N forms. Adding to graphic barrier that separates the Colorado Rockies into re-
the challenge of measuring dry deposition of N is the need gions of low and higher atmospheric N deposition inputs.
to quantify N deposition in precipitation, and in some areas Most of Colorado’s population lives in the region east of the
N deposition in fog or cloudwater must also be determined. Continental Divide, which is also an important region for live-
Various approaches have been used to determine annual N stock production and agriculture (Baron et al. 2000). The com-
deposition and some components of total N deposition. bination of anthropogenic atmospheric N sources, local east-
CASTNet is the only monitoring program with a number of erly winds, and orographic precipitation results in elevated N
sites in the West (currently 22 in the lower western states deposition rates to eastern Colorado high-elevation ecosys-
and 2 in Alaska) that attempts to estimate dry deposition of tems (Sievering et al. 1989, Heuer et al. 2000, Williams and
some of the major N species. However, NO, NO2, NH3, and Tonnessen 2000). As precipitation increases with elevation, de-
peroxyacetyl nitrate (PAN) concentrations are not measured position rates increase as well (Williams and Tonnessen 2000).
at the CASTNet sites, and therefore total N deposition is fre- Deposition rates west of the Continental Divide are lower be-
quently underestimated (Baumgardner et al. 2002). cause N sources are limited and because strong westerly
Various methods have been used to measure dry deposi- winds in the upper atmosphere rarely allow N-enriched air
tion of N in site-specific studies. The most common of these masses from the east to cross the divide (Bossert 1990, Baron
methods are branch rinsing, throughfall collection, and the and Denning 1993).
inferential method (based on atmospheric concentrations
measured with annular-denuder systems or filter packs and California. Wildland ecosystems within the South Coast air
calculated using estimated pollutant deposition velocities; basin, which includes portions of four counties in the Los An-
Bytnerowicz and Fenn 1996). A limiting factor in the wide- geles area, receive the highest N deposition in the country
spread implementation of the inferential method (as used by (Fenn et al. 1998, 2002). The most exposed areas are the
CASTNet) is the quantity of data needed to calculate dry south-facing slopes of the San Gabriel Mountains and the
deposition (e.g., leaf-area index and other plant community western and southern edges of the San Bernardino Mountains.
characteristics, deposition velocity values for each N species, Several federal Class I wilderness areas in the South Coast air
spatial and temporal distribution of atmospheric concen- basin are affected by N deposition. Nitrogen deposition in-
trations of a number of N compounds, and numerous climatic puts in the low- and midelevation chaparral and mixed
variables; Baumgardner et al. 2002). Throughfall fluxes gen- conifer forest zones range from 20 to 45 kg per ha per year in
erally underestimate total atmospheric N deposition because the most exposed areas. However, deposition values can be
the canopy retains N (Fenn and Bytnerowicz 1997), but they higher than 90 kg per ha per year in years of more extensive
April 2003 / Vol. 53 No. 4 BioScience 395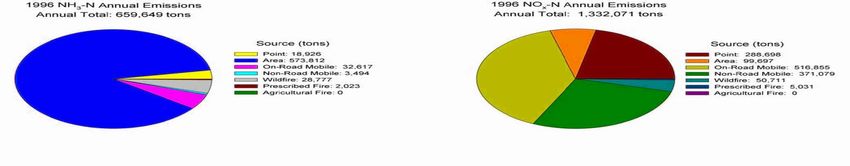
Articles
fog exposure, particularly when fog occurs in late summer with istic of many rapidly growing cities in the arid and semiarid
unusually high NO3– and NH4+ concentrations (figure 4; lands of the southwestern United States, with large tracts of
Fenn et al. 2002). Deposition under individual canopies of undeveloped desert lands within and downwind of the city.
large trees is even higher, because these stands are relatively The major source of NOx is fossil fuel combustion from
open (60% to 70% forest cover; Fenn and Bytnerowicz 1997, transportation in the central urban core (Fernando et al.
Fenn et al. 2000). NOx emissions decreased by 35% from 2001). As part of ongoing research at the Central Arizona–
1975 to 2000 in the South Coast air basin because of strict reg- Phoenix (CAP) Long Term Ecological Research site, investi-
ulatory controls (Alexis et al. 2001); this suggests that N de- gators have employed a combination of measurements and
position may have been higher in past decades. modeling techniques to determine the temporal and spatial
In the Sierra Nevada and in the San Bernardino Mountains characteristics of wet and dry N deposition across the CAP
in southern California, NHx deposition is often equal to or study area. Annual inputs of dry-deposited, oxidized forms
greater than NOx deposition (figure 4; Bytnerowicz et al. of N have been estimated in a detailed modeling effort for the
2002, Fenn et al. 2003b). Throughfall deposition ranges from years 1996 and 1998 by means of a diagnostic model. The
10 to 13 kg N per ha per year in chaparral and mixed conifer model results show that NOx dry deposition has a marked sea-
forest sites in the southwestern Sierra Nevada, and from 1 to sonal pattern, peaking over the winter months (October to
7 kg N per ha per year in central and northern sites along the March) and declining during the summer, tracking the sea-
western side of the Sierra Nevada (figure 4; Fenn et al. 2003b). sonal variation in ambient pollutant concentrations. In the
Total N deposition inputs are expected to be 30% to 40% same study, Models-3/CMAQ simulations (Buyn and Ching
higher than these throughfall values, because the canopy re- 1999) gave predicted hourly NOx and HNO3 deposition, al-
tains atmospheric N (Fenn et al. 2000). The alpine and sub- lowing spatial patterns in NOx deposition to be evaluated for
alpine zones of the Sierra Nevada contain large tracts of the modeling domain (10,664 km2), which included the
federal Class I areas that are protected by the Clean Air Act. entire Phoenix metropolitan area along with the surround-
The higher elevations of the Sierra Nevada of California ing desert and agricultural land.
receive on average about 3 kg per ha per year of total N (dis- Models-3/CMAQ simulations for a single day episode in
solved inorganic and organic N) deposition (Sickman et al. July 1996 were used as a basis for estimating dry deposition
2001). However, this is considered a conservative estimate of across the whole study area. Scaling these whole-system pre-
total deposition for alpine and subalpine sites in the southern dictions to account for seasonal variations, and then adding
Sierra Nevada. While nearly 90% of precipitation falls as 3.5 kg N per ha per year for deposited NH4+ (as estimated by
snow during the winter (typically from December to April), Baker et al. 2001) and an additional 10% of the subtotal (av-
60% of annual N deposition in the alpine and subalpine erage 1.2 kg N per ha per year) to account for deposition in
zones occurs during the months of May through November. particulate form, dry deposition (kg N per ha per year) was
This deposition pattern is largely the result of differences in estimated to be 13.5 for the urban core, 15.0 for the down-
the air quality and storm trajectories between winter and wind desert, and 7.5 for the upwind desert (figure 5), with an
nonwinter periods. Winter storms are derived from relatively average for the entire system of approximately 12 kg N per ha
clean air masses associated with Pacific frontal systems from per year. Wet deposition to the entire CAP study area was de-
the Gulf of Alaska, whereas nonwinter precipitation originates termined from wet bucket samplers at eight sites across the
from localized thunderstorms formed from relatively polluted study area. Combining the results from these various tech-
air from the Central Valley of California. In the San Joaquin niques gave a total N deposition rate of approximately 13.5
Valley air basin, which includes the southern two-thirds of the kg N per ha year, which represents 20% of total N inputs to
Central Valley, air quality improvements have not kept pace the study area (Baker et al. 2001). Estimated total N deposi-
with those in most urban areas of California. There are a num- tion to the most exposed agricultural and desert areas was 28
ber of moderately sized urban areas located along the main to 29 kg per ha per year (figure 5), but this occurred over only
axis of the valley, and the area also includes many agricultural a small proportion (2%, or about 200 km2) of the modeling
emissions sources, making air quality control difficult. Large domain.
dairy farm operations, a major source of NHx, are increasing
in the region. According to NADP data, wet deposition of NO3– The Pacific Northwest. Excluding urban areas, N deposition
and NH4+ in Sequoia National Park, in the more polluted in the Pacific Northwest is generally low compared with de-
southern Sierra, increased from 1981 to 2001, although the position in other parts of the United States. Annual wet N de-
trend was significant only for NH4+ (0.037 kg per ha per position reported by NADP (8 March 2003; http://nadp.
year; p = 0.10). Nitrogen deposition is expected to continue sws.uiuc.edu) has been under 1.6 kg per ha each year at 8 of
to increase in the Sierra Nevada. the 10 monitors in operation since the 1980s. Higher annual
wet N deposition (up to 3.2 kg per ha) has been detected at
Central Arizona–Phoenix. In the arid Southwest, rainfall is in- only two monitors, Bull Run and Marblemount, east of Port-
frequent and seasonal; hence, a substantial proportion of N land and Seattle, respectively. However, concentrations of
deposition inputs to terrestrial and aquatic systems occurs as NO3– and NH4+ at NADP sites in Oregon and Washington
dry deposition. The Phoenix metropolitan area is character- have been increasing since monitoring began in 1980.
396 BioScience April 2003 / Vol. 53 No. 4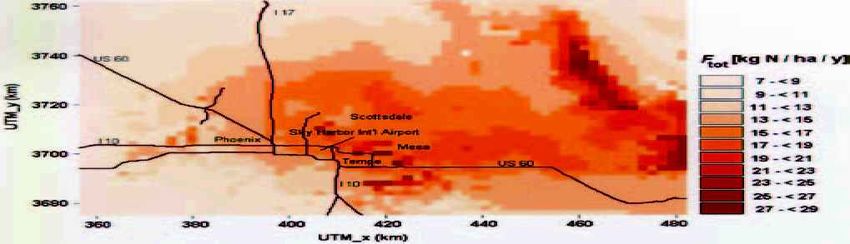
Articles
kg per ha per yr
Figure 4. Nitrogen deposition, in kilograms per hectare per year, at sites in the Sierra Nevada and Transverse Ranges of Cali-
fornia. Data represent throughfall deposition to mixed conifer forests (1128 to 1920 meters [m] elevation) with a dominant
ponderosa pine or Jeffrey pine (Pinus jeffreyi Grev. and Balf.) component, except at four locations: (1) Emerald Lake, with
deposition to open areas in a subalpine catchment (2800 m elevation); (2) Ash Mountain, an oak woodland (750 m eleva-
tion); (3) Wolverton, mainly red fir (Abies magnifica A. Murr.), above the mixed conifer zone (2207 m elevation); and (4)
San Dimas Experimental Forest, chaparral (800 m elevation). Data are from 2000–2001, except for the lower values at
Barton Flats and Camp Paivika, which are from 1996 (Fenn et al. 2000). Abbreviations: N, nitrogen; NF, national forest;
NH4+– N, nitrogen from ammonium; NO3–N, nitrogen from nitrate; NP, national park.
April 2003 / Vol. 53 No. 4 BioScience 397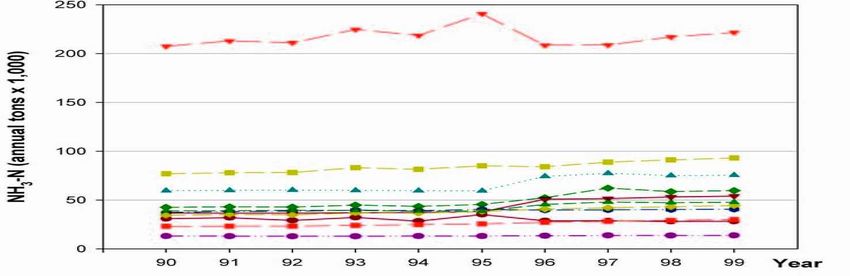
Articles
a b
FHNO [kg N per ha per yr]
3 F NO [kg N per ha per yr]
2
c d
Ftot[kg N per ha per yr]
Figure 5. Estimated annual nitrogen (N) deposition (kilograms per hectare per year), as (a) nitric acid (HNO3), (b) nitrogen
dioxide (NO2), and (c) total N, and (d) land-use patterns in the Central Arizona–Phoenix Long Term Ecological Research
study area. Deposition inputs were determined by a combination of measurements and model simulations. Coordinates of
the modeling domain are shown in Universal Transverse Mercator (UTM) Zone 12 projection.
Proximity to an urban area is the most important variable pre- Because of the short atmospheric lifetime of NOx, on the
dicting an increase in wet deposition of NH4+ and NO3–. order of 12 to 24 hours, conversion to a longer-lived form is
necessary for long-range transport. NOx is primarily trans-
Transpacific nitrogen transport and deposition to the ported as PAN. Once in the free troposphere, PAN can be
West Coast of North America transported long distances and later moved back into the
From the mid-1970s to the 1990s, emissions of NOx and SO2 warmer boundary layer, where it regenerates NOx and sub-
from the East Asian region increased at an average rate of ap- sequently HNO3 (Moxim et al. 1996, Kotchenruther et al.
proximately 4% per year (Akimoto and Narita 1994), ap- 2001a). Given that long-range transport of PAN from Asia to
proximately doubling over a period of 20 years. Emissions of North America is well documented (Jaffe et al. 1999, Kotchen-
N and sulfur from Asia now exceed those from North Amer- ruther et al. 2001b), Asian NOx emissions almost certainly con-
ica, and these emissions can be transported across the Pacific tribute to the background NO3– deposition on the West
in 6 to 10 days. Peroxyacetyl nitrate, with a lifetime of days to Coast. The contribution of Asian emissions to the back-
weeks, can be transported across the Pacific on westerly winds ground deposition in the Pacific Northwest is somewhat dif-
(Jaffe et al. 1999), which prevail at mid-latitudes most of the ficult to ascertain, but is perhaps in the range of 25% to 50%.
year. This transpacific transport is episodic and can occur It is probably not much larger, because global sources of NOx
either in the atmospheric boundary layer or in the free tropo- contribute to a hemispheric accumulation of PAN (Moxim
sphere (Jaffe et al. 2003). For a number of pollutants, in- et al. 1996), and PAN decomposition is an important source
cluding PAN, higher concentrations were measured on the of NO3– in remote regions of the Northern Hemisphere. On
coast of Washington in 1998, a year with substantially elevated the other hand, it is probably not much less, given the quan-
biomass burning in Asia (Jaffe et al. 2001). Although natural tities of Asian pollutants transported directly to North Amer-
sources of fixed N also occur, most N found in the North Pa- ica. Furthermore, Asian sources contribute approximately
cific atmosphere is likely to be of anthropogenic origin (Pros- 33% of the total carbon monoxide in the background air
pero and Savoie 1989, Horowitz and Jacob 1999). arriving to the Pacific Northwest in the spring (Jaeglé et al.
398 BioScience April 2003 / Vol. 53 No. 4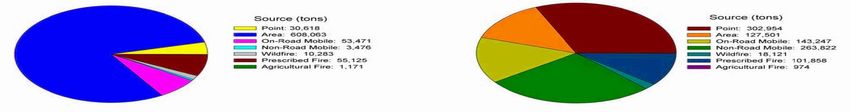
Articles
2003). Studies are fairly consistent in predicting
that Asian NOx emissions will double again in the
next 20 to 30 years (Streets and Waldhoff 2000,
Klimont et al. 2001), resulting in an increase in the
background NO3– deposition in western North
America of between 40% and 100% from 1980 to
2020.
Region al haze and visibility impairm ent
The IMPROVE network was established in re-
sponse to the Clean Air Act of 1977. The goal of the
network is to measure the key aerosol species that
are principally responsible for visibility reduction
in federal Class I areas. These measurements can be
used to establish current conditions, to determine
which species contribute to visibility reduction,
and to monitor long-term trends toward the na-
tional visibility goal of no man-made impairment
of protected areas. Since March 1988, the IMPROVE
network has sampled fine (diameter < 2.5 mi-
crometers) NO3– and other constituents of fine
mass in or near select federal Class I areas. We
present data for 1997–1999 (figure 6) from 35 sites
west of the 100th meridian (9 March 2003; http://
vista.cira.colostate.edu/improve). These data include
as many of the newer sites as possible while ex-
cluding the effects of protocol changes from before
1997. Concentrations of atmospheric NO3– in the
IMPROVE data are probably underestimates of to-
Figure 6. Fraction of reconstructed non-Rayleigh (NR) atmospheric ex-
tal NOx concentrations by a factor of 1.5 to 3.0, pre-
tinction (haze that does not result from atmospheric gases) caused by
sumably because HNO3 and NO3– in the coarse
ammonium, by nitrate, and by other particulate matter. Other particu-
particulate fraction are not measured (Ames and
late matter includes sulfates, organic matter, elemental carbon, fine soil
Malm 2001).
material, and coarse mass. Units for atmospheric extinction are inverse
Visibility impairment caused by regional haze is
megameters (Mm–1). See Malm and colleagues (2000) for more details of
common throughout the United States. During
methodology. The area of the circular symbols is proportional to the
the 1990s, federal land managers certified visibility
amount of atmospheric extinction.
impairment in all national parks and some wilder-
ness areas (Watson 2002). As states begin studying
implementation strategies to comply with the regional haze Park in Alaska to 1922 ng NO3– per m3 at San Gorgonio
regulation (EPA 1999), nitrogenous species in particular will Wilderness in southern California. The highest averages ( 400
be important for two reasons: First, they contribute consid- ng NO3– per m3) are seen at sites that are near large urban
erably to fine mass and visibility impairment in many areas, areas, such as Point Reyes National Seashore (663 ng NO3– per
and second, nitrogenous species are predominantly anthro- m3) and Pinnacles National Monument (701 ng NO3– per m3),
pogenic (Trijonis 1990). The two major chemical species both near the San Francisco Bay Area. Three sites—
that account for most of the fine particle N are NO3– and Snoqualmie Pass, Washington; Tonto National Monument,
NH4+. The IMPROVE network directly measures only NO3–; Arizona; and Rocky Mountain National Park, Colorado—
however, a reasonable upper bound for NH4+ in the western might be expected to have higher averages because of their
United States can be inferred from the data by assuming that proximity to major metropolitan areas, but they do not. Bad-
fine particulate NO3– and sulfate are fully neutralized as am- lands National Park, South Dakota, has anomalously high
monium nitrate and ammonium sulfate. This technique pro- NO3– (326 ng per m3) for such a remote western site but is
+
vides reasonable results at the few sites where NH4 is mea- characteristic of NO3– values for eastern sites. Concentrations
sured. from the remaining 24 western continental US sites average
Annual average fine NO3– concentrations (expressed as about 150 ng NO3– per m3, an average that could be used as
–
NO3 ion) in the western IMPROVE sites vary from 45 a generic estimate for remote NO3– concentrations. By com-
– 3
nanograms (ng) NO3 per cubic meter (m ) at Denali National parison, the 16 sites in the eastern United States have annual
April 2003 / Vol. 53 No. 4 BioScience 399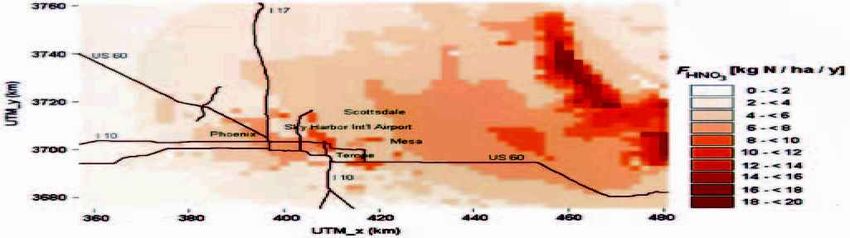
Articles
average NO3– concentrations ranging from 158 ng NO3– per Title IV of the Clean Air Act Amendments of 1990 in-
m3 at Shining Rock Wilderness, North Carolina, to 1148 ng cluded provisions to decrease NOx emissions from stationary
NO3– per m3 at the National Mall in Washington, DC, with power generation sources by 2 million tons from levels pro-
an annual mean of about 400 ng NO3– per m3. jected to be reached in 2000. While Title IV was primarily de-
Western annual average estimated NH4+ concentrations (ex- signed to address the ecological effects of acidic deposition in
pressed as NH4+ ion) in fine particulates show considerably acid-sensitive regions of the United States, the absence of a cap
less variation than fine NO3–, ranging from 139 ng NH4+ per on NOx emissions made its NOx provisions less stringent
m3 at Denali National Park to 963 ng NH4+ per m3 at San Gor- than its provisions for SO2. In some measure, this difference
gonio Wilderness. Proximity to urban areas does not appear was a result of the paucity of knowledge on the contribution
to be as important a factor for NH4+ as for NO3–. The mean of N deposition to acid rain and other ecological and human
value for all 35 western sites is 376 ng NH4+ per m3, compared health effects when Title IV was passed. With the exception
with the eastern mean of 1386 ng NH4+ per m3. Low-eleva- of Title IV and, to some extent, the National Ambient Air
tion sites tend to have higher NO3– and NH4+ concentrations Quality Standards, many current regulatory efforts to
than higher sites. Nitrogenous species account for as little as decrease NOx emissions and N deposition, particularly from
11% of annual average fine mass at Glacier National Park, stationary sources, focus on the eastern United States and are
Montana, and Crater Lake National Park, Oregon, and as unlikely to address N deposition levels in the western United
much as 35% at San Gorgonio Wilderness. Patterns for the States. (For a summary of regulations affecting NOX emissions
fraction contributed by nitrogenous species to fine mass are from stationary and mobile sources, see EPA 2000, table
virtually identical to those seen in figure 6 for the contribu- III-6.)
tion of the same nitrogenous species to particulate extinction. Still, there are important regulations in place that promise
Standard visual range, the distance at which a large dark ob- to achieve decreases in NOx emissions and N deposition in the
ject is barely visible against the horizon, is inversely propor- western United States. While these efforts are aimed at im-
tional to atmospheric extinction. As atmospheric pollutants proving air quality, the resulting decline in NOx emissions will
like ammonium nitrate increase, atmospheric extinction in- provide corollary ecological benefits. Perhaps the most im-
creases and standard visual range decreases (i.e., a vista be- portant of these efforts are the recently adopted Tier II tailpipe
comes more hazy). Atmospheric extinction attributed to N emissions standards for cars, sport utility vehicles, and light-
ranges from 44% of annual mean particulate extinction at San duty trucks (Driscoll et al. 2003). In addition to the Tier II stan-
Gorgonio Wilderness to 11% of particulate extinction at Jar- dards, the Environmental Protection Agency (EPA) has pro-
bidge Wilderness, Nevada (figure 6; see the IMPROVE Web mulgated similarly tough standards for diesel trucks. In
site [http:vista.cira.colostate.edu/improve/] for more complete September 2002, the EPA also announced its intention to
site names and information). Nitrogenous species contribute reduce pollutants from several groups of non-road engines,
about 20% of particulate extinction on an annual average ba- including large industrial engines, snowmobiles, and all-
sis in the western United States, compared with about 26% terrain vehicles. When fully implemented, these non-road
in the eastern United States. The lowest individual daily frac- vehicle standards will remove more than 1 million tons of
tions of extinction caused by nitrogenous species are below hydrocarbons and NOx each year.
1% and are seen at very remote sites like Crater Lake National In 1977, Congress set a national visibility goal aimed at “the
Park and Denali National Park. The highest individual daily prevention of any future, and remedying of any existing, im-
fractions of extinction caused by nitrogenous species are pairment of visibility in mandatory Class I Federal areas
more than 70% of reconstructed extinction and are seen at which impairment results from manmade air pollution” (42
three California sites: Sequoia National Park, San Gorgonio USC 7491 [a][1]). The 1999 regional haze rule (EPA 1999),
Wilderness, and Point Reyes National Seashore. proposed by the EPA to address visibility issues, may have im-
plications for NOx emissions and N deposition in the west-
Current policy and regulatory framework ern United States. The rule is designed to improve visibility
Clearly, the impacts of N deposition to western ecosystems are in 156 Class I areas, including important western sites such
important issues. However, issues such as the human health as Yellowstone, Yosemite, and Grand Canyon National Parks.
impacts of atmospheric concentrations of O3 and particulate States are required to develop state implementation plans to
matter are more traditional policy drivers for NOx emissions reduce human-generated emissions of SO2 and NOx from pre-
reduction efforts. In the western United States, air quality pol- scribed fires and from mobile, stationary, and area sources,
icy has focused on issues such as regional haze and decreas- to reach natural background visibility conditions within 60
ing visibility in Class I areas, urban air quality in major cities, years. A major provision directs states to establish emissions
and O3 levels. While the ecological consequences of N depo- limits for older large stationary sources (e.g., power plants,
sition are important concerns, the air policy community smelters, and refineries) that can be achieved by installing the
knows less about these consequences and their magnitude in best available retrofit technology (BART) or alternative mea-
the West than about concerns such as visibility and human sures (e.g., emission trading programs) if such measures
health. As a result, ecological issues have not been prominent promise greater visibility improvements than source-by-
policy drivers in the West. source BART controls.
400 BioScience April 2003 / Vol. 53 No. 4Articles
The 1977 amendments to the Clean Air Act also empow- position and its ecological effects will be skewed away from
ered federal land management agencies to help prevent sig- areas where impacts are likely to be more prevalent and
nificant air quality deterioration in regions of the country with severe (although ecological effects are often observed with
good air quality. Established by sections 160–169 of the 1977 relatively low atmospheric deposition levels in remote high-
amendments, the Prevention of Significant Deterioration elevation watersheds). In addition, better emissions inventories
program specifies that Class I areas should receive the most are needed in many areas. These should include not only
stringent degree of air quality protection. During the per- major point sources but also mobile sources of all kinds (in-
mitting process that precedes construction of major new cluding non-road sources), combined small area sources,
pollution sources or major modifications of existing sources, and agricultural emissions from fertilizers and animal hus-
federal land managers are directed to consider whether “air bandry. The NH3 emissions inventory has the highest level of
quality related values” will be adversely affected by facility con- uncertainty because NH3 is an unregulated pollutant.
struction. If the facility will have adverse impacts on these val- Development of emissions factors and emission models for
ues in Class I areas, then state or federal action, and possibly NH3 is of the highest priority, particularly because NH3
both, must be taken to minimize the impacts. emissions are projected to increase in the future. The NH3
Emissions of NOx are not the only source of N deposition inventory affects both the total mass of N and the partition-
in the western United States. Other forms of airborne N, ing of N through the NH3–HNO3–H2SO4 (nitrate–nitric
such as NH3 and NH4+, are also of concern. Concentrated an- acid–sulfuric acid) equilibrium, which in turn affects the
imal feeding operations are a large source of these N forms, partitioning and lifetime of NOy. Inventories need to be up-
contributing to atmospheric N deposition through volatiliza- dated regularly to determine trends and the effectiveness of
tion from waste lagoons and land-based waste application. regulatory controls.
These operations are regulated at both state and federal lev-
els. Existing regulations focus on controlling effluents from Conclusions
CAFOs directly to surface water and groundwater, though cur- The major N emissions sources in the West are, in order of de-
rent and proposed CAFO regulations may have some corol- creasing importance, transportation, agriculture, and indus-
lary benefits in terms of decreasing atmospheric N sources. try. Transpacific N transport also contributes an unknown
amount of N deposition along the West Coast. Nitrogen de-
Priority research needs position seems to be on the rise in recent years in most areas
Improved understanding of western N sources, deposition pat- of the West affected by urban and agricultural emissions,
terns, and effects will support the development of better pol- because population and distance driven in these areas have in-
icy and management. Efforts to improve our understanding creased. Total NOx emissions in the western states are projected
are particularly timely in the context of the current debate over to decrease slightly by 2018 because of stricter tailpipe emis-
future air quality policy. Over the last several years, various leg- sions standards and the gradual phase-in of newer, cleaner
islative proposals to curb emissions of air pollutants have vehicles. By contrast, NH3 emissions from area sources are
been introduced in both houses of Congress. These propos- projected to increase by 2018. Because of regional variability
als vary in terms of the pollutants addressed, the levels of re- in activity and in population growth, total N emissions may
ductions required, and the timing of these reductions. A increase in some areas and decrease in others.
common element of the proposals is the imposition of a The highest known N deposition levels for wildland areas
mandatory cap on NOx emissions from the power generation in the West are at forest and shrubland sites in the Los Angeles
sector. However, because cap levels, timing, and other as- air basin (typically 25 to 45 kg per ha per year, although
pects of NOx emissions reduction vary among proposals, re- these rates can double in years with high fog deposition) and
sults in the West may differ from one proposal to the next. The desert sites in the Phoenix area (29 kg per ha per year), while
information provided through syntheses such as this one are large areas of the West with sparse populations have low
essential in helping policymakers understand and address deposition rates. Deposition to the arid ecosystems downwind
N-related issues in the West as the policy debate continues. of Phoenix may exemplify similar situations of high-
Ongoing research and monitoring efforts will also be crucial deposition exposure downwind of other urban regions in the
in helping evaluate policy changes to determine whether West, but this possibility has not yet been investigated.
they have achieved environmental goals. Current national deposition monitoring networks do not
In the western United States, more complete atmospheric adequately characterize total N deposition levels or identify
monitoring data are needed, including data on N inputs where the highest deposition rates occur. This is largely
from dry deposition and fog deposition. Deposition data are because dry deposition and fog deposition to canopies are not
needed at additional key sites in the West, located within the accounted for and because monitoring sites are located in sites
zone of influence of major emissions source areas. National remote from emissions sources.
monitoring networks emphasize remote wilderness and na- Decreasing N emissions will have the triple benefit of de-
tional park areas to the exclusion of other sites closer to ma- creasing concentrations of tropospheric O3 (a widespread
jor emissions sources. Unless these networks are augmented phytotoxic pollutant), reducing the eutrophying impacts of
with additional monitoring sites, data and research on N de- elevated N deposition in aquatic and terrestrial ecosystems,
April 2003 / Vol. 53 No. 4 BioScience 401Articles
Bytnerowicz A, Fenn ME. 1996. Nitrogen deposition in California forests: A
and reducing fine particulate pollution and regional haze. This
review. Environmental Pollution 92: 127–146.
will result in considerable benefits for human and ecosystem Bytnerowicz A, Tausz M, Alonso R, Jones D, Johnson R, Grulke N. 2002.
health. Legislation that caps and further decreases NOx emis- Summer-time distribution of air pollutants in Sequoia National Park,Cal-
sions from power generation sources will help in achieving ifornia. Environmental Pollution 118: 187–203.
these benefits. However, because power generation is not the Campbell PR. 1996. Population projections for states by age, sex, race, and
Hispanic origin: 1995 to 2025. US Bureau of the Census, Population Di-
major source of NOx emissions in the western United States,
vision. Report no. PPL-47. (9 March 2003; www.census.gov/population/
controlling emissions from this sector is only one component www/projections/pp147.html)
of an integrated solution. To make significant improvements Clow DW, Ingersoll GP, Mast MA, Turk JT, Campbell DH. 2002. Compari-
in air quality and to reduce N deposition inputs and effects son of snowpack and winter wet-deposition chemistry in the Rocky
on sensitive ecosystems, reductions of NOx emissions from Mountains, USA: Implications for winter dry deposition. Atmospheric
Environment 36: 2337–2348.
on-road and non-road mobile emissions sources will be re-
Clow DW, Sickman JO, Striegl RG, Krabbenhoft DP, Elliott JG, Dornblaser
quired. Finally, NHx emissions from agriculture are an im- M, Roth DA, Campbell DH. 2003. Changes in the chemistry of lakes and
portant source of N in some areas, although these emissions precipitation in high-elevation national parks in the western United
are not currently regulated. States, 1985–1999. Water Resources Research. Forthcoming.
Collett J Jr, Daube B Jr, Munger WJ, Hoffmann MR. 1989. Cloudwater
chemistry in Sequoia National Park. Atmospheric Environment 23:
Acknowledgm ents 999–1007.
We gratefully acknowledge the contribution of Sang-Mi Lee Driscoll CT, Lawrence GB, Bulger AJ, Butler TJ, Cronan CS, Eager C, Lam-
(Arizona State University, Environmental Fluid Dynamics bert KF, Likens GE, Stoddard JL, Weathers KC. 2001. Acidic deposition
Program) for help with the Models-3/CMAQ simulations in the northeastern United States: Sources and inputs, ecosystem ef-
for the Phoenix metropolitan area and Susan Schilling for crit- fects, and management strategies. BioScience 51: 180–198.
Driscoll C, et al. 2003. Nitrogen pollution in the northeastern United States:
ical assistance in the preparation of figures. We also gratefully
Sources, effects, and management options. BioScience 53: 357–374.
acknowledge the helpful reviews of an earlier version of the [EPA] US Environmental Protection Agency. 1999. Regional Haze Regula-
manuscript by Ellen Porter, Tamara Blett, Vickie Patton, and tions: Final Rule. 40 CFR Part 51. Federal Register 64: 35714–35774.
Van Bowersox, and the instructive comments of three anony- ———. 2000. Deposition of Air Pollutants to the Great Waters: Third Re-
mous reviewers. The research described in this article has not port to Congress. Research Triangle Park (NC): EPA Office of Air Qual-
ity Planning and Standards. Report no. EPA-453/R-00-005.
been subjected to the Environmental Protection Agency peer
———. 2003. National Emission Trends database. (17 March 2003; www.
and administrative review process and should not be construed epa.gov/air/data/netdb.html)
to reflect the views of the agency. Erisman JW, de Vries W. 2000. Nitrogen deposition and effects on European
forests. Environmental Reviews 8: 65–93.
References cited Fenn ME, Bytnerowicz A. 1997. Summer throughfall and winter deposition
Aber JD, Nadelhoffer KJ, Steudler P, Melillo JM. 1989. Nitrogen saturation in the San Bernardino Mountains in southern California. Atmospheric
in northern forest ecosystems. BioScience 39: 378–386. Environment 31: 673–683.
Akimoto H, Narita H. 1994. Distribution of SO2, NOx, and CO2 emissions Fenn ME, Poth MA. 1999. Temporal and spatial trends in streamwater
from fuel combustion and industrial activities in Asia with 1° x 1° res- nitrate concentrations in the San Bernardino Mountains, southern
olution. Atmospheric Environment 28: 213–225. California. Journal of Environmental Quality 28: 822–836.
Alexis A, Delao A, Garcia C, Nystrom M, Rosenkranz K. 2001. The 2001 Cal- Fenn ME, Poth MA, Johnson DW. 1996. Evidence for nitrogen saturation in
ifornia Almanac of Emissions and Air Quality. Sacramento: California the San Bernardino Mountains in southern California. Forest Ecology
Air Resources Board, California Environmental Protection Agency. and Management 82: 211–230.
Ames RB, Malm WC. 2001. Comparison of sulfate and nitrate particle mass Fenn ME, Poth MA, Aber JD, Baron JS, Bormann BT, Johnson DW, Lemly
concentrations measured by IMPROVE and the CDN. Atmospheric AD, McNulty SG, Ryan DF, Stottlemyer R. 1998. Nitrogen excess in
Environment 35: 905–916. North American ecosystems: Predisposing factors, ecosystem responses,
Baker LA, Hope D, Xu Y, Edmonds J, Lauver L. 2001. Nitrogen balance for and management strategies. Ecological Applications 8: 706–733.
the Central Arizona–Phoenix (CAP) ecosystem. Ecosystems 4: 582–602. Fenn ME, Poth MA, Schilling SL, Grainger DB. 2000. Throughfall and fog
Baron JS, Denning AS. 1993. The influence of mountain meteorology on pre- deposition of nitrogen and sulfur at an N-limited and N-saturated site
cipitation chemistry at low and high elevations of the Colorado Front in the San Bernardino Mountains, southern California. Canadian Jour-
Range, USA. Atmospheric Environment 27A: 2337–2349. nal of Forest Research 30: 1476–1488.
Baron JS, Rueth HM, Wolfe AM, Nydick KR, Allstott EJ, Minear JT, Moraska Fenn ME, Poth MA, Arbaugh MJ. 2002. A throughfall collection method
B. 2000. Ecosystem responses to nitrogen deposition in the Colorado Front using mixed bed ion exchange resin columns. In Proceedings of the
Range. Ecosystems 3: 352–368. International Symposium on Passive Sampling of Gaseous Air Pollutants
Baumgardner RE Jr, Lavery TF, Rogers CM, Isil SS. 2002. Estimates of the at- in Ecological Effects Research. TheScientificWorld 2 (1): 122–130.
mospheric deposition of sulfur and nitrogen species: Clean Air Status and (17 March 2003; www4.infotrieve.com/journals/toc_yearnav.asp?Field=
Trends Network, 1990–2000. Environmental Science and Technology 36: Journals%2ESID&Condition=equals&Value=1389321&SID=1389321)
2614–2629. Fenn ME, et al. 2003a. Ecological effects of nitrogen deposition in the
Bossert JE. 1990. Regional-scale flows in complex terrain: An observational western United States. BioScience 53: 404–420.
and numerical investigation. PhD dissertation. Colorado State Univer- Fenn ME, Poth MA, Bytnerowicz A, Sickman JO, Takemoto B. 2003b. Effects
sity, Fort Collins. of ozone, nitrogen deposition, and other stressors on montane ecosys-
Buyn DW, Ching JKS. 1999. Science algorithms of the EPA Models-3 Com- tems in the Sierra Nevada.In Bytnerowicz A, Arbaugh MJ, Alonso R, eds.
munity Multiscale Air Quality (CMAQ) Modeling System. Washington Ozone Air Pollution in the Sierra Nevada: Distribution and Effects on
(DC): US Environmental Protection Agency, Office of Research and Forests, Vol. 2: Developments in Environmental Sciences. Amsterdam:
Development. Report no. EPA/600/R-99/030. (Netherlands) Elsevier. Forthcoming.
402 BioScience April 2003 / Vol. 53 No. 4You can also read