2020 DISTRICT 1 HUNTING PROSPECTS Ferry, Stevens, and Pend Oreille counties - WDFW
←
→
Page content transcription
If your browser does not render page correctly, please read the page content below

2020
ANNEMARIE PRINCE, District Wildlife Biologist
BEN TURNOCK, Assistant District Wildlife Biologist

  DISTRICT 1 HUNTING PROSPECTS
  Ferry, Stevens, and Pend Oreille counties
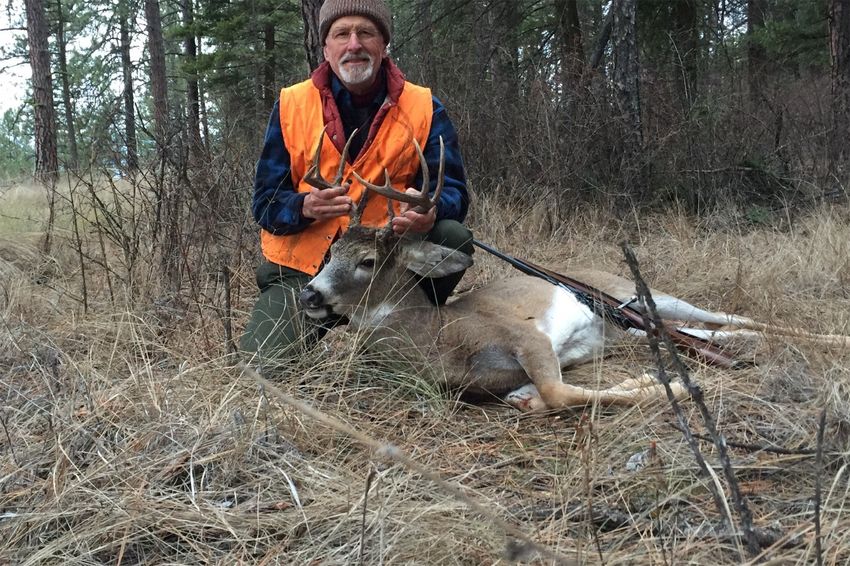
TABLE OF CONTENTS
DISTRICT 1 GENERAL OVERVIEW ........................................................................................................................5

ELK ...............................................................................................................................................................................8

        General Information, Management Goals, and Population Status ........................................................................8

        Which GMU Should Elk Hunters Hunt? ..............................................................................................................9

        What to Expect During the 2020 Season ............................................................................................................ 11

        How to Find Elk .................................................................................................................................................. 11

DEER........................................................................................................................................................................... 12

        General Information, Management Goals, and Population Status ...................................................................... 13

        Which GMU Should Deer Hunters Hunt? .......................................................................................................... 14

        What to Expect During the 2020 Season ............................................................................................................ 16

        How to Find and Hunt White-tailed Deer ........................................................................................................... 20

        How to Find and Hunt Mule Deer ...................................................................................................................... 21

        Deer Areas .......................................................................................................................................................... 21

        Notable Changes ................................................................................................................................................. 21

        Information about EHD/Blue Tongue and Deer ................................................................................................. 21

BLACK BEAR ............................................................................................................................................................ 22

        General Information, Management Goals, and Population Status ...................................................................... 22

        What to Expect During the 2020 Season ............................................................................................................ 23

        How to Locate and Harvest a Black Bear ........................................................................................................... 24

        Important Considerations .................................................................................................................................... 25

        Notable Changes ................................................................................................................................................. 26

COUGAR .................................................................................................................................................................... 27

        General Information, Management Goals, and Population Status ...................................................................... 27

        What to Expect During the 2020 Season ............................................................................................................ 28

        Notable Changes ................................................................................................................................................. 29

FOREST GROUSE ..................................................................................................................................................... 29

2|P a g e
Species and General Habitat Characteristics....................................................................................................... 29

        Population Status ................................................................................................................................................ 29

        Harvest Trends and 2020 Prospects .................................................................................................................... 29

        Hunting Techniques and Where to Hunt ............................................................................................................. 29

        Notable Changes ................................................................................................................................................. 31

PHEASANTS .............................................................................................................................................................. 31

WILD TURKEYS ....................................................................................................................................................... 33

        How to Find and Hunt Turkeys in the Spring ..................................................................................................... 35

        How to Find and Hunt Turkeys in the Fall ......................................................................................................... 35

WATERFOWL............................................................................................................................................................ 37

        Common Species ................................................................................................................................................ 37

        Best Hunting Areas ............................................................................................................................................. 38

        Hunting Techniques ............................................................................................................................................ 39

OTHER SMALL GAME SPECIES ............................................................................................................................ 41

MOOSE – SPECIAL PERMIT ONLY ....................................................................................................................... 42

        Harvest Trends .................................................................................................................................................... 44

        Access ................................................................................................................................................................. 45

        Important Information ......................................................................................................................................... 46

MAJOR PUBLIC LANDS .......................................................................................................................................... 46

PRIVATE INDUSTRIAL FORESTLANDS .............................................................................................................. 47

        General Information ............................................................................................................................................ 47

        Basic Access Rules ............................................................................................................................................. 48

        Heads Up For Archery and Muzzleloader Hunters ............................................................................................. 48

        Contact Information for Major Timber Companies ............................................................................................ 48

PRIVATE LANDS ACCESS PROGRAM ................................................................................................................. 49

ONLINE TOOLS AND MAPS ................................................................................................................................... 49

        Department of Natural Resources Public Lands Quadrangle (PLQ) Maps ......................................................... 50

        Online Parcel Databases ..................................................................................................................................... 50

3|P a g e
WDFW’s Online Mapping Tools ........................................................................................................................ 50

    Colville Area Maps ............................................................................................................................................. 50

    Other Online Resources ...................................................................................................................................... 50

4|P a g e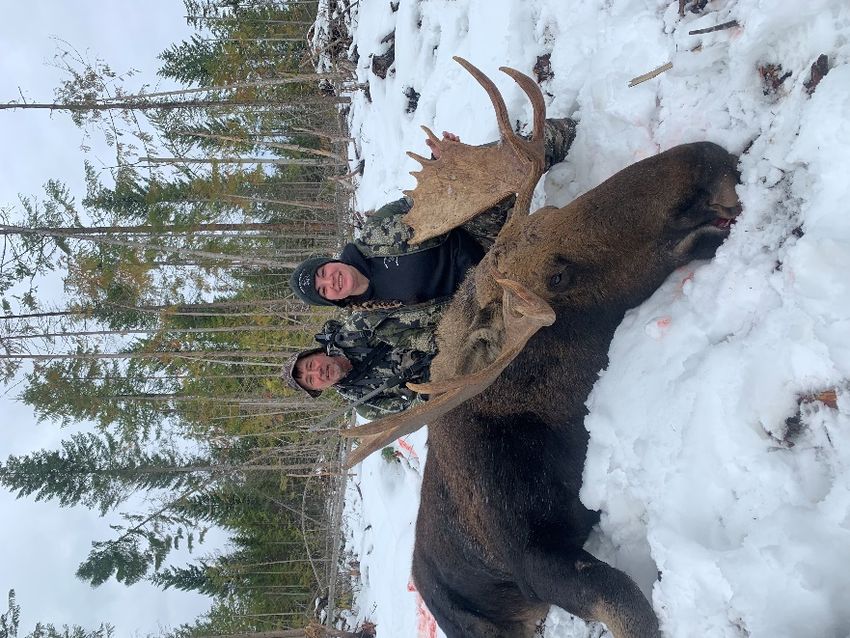
DISTRICT 1 GENERAL OVERVIEW
District 1 is in the northeastern corner of Washington, and includes Pend Oreille, Stevens, and
Ferry counties (Figure 1). District 1 is comprised of seven game management units (GMUs):
101 (Sherman), 105 (Kelly Hill), 108 (Douglas), 111 (Aladdin), 113 (Selkirk), 117 (49 Degrees
North), and 121 (Huckleberry) (Figure 2). The topography is dominated by four prominent
mountain ranges that run north and south: the Selkirk, Calispell, Huckleberry, and Kettle
mountain ranges. There are broad valleys between these ranges drained by the Pend Oreille,
Colville, Columbia, and Kettle rivers, all within the upper Columbia River watershed.

Figure 1. District 1 in northeastern Washington includes Pend Oreille, Stevens, and Ferry counties.

5|P a g e
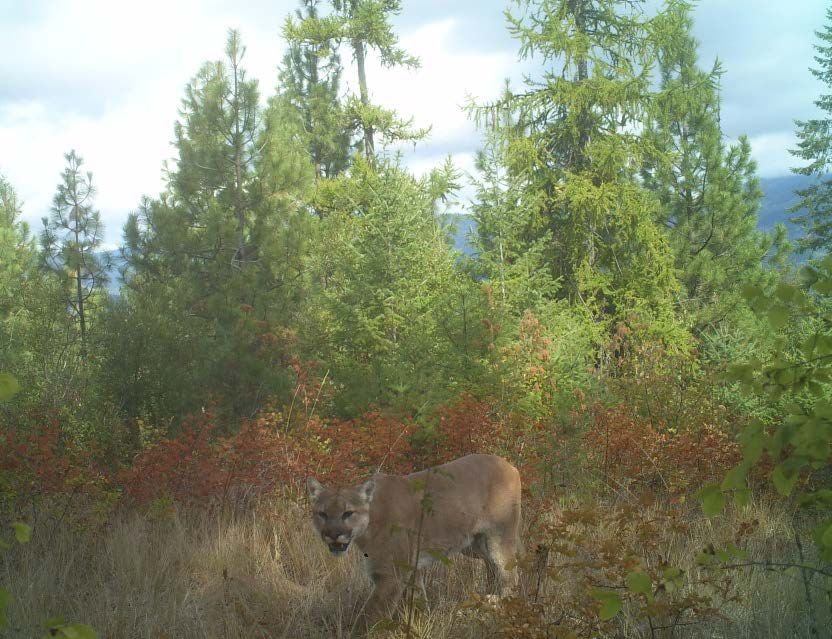
Figure 2. Game Management Units (GMUs) within District 1.

Elevations vary from about 1,290 feet at the normal pool level of Lake Roosevelt (Reservoir) to
7,309 feet on Gypsy Peak in the north Selkirk Range. Coniferous forest is extensive within
District 1, covering about two thirds, or 68 percent, of the district’s landscape. Agricultural land,
range land, and water features cover most of the balance.

Over one third (37 percent) of the land mass in District 1 is public land. It is mostly national
forest, but state Department of Natural Resources (DNR) and Washington Department of Fish
and Wildlife (WDFW) lands are also present. Additional public lands include federal Bureau of
Land Management (BLM), United States Fish and Wildlife Service (USFWS), and a few other
government agencies. Most of the public lands outside of Indian reservations are open to public
hunting. There are large timber company lands open to public hunting, although not necessarily
open to private motorized vehicles. Private lands are typically only open to hunting by first
gaining written permission from the landowner or manager.

District 1 is well-known for its white-tailed deer, moose, and turkey hunting opportunities.
Quality hunting opportunities also exist for other game species, including mule deer, black bear,
forest grouse, and cougar.

6|P a g e
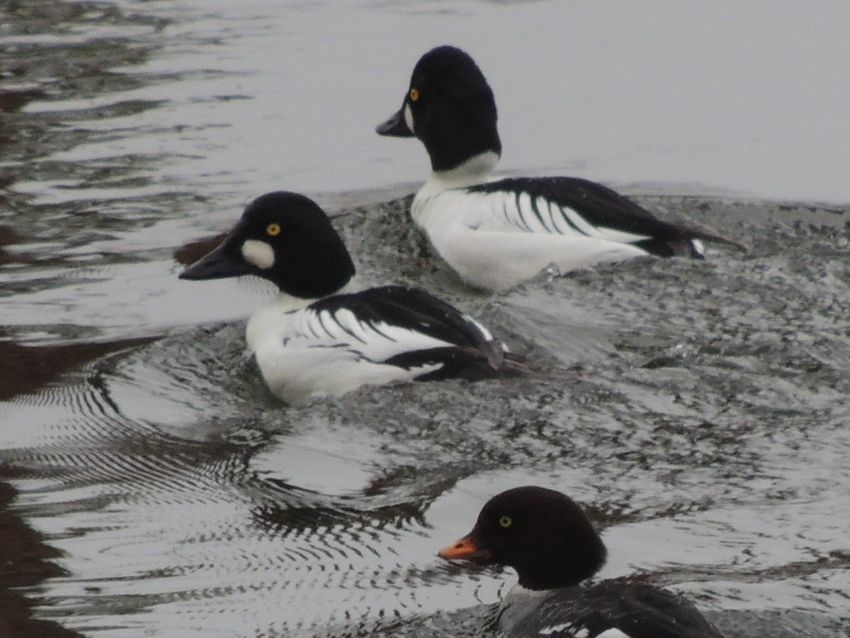
Table 1 presents estimates of harvest and days per kill for most game species in District 1 during
the 2019 general hunting season, and how those estimates compare to the 2018 season and the 5-
year average. For more specific information on harvest trends or permit statistics, please refer to
the appropriate section in this document.

Table 1. Harvest and days per kill for most game species found in District 1 during the 2018 and 2019
hunting seasons. Also included are the 5-year average and a comparison of 2018 estimates and 2019
estimates and the 5-year average.

          Species                                Harvest                                   Days/Kill
                                                             %        %                                        %
                                  5-yr                     change   change   5-yr                 % change   change
                                  avg.    2018    2019      (5yr)   (2018)   avg.   2018   2019    (5yr)     (2018)

 Elk                              230     204      253     10%      24%      118    82      87      6%       -26%

 Deer (both species)             5584     4668    4021     -28%     -14%     25     24      32     28%       33%

 Black Bear                       274     181      246     -11%     35%      86     116     88      2%       -32%

 Cougar                                                                         Not available

 *Includes fall and spring turkey harvest within GMUs 101-121.

7|P a g e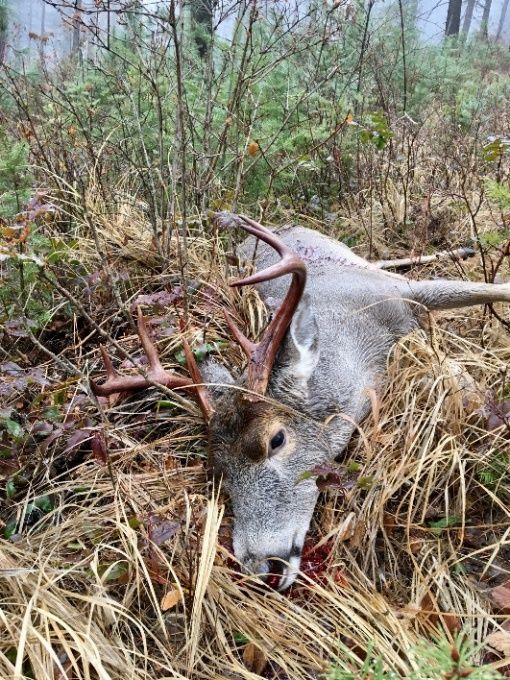
ELK

GENERAL INFORMATION, MANAGEMENT GOALS, AND POPULATION
STATUS
All elk that occur in District 1 are Rocky Mountain elk. There are ten identified elk herds in
Washington, and elk in District 1 are part of the Selkirk Elk Herd. The quality of elk hunting
opportunities in District 1 varies from poor to fair depending on the GMU, but in general,
opportunities are marginal and harvest success is very low. Elk are widely scattered in small
groups throughout the densely forested region of northeastern Washington. As a consequence,
elk in northeastern Washington are difficult to both survey and harvest. Population data are
limited, but there is currently no clear indication that bull to cow ratios or opportunities for
quality hunting are declining. The best elk hunting opportunities occur in GMUs associated with
the Pend Oreille sub-herd area, which includes GMUs 113 (Selkirk), 117 (49 Degrees North),
and 111 (Aladdin). Elk hunter numbers in the Colville District have increased over the last
several years with hunter participation and harvest well dispersed across the Colville District
through all three hunting methods. However, hunting elk successfully within District 1 is no
small challenge.

The management objective for elk in the Colville District is being met with a sustained annual
harvest of a viable and productive elk population with desirable population characteristics. The
prime bull (6 point or more) percentage in the 2019 bull harvest (all weapon types) was 21
percent.

Currently, WDFW does not make formal estimates or indices of population size to monitor elk
populations in District 1. Harvest levels have been relatively low for the northern Selkirk Herd
compared with other regions of Washington. Consequently, devoting substantial resources to
surveying bull to cow ratios has not been a high priority. Instead, trends in harvest, hunter
success, and catch per unit effort (CPUE) or its inverse, days per kill, are used as surrogates to a

8|P a g e
formal index or estimate. WDFW recognizes the limitations of using harvest data to monitor
trends in population size and hopes to gain the resources necessary to begin monitoring
populations using formal sampling designs in the future.

Increasing hunter harvest, documented expansion of elk distribution, and anecdotal information
indicate that elk populations are stable and possibly increasing in northeastern Washington. For
more detailed information related to the status of Washington’s elk herds, hunters should read
through the most recent version of the Game Status and Trend Report and/or the Selkirk Elk
Herd Plan.

WHICH GMU SHOULD ELK HUNTERS HUNT?
Probably the most frequent question from hunters is, “What GMU should I hunt?” This is not
easy to answer because it often depends on access to private land, the hunting method, and the
type of hunting experience desired. For example, not all GMUs are open to late archery hunters.

Many if not most hunters are looking for a quality opportunity to harvest a mature bull. Although
large mature bulls do exist in District 1, they are not very abundant, and hunters are usually
advised to apply for special permit opportunities within District 3 (Blue Mountains) if they are
searching for the best opportunity to harvest a large mature bull elk on public land in Region 1.

The ideal GMU for most hunters would have high densities of elk, low hunter densities, high
hunter success rates, and be mostly if not entirely comprised of public land that’s open to
hunting. Unfortunately, this scenario does not exist in any GMU that is open during the general
elk modern firearm, archery, or muzzleloader seasons in District 1. Instead, because of general
season opportunities, the GMUs with the highest elk densities tend to have the highest hunter
densities as well. For many hunters, high hunter densities are not enough to persuade them not to
hunt in a GMU where they see lots of elk. Other hunters prefer to hunt in areas with moderate to
low numbers of elk if that means there are also fewer hunters.

Table 2 provides a quick and general assessment of how District 1 GMUs compare with regard
to harvest, hunter numbers, and hunter success during general modern firearm, archery, and
muzzleloader seasons. The values presented are the three-year averages for each statistic. Total
harvest and hunter numbers were further summarized by the number of elk harvested and hunters
per square mile. This approach was taken because comparing total harvest or hunter numbers is
not always a fair comparison, as GMUs vary in size.

Each GMU was ranked for elk harvested/mile2 (bulls and cows), hunters/mile2, and hunter
success rates for the general season only. The three ranking values were then summed to produce
a final rank sum (lower rank sums are better). The modern firearm comparisons are the most
straightforward because bag limits and seasons are the same in each GMU.

For archery seasons, consider that antlerless elk may be harvested in all GMUs in the early
season, but only five GMUs are open for any bull during late archery seasons. These differences
are important when comparing total harvest or hunter numbers among GMUs.

9|P a g e
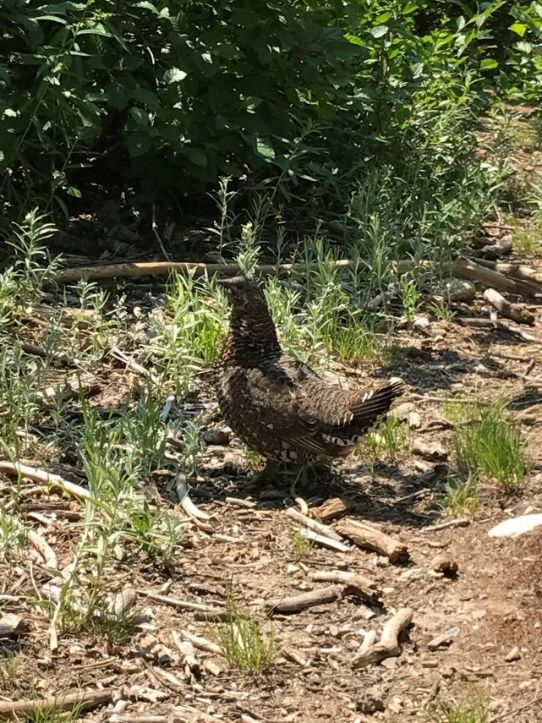
Table 2. Rank sum analysis that provides a quick and general comparison of how total harvest, hunter
numbers, and hunter success rates compare among GMUs during general modern firearm, archery, and
muzzleloader seasons. Data presented are based on a three-year running average. As a generalization,
the lower the rank sum, the better the overall elk hunting opportunity is within a GMU.

 MODERN FIREARM
                       Harvest               Hunter Density                 Hunter Success
               Size          Harvest                Hunters                           Rank
 GMU           (mi2)   Total per mi2   Rank Hunters per mi2         Rank Success Rank Sum
 101           1,103 4       .003      4     113        .10         1       2%        3       8
 105           296     10    .03       3     124        .42         2       5%        2       7
 108           289     9     .03       3     162        .56         3       2%        3       9
 111           455     9     .02       2     261        .57         4       2%        3       9
 113           736     20    .03       3     614        .83         7       2%        3       13
 117           954     25    .03       3     689        .72         6       2%        3       12
 121           796     40    .05       1     471        .59         5       6%        1       7
 ARCHERY
                       Harvest               Hunter Density                 Hunter Success
      Size                   Harvest                Hunters                           Rank
 GMU* (mi2)            Total per mi2   Rank Hunters per mi2         Rank Success Rank Sum
 101           1,103 3       .003      3     64         .06         1       4%        3       7
 105           296     6     .02       2     65         .22         3       5%        2       7
 108           289     3     .01       1     57         .20         2       4%        3       6
 111           455     7     .01       1     107        .24         4       5%        2       7
 113           736     11    .02       2     271        .37         6       2%        4       12
 117           954     18    .02       2     301        .32         5       6%        1       8
 121           796     17    .02       2     175        .22         3       6%        1       6

10 | P a g e
MUZZLELOADER
Harvest Hunter Density Hunter Success
Size Harvest Hunters Rank
GMU (mi2) Total per mi2 Rank Hunters per mi2 Rank Success Rank Sum
101 1,103 0 0 2 25 .02 1 0% 5 8
105 296 2 .01 1 31 .1 3 6% 2 6
108 289 2 .01 1 30 .1 3 4% 3 7
111 455 4 .01 1 68 .15 4 3% 4 9
113 736 8 .01 1 161 .22 6 4% 3 10
117 954 14 .01 1 161 .17 5 8% 1 7
121 796 6 .01 1 73 .09 2 6% 2 5
* GMUs bolded in the archery section are open during early and late archery seasons. All GMUs allow
for antlerless harvest in the early archery season.
WHAT TO EXPECT DURING THE 2020 SEASON
Elk populations typically do not fluctuate dramatically from year to year, but periodic severe
winters can trigger substantial die-offs. The 2019-20 winter was mild and no die-offs were
detected. There was an increase in harvest in 2019, but it’s unclear at this point if that will
continue to be the trend. Populations available for harvest are expected to be at least similar in
size compared to the 2018 and 2019 seasons. The total hunter harvest of elk in District 1 is low
compared to other WDFW districts, hovering around 200-300 animals per year since 2009.
HOW TO FIND ELK
When hunting elk in District 1, hunters should research areas and spend plenty of time scouting
before the season opener, because it is often difficult to predict elk location, especially after
hunting pressure increases. Elk within District 1 are scattered in small groups throughout the
district, but some drainages hold more elk than others. Many, if not most, hunters spend great
amounts of their time focusing on forest clear-cuts, which makes a lot of sense because elk often
forage in clear-cuts and are highly visible when they do. However, there are many elk (especially
bulls) that do not frequent clear-cuts during daylight hours. Instead, they spend most of their time
during the day in closed canopy forests, swamps, or young forest. Moreover, those highly visible
elk often attract many hunters to open clear-cuts, and these areas can get crowded in a hurry.
From a landscape perspective, some generalities can be made that will help increase the odds of
locating elk. When going to a new area, hunters will benefit by covering as much ground as
possible and making note of areas where they see sign along roads and log “landings.” Log
landings from past timber harvest operations are an especially good place to look for sign
because they are often not graveled, which makes it easier to see fresh tracks. This scouting
approach will give hunters a good idea of what areas hold elk and where to focus their more
intensive scouting efforts.
11 | P a g eAfter those areas with abundant elk sign have been identified, hunters should focus in on higher
elevation stands that provide cover and are adjacent to open hillsides and/or clear-cuts. During
early seasons when it is warm, these areas often include creek bottoms, river bottoms, or any
place that is near water. Once the season progresses and temperatures cool, typically by late
October, elk are not as attracted to water and the challenge of finding them becomes more
difficult. Hunting pressure also has an effect and will force elk to use areas that provide thicker
cover or are less accessible to hunters because of topographical features.
Later in the season, it is a good idea to consult a topographic map and find “benches” located in
steep terrain and thick cover. Elk often use these areas to bed down during the day. Any snow
cover generally enhances the ability to find elk tracks. Hunting right after a fresh snow usually
presents a particularly good advantage in tracking down an individual or group of elk. Lastly,
provided that non-motorized access is allowed, hunters should not let a locked gate in an
otherwise open area keep them from going in on foot, horseback, or bicycle to search for elk.
More often than not, these areas hold elk that have not received as much hunting pressure, which
can make them less skittish and easier to hunt. A popular approach to hunting these areas is to
use mountain bikes or fat-tire bikes, which is not extremely difficult given the network of
maintained gravel roads that frequently occur on timber company lands.
DEER
12 | P a g eGENERAL INFORMATION, MANAGEMENT GOALS, AND POPULATION
STATUS
In northeastern Washington, white-tailed deer are the most abundant deer species. Mule deer are
locally common, especially in the higher elevations and throughout Ferry County, but their
overall numbers are low compared to white-tailed deer on a district scale. Deer hunting
opportunities in District 1 vary from fair to excellent, depending on the GMU. The best
opportunities to harvest a mule deer in District 1 generally occur in GMUs 101 (Sherman) and
121 (Huckleberry). All GMUs within the district offer good opportunities to harvest a white-
tailed deer.
The white-tailed deer harvest management objective is to provide antlered and antlerless hunting
opportunity for all hunting methods whenever feasible.
Management goals for mule deer are to provide conservative hunting opportunity and allow
population levels to increase by managing antlerless hunting opportunity.
Surveys for deer in District 1 are
conducted before the modern
firearm hunting season. Pre-
season ratios come from
roadside surveys conducted
during August (for buck to doe
ratio) and September (for fawn
to doe ratio). These ground-
based surveys provide an
estimate of buck ratios prior to
the modern firearm hunting
season (Figure 3). However,
these surveys tend to occur in
more agriculturally dominated
areas where visibility of deer
from a road is good. There are
quality bucks in the more heavily
forested areas within the District, but they are just not as visible and therefore not represented in
our survey sample.
13 | P a g eFigure 3. Pre-season white-tailed deer ratios and 90 percent confidence intervals from ground surveys within District 1. All available harvest and survey data indicate white-tailed deer populations appear to be stable in all GMUs associated with District 1. According to harvest data, mule deer populations appear to be stable or slightly decreasing. For more detailed information related to the status of deer in Washington, hunters should read through the most recent version of the Game Status and Trend Report, which is available for download on the department’s website. For more information, hunters could also look at the White-tailed Deer Management Plan and the Mule Deer Management Plan. WHICH GMU SHOULD DEER HUNTERS HUNT? Probably the most frequent question from hunters is, “What GMU should I hunt?” This is not easy to answer because it depends on the hunting method and the target hunting experience. Some hunters are looking for a quality opportunity to harvest a mature buck, while others just want to harvest any legal deer in an area with few hunters. The ideal GMU for most hunters would be entirely or mostly comprised of public land, have high deer densities, low hunter densities, and high hunter success rates. Unfortunately, this scenario does not exist in any GMU that is open during the general modern firearm, archery, or muzzleloader seasons in District 1. Instead, because of general season opportunities, the GMUs with the highest deer densities tend to have the highest hunter densities as well. For many hunters, high hunter densities are not enough to persuade them not to hunt in a GMU where they see lots of deer. Other hunters 14 | P a g e
prefer to hunt in areas with moderate to low numbers of deer if that means there are also
relatively few hunters.

The information in Table 3 provides a general assessment of how GMUs compare with regard to
harvest, hunter numbers, and hunter success during general modern firearm, archery, and
muzzleloader deer seasons. The values presented are the three-year averages for each statistic.
Mule deer and white-tailed deer are combined for this table, but it is a reasonable assumption
that in GMUs other than GMU 101, the vast majority of the deer harvested are white-tailed deer.
Total harvest and hunter numbers were further summarized by the number of deer harvested and
hunters per square mile. This approach was taken because comparing total harvest or hunter
numbers is not always a fair comparison, as GMUs vary in size.

Each GMU was ranked for deer harvested/mile2, hunters/mile2, and hunter success rates. The
three ranking values were then summed to produce a final rank sum. Comparisons are pretty
straightforward because bag limits and seasons are the same for most GMUs.

When choosing a species to hunt or a GMU to hunt in, differences that should be considered are:

    1. Mule deer have a 3-point minimum harvest restriction during all general seasons.
    2. The late archery season in 101 runs longer than other GMUs.
    3. There is no late archery season in GMUs 111 or 113.
    4. There is a late muzzleloader season in GMU 113.

Table 3. Rank sum analysis that provides a quick and general comparison of how total harvest, hunter
numbers, and hunter success rates compare among GMUs during general modern firearm, archery, and
muzzleloader deer seasons. Data presented are based on a three-year average. As a generalization, the
lower the rank sum, the better the overall deer hunting opportunity is within a GMU.

 MODERN FIREARM
                 Harvest                      Hunter Density                   Hunter Success
     Size                  Harvest                         Hunters                              Rank
 GMU (mi2)       Total     per mi2    Rank Hunters         per mi2     Rank Success        Rank Sum
 101      1,103 427        .39        6       2483         2.25        2       17%         6       14
 105      296    227       .77        4       769          2.60        3       30%         2       9
 108      289    324       1.12       2       1047         3.62        6       31%         1       9
 111      455    314       .69        5       1412         3.10        4       22%         4       13
 113      736    247       .34        7       1338         1.82        1       19%         5       13
 117      954    764       .80        3       3357         3.52        5       23%         3       11
 121      796    1295      1.63       1       4250         5.34        7       30%         2       10

15 | P a g e
ARCHERY
Harvest Hunter Density Hunter Success
Size Harvest Hunters Rank
GMU (mi2) Total per mi2 Rank Hunters per mi2 Rank Success Rank Sum
101 1,103 182 .17 1 772 .70 7 23% 3 11
105 296 24 .08 5 96 .33 3 25% 2 10
108 289 30 .10 4 101 .35 4 29% 1 9
111 455 12 .03 6 73 .16 1 17% 5 12
113 736 11 .01 7 129 .18 2 8% 6 15
117 954 122 .13 3 561 .59 5 21% 4 12
121 796 120 .15 2 505 .63 6 23% 3 11
MUZZLELOADER
Harvest Hunter Density Hunter Success
Size Harvest Hunters Rank
GMU (mi2) Total per mi2 Rank Hunters per mi2 Rank Success Rank Sum
101 1,103 68 .06 2 239 .22 5 28% 3 10
105 296 6 .02 6 26 .09 1 24% 4 11
108 289 12 .04 4 34 .12 2 33% 1 7
111 455 15 .03 5 61 .13 3 23% 5 13
113 736 66 .09 1 323 .44 6 20% 6 13
117 954 28 .03 5 126 .13 3 20% 6 14
121 796 38 .05 3 113 .14 4 30% 2 9
WHAT TO EXPECT DURING THE 2020 SEASON
Harvest has remained stable in District 1 over the past two years, an expected trend based on
regulation changes. In 2015, muzzleloader and archery hunters could harvest any deer, whereas
in 2016 and 2017 this was changed to any buck, requiring a slight increase in hunter effort to
harvest a deer. In 2020, hunters of any user group or weapon type will not be able to harvest
a doe, this regulation change was enacted to protect the reproductive component of the
population. Pre-season surveys for the past three years yielded stable buck to doe and fawn to
doe ratios.
16 | P a g eDistrict 1 runs voluntary check stations on select weekends during the modern firearm season.
Check stations allow biologists to collect important biological information that informs
management. This may include teeth to determine the age structure of a population, detailed
information about the size of bucks being harvested, tissue samples to test for diseases like
chronic wasting disease, and body condition score for harvested animals. Aside from collecting
biological information, check stations allow biologists an opportunity to interact with the hunting
community, answer questions, and receive immediate feedback on how the season is going.
If you pass a check station, we encourage you to stop. Planned 2020 District 1 check station
locations are below. Additional check stations may be operated during the early or late modern
firearm deer season.
• Weigh station south of Clayton, north Spokane County
• WSDOT Gravel Pit on Hwy 395 and Sand Canyon Rd, Chewelah
A good predictor of future harvest during general seasons is recent trends in harvest and catch
per unit effort (CPUE) or its inverse, days per kill. Figures 4 and 5 provide trend data for each of
these statistics by GMU and are intended to provide hunters with the best information possible to
make an informed decision on where to hunt in District 1. Remember from 2011-2014, a 4-point
minimum restriction was imposed for white-tailed deer in GMUs 117 and 121, which led to
decreases in the overall harvest, hunter numbers, and hunter success. Available evidence shows
this regulation change brought about these decreases and not a dramatic decrease in the white-
tailed deer population. With the retirement of the 4-point rule within GMUs 117 and 121, the
deer harvest increased substantially in 2015 (Figure 4).
17 | P a g eFigure 4. Trends in the estimated number of bucks (blue) and antlerless (red) deer harvested during the general season (all weapons combined) in each GMU from 2015-2019. Harvest totals do not include tribal harvest or special permit harvest. 18 | P a g e
Figure 5. Trend in days per kill for archery (blue), muzzleloader (purple), multiple weapon (green),
and modern firearm (red) during the general season for deer in each GMU from 2015-2019 within
District 1.

19 | P a g e
HOW TO FIND AND HUNT WHITE-TAILED DEER
As is the case with most game species, the key to harvesting a white-tailed deer in District 1 is
scouting. White-tailed deer occur throughout the district and in nearly every present habitat type.
White-tailed deer densities are highest on private lands in the valleys and foothill benches
bordering the valleys, especially in the farm-forest mosaic within GMUs 105, 108, 117, and 121.
GMUs 101, 111, and 113 also have white-tailed deer, but with more localized distributions,
again with the highest densities typically on private lands.

The majority of hunting is done in or adjacent to agricultural fields or recent forest timber
harvest areas. When deer are present, they are much more visible than in adjacent habitats.
However, deer typically use these more open areas at night, dawn, and dusk, especially once they
have been disturbed by human presence. Therefore, it is advantageous for hunters to seek out
areas a short to moderate distance away from these openings, which provide more cover where
deer are spending more time. If a hunter is seeing large amounts of deer sign in an area, odds are
those deer are not far away.

                                      The traditional approaches to hunting white-tailed deer
                                      generally include several methods. The first is still-hunting,
                                      where the hunter is moving, but very slowly through a patch
                                      of habitat, stopping frequently to scan or glass the vegetative
                                      cover ahead with binoculars. The hunter looks for parts of a
                                      deer, like legs, an antler, or a portion of the body or head, as
                                      opposed to the whole deer, which is usually not visible
                                      through the vegetation. Stand hunting is another technique.
                                      This method involves the hunter patiently waiting in a tree
                                      stand, on a stump, against a tree trunk, on a ridge rock, etc. in
                                      high deer use areas (highly traveled trails, habitat edges,
                                      bottlenecks, funnels, etc.) until deer show up. A third deer
                                      hunting approach is conducting drives. This technique
                                      involves at least two hunters, but larger groups maximize its
                                      effectiveness. The hunters divide into “drivers” and
                                      “blockers.” The blockers position themselves in an organized
                                      spacing, often downwind of a patch of deer bedding habitat
(thick woods, forested swamp, or heavy brush field). The drivers then slowly hike through the
habitat patch, alerting the deer and hopefully pushing them to the blockers. Sometimes it’s a
good idea to post one blocker at the front of the habitat patch behind the drivers in the event that
any deer double back to evade them. Although each of these approaches is highly effective, there
is another technique that is not as well-known or used as much. This includes rattling and
grunting to simulate two bucks fighting over a doe. This technique is more common with mid-
western and eastern white-tailed deer hunters, but can be effective here as well, especially in the
days leading up to the rut (deer breeding season) in mid-November. A quick internet search on
this topic will yield plenty of evidence to illustrate its effectiveness when conditions are right.
More information on deer hunting can be found by following this link to the Washington
Department of Fish and Wildlife website.

20 | P a g e
HOW TO FIND AND HUNT MULE DEER Mule deer occur in District 1, but in much lower abundance than white-tailed deer, especially east of the Columbia River. Although mule deer occur within every District 1 GMU, the highest density is in GMU 101. As is the case with most game species, the key to harvesting a mule deer in District 1 is scouting. The classical western method of hunting mule deer is sometimes called spot and stalk. The hunter uses good optics, binoculars, and spotting scopes to scan from ridge tops and other vantage points to find the mule deer, pick out suitable bucks, and stalk them to within shooting distance. Ordinarily, the stalk entails a strategic hike and cautious sneak action. Much of District 1 does not offer the open country required for this method of hunting, but where it does, it can be effective. More information on deer hunting can be found by following this link to the Washington Department of Fish and Wildlife website. DEER AREAS There is one deer area in District 1, Parker Lake (Deer Area 1031). This deer area is described in the Area Descriptions section of the Big Game Pamphlet. Hunting is by special permit only within the Parker Lake area. NOTABLE CHANGES Antlerless white-tailed deer opportunity for archery and muzzleloader, and modern firearm youth and disabled hunters is no longer available; all legal harvest is buck only for all user groups. This change was enacted to conserve the reproductive portion of the population. Only 3-point minimum mule deer bucks may be taken during the early archery season within GMU 101. INFORMATION ABOUT EHD/BLUETONGUE AND DEER During the late summer of 2015, agency staff members documented a largescale bluetongue outbreak in District 1. In certain areas, WDFW received many reports of large numbers of dead deer. The extraordinary bluetongue outbreak in 2015 was brought about by the severe drought in northeast Washington. No outbreak was detected in subsequent years, and it’s hard to predict when the next outbreak may occur. More information about bluetongue can be found here. 21 | P a g e
BLACK BEAR

                                                       GENERAL INFORMATION,
                                                       MANAGEMENT GOALS, AND
                                                       POPULATION STATUS
                                                       The goals for black bear management in
                                                       Washington are to: 1) preserve, protect,
                                                       perpetuate, and manage black bear and
                                                       their habitats to ensure healthy, productive
                                                       populations; 2) minimize threats to public
                                                       safety from black bears, while at the same
                                                       time maintaining a sustainable and viable
                                                       bear population; 3) manage black bear for
                                                       a variety of recreational, educational, and
                                                       aesthetic purposes, including hunting,
                                                       scientific study, cultural and ceremonial
                                                       uses by Native Americans, wildlife
                                                       viewing, and photography; and 4) manage
                                                       populations statewide for a sustained
                                                       yield. For management purposes, the state
                                                       is divided into nine black bear
                                                       management units (BBMUs). Harvest
                                                       levels vary between BBMU depending on
                                                       local population dynamics and
                                                       environmental conditions.

District 1 consists of GMUs in part of the Northeastern BBMU. The current black bear hunting
season guidelines for the Northeastern BBMU are designed to maintain black bear populations at
a level which would not increase impacts to big game herds. The metrics used to direct black
bear harvest include the proportion of harvested bears that were female, the median age of
harvested females, and the median age of harvested males.

WDFW does not conduct annual surveys to monitor trends in black bear population size. Trends
in harvest data are used instead as population surrogates or indices. However, in 2019, biologists
conducted a survey to estimate black bear density in GMU 117. Unfortunately, results are not
ready, but will be included in next year’s hunting prospects document. Currently, black bear
populations are believed to be stable in District 1.

Black bears occur throughout District 1, but population densities vary among GMUs. The best
opportunities to harvest a bear likely occur in GMUs 101 (Sherman) and 117 (49 Degrees
North), mainly on account of abundant public land that is open to hunting.

22 | P a g e
WHAT TO EXPECT DURING THE 2020 SEASON Although some hunters specifically target black bears, most bears are harvested opportunistically during general deer and elk seasons. Consequently, annual harvest and hunter success can vary quite a bit from one year to the next. Since 2004, hunter success in District 1 GMUs has varied from 4 percent to 18 percent. The success rate is likely higher for hunters who specifically hunt black bears versus those who buy a bear tag just in case they see one while deer or elk hunting. Overall, annual black bear harvest during the general bear season in District 1 showed a stable trend from 2014 to 2016 before declining sharply in 2017 and 2018 (Figure 6). Harvest increased a bit in 2019 and may continue to fluctuate up and down. At the GMU level, most black bears will likely be harvested in GMUs 101 (Sherman), 117 (49 Degrees North), and 121 (Huckleberry). Harvest numbers, during the 2019 season and compared to long-term (ten year) and short-term (five year) averages, show a slight decrease in harvest in most GMUs within District 1 (Figure 7). Based on the past 3-years of harvest and the 2019 regulation change (August 1 opener and two bear bag limit), it is hard to predict what black bear harvest may be in 2020. Figure 6. Trends in the number of male and female black bears harvested during the general bear season in District 1 (GMUs 101-121), 2010–2019. Harvest estimates do not include bears harvested during spring permit seasons or bears removed because they were causing damage to private property. The sex of harvested bears is not available for 2011. 23 | P a g e
Figure 7. The number of black bears harvested in each GMU during the 2019 general bear season in
District 1. Also included are the 10-year (2010-2019) and 5-year (2015-2019) average for the total
number of bears harvested in each GMU.

HOW TO LOCATE AND HARVEST A BLACK BEAR
Scouting is an extremely important factor that hunters should consider when specifically hunting
for black bears in District 1. Although black bears are fairly common and occur in some areas at
high densities, they are seen infrequently because of the thick evergreen conifer forest and other
vegetation that dominates the landscape.

Black bears can occur in a variety of habitat types, so it can be difficult to narrow down where to
search for them. In the early fall, hunters should focus their efforts at higher elevations and in
open terrain (e.g. open hillsides). Huckleberries ripen throughout the summer, but in the early
fall prior to heavy frost, the most berries remaining are typically at higher elevations. A large
huckleberry patch yielding lots of fruit would be a good place to hunt.

Bears can also be located in recent timber harvests that contain a large number of berry-
producing shrubs, including huckleberries, serviceberries, snowberries, soapberries, and
thimbleberries. During the fall, hunters need to find openings with these characteristics and hike
through them to see if there is any bear sign. If they do find fresh sign, odds are there is a bear
frequenting the area. If hunters are patient and sit for extended periods of time watching these
areas, they stand a reasonable chance of harvesting a bear. Patience is the key.

24 | P a g e
IMPORTANT CONSIDERATIONS
Black bear hunters in GMUs 101 – 117 are required to complete WDFW’s online bear
identification test each year and carry proof that they have passed. Prep for and take the
test at Bear Identification Program.

There are consistent sightings and known resident grizzly bears in District 1. Grizzly bears are a
federally threatened and state-listed endangered species. Killing one, either unintentionally or
intentionally, can bring costly fines and penalties, and set back recovery efforts for grizzly bears.
Just like with other similar looking game species such as elk/moose/caribou, mule deer/white-
tailed deer, bobcat/lynx, and other animal groups, Washington hunters are responsible for being
able to tell the difference between black bears and grizzly bears. This knowledge and skill is
critical in areas where the ranges of these two bear species overlap (Figure 8). In addition,
hunters within GMUs 113 and 105 are STRONGLY encouraged to carry bear spray while
hunting. Hunters should know how to use bear spray before heading into the field. Information
about bear spray and how to use it can be found here.

Bear hunters are urged not to shoot sows with cubs. Sows may be accompanied by cubs in the
fall that tend to lag behind when traveling, so please observe and be patient before shooting.

WDFW requires the submission of a tooth from successful black bear hunters. Hunters are
encouraged to submit teeth by December 1 of the current hunt year. Biologists use this
information to better monitor black bears, make management decisions, and evaluate the impacts
of harvest on the population. In addition, black bear hunters that submit a tooth can find out the
age of their harvested bear by entering their Wild ID here. Just be aware that it takes about 6
months after the close of all bear seasons to receive the ages back from the lab, so there is a
delay in this information being available. Hunters can pick up a tooth envelope at WDFW
regional and district offices and some sporting goods stores. If available, a biologist can pull the
tooth for you if the skull is not frozen. A helpful instructional video for pulling a tooth can be
found here.

25 | P a g e
Figure 8. Black bear range and grizzly bear sighting areas in Washington.

NOTABLE CHANGES
District 1 black bear hunters (GMUs 101 – 117) are required to complete WDFW’s online
bear identification test each year and carry proof that they have passed. Bear identification
information can be found on the Bear Identification Program website. Fall black bear season
dates have been extended and bag limits have increased in eastern Washington, hunters now
have the opportunity to start hunting August 1 throughout the state and the bag limit has
increased to two bears. Hunters must purchase a second bear tag to harvest a second bear. Spring
permit levels for 2021 will be announced in the winter of 2020.

26 | P a g e
COUGAR

GENERAL INFORMATION, MANAGEMENT GOALS, AND POPULATION
STATUS
                                                               Cougars occur throughout District 1,
                                                               but local densities can vary among
                                                               GMUs. Cougars in District 1 are
                                                               managed with the primary objective
                                                               of maintaining a stable cougar
                                                               population.

                                                            Beginning in 2012, WDFW changed
                                                            cougar harvest management
                                                            throughout Washington. The biggest
                                                            change was shifting away from using
                                                            season length or permit seasons to
                                                            manage the number of cougar
                                                            harvested, and instead using a
                                                            standard liberal season coupled with
                                                            harvest guidelines. The intent was to
have a longer season, without any hunting implement restrictions, and only close cougar seasons
in specific areas if harvest reached or exceeded a harvest guideline.

Beginning in the 2015 hunting season, cougar season dates were extended through April 30.
However, to hunt cougars after March 31 in a unit open for cougar harvest, hunters need
to purchase a 2020 hunting license and cougar tag. Harvest numbers are examined starting
January 1 and any hunt area that meets or exceeds the harvest guideline may be closed. Hunting
cougar after December 31 requires first confirming that the cougar season is open in the
intended hunt area by calling 1-866-364-4868. Harvest guidelines for each hunt area located in
District 1 are provided in Table 4. All hunters must report their kills via the cougar hotline within
72 hours (1-866-364-4868, press 3 after greeting), and kills must be sealed by WDFW within
five days. Skulls and hides (with proof of sex attached) must not be frozen when presented to
WDFW for sealing.

Table 4. Harvest guidelines and 2018-19 harvest for the six cougar hunt areas located in District 1.

               Hunt Area (GMU)     2020-2021 Harvest Guideline          2018-2019 Harvest
                      101                     7-11                              5
                      105                      4                                2
                    108,111                   9-11                              5
                      113                     4-5                               4
                      117                    11-13                              7
                      121                     9-11                              9

27 | P a g e
WHAT TO EXPECT DURING THE 2020 SEASON
The number of cougars harvested in District 1 in 2019 was the same as in 2018 (Figure 9). The
average age at harvest is variable for both males and females, but is typically three years old or
younger (Figure 10).
Figure 9. General season cougar harvest in District 1, 2009-2018.
Figure 10. Average age of female (orange bars) and male (blue bars) cougar harvested during the
general season in District 1, 2009-2018.
28 | P a g eNotable Changes
Cougar harvest guidelines were increased for GMUs within District 1 for 2020. Season dates will
still be extended until April 30 unless harvest guidelines are met within the GMU. However, to
hunt cougars after March 31 in a unit open for cougar harvest, hunters need to purchase a 2021
hunting license and cougar tag.
FOREST GROUSE
SPECIES AND GENERAL HABITAT
CHARACTERISTICS
There are three species of grouse that occur in District 1:
ruffed grouse, dusky (blue) grouse, and spruce grouse.
Ruffed grouse are the most abundant and occur at lower
elevations and valley bottoms. Spruce grouse are usually
located in high elevation forest comprised of lodgepole
pine, subalpine fir, and/or Engelmann spruce. In District
1, these habitats are prevalent within the Kettle and
Selkirk mountain ranges. Dusky grouse can be found in
habitats that occur at elevations between ruffed and spruce
grouse habitat, but overlap does occur.
POPULATION STATUS
Trends in harvest data are generally used as surrogates for
estimating a population or indices of population size.
Total harvest numbers tend to vary with hunter numbers,
so catch-per-unit-effort (CPUE), or birds harvested per hunter day, is the best indicator of
population trends. In District 1, forest grouse populations appear to have declined since 2009.
However, 2015 was a very good year, with CPUE of 0.72 birds/day. The 2018 hunting year was
a better than average year for forest grouse hunters, and the CPUE was 0.64 birds/day (Figure
11). Due to COVID-19 and the delay in small game hunter surveys, 2019 harvest data was not
available in time to include in this year’s prospects.
HARVEST TRENDS AND 2020 PROSPECTS
The total number of forest grouse harvested in District 1 gradually declined from 2009-2014.
However, 2015 and 2017 had higher than average harvest. We anticipate 2020 harvest to be
similar to previous years, but perhaps on the lower end. District 1 had a wet spring and this can
sometimes negatively impact chick survival.
The average number bagged amongst hunters could fall between 0.4 and 0.6 forest grouse per
hunting day.
HUNTING TECHNIQUES AND WHERE TO HUNT
In general, the most effective way to hunt forest grouse in District 1 is by walking little used
forest roads and shooting them as they flush or after they roost in a nearby tree. Forest grouse
29 | P a g etend to occur in higher densities along roads that do not receive much motor vehicle traffic. Consequently, hunters should target roads behind locked gates and roads that have been decommissioned by the respective landowner. Some forest grouse hunters use trained bird dogs, a team system that can be extremely effective. To learn more about how to hunt each of Washington’s grouse species, see WDFW’s upland bird hunting webpage. Figure 11. Trends in total harvest, hunter numbers, hunter days, and forest grouse harvested per hunter day during forest grouse seasons in Ferry County (orange), Stevens County (purple), Pend Oreille County (green) and throughout District 1 (blue), 2011–2018. 30 | P a g e
NOTABLE CHANGES
Bag and possession limits are as follows:

Bag limit: four grouse with no more than three of
any one species.
Possession limit: 12 grouse with no more than nine
of any one species.

WDFW will have wing barrels distributed
throughout District 1 in 2020. If you drive by a
barrel, please follow the instructions at the
barrel and deposit one wing and tail from each
forest grouse harvested using the paper bags
provided. This information helps biologists
determine the distribution of species, age, and sex
in the harvest.

                 PHEASANTS

There is only a small, range-limited
population of wild ring-necked pheasants in
District 1. The population occurs almost
entirely on private lands within the Colville
Valley. Consequently, most pheasant
hunting opportunity within District 1 is
associated with the Eastern Washington
Pheasant Enhancement and Release
Program. The primary intent of this
program is to provide an upland bird
hunting opportunity and encourage
participation from young and older-aged
hunters. Each year, thousands of captive-
reared ring-necked pheasants are released at
33 sites, and one of those sites (Sherman Creek Wildlife Area) occurs within District 1. The
Sherman Creek Release Site is located in Ferry County south of the headquarters to Sherman
Creek Wildlife Area between the Inchelium Highway and Lake Roosevelt (Figure 12).
To protect other wildlife species, including waterfowl and raptors, nontoxic shot is now required
for all upland bird, dove, and band-tailed pigeon hunting on all pheasant release sites statewide.
At these release sites, hunters may use only approved nontoxic shot (either in shotshells or as
loose shot for muzzle loading). Possession of lead shot is also regulated on some wildlife areas.
See the Migratory Waterfowl and Upland Game Seasons pamphlet for more information. Visit
the Eastern Washington Pheasant Enhancement and Release Program website to learn more
about pheasant releases.

31 | P a g e
Figure 12. Map of the Sherman Creek Pheasant Release Site in Ferry County. 32 | P a g e
WILD TURKEYS
                 The turkeys found in District 1 are Merriam’s wild
                 turkeys. Merriam’s turkeys flourished in the district
                 after being introduced in 1961, but then slowly
                 declined. Since a large transplant from South Dakota
                 in 1988-89, this population has steadily expanded in
                 both range and abundance.

                 In most GMUs within the District, fall harvest has
                 increased, while spring harvest has remained relatively
                 stable (Figure 13). The recent increase in fall harvest
                 could be from an increase in the population but is
                 more likely the result of a longer season and more
                 liberal bag limit that began in 2018.

33 | P a g e
Figure 13. Fall (orange), spring (green), and total (blue) estimated turkey harvest for each GMU in District 1, 2015-2019. 34 | P a g e
HOW TO FIND AND HUNT TURKEYS IN THE
SPRING
Increasing daylight between late winter and early spring triggers
the beginning of breeding season, although unusually prolonged
cold, wet, or warm weather may delay or advance it. Gobbling
and strutting start well before mating, when turkeys are still on
their winter range in late March or early April. There are
normally two peaks of gobbling. The first occurs when males call
and females are not yet nesting, and the second occurs a few
weeks later, when most hens are incubating eggs. Finding these
gobbling toms and moving close enough to call them in without
bumping (flushing) them is the challenge and excitement to
traditional spring turkey hunting. For more information on how to
hunt turkeys, click here.
HOW TO FIND AND HUNT TURKEYS IN THE FALL
During fall and winter, wild turkey priorities are food and roosting areas. In the fall, food
remains critical for growth of poults (juvenile turkeys) and for adults adding fat reserves. Forest
edges that offer seeds, nuts, and fruits, as well as some green vegetation, are used the most. At
this time of year, turkeys are at their highest population and widest distribution within
northeastern Washington, including District 1. As autumn wears on and snowfall comes, the
turkeys gradually constrict their range to lower elevations. Where agriculture predominates, a
mosaic of short grass fields or cropland and forest is generally the best place to find turkeys.
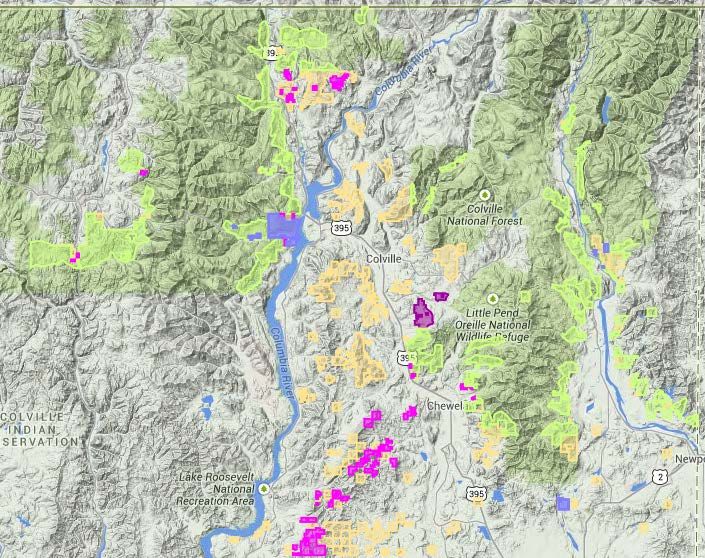
35 | P a g eFigure 14. Map depicting public lands good for turkey hunting. This map is produced by map metrics. 36 | P a g e
WATERFOWL

COMMON SPECIES
A wide variety of ducks occur in District 1. Common dabbling ducks include mallard, gadwall,
American wigeon, green-wing teal, and northern shoveler. Diving ducks are also present,
including bufflehead, scaup, ring-necked ducks, redheads, goldeneyes, and mergansers. Nesting
wood ducks can be located in the Pend Oreille, Colville, and Kettle River valleys, and can
provide a unique hunting opportunity early in the season. Mallards are the most abundant duck
species in Washington and constitute the majority of ducks harvested statewide (typically ≥ 50
percent). They are a commonly harvested duck in District 1 as well.

Canada geese are the only wild goose commonly found within District 1. They are abundant in
the Pend Oreille, Colville, and Kettle River valleys, especially in the widest valley bottom areas
where there is extensive farmland cultivation.

37 | P a g e
BEST HUNTING AREAS
Pend Oreille River
The upper Pend Oreille River, from Newport downstream to Usk, probably offers the best
general waterfowl hunting opportunity within northeastern Washington. Outside of the east
shoreline, alongside the Kalispell Indian Reservation, most of the river itself is open for hunting,
along with a number of islands. In most instances a boat is required, either to serve as a hunting
blind or for access to islands and sandbars open to hunting. There are also Pend Oreille Public
Utility District lands, as well as U.S. Fish and Wildlife Service refuge land (the Cusick Unit)
open to public hunting. These parcels are located near the mouths of Tacoma and Trimble
creeks, into the Pend Oreille River.

Dabbling ducks: Moderate numbers during migration, mostly gadwall, wigeon, teal, mallards,
and some pintails.
Diving ducks: Moderate numbers with the highest densities during peak migration periods.
Geese: Canada geese occur in the greatest abundance in this part of District 1.

Lake Roosevelt
Lake Roosevelt up to the 1310 feet elevation contour is mostly federally owned and managed by
the National Park Service. Much of the lake shore also borders the Colville and Spokane Indian
Reservations, however, and in these areas the tribes manage the shoreline. As such, where you
can legally hunt is somewhat complicated. Hunters should call the National Park Service in
Kettle Falls at 509-738-6266 for clarification before hunting.

Dabbling Ducks: Low to moderate numbers during migration, mostly wigeon, and mallards.
Diving Ducks: Relatively few, but higher densities during peak migration periods.
Geese: Canada geese have a scattered distribution in this hundred-mile long reservoir and can
occur in high numbers during peak migration.

Colville and Kettle Valleys
Almost all of the valley bottoms are private lands, so obtaining written permission for hunting
access is essential. Ducks are most common where there are slow, meandering streams, sloughs,
and/or farm ponds. Geese are most common in the agricultural areas.

Dabbling Ducks: Low to moderate numbers during migration, mostly mallards.
Diving Ducks: Relatively few, but higher densities during peak migration periods, especially on
the Colville River.
Geese: Canada geese are fairly evenly distributed in the Colville Valley. When heavy snowfall
covers fields late in the season, they tend to migrate south to warmer, snow-free areas.

38 | P a g e
You can also read