Combining the Monthly Drought Code and Paleoecological Data to Assess Holocene Climate Impact on Mediterranean Fire Regime - MDPI
←
→
Page content transcription
If your browser does not render page correctly, please read the page content below
fire

Article
Combining the Monthly Drought Code and
Paleoecological Data to Assess Holocene Climate
Impact on Mediterranean Fire Regime
Marion Lestienne 1,2, * , Christelle Hély 2,3 , Thomas Curt 4 , Isabelle Jouffroy-Bapicot 1
and Boris Vannière 1,5
 1    Chrono-Environnement, CNRS, Université Bourgogne Franche-Comté, 25000 Besançon, France;
      Isabelle.Jouffroy@univ-fcomte.fr (I.J.-B.); boris.vanniere@univ-fcomte.fr (B.V.)
 2    The Institute of Evolution Sciences of Montpellier, Université Montpellier, CNRS, EPHE, IRD,
      34090 Montpellier, France; christelle.hely-alleaume@umontpellier.fr
 3    Ecole Pratique des Hautes Etudes, PSL University, 75006 Paris, France
 4    National Research Institute of Science and Technology for Environment and Agriculture,
      Mediterranean Ecosystems and Risks, 13100 Aix-en-Provence, France; thomas.curt@irstea.fr
 5    MSHE Ledoux, CNRS, Université Bourgogne Franche-Comté, 25000 Besançon, France
 *    Correspondence: marionlest.jc@gmail.com

 Received: 9 March 2020; Accepted: 2 April 2020; Published: 9 April 2020

 Abstract: Currently, indexes from the Fire Weather Index System (FWI) are used to predict the daily
 fire hazard, but there is no reliable index available in the Mediterranean region to be compared with
 paleofire records and check for their long-term reliability. In order to assess the past fire hazard and
 the fire-season length, based on data availability and requirements for fire index computation, we first
 chose and tested the efficiency of the Drought Code (DC) in Corsica (the main French Mediterranean
 fire-prone region) over the current period (1979–2016). We then used DC as a benchmark to assess
 the efficiency of the Monthly Drought Code (MDC) and used it to assess the Fire-Season Length
 (FSL), which were both used to characterize the fire hazard. Finally, we computed the Holocene
 MDC and FSL based on the HadCM3B-M1 climate model (three dimensional, fully dynamic, coupled
 atmosphere-ocean global climate model without flux adjustment) datasets and compared both index
 trends with those from proxies of paleofire, vegetation, and land use retrieved from sedimentary
 records in three Corsican lakes (Bastani, Nino, and Creno). Our strategy was to (i) assess fire hazard
 without the constraint of the daily weather-data requirement, (ii) reconstruct Holocene fire hazard
 from a climate perspective, and (iii) discuss the role of climate and human fire drivers based on the
 MDC-Paleofire proxy comparisons. Using both the Prométhée fire database and the ERA-Interim
 climate database over Corsica for the current period, we showed that DC values higher than 405 units
 efficiently discriminated fire-days from no-fire-days. The equivalent threshold value from MDC was
 set at 300 units. MDC and FSL indexes calculated for each of the past 11 millennia Before Present
 (11 ka BP) showed high values before 7 ka BP (above 300 units for MDC) and then lower values for
 the mid- to late Holocene (below 300 units for MDC). Climate appeared as a key driver to predict
 fire occurrences, promoting fires between 11 and 8 ka BP when summers were warmer than the
 current ones and reducing fire hazard after 7–6 ka BP due to wetter conditions. Since 5 ka BP, humans
 have taken control of the fire regime through agro-pastoralism, favoring large and/or frequent events
 despite less fire-prone climate conditions. The current fire hazard and fire-season length computed
 over the last few decades (1979–2016) both reported values that were respectively higher and longer
 than those assessed for the previous six millennia at least and comparable for those before 7 ka BP.
 For the next decades, due to climate warming associated with land abandonment (fuel accumulation)
 and the increase in human-related sources of ignition, we can expect an increase in fire hazard and
 larger fire events.

Fire 2020, 3, 8; doi:10.3390/fire3020008                                            www.mdpi.com/journal/fire
Fire 2020, 3, 8                                                                                      2 of 22

 Keywords: fire hazard; fire weather index; drought code; fire-season; modelling; paleofire;
 fire driver; Corsica

1. Introduction
      Fire is an integral part of ecosystems all around the world [1–4], and the average conditions in
terms of fire seasonality, frequency, area burned, severity, and intensity define the given fire regime for
each type of ecosystem [5]. Located at the interface between temperate European and subtropical North
African conditions, the Mediterranean climate is characterized by a seasonal warm and dry climate with
a marked summer drought [6,7], making it a fire-prone region [8,9]. For instance, during the last few
decades (1979–2016), 9646 fires larger than 5 ha occurred in the French part of the Mediterranean Basin,
and 830,566 ha (~22,447 ha·year−1 ) have been burned [10]. Several factors influence the fire occurrence
and behavior. The relative roles of climate, vegetation, and humans are still debated [11–13]. However,
climate is probably one of the superordinate drivers of fires at regional scales [14] by controlling fire
weather [15] (corresponding to the important factors determining fire probability of occurrence and
fire behavior [16]), lightning-induced ignition [17], and the amount and distribution of flammable
biomass [18,19]. Currently, humans are a superimposed driver by their footprints on the vegetation
composition (with crops, pasture, and deforestation) [20] and their organization in the landscapes, or
directly by igniting fires (accidents, negligence, or intentional ignitions) [21,22]. By considering the
climate as one of the main fire drivers, it is likely that changes in past climate had a substantial effect
on wildfire history [1,21]. Several studies used linear or non-linear models to relate meteorological
variables to those of fires, and a large number of them used the indexes of the Fire Weather Index system
(FWI) [23], which employs daily meteorological conditions to compute a variety of indexes aiming to
estimate fuel moisture content, potential fire speed, and intensity, and an overall fire hazard index.
While the FWI system was first developed for Canadian forests, it found worldwide applications,
especially in the Mediterranean basin [24–26], where it has good results for predicting fire hazard [27].
However, no reliable index has ever been tested to characterize both past and present variables of
fire regimes, mainly due to the difficulties to obtain daily past weather-data beyond the historical
instrumental period. This study aims to test whether the Monthly Drought Code (MDC) [28], also
originally developed for the boreal forest, could be used for the Mediterranean region. This is in order
(i) to assess fire hazard accurately without the constraint of the daily climate-data requirement as only
monthly means and the maximum are required, (ii) to reconstruct the Holocene (last 1700 years) fire
hazard from a climate perspective using climate model simulations, and (iii) to discuss the respective
roles of climate and humans as fire drivers.
      The interest in testing the use of monthly data instead of daily data comes from the availability
of climate model simulations and databases for past and future projections [29–31] and for historical
observations [32], as they are mostly provided as monthly means. FWIs have been shown interest for
the Mediterranean area to predict fire hazard associated with weather conditions [24–26]. Moreover,
DC and MDC are very well correlated in the North American region [1] and are used to predict or to
reconstruct fire hazard and fire events. From these two points, we hypothesized that MDC and the
Fire-Season Length (FSL) could also be pertinent indicators for fire-weather condition prediction in the
Mediterranean region.
      In order to validate the changes in Holocene fire-weather conditions and based on the availability of
past climate data, we computed the MDC values centered on each millennium for the past 11 millennia
and compared them with regional paleofire reconstructions based on sedimentary charcoal contents
from three Corsican lacustrine records (one as an original charcoal dataset presented here and two
from the literature). The French island of Corsica is located in the western Mediterranean basin and
is among the best preserved islands in the Mediterranean region in terms of plant diversity [33,34].
Fire 2020, 3, x FOR PEER REVIEW                                                                                     3 of 23
Fire 2020, 3, 8                                                                                                     3 of 22

of plant diversity [33,34]. As in other areas of the Mediterranean region, the relative role of humans
and
As inclimate  in Corsican
       other areas         fire regime is still
                    of the Mediterranean        debated
                                           region,       [9,35–37].
                                                    the relative role of humans and climate in Corsican fire
     This  study  contributes  to
regime is still debated [9,35–37].understand    the underlying   factors influencing fire regimes during the
last millennia  in the  Mediterranean   region   both by  providing
      This study contributes to understand the underlying factors     a new   high-resolution
                                                                          influencing          and well-dated
                                                                                      fire regimes during the
charcoal  record, which completes a previous study on Holocene plant diversity in Corsica [33,38],
last millennia in the Mediterranean region both by providing a new high-resolution and well-dated
and  by applying and testing an alternative fire hazard index adapted to past climate simulations and
charcoal record, which completes a previous study on Holocene plant diversity in Corsica [33,38],
current  observations.
and by applying and testing an alternative fire hazard index adapted to past climate simulations and
current observations.
2. Materials and Methods
2. Materials and Methods
2.1. Study Area and Sampled Lakes
2.1. Study Area and Sampled Lakes
      Corsica is a French island located in the western Mediterranean basin, 80 km from the Italian
coastCorsica
       and 160iskm    from island
                  a French   the French
                                    locatedcoast   (Figure
                                               in the western1). In  spite of highbasin,
                                                                 Mediterranean       mountains,    there the
                                                                                           80 km from      areItalian
                                                                                                               no glaciers
                                                                                                                      coast
and no
     160permanent
          km from the  snow   on the
                          French      island
                                  coast        [39].1).
                                          (Figure    TheInvegetation
                                                            spite of highwas  mainly composed
                                                                            mountains,    there areofno pinewood     (Pinus
                                                                                                          glaciers and   no
sp.) and Ericaceous
permanent     snow on species     (Erica
                          the island   [39].sp.)
                                              The during   the early
                                                    vegetation    was Holocene,      before a of
                                                                        mainly composed        significant
                                                                                                  pinewoodchange(Pinusthat
                                                                                                                        sp.)
occurred    duringspecies
and Ericaceous      the Neolithic    (around
                            (Erica sp.)  during  6 ka
                                                   thecal. Before
                                                       early        Present
                                                              Holocene,       (BP)),a notably
                                                                            before             with
                                                                                      significant     the increase
                                                                                                   change            in oak
                                                                                                             that occurred
forests  andNeolithic
during the     woodlands      (Quercus
                         (around          sp.),
                                   6 ka cal.      which
                                              Before       dominated
                                                       Present            the island
                                                                 (BP)), notably  withduring      the remainder
                                                                                        the increase   in oak forestsof and
                                                                                                                        the
Holocene    [33,40,41].  Currently,   the  high   population     and  settlement   density  on  the
woodlands (Quercus sp.), which dominated the island during the remainder of the Holocene [33,40,41]. island   and  pastoral
activity
Currently,abandonment       are veryand
             the high population      important
                                          settlementstakes   that,on
                                                        density     combined
                                                                      the islandwith
                                                                                  andthe   warming
                                                                                        pastoral        climate,
                                                                                                  activity        induce a
                                                                                                            abandonment
high  fire important
are very   risk [8,9]. stakes that, combined with the warming climate, induce a high fire risk [8,9].

     Figure 1.
     Figure     Geographical context
             1. Geographical  context of
                                      of Corsica
                                         Corsica (France)
                                                 (France) and
                                                          and lakes
                                                               lakes from
                                                                     from which
                                                                          which sedimentary
                                                                                sedimentary charcoals
                                                                                            charcoals were
                                                                                                      were
     extracted:  Nino (the present study), Creno  [42], and Bastani [33].
     extracted: Nino (the present study), Creno [42], and Bastani [33].

      Sediment cores from three mountain lakes were studied for fire reconstructions in Corsica, namely
      Sediment cores from three mountain lakes were studied for fire reconstructions in Corsica,
Lake Bastani [33], Lake Creno [9], and Lake Nino (this study) (Figure 1) [43]. Lake Bastani (42◦ 060 N,
namely    Lake Bastani [33], Lake Creno [9], and Lake Nino (this study) (Figure 1) [43]. Lake Bastani
9◦ 130 E) is one of the most elevated lakes in Corsica. Because its watershed is small and due to the
(42°06′ N, 9°13′ E) is one of the most elevated lakes in Corsica. Because its watershed is small and due
topography, this windward lake is a good captor for wind-transported particles including charcoals
to the topography, this windward lake is a good captor for wind-transported particles including
produced in the surrounding regional area [44,45]. Conversely to Lake Bastani, Lake Nino (42◦ 250 N,
charcoals   produced in the surrounding regional area [44,45]. Conversely to Lake Bastani, Lake Nino
8◦ 940 E, 650,000 m2 ) and Lake2 Creno (42◦ 120 1800 N, 08◦ 560 4500 E) (Figure 1) are lower in altitude and
(42°25′ N, 8°94′ E, 650,000 m ) and Lake Creno (42°12′18′′ N, 08°56′45′′ E) (Figure 1) are lower in
are expected to capture more local fires. A detailed study for Lake Bastani, including vegetation and
altitude and are expected to capture more local fires. A detailed study for Lake Bastani, including
fire histories over the last 11 ka BP based on pollen assemblages and charcoal influx, was presented in
vegetation and fire histories over the last 11 ka BP based on pollen assemblages and charcoal influx,
Lestienne et al. [33]. The complete study for Lake Creno, including fire change reconstructions over the
was presented in Lestienne et al. [33]. The complete study for Lake Creno, including fire change
last 10 ka BP based on charcoal influx, was presented in Leys et al. [42]. The present study combined
reconstructions over the last 10 ka BP based on charcoal influx, was presented in Leys et al. [42]. The
the fire reconstruction from Bastani [33] and Creno [42] with the original paleofire record from Nino,
present study combined the fire reconstruction from Bastani [33] and Creno [42] with the original
and all are presented here for comparison with the monthly drought code index computed throughout
paleofire record from Nino, and all are presented here for comparison with the monthly drought code
the Holocene.
index computed throughout the Holocene.
Fire 2020, 2, x; doi: FOR PEER REVIEW                                                          www.mdpi.com/journal/fire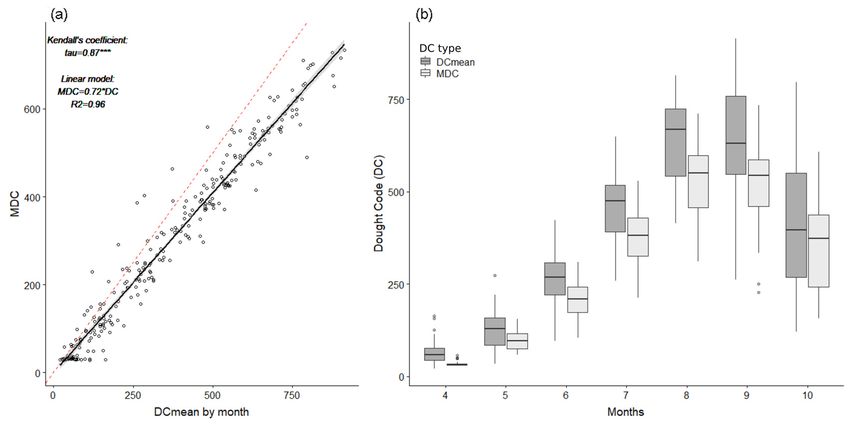
Fire 2020, 3, 8                                                                                   4 of 22

2.2. Charcoal, Pollen, and Fungal Remains Analyses
     High-resolution and well-dated sedimentary records (see Figure A1 for the datation procedure
and the resulting age-depth model) of the lakes Bastani, Nino, and Creno were used to reconstruct the
past fire signal and the surrounding environment.
     A total of 271 (for Bastani) and 618 (for Nino) contiguous sediment samples were retrieved along
cores every 10 or 5 mm (depending of the sedimentation rate). For charcoal extraction, each sample was
washed on an 80 µm mesh sieve after hydrochloric acid and hydrogen peroxide treatments according to
the standardized macro-charcoal sieving method [46,47]. All charcoal particles from each sample were
observed with a digital microscope coupled to the high-speed camera, Keyence VHX-5000 (Keyence
Corporation, Ōsaka, Japan). Images, observed using a 100 × magnification, were assembled to observe
the entire sample on one picture with a high precision. From this picture and adding information on
charcoal visual characteristics (color and brightness ranges), the microscope software performed a
semi-automated counting of charcoal particles present in the sample: each particle corresponding
to the color and brightness ranges chosen was selected, and the user checked each particle visually.
For Creno, charcoal particles were counted by the authors from 891 continuous samples using similar
digital image analysis software (WinSeedle 2007, © Regent Instruments Inc., Quebec City, Canada) [9],
and the published reconstruction with its own age-depth model can be compared to Lake Nino and
Lake Bastani paleofire records.
     A total of 21,138 (Bastani), 38,622 (Nino), and 2705 (Creno) charcoal particles were identified.
The charcoal record was quantified by calculating the CHarcoal Accumulation Rates (CHAR), i.e.,
the quantity of charcoal particles per volume of sediment and per unit of time according to the
sedimentation accumulation rate estimated by the depth–age model (#/cm2 /year). Based on the
sample-age average, the cores were resampled by 20 years (approximately the mean step of Nino and
Creno cores) to make them comparable.
     A smooth curve was generated from the resampled and rescaled (Z-score) CHAR values of the three
lakes (Bastani, Nino, and Creno) using the LOESS (Locally-Estimated Scatterplot Smoothing) method.
     Dealing with other proxies available from Bastani [33], the AP/NAP ratio contrasted the total
number of Arboreal Pollen grains (AP) to the Non-Arboreal Pollen grains (NAP) and was a surrogate
for the vegetation land cover (i.e., woody versus non-woody cover) [48]. Crop and ruderal pollen
taxa were part of NAP and were indicators of human presence [49]. Fungal remains, and particularly
Sporormiella sp., were local dung indicators and, in turn, a pasture marker, and therefore a human
activity marker [50]. The detailed method and results for charcoals, pollen, and fungal remains analysis
are available in Lestienne et al. [33].

2.3. Current Climate and Fire Datasets
     Current climate data were extracted from ERA-Interim [32], which is a global atmospheric
reanalysis from 1979, continuously updated in real time, with a spatial resolution of approximately
80 km, Corsica being covered by a total of five pixels [32] (Figure A2).
     Current fires’ data were extracted from the Prométhée database [51], which includes the date
of ignition, origin (anthropogenic or naturally ignited), size, and location (2 × 2 km resolution) of
wildfires that have occurred since 1973 in southern France. To assess the fire regime, we only extracted
Corsican wildland fires larger than 5 ha in size and from 1979 to 2016 to match with the ERA-Interim
time period (Table 1).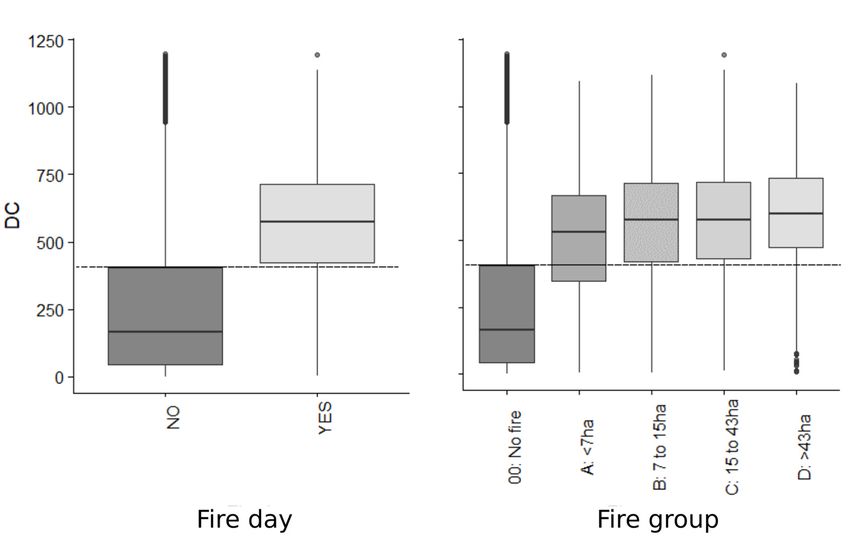
Fire 2020, 3, 8                                                                                             5 of 22

      Table 1. Main characteristics of the current Corsican fire regime and climate normal over the 1979–2016
      period. Fires (>5 ha) were extracted from the Prométhée database [51], and climate data were extracted
      from ERA-Interim Climate Models [32].

        Dataset               Variable                                Unit                    Value
                           Fire frequency                           #·year−1                    84
                                                     max                                       5644
     Fire regime
                            Burned area             median             ha                       10
                                                     mean                                       82
                            Fire Season                              month         June to September/October
                                                    autumn                                     16.2
                                                     winter            ◦C                      12.1
                      Mean temperature (temp)
                                                     spring                                    20.1
                                                    summer                                     26.4
                                                    autumn                                      99
                                                     winter                                     57
                      Mean precipitation (prec)                   mm·month−1
                                                     spring                                     45
    Climate data                                    summer                                      27
                                                    autumn                                     69.5
                                                     winter                                    66.2
                       Relative humidity (rh)                          %
                                                     spring                                    54.7
                                                    summer                                     50.9
                                                    autumn                                     12.8
                                                     winter                                    13.6
                          Wind speed (ws)                            km·h−1
                                                     spring                                    11.5
                                                    summer                                      9.7

2.4. Climatic Model
     Paleoclimate conditions were extracted from HadCM3B-M1 simulations (three dimensional, fully
dynamic, coupled atmosphere-ocean global climate model without flux adjustment) [51], this model
being a variant of the fully complex Hadley Centre Climate Model HadCM3, usually involved in
the Intergovernmental Panel on Climate Change assessment reports. The HadCM3B-M1 variant was
originally the most commonly used [52,53]. It is a three-dimensional, coupled atmosphere–ocean global
climate model without flux adjustment, which is very similar to that described by Gordon et al. [54].
This model performed a snapshot equilibrium simulation per millennium, from which climate normals
(monthly means) for main variables (i.e., air temperature and precipitation used here) were computed
(Figure A3). We therefore used these datasets of climate normals for the last eleven millennia (centered
at 11, 10, . . . , 2, and 1 ka BP), as well as for the control run representative of the pre-industrial
period (i.e., AD ca. 1750, considered as equivalent to 0 BP) to compute temperature and precipitation
anomalies (i.e., difference and rate of change for temperature and precipitation, respectively) for each
millennium [55].
     Using an inverse-distance weighting approach on the four closest pixels from those covering
Corsica, we downscaled these anomalies by applying them to the current period climate normals
computed from the ERA-Interim dataset (80 × 60 km resolution, 5 pixels used to include all of Corsica)
to reconstruct past climate for each Holocene millennium at the whole island scale [55,56].

2.5. Fire Weather Index System
     The Fire Weather Index System is part of the Canadian Forest Fire Danger Rating System, which
has been developed by Forestry Canada since 1968 [23,57]. It is a weather-based system that models
fuel moisture using a dynamic bookkeeping system that tracks the drying and wetting of distinct
fuel layers in the forest floor, i.e., their potential flammability (Figure A4). The first three moisture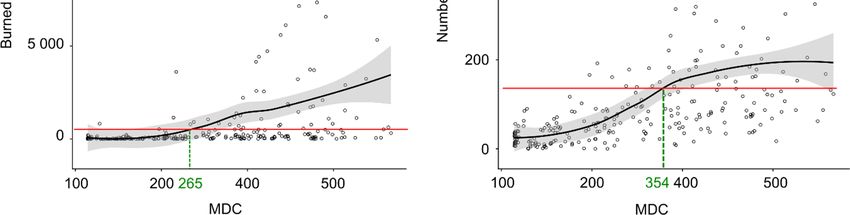
Fire 2020, 3, 8                                                                                    6 of 22

codes of the FWI represent the moisture contents of three superposed humus layers: the surficial layer
fine fuels “Fine Fuel Moisture Code” (FFMC, 1–2 cm deep), the loosely compacted duff layer with
organic material “Duff Moisture Code” (DMC, 5–10 cm deep), and the deep duff layer of compacted
organic material “Drought Code” (DC, 10–20 cm deep). The DMC and DC indexes were combined to
create a generalized index of the availability of fuel for consumption “BUildup Index” (BUI), while the
FFMC was combined with the wind speed to estimate the potential fire rate of spread “Initial Spread
Index” (ISI). Finally, the BUI and ISI were combined to create the FWI, which represented the potential
intensity of a spreading fire, and therefore the overall fire hazard [23].
     The DC was calculated with the R software (cffdrs package) and was a function of the “Daily
Humidity index” (DH) and the Potential Evapotranspiration (PE) [23]; see Figure A4 for the
computation details.
     Daily climatic data of the whole island from ERA-Interim were used to calculate the FWIs during
the current period (1979–2016). However, we aimed to calculate an index usable for the entire Holocene,
and wind speed and relative humidity changes over long periods may be less reliable when extracted
from climate model simulations due to their intrinsic daily and subdaily variabilities. Therefore, we
chose to use precipitation and temperature only, and consequently to focus exclusively on the drought
code [23]. Its time lag for complete drying was 52 days, so it indicated the effects of seasonal drought
on forest fuels and the probability of smoldering in deep duff layers and in large logs. It was a simple
moisture bookkeeping system that used an estimate of daily temperature to estimate a day’s potential
evapotranspiration, following the method of Thornthwaite and Mather [58], and daily rainfall to track
increases in wetness of the deep layer (Figure A4). The fact that there was no human activity related to
the DC computation was a valuable characteristic that allowed us to use it to assess past periods such
as earlier in the Holocene or before. DC values between days with and without fires were compared
over the 1979–2016 period to find a DC threshold value that would characterize fire-days (i.e., a value
assumed excluding at least 75% of the no fire-days and including at least 75% of the fire-days). Then,
we tested the efficiency of the monthly drought code [28] by comparing it to DCmean. DCmean
simply represents the monthly mean of the daily values of DC, while MDC was originally created to
be computed from monthly means of precipitation and maximum temperatures [28]. For Canada, an
MDC value higher than 280 units has been associated with an extreme drought and corresponds to a
high fire hazard [28]. We therefore searched for a threshold value allowing detecting months with
high fire hazard based on Corsica MDC values computed with the ERA-Interim database over the
1979–2016 period. Then, MDC values were computed for the entire Holocene (0 to 11 ka BP) based on
the HadCM3B-M1 temperature and precipitation datasets, and their trend compared with the paleofire
trend from charcoal records. The MDC is not intended to be used in operational situations where daily
weather data are available for fire managers, but it could be very helpful to highlight past or future
changes in droughts and consequences on fire hazard [28,59].

2.6. Fire Season Length
      Based on historical analysis of MDC values, and according to the method originally developed by
Hély et al. [56] for DC, but adapted here to MDC, we used the MDC threshold value (presented in the
Results Section) to calculate the fire-season length for the 1979–2016 period and for each Holocene
millennium as well. Basically, for all months with MDC values above the threshold, we considered the
full month length (30 or 31 days) as part of the fire-season. To define the starting and ending months of
the fire-season and to add the related number of days (i.e., < 30 or 31 for each month), we used a basic
linear interpolation between each of these months reporting MDC values lower than the threshold
value, but just preceding or following a month with above-threshold MDC values.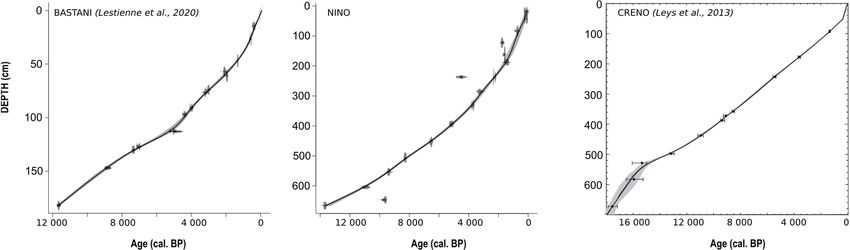
Fire 2020, 3, x FOR PEER REVIEW 7 of 23
Fire 2020, 3, 8 7 of 22
3. Results
3. Results
3.1. DC and MDC Efficiently Detect Fire Days/Months of the Current Period (1979–2016)
3.1. DC
As and MDC Efficiently
compared to the otherDetect Fire Days/Months
indexes of the Current
of the fire weather Period (1979–2016)
index related to fuel moisture (Figure A5),
DC performed better as it significantly discriminated days with and
As compared to the other indexes of the fire weather index related to fuel without fires (Figure 2).
moisture Fire days
(Figure A5),
from
DC the Prométhée
performed better asdatabase showeddiscriminated
it significantly median and mean
days withDC values that were
and without ca. 300 units
fires (Figure 2). Firehigher
days
(572 and
from 548, respectively)
the Prométhée databasethanshowedDCmedian
values and
recorded
mean DC during days
values thatfor which
were there
ca. 300 were
units no fires
higher (572
reported (166 and 250, respectively). Moreover, the larger the fire, the higher DC
and 548, respectively) than DC values recorded during days for which there were no fires reported (Figure 2). In order
to exclude
(166 and 250,most of the no-fire-days
respectively). Moreover,without excluding
the larger too
the fire, many
the fire-days,
higher DC (Figurewe conservatively defined
2). In order to exclude
the DC value of 405 units (75% no-fire-days were excluded, while 78% of fire-days
most of the no-fire-days without excluding too many fire-days, we conservatively defined the DC were conserved)
as theof
value threshold
405 unitsabove
(75% which days were
no-fire-days were considered as potential
excluded, while 78% of fire-days and also
fire-days were considered
conserved) as
as the
belongingabove
threshold to the which
fire-season.
days were considered as potential fire-days and also considered as belonging
to the fire-season.
Figure 2.2.Comparisons
Comparisonsofof Drought
Drought Code Code
(DC)(DC) distributions
distributions betweenbetween daysorwith
days with or without
without fire
fire reported
(left t-test,
panel,(left
reported p > t-test,
panel, 0.001) pand amongand
> 0.001) increasing
among fire size classes
increasing (defined
fire size from
classes the distribution
(defined from the
quartiles)
distributionas quartiles)
comparedas tocompared
the no-firetoclass (right panel,
the no-fire first class).
class (right panel,Forfirstboth panels,
class). fires panels,
For both and related
fires
day conditions
and related day were extracted
conditions werefrom the Prométhée
extracted database. database.
from the Prométhée The horizontal dotted line
The horizontal in each
dotted line
panel
in eachcorresponds to the chosen
panel corresponds to the DC threshold
chosen (405 units)
DC threshold (405inunits)
orderintoorder
calculate the fire-season
to calculate length.
the fire-season
It excludes
length. 75% of the
It excludes 75%no-fire-days and includes
of the no-fire-days 78% of the
and includes 78%fire-days.
of the fire-days.
Monthly means of
Monthly means ofdaily
dailyDCDC(i.e.,
(i.e.,DCmean)
DCmean)over over the
the 1979–2016
1979–2016 period
period and
and forfor
each each month
month of
of the
the fire-season
fire-season (April–October)
(April–October) werewere compared
compared to MDC
to the the MDCvaluesvalues computed
computed overover the same
the same months
months and
and period. DCmean values were slightly higher than MDC values,
period. DCmean values were slightly higher than MDC values, yet their relationship (linearyet their relationship (linear
regression
regression model)
model) andand their
their covariation
covariation (non-parametric
(non-parametric Kendall
Kendall rank
rank correlation
correlation coefficient)
coefficient) were
were
highly
highly significant
significant(Figure
(Figure 3a,3a,
MDCMDC = 0.72 × DC).
= 0.72 Moreover,
× DC). the intra-seasonal
Moreover, monthlymonthly
the intra-seasonal trends reported
trends
by both metrics
reported by bothwere verywere
metrics similar
very(Figure
similar3b), suggesting
(Figure the use of MDC
3b), suggesting the useasof
a good
MDCproxy of DC
as a good and
proxy
therefore
of DC andoftherefore
the fire hazard to be
of the fire tracked.
hazard Using
to be the linear
tracked. Usingrelationship between DCmean
the linear relationship betweenand MDC
DCmean
(Figure 3a), we inferred the 300 unit MDC as the threshold to be used to compute
and MDC (Figure 3a), we inferred the 300 unit MDC as the threshold to be used to compute FSL and FSL and to analyze
its change through
to analyze its change thethrough
Holocene. the Holocene.
Fire 2020, 2, x; doi: FOR PEER REVIEW www.mdpi.com/journal/fireFire 2020, 3, 8 8 of 22
Fire 2020, 3, x FOR PEER REVIEW 8 of 23
Figure 3. (a) Correlation between the Monthly Drought Code (MDC) and DCmean using monthly
values
values from
from April
April to
to October
October over
over the
the 1979–2016
1979–2016 period (n =
period (n 532 corresponding
= 532 corresponding to
to seven
seven months
months each
each
year for 38 years). The dotted red curve represents the perfect match between DCmean
year for 38 years). The dotted red curve represents the perfect match between DCmean and MDC, and MDC,
while
while the
the black
black curve
curve is
is the
the linear
linear regression
regression model
modelfound
found(MDC(MDC== aDC+b), and for
aDC+b), and for which
which the
the normal
normal
distribution
distribution and
and homoscedasticity
homoscedasticity of of residuals
residuals were
were tested.;(b)
tested.;(b) DCmean
DCmean and
and the
the MDC
MDC changes
changes along
along
the fire-season (currently encompassing months from April to
the fire-season (currently encompassing months from April to October).October).
The
The relationships over the
relationships over the 1979–2016
1979–2016 period
period between
between MDCMDC values
values for
for each
each fire-season
fire-season month
month
and the monthly burned area or the monthly number of fires (Figure A6)
and the monthly burned area or the monthly number of fires (Figure A6) were analyzed towere analyzed to test
test the
the
efficiency of the MDC threshold efficiency in discriminating fire-prone months. Both burned
efficiency of the MDC threshold efficiency in discriminating fire-prone months. Both burned area and area and
number
number of fires were
of fires were significantly
significantly correlated
correlated with
with the
the MDC
MDC values. Moreover, the
values. Moreover, the 300 unit threshold
300 unit threshold
discriminated the most fire-prone months (i.e., with more than 200 fire occurrences and/or
discriminated the most fire-prone months (i.e., with more than 200 fire occurrences and/or more than more than
5000
5000 haha burned).
burned).
3.2. Change in MDC and FSL during the Holocene
3.2. Change in MDC and FSL during the Holocene
The summer MDC values were particularly high at the beginning of the Holocene (11 ka BP
The summer MDC values were particularly high at the beginning of the Holocene (11 ka BP −9
−9 ka BP) (Table 2, Figure 4), with the highest value of 685 units at 9 ka BP. Then, MDC decreased until
ka BP) (Table 2, Figure 4), with the highest value of 685 units at 9 ka BP. Then, MDC decreased until
6 ka BP and remained stable (i.e., around 400 units) over the five next millennia, the MDC value at
6 ka BP and remained stable (i.e., around 400 units) over the five next millennia, the MDC value at 1
1 ka BP being the lowest MDC value over the last eleven millennia (314 units). Finally, a new increase
ka BP being the lowest MDC value over the last eleven millennia (314 units). Finally, a new increase
in MDC occurred, up to 419 units for the current period. Currently, the calculated fire-season starts
in MDC occurred, up to 419 units for the current period. Currently, the calculated fire-season starts
in June and ends in October, lasting 111 days on average (Table 2). Over the entire Holocene, the
in June and ends in October, lasting 111 days on average (Table 2). Over the entire Holocene, the fire-
fire-season length ranged from 54 to 126 days, with the longest fire-season from 11 to 7 ka BP (from 106
season length ranged from 54 to 126 days, with the longest fire-season from 11 to 7 ka BP (from 106
to 126 days, respectively). As now, during this early Holocene period, the fire-season started in June
to 126 days, respectively). As now, during this early Holocene period, the fire-season started in June
and ended in October. The sharp decrease in fire-season length between 7 and 6 ka BP represented
and ended in October. The sharp decrease in fire-season length between 7 and 6 ka BP represented a
a delayed start (in July), while the length stabilized around 70 days. Afterward, it shortened again
delayed start (in July), while the length stabilized around 70 days. Afterward, it shortened again
between 2 ka BP and 1 ka BP, reaching the shortest duration (64 and 54 days, respectively). At that
between 2 ka BP and 1 ka BP, reaching the shortest duration (64 and 54 days, respectively). At that
time, the fire-season both started later and ended earlier (i.e., from July to September, respectively).
time, the fire-season both started later and ended earlier (i.e., from July to September, respectively).
Fire 2020, 2, x; doi: FOR PEER REVIEW www.mdpi.com/journal/fireFire 2020,Fire
3, 82020, 3, x FOR PEER REVIEW 9 of 22 9 of 23
Figure 4. Changes
Figure in Monthly
4. Changes Drought
in Monthly Code (MDC),
Drought Fire Season
Code (MDC), Length,Length,
Fire Season fire signal
fire(from
signalCHarcoal
(from CHarcoal
Accumulation Rates (CHAR)), vegetation (from pollen composition), and pastoral activities
Accumulation Rates (CHAR)), vegetation (from pollen composition), and pastoral activities (from (from
fungal remains)
fungal remains) during the Holocene. MDC and fire-season length were computed at thescale,
during the Holocene. MDC and fire-season length were computed at the island island scale,
while charcoals, pollen, and fungal remains were extracted from lake sediments. Creno data were
while charcoals, pollen, and fungal remains were extracted from lake sediments. Creno data were
extracted from Leys et al., 2013 [56], Bastani data from Lestienne et al. (2020) [33], and Nino data are
extracted from Leys et al., 2013 [56], Bastani data from Lestienne et al. (2020) [33], and Nino data are
original. BP, Before Present; AP, Arboreal Pollen grains; NAP, Non-Arboreal Pollen grains.
original. BP, Before Present; AP, Arboreal Pollen grains; NAP, Non-Arboreal Pollen grains.
Fire 2020, 2, x; doi: FOR PEER REVIEW www.mdpi.com/journal/fireFire 2020, 3, 8 10 of 22
Table 2. Holocene characteristics in terms of summer fire hazard and fire-season length computed
using HadCMB3-M1 simulation datasets [52].
Fire-Season
ka BP Mean MDC
Starting Ending Length
0 419 11 June 2 October 111
1 314 21 July 15 September 54
2 379 26 July 30 September 64
3 394 22 July 9 October 77
4 365 21 July 1 October 70
5 412 28 July 4 October 66
6 406 23 July 5 October 72
7 482 3 June 9 October 126
8 556 13 June 10 October 117
9 685 18 June 16 October 118
10 628 17 June 10 October 113
11 598 18 June 4 October 106
3.3. Holocene Paleofire and Environmental Changes from Lacustrine Sediment Reconstructions
Over the Holocene, lacustrine sediment cores of Creno [42], Bastani [33], and Nino showed similar
trends of temporal fire signal recorded by charcoals (Figure 4). From the point of view of fire hazard
(i.e., MDC and FSL) and fire signal (charcoal records), we highlight two phases. The first phase lasted
from 11 ka BP to 5 ka BP. During this phase, we observed that changes in both fire signal and fire hazard
values were synchronous: the highest fire signal was observed when both the fire hazard was high
and the fire-season long, and vice versa. The very early Holocene (before 11 ka BP) recorded almost
no fire as compared to later on. This was followed by a period characterized by a strong increase in
the fire signal, which matched with the period of highest fire hazard values. Then, a decrease in both
signals was observed. The second phase spanned over the last five millennia. It was characterized by a
new increase in fire signal after 5 ka BP, such increasing trends not being observed in the fire hazard
and fire-season values, which stayed very low and short, respectively. Even though a decrease was
observed between 3 and 2 ka BP, the fire activity stayed high until currently.
The synthesis of the palynological and fungal remain analyses of Lake Bastani showed that before
11 ka BP, the AP/NAP was low, meaning that the herbaceous taxa were dominant (Figure 4). Then,
the ratio increased and stayed stable until 7 ka BP with the dominance of Pinus sp., followed by Erica sp.
from 9 ka BP. The establishment of Quercus sp. and the increase in Sporormiella sp. have occurred since
7 ka BP, while the first synchronous increase in both crops and ruderals taxa and Sporormiella sp. influx
has occurred since 5 ka BP.
4. Discussion
4.1. The Efficiency of DC and MDC to Target Potential Fire-Days/Months and Assess the Fire-Season Length
Beyond the ability of the FWIs that have been previously demonstrated for several Mediterranean
countries [21,25,26,60–62] to predict the fire hazard on time [63–68], our results suggested their valuable
use, especially the DC index, for detecting current days with or without fires and assessing ranges of
fire sizes larger than 5 ha. The DC, with both its 405 unit threshold and its simplest computation only
relying on precipitation and temperature, appeared to be therefore the best fire index candidate to
monitor the probability of fire occurrences in the Mediterranean region when daily conditions were
available. Moreover, its threshold value allowed both estimating the fire hazard based on the daily DC
values and computing the length of the active fire-season and, in turn, its onset and termination dates.
Our results also showed that when daily conditions were not available (for past or future periods
for which only monthly reconstructions or projections were stored), the MDC index was a very good
surrogate of DC to assess fire hazard for the Mediterranean region. Indeed, the highly significant andFire 2020, 3, 8 11 of 22
strong correlation found between DC and MDC was even higher than that for the boreal region for
which it had been created originally [28], and later on applied [1]. For MDC, a 300 unit threshold was
determined and successfully tested to detect the most fire-prone months. Another way to validate
the use of MDC was the similar length of the fire-season calculated with DC versus MDC (105 versus
111 days, respectively) and the fact that such inferred lengths fit well with the current reported
fire-season length of ~ 100 days observed in the Mediterranean region [26,62].
4.2. Holocene History: From Climatic to Anthropogenic Fires
The early Holocene (11 ka BP) was characterized by the post-glacial recolonization of the woody
vegetation [40,41], well represented by Pinus sp. in our records. The record of many charcoal peaks
(Figure 4) suggested a sustained fire regime in terms of fire frequency and biomass burned. This trend
was observed in the sediments of the three lakes (with a 500 year earlier start for Lake Creno [9]),
suggesting a regional trend. In the same time, MDC was high, which fit well with the dry summer
conditions reconstructed based on fossil chironomid by Samartin et al. for Tuscany (Italy) [69]. The large
amplitude of the values, added to the temperature and precipitation anomalies (Figure A3), illustrated
the accentuated seasonality due to insolation increase [6,69,70]. These results were in line with other
studies, which described the warmer condition of the early Holocene [71–73] and confirmed our
previous hypothesis [33], which stated that climate, adding to the increase in the fuel availability, may
explain Corsican fires between 11 ka BP and 7 ka BP [40,74]. The fire signal recorded was quite similar
between Lake Bastani and Lake Nino during this period, with similar peak values (e.g., 9 and 8 ka BP)
and low values (e.g., 10 ka BP). The similarity existed, but was less obvious for Lake Creno, probably
due to the overall lower charcoal signal recorded for this sequence [9]. This strengthened the idea of
a regional trend dominated by many fire events occurring both in Corsica and elsewhere over the
Mediterranean basin and adjacent regions during the early Holocene [12,75].
The period starting at 7 ka BP highlighted a simultaneous strong decrease in charcoal peaks
(in particular for both Bastani and Creno) and a sharp change in vegetation composition, with the
decrease in Pinus sp. and Erica sp. and the increase in Quercus sp. [40,74]. Such vegetation change was
simultaneous to a strong decrease in the MDC values and the shortening of the fire-season length, likely
due to wetter spring conditions (Figure A3). Such a wetter climate after 7 ka BP has been reported in
several studies [9,40,76], but our results, combined with a high-resolution vegetation record, permitted
highlighting the rapidity of this change and its targeted season, and so, to attribute this major event to
a climatic cause. The stability of charcoal signal, MDC, and fire-season length until 5 ka BP showed
that the ecosystem reached a new equilibrium more adapted to these wetter climate conditions.
A significant increase in Sporormiella sp. spores indicated the presence of large herbivores around
the lake, at least since 5 ka BP. The frequentation of the lake area by livestock seemed to be a plausible
explanation of such dung fungal spores increase. Moreover, these clues of human presence were
followed by an increase in charcoal content for both Bastani and Nino (and a bit earlier at Creno),
which could be interpreted as land use transformation into crops and pastures and the associated
deforestation [77,78]. That was in good accordance with archaeological knowledge. The Chalcolithic
period in Corsica with megaliths and fortified habitats was considered as a population growth
period [79]. The increase in biomass burning reduced the tree proportions and opened the landscape,
as attested by the AP/NAP ratio decrease, particularly marked since 3 ka BP. This forest opening
during the late Holocene has also been observed in Sardinia [80], Iberia [6], and southern France,
including Corsica at Creno [40]. Moreover, our results showed a clear increase in anthropogenic
activities’ indicators such as pollen of ruderal and crop species and a clear increase in pasture indicators
such as Sporormiella. In agreement with other studies [12,80,81], we mainly attributed this opening
(increase in NAP and cultural indicators) and the increase in fire events to human activities (crops and
pasture), also attested on others Mediterranean islands like Sardinia [80], Sicily [82], or Majorca [83].
The stability of a relatively low MDC and a short fire-season were arguments to suggest that the main
driver for fire activity had shifted from climate to humans since 5 ka BP.Fire 2020, 3, 8 12 of 22
A new decrease in MDC occurred between 2 ka BP and 1 ka BP, reaching the lowest values of both
MDC and fire-season length over the Holocene, then followed by a strong increase in grazing indicators
and charcoal peaks still indicating that human activities contributed to increase fire frequency [12].
These human activities, in particular crops and pasture, affected all ecosystems, from the subalpine
pastoralism to the Mediterranean olive groves [33]. Humans have opened more and more the landscape
up to the current Corsican landscape. This period of demographic increase is probably linked to the
strong Tuscan immigration into Corsica around 1 ka BP [79] and has contributed to increased fire
frequency over the last few centuries.
The strong similarities between the three lakes attests to their good quality as paleofire recorders
at a regional scale. Their records have the same early Holocene history, which attests that a common
driver, probably climate, controlled the entire Corsican fire regime. The differences observed after 6 ka
BP should be the results of local events and slightly different human histories occurring everywhere in
Europe from this period [12,75,77,84–86].
4.3. The Current Climate Is Getting Close to the Mid-Holocene Climate Conditions
The early Holocene climate is known to have been dry and warm, with high seasonality (i.e., strong
differences between summer and winter) [71–73,87]. Our results confirmed a climatic shift staged
between 7 ka BP and 5 ka BP. During this transitory period, MDC decreased below 400 units, and the
fire-season became shorter (less than 100 days). However, the most recent value of MDC (corresponding
to the 1979–2016 period) showed an increase, and this increase was associated with a strong increase
in the fire-season length resulting from an earlier onset in June. For the first time since 5 ka BP, the
fire-prone climatic conditions (i.e., MDC combined with the fire-season length) were closer to those
from the early Holocene, and these conditions are favorable for fire ignitions and propagation [8,9].
Moreover, the last few decades were marked by a decline of pastoral activities and an increase in
land abandonment, causing a closure of the environment and fuel accumulation [88,89]. This closure
combined with the global warming, recorded in our results, could promote future uncontrolled fire
episodes [26,90–92].
4.4. Limitations of the Study
The calculation of MDC needs only two variables (temperature and precipitation), and changes in
vegetation or human pressure on ignitions are not considered to assess changes in the overall fire hazard.
However, through its composition, density, and spatial arrangement, vegetation directly influences
the type of fire and its characteristics, e.g., [80,93,94]. Currently, a high fire hazard is correlated to a
fire-day (DC) or a fire-prone month (MDC). However, past vegetation was different and could have
promoted more or fewer fires. A way to improve the robustness of this method should be to test it
in different landscapes with different vegetation. Finally, if we saw that DC was able to discriminate
fire-days and that MDC can discriminate fire-prone months, it is indeed important to understand that
today’s fires are mostly linked to human activity. From this logic, it is likely that the threshold value
chosen on the basis of current data overestimated the fire danger over the oldest periods.
5. Conclusions
In this study, we tested first the efficiency of DC to discriminate fire-days from no-fire-days
over the present (1979–2016 period) and the efficiency of MDC, which is a simplified version of DC,
to discuss climate vs. other fire drivers during the Holocene. MDC was used here for the first time
for both a Mediterranean region (Corsica) and the entire Holocene. Combined with three paleofire
records obtained from sedimentary charcoals’ quantification and the vegetation and human activities’
dynamics reconstructed from pollen and fungal remains, MDC permitted pointing out the drivers of
fire history in Corsica for different periods. Firstly, the dry and warm summer conditions induced
frequent fires and important biomass burning before 7 ka BP. Then, the wetter conditions induced a
decrease in fire frequency, which allowed long-term post-fire succession and, in turn, a closure of theFire 2020, 3, 8 13 of 22
forest. Finally, from 5 ka BP, humans might have been the main driver of vegetation dynamics and
of fire occurrences by deforesting and developing crops and pastures using fire, despite a lower fire
hazard and a shorter fire-season due to wetter and therefore less fire-prone climate conditions.
MDC appeared as a simple, but efficient complementary tool to go back into the past and to
understand the underlying factors of fires by reconstructing the Holocene climate-related fire hazard.
It allowed avoiding the difficulties in acquiring and/or simulating daily data, and it improved our
understanding of wildfire hazard metrics (including fire-season length) at a regional scale. Nevertheless,
it is necessary to be aware of other drivers (i.e., humans and vegetation types) in order to understand the
complexity of fire regime. The modern decrease in pastoral activities associated with land abandonment,
combined with the increase in fire frequency and intensity expected in the next few decades due to
global warming and human density increase, threaten most European landscapes. The current fire
hazard and length of the fire-season are, for the first time for millennia, as high and long, respectively,
as those of the early Holocene period. The next step would be to calculate MDC values from future
climate scenarios in order to assess the future trend of fire hazard.
Author Contributions: Conceptualization, C.H., B.V. and M.L.; methodology, validation, investigation, resources,
writing—review and editing and visualization, M.L., C.H., T.C., I.J.-B. and B.V.; formal analysis and data curation,
M.L., C.H. and I.J.-B.; writing—original draft preparation, M.L.; supervision, B.V. and C.H.; project administration
and funding acquisition, B.V.. All authors have read and agreed to the published version of the manuscript.
Funding: This research was funded by Région Bourgogne Franche-Comté through Chrono-environnement
laboratory, the MSHE (Maison des Sciences de l’Homme et de l’Environnement) Ledoux and the projects ONOMAD
(Optimisation Numérique des Observations Microscopiques), QMedFire (Quantification et modélisation
des régimes des feux méditerranéens), and ENVILEG (Héritage environnemental des grandes transitions
socio-écologiques en Europe) led by Boris Vannière. This study was also supported by the CNRS
PaléoMEx-MISTRALS (Mediterranean Integrated STudies at Regional And Local Scales) program. This study is
part of the PAGES-GPWG (PAst Global changES – Global Paleofire Working Group) activities.
Acknowledgments: We thank the Environmental Office of Corsica, the municipalities of Ghisoni, Corte, and
Casamaccioli, and the Regional Natural Park of Corsica for the lake access permit. We thank also Bérangère Leys
for giving us full access to Lake Creno charcoal data. We thank the 3 anonymous reviewers for contributing to the
improvement of the manuscript.
Conflicts of Interest: The authors declare no conflict of interest.
Fire 2020, 3, x FOR PEER REVIEW 14 of 23
Appendix A
Appendix A
(a) (b) (c)
FigureA1.
Figure A1.Age-depth
Age-depth model
model for
for Bastani
Bastani [33],
[33], Nino,
Nino, and
andCreno
Creno[42]
[42]sequences.
sequences.TheThechronological
chronological
control was based on a combination of (a) 10 (Bastani)/18 (Nino)/11 (Creno) radiocarbon dates
control was based on a combination of (a) 10 (Bastani)/18 (Nino)/11 (Creno) radiocarbon dates obtained
obtained at the Poznan Radiocarbon Laboratory on diverse macro-remains of terrestrial origins
at the Poznan Radiocarbon Laboratory on diverse macro-remains of terrestrial origins (leaves, seeds,
(leaves, seeds, charcoals, and wood). (b) One age estimated for the main late-glacial/early-Holocene
charcoals, and wood). (b) One age estimated for the main late-glacial/early-Holocene transitions
transitions indicated by the pollen stratigraphy and the geochemistry data (Bastani). (c) Two
indicated by the pollen stratigraphy and the geochemistry data (Bastani). (c) Two (Bastani)/seven
(Bastani)/seven (Creno) radiometric markers derived from short-lived radionuclides (210Pb, 137Cs)
(Creno) radiometric markers derived from short-lived radionuclides (210Pb, 137Cs) for the top of the
for the top of the core. Based on these chronological markers, the Clam package (R software, R. Core
core. Based on these chronological markers, the Clam package (R software, R. Core Team, 2018) was
Team, 2018) was used to generate an age depth model within the 95% confidence limits [96].
used to generate an age depth model within the 95% confidence limits [95].Fire 2020, 3, 8 14 of 22
Fire 2020, 3, x FOR PEER REVIEW 15 of 23
Figure A2. The
Figure A2. The high
high spatial
spatial variability
variability in
in terms
terms of
of fire
fire occurrences
occurrences reported
reported since
since 1979
1979 in
in Corsica
Corsica (the
(the
southern
southernregion
regionrecording
recordingmore
morefires than
fires thanthethe
northern
northernpart [10])
part andand
[10]) the the
related distribution
related of the
distribution of DC
the
values for fire-days from the five ERA-Interim pixels covering Corsica.
DC values for fire-days from the five ERA-Interim pixels covering Corsica.
Fire 2020, 2, x; doi: FOR PEER REVIEW www.mdpi.com/journal/fireFire 2020, 3, 8 15 of 22
Fire 2020, 3, x FOR PEER REVIEW 16 of 23
Figure A3. Precipitation
Figure A3. Precipitation and
and temperature
temperature anomalies
anomalies during
during the
the Holocene
Holocene calculated
calculated from the
from the
HadCM3B-M1 dataset [52].
HadCM3B-M1 dataset [52].
Fire 2020, 2, x; doi: FOR PEER REVIEW www.mdpi.com/journal/fireFire 2020, 3, 8x FOR PEER REVIEW 16 of 23
17 22
Figure A4. Fire
Fire weather
weather index calculation scheme [23] and DC computation code.
Daily computation of:
Potential Evapotranspiration (PE):
PE = (0.36 × (T + 2.8) + Lf
where T represents the temperature PE = (0.36
and × (T + 2.8)the
Lf represents + Lf
seasonal adjustment of day length [23].
Daily Humidity index (DH):
where
if T represents
there the(or
is no rain temperature and Lf
rain ≤ 2.8 mm), represents the seasonal adjustment of day length [23].
then:
DailyDRHumidity
= DC0 index (DH):
if thereDC
where is no rain (or rain ≤ 2.8 mm), then:
0 is the DC value for the previous day;
if there is rain (rain > 2.8 mm), then:
DR = DC0
DR = DC0 – 400 × log(1 + 3.937 × RW/SMI)
where
where RW
DC0 is theisDC
the value
rain and
for SMI is the humidity
the previous day; index for the previous day.
Finally, Daily
if there is rain DC
(rain(DC)
> 2.8= mm),
DH + then:
PE.
DR = DC0 - 400 × log(1 + 3.937 × RW/SMI)
where RW is the rain and SMI is the humidity index for the previous day.
Finally, Daily DC (DC) = DH + PE.
Fire 2020, 2, x; doi: FOR PEER REVIEW www.mdpi.com/journal/fireFire 2020, 3, 8 17 of 22
Fire 2020, 3, x FOR PEER REVIEW 18 of 23
Fire 2020, 3, x FOR PEER REVIEW 18 of 23
Figure
Figure A5.A5. ComparisonofofFire
Comparison FireWeather
WeatherIndexes
Indexes (FWIs)
(FWIs) as
as aaa function
functionofoffire-day
fire-daystatus (YES
status with
(YES firefire
with
Figure A5. Comparison of Fire Weather Indexes (FWIs) as function of fire-day status (YES with fire
reported,
reported, NO NO withoutfire
without firereported).
reported).p-values are <
p-values are < 0.001***
0.001*** for
forall
allindexes
indexes (t-test with
(t-test resampling
with resamplingto to
reported, NO without fire reported). p-values are < 0.001*** for all indexes (t-test with resampling to
have
have groups
groups with
with the
the samesize).
same size).
have groups with the same size).
Figure
Figure A6.A6. Relationshipbetween
Relationship betweenMDCMDC andand total
total burned
burned area
area(a)
(a)ororthe
thenumber
numberofoffires
fires(b)(b)
between
between
April
April andand October
October over
over the
the 1979–2016
1979–2016 period.
period. Each
Each trend was
trend wascalculated
calculatedusing the
using LOESS
the LOESSmethod. In
method.
Figure A6. Relationship between MDC and total burned area (a) or the number of fires (b) between
both
In both panels,
panels, the red
the over line
red line represents the most fire-prone months (fourth quartile), while the green line
April and October therepresents
1979–2016the mostEach
period. fire-prone
trendmonths (fourth quartile),
was calculated using thewhile
LOESS themethod.
green line
In
points
points to to
thethe correspondingMDC
corresponding MDCvalue.
value. These
These “local
“local threshold
threshold values”
values” corresponding
corresponding toto
the most
the most
both panels, the red line represents the most fire-prone months (fourth quartile), while the green line
fire-prone months were 265 and 354 (for burned area and number of fires, respectively), averaging
fire-prone
points months
to the were 265 MDC
corresponding and 354 (for burned
value. These area and
“local number
threshold of fires,
values” respectively),toaveraging
corresponding the most
310 units, which is very close to the 300 unit threshold value estimated from DC.
310 units, which is very close to the 300 unit threshold value estimated from DC.
fire-prone months were 265 and 354 (for burned area and number of fires, respectively), averaging
310 units, which is very close to the 300 unit threshold value estimated from DC.
References
1. Bürger, G. Evaluation of the Monthly Drought Code as a Metric for Fire Weather in a Region of Complex Terrain and
Un-Certainties in Future Projections; Pacific Climate Impacts Consortium: Victoria, BC, Canada, 2013.
2. Pausas, J.G.; Llovet, J.; Rodrigo, A.; Vallejo, R. Are wildfires a disaster in the Mediterranean basin?—A review.
Int. J. Wildland Fire 2009, 17, 713–723. [CrossRef]
Fire 2020, 2, x; doi: FOR PEER REVIEW www.mdpi.com/journal/fire
Fire 2020, 2, x; doi: FOR PEER REVIEW www.mdpi.com/journal/fireYou can also read