Citizens' Involvement in E-Government in the European Union: The Rising Importance of the Digital Skills - MDPI
←
→
Page content transcription
If your browser does not render page correctly, please read the page content below
sustainability

Article
Citizens’ Involvement in E-Government in the
European Union: The Rising Importance of the
Digital Skills
Luisa Fernanda Rodriguez-Hevía 1 , Julio Navío-Marco 2, *           and Luis Manuel Ruiz-Gómez 2
 1    Department of Business Economy, Alfonso X el Sabio University, 28016 Madrid, Spain; lfrhevia@uax.es
 2    Department of Management & Business Organization, UNED, 28040 Madrid, Spain; lmruiz@cee.uned.es
 *    Correspondence: jnavio@cee.uned.es

 Received: 17 July 2020; Accepted: 16 August 2020; Published: 21 August 2020

 Abstract: This paper studies what factors influence European citizens in their e-government adoption
 and use, and whether there are differences within the European Union. A binary logistic regression
 model has been used to determine the profile of e-government users. The article highlights especially
 the influence of digital skills, as an increasingly influential factor, and opens up new areas of research
 such as the uses of e-government depending on the population density or sociodemographic factors.
 Given a certain lack of e-government studies at a pan-European level, this article provides an empirical
 comparative analysis in the EU and provides insights into the factors influencing the behaviour of
 European e-citizens.

 Keywords: e-government; European Union; e-citizen; digital skills; digital society; ICT adoption

1. Introduction
       The introduction of information and communication technologies (ICTs) into government has
significantly transformed the way public administrations interact with their citizens and has led to the
development of a global phenomenon called electronic government or e-government. This is defined
as the delivery of government information and services to citizens via the Internet or other digital
means [1–3] and currently is a very relevant aspect of governance [4].
       The e-government combines government use of ICTs with organisational change to improve
its structures and functioning [5] and currently is getting a lot of interest in public administration
studies [6]. This new electronic government involves technological changes but also new styles of
leadership, new decision-making processes, different ways of organising and delivering services,
and new concepts of citizenship [7].
       A growing corpus of literature has been analysing the impact of ICTs on the public sector from
multiple perspectives, as reflected in extensive bibliographical reviews and meta-analyses covering
definitions, scope, methods and recommendations (e.g., [8]), citizen orientation and adoption [9,10],
stage models [11], diffusion [12,13], and the quality of these services [14]. The literature is flourishing,
but [15] point out in their meta-analysis of empirical e-government research that in the literature there
is still a shortage of authoritative quantitative empirical approaches and the topic is still perceived as a
young field of research.
       The e-government is intended to offer new possibilities and advantages for various groups of
stakeholders, such as government agencies (G2G), citizens (G2C), and business organisations (G2B),
according to [16]. Digital interaction with citizens is a particularly complex challenge as population
behaviour can vary over time [17]. Margetts and Dunleavy [18] introduced the concept of digital era
governance and, proposing new challenges for public sector governance, among others, citizen-oriented

Sustainability 2020, 12, 6807; doi:10.3390/su12176807                      www.mdpi.com/journal/sustainability
Sustainability 2020, 12, 6807 2 of 19
government. Recently, trying to evaluate whether e-government performance boosts citizen use, [19]
argued that the effect of national e-government performance may differ among various social groups,
and suggested that the moderating effects of demographic and socio-economic variables should
continue to be tested in future research. There is a need to adopt a social-contextual perspective.
The citizen and the digital citizen’s capabilities matter.
In this context, our investigation considers the following research questions: What factors
influence European citizens in their e-government adoption and use? What is the influence of digital
skills in its adoption? We need to understand the impact of citizen behaviour and characteristics on
e-government activities. In this sense, our contribution is mainly twofold: firstly, we develop the
e-government literature through this empirical comparative analysis at the European level, increasing
the understanding of the European e-citizen; secondly, we provide a theoretical contribution behind the
behaviour of e-citizens in the EU, highlighting especially the influence of their digital skills, together
with personal characteristics and the environment.
Furthermore, very little research delves into the spatial implications of the digital profile of
European citizens, considering Europe in a comprehensive manner [20]. Comparing with other
big geographies, such as Australia [21,22], Canada [23], and China [24], the shortage of studies at
a pan-European level is more evident [19,25,26].
This study consists of five sections. After the introduction, Section 2 reviews the theoretical
framework associated with our analysis of the e-citizen. Section 3 presents the empirical analysis
and discussion concerning the behaviour of e-government users within Europe depending on their
adoption levels. Finally, Sections 4 and 5 contain a discussion about the findings, the conclusions
reached in the document, the limitations, and the future avenues of research.
2. Literature Review
2.1. Conceptual Models for E-Government
In the literature, there was a significant growth in the number of papers using the term
e-government around 2001 [8], when two relevant pieces of research were published: Layne and
Lee [27] and Fountain [28]. Since then, a large number of mechanisms and indexes have been developed
to measure and compare progress with e-government [11]. The early e-government literature adopted
practitioner-led models largely based on Nolan’s stage growth model, hypothesising development
from online information [29] and the literature is fertile in terms of models classifying e-government
development into measurable stages [16,27,30,31].
In a meta-analysis, [11] reviewed and analysed twelve stage models found in the literature
between 2000 and 2009. Accordingly, he defined the underlying approaches and concepts in order
to identify the common frame of reference across the different models. The resulting common frame
includes the stages, from a citizen perspective, consisting of interaction, transaction, participation,
and involvement [11]; Janowski [32] considered that the concept evolves toward more complexity and
greater contextualisation and specialisation. To this end, this author presented a four-stage evolution
model comprising digitisation (technology in government), transformation (electronic government),
engagement (electronic governance), and contextualisation (policy-driven electronic governance)
stages. Looking for a unified view, Rana et al. [2] considered that e-government services can be
broadly categorised as either informational (delivery of government information) or transactional
(two-way transactions). Despite their uses, e-government maturity models acquired criticism from
several researchers, as none of the models were universal. The success of e-governments should not be
measured merely based on the sophistication of the technology used by the government, but instead
should also consider whether or not the services offered are being used by the stakeholder [33].
With the increasing interest in the effective achievement of sustainable development goals,
it is clearer that the current models do not suffice in its role in guiding the future development of
e-government [34]. These authors consider, after a careful review of approximately fifty models, that,Sustainability 2020, 12, 6807 3 of 19
as a finite model assumes that there is an ultimate state, its use is not appropriate in the context of
continuously evolving phenomena, such as e-government. In this regard, the new model becomes a
reference model rather than a concrete finite state model.
Finally, despite that the word sustainability has been loosely used to define the efficiency that
a government could achieve in e-government services [35], there is a growing interest in linking
the effectiveness of e-government with environmental sustainability [36], and fertile research can be
found for local governments [37,38]. Estevez and Janowski [39] also emphasised the role of electronic
governance for sustainable development, proposing a conceptual framework. In any case, strong
theoretical studies for environmental sustainability in electronic government are still required to produce
more knowledge and theories that can be generalised and utilised in different research contexts [40].
2.2. Factors for Citizens’ Digital Adoption of E-Government
The literature offers helpful links between the theoretical corpus used to address the behavioural
determinants associated with the adoption and use of e-government and the well-grounded theories
about customer behaviour and user acceptance [41–44]. The technology acceptance model (TAM) has
been subject to subsequent theoretical development [45], especially the unified theory of acceptance
and use of technology (UTAUT). These theories have received substantial empirical support and,
adopting this approach, significant research on e-government adoption has applied these models
or combinations of them (e.g., [46–51]) to examine the factors influencing the speed of adoption of
e-government systems or the reluctance of users to adopt them [2,52].
The behaviour associated with e-government services is influenced by socio-demographic
characteristics, as reported in previous studies. In this sense, the extant literature provides evidence on
the relationship between e-government adoption, demographics, and socio-economic variables such as
age, education, income, employment status, marital status, or trust in government [53–57], but the
results are not entirely conclusive. [58] recently investigated the impact of demographic factors on the
adoption of e-government services. Their results indicate that gender was significant in moderating
the positive impact of both perceived usefulness and perceived ease of use on the willingness to use
e-government services. In this study, age and education, however, were not significant in moderating
the impact of perceived usefulness and perceived ease of use on the adoption of e-government services.
According to Akman et al. [59], the use of e-government content and services is pervasive and closely
linked to gender and education level. Age was found to be negatively correlated with intention to use
e-government services among Jordanian citizens [60]. Szopiński and Staniewski [61] showed that there is
a statistically significant relationship between the status of the respondent’s residence and the propensity
to use particular forms of e-government. Unemployment was negatively and significantly related to
general e-government use, suggesting unemployed respondents were less likely to use e-government
features [19], although they were in need of government help (e.g., job training and matching).
The literature also indicates that a lack of broadband connectivity is also a limiting factor for using
e-government [62,63]. Broad bandwidth and, in general, proper connectivity are critical for allowing
the transmission of digital information at high bandwidths. In most rural areas, low population density
and high deployment costs discourage private investments, creating a negative feedback of limited
capacity, high prices, and low service demand [64]. Deploying connections in areas with low population
density makes these rural areas high-cost markets with little opportunity to achieve economies of scale
or obtain a return on investment [65], and makes difficult the usage of e-government. GDP per capita
and ICT infrastructure are significantly associated with rising e-government maturity over time [66].
According to Bélanger and Carter [53], skills are an important determinant in the take-up of
e-government, as one’s ability to effectively use the Internet has a significant impact on intentions to
use e-government. It has furthermore corroborated in the literature [67,68]; Mensah and Mi [58] that
computer self-efficiency has a direct impact on intention to use e-government services. Less research
is found about the digital competences (Digital competences cover information management,
collaboration, communication and sharing, creation of content and knowledge, ethics and responsibility,Sustainability
Sustainability 2020,
2020, 12, 12,
6807x FOR PEER REVIEW 4 of 1919
4 of
collaboration, communication and sharing, creation of content and knowledge, ethics and
responsibility,
evaluation evaluation
and problem and and
solving, problem solving,
technical and technical
operations related operations
to ICTs ([69]related to ICTs ([69]
for a systematic for a
literature
systematic
review.) literature
of users, suchreview.) of users, such
as information as information
navigation skills andnavigation
mobileskills
skillsand mobile
[70] skills [70] that
or conditions or
conditions that influence citizens’ perceptions, trust, and risk [71]. Citizens without
influence citizens’ perceptions, trust, and risk [71]. Citizens without the appropriate skills, for instance,the appropriate
skills,
limit theirfor instance,
ability to uselimit their ability to
e-government foruse e-government
information for information
retrieval retrieval
[72]. Lindgren [72].
et al. [73]Lindgren
insist in et
the
al. [73] insist in the need for new research on the actors and skills that are central
need for new research on the actors and skills that are central for digital public encounters, since for digital public
there
encounters, since there is a gap between the actual and potential usage of e-government skills [70].
is a gap between the actual and potential usage of e-government skills [70]. As the citizen–government
As the citizen–government interaction models are becoming more complex in the digital world (from
interaction models are becoming more complex in the digital world (from a mere search for information
a mere search for information to more transactional and participatory models), we can foresee that
to more transactional and participatory models), we can foresee that digital competencies will have a
digital competencies will have a greater weight in their adoption even compared to socioeconomic
greater weight in their adoption even compared to socioeconomic factors that affect the citizen.
factors that affect the citizen.
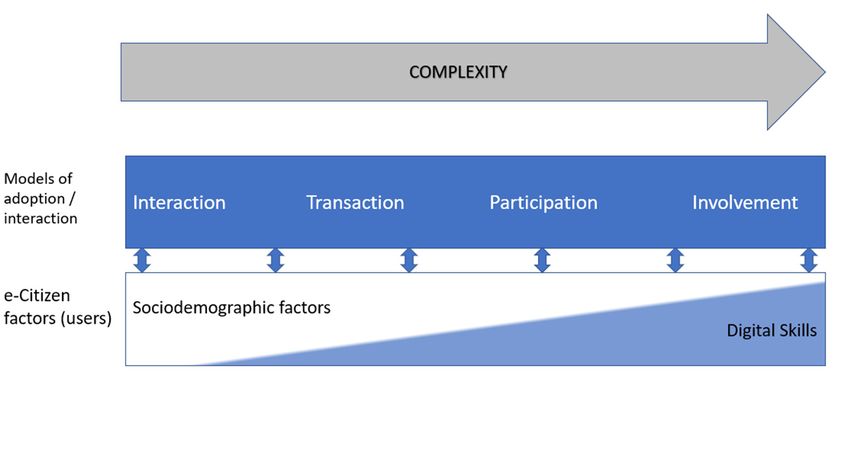
Consequently,
Consequently, wewehypothesised
hypothesisedthatthatthe
thedigital
digitalskills
skills and
and the
the subsequent inequalitieswill
subsequent inequalities willhave
have
stronger
strongerandandmore
more significant impacts
significant impactsininmore
morecomplex
complextypestypes of
of interactions. Thisevolution
interactions. This evolutionisisabout
about
schematising in Figure
schematising in Figure 1. 1.
Figure 1. Growing importance of digital skills in complex models of adoption. Source: own elaboration.
Following [11], we propose a continuous evolution, not in phases, because as has been indicated,
it would Figure 1. Growing
not properly importance
include of digital
all the nuances skills
of in
thecomplex models ofasadoption.
e-government, Source: own
a continuously evolving
elaboration.
phenomenon. In this continuum, as the complexity and interactivity of the electronic government
system increases, digital skills become more relevant compared to other factors.
Following [11], we propose a continuous evolution, not in phases, because as has been indicated,
it would
3. Methodology not properly
and Datainclude all the nuances of the e-government, as a continuously evolving
phenomenon. In this continuum, as the complexity and interactivity of the electronic government
To carry
system out thedigital
increases, study, skills
we have worked
become more with the data
relevant from the
compared tosurvey “EU survey on ITC usage in
other factors.
households and by individuals 2016” (Eurostat Model Questionnaire Version 3.1.), last wave available
when closing this investigation.
3. Methodology and Data This survey is carried out on an annual basis.
The purpose is to study the users’ characteristics who used e-government in the three months
To carry out the study, we have worked with the data from the survey “EU survey on ITC usage
prior
in to conducting
households andthisbysurvey. For this
individuals reason,
2016” we work
(Eurostat Modelwith those individuals
Questionnaire Versionwho have
3.1.), lastused
wavethe
Internet in the
available lastclosing
when three months. This group
this investigation. consists
This surveyofis154,149
carried individuals.
out on an annual basis.
A binary logistic regression model has been used to determine
The purpose is to study the users’ characteristics who used e-government the profile ofine-government
the three months users,
since
prior to conducting this survey. For this reason, we work with those individuals who have used theof
it allows us to explain or predict the characteristic of a dichotomous event based on a set
variables
Internet considered
in the last as influential
three months. [74].
This group consists of 154,149 individuals.
One A of the purposes
binary is to establish
logistic regression modelwhether
has beenthe user
used profiles are
to determine thedifferent
profile ofdepending
e-government on the way
users,
theysince
make use of e-government.
it allows us to explain orThe uses the
predict considered are the
characteristic of use of e-government
a dichotomous event to find on
based information
a set of
on variables
the website, considered as influential
to download forms[74].
and to deliver completed forms. In this sense, three logistic
regression Onemodels
of the purposes
have been is to establish
carried out,whether
each with the a
user profilesvariable
different are different
to bedepending
explained,on the way
namely the
they make use of e-government. The uses considered are the use of e-government
three different uses indicated above: information from the website, downloading forms, and delivering to find information
on the website,
completed forms. This to download
way we can forms and the
observe to deliver
evolutioncompleted
to more forms.
complex In models
this sense, three logistic
of interaction with
regression
digital public models
services,have been carriedinout,
as established the each with a framework.
theoretical different variable to be explained, namely the
To perform the calculations for the three regression models, SPSS v.24 has been used. To perform
these logistic regressions and prevent the size of the sample affecting the statistical significance of theSustainability 2020, 12, 6807 5 of 19
variables, a 10% sample has been selected by means of simple random sampling, so 15,434 cases have
been used. For the fraction of the sample with which we are working, as can be seen in Table 1, the most
common use of electronic government is the search for information, with almost 59% compared to
downloading forms and filing complex forms, with 34.3% and 34.6%, respectively.
Table 1. Distribution for use of e-government.
If You Use Does Not Use
Use of E-Government
Frequency Percentage Frequency Percentage
Website information 7839 50.8% 7592 49.2%
Download forms 5300 34.3% 10,130 65.6%
Completed forms 5182 33.6% 10,249 66.4%
Source: own research using the “European Union survey on ICT usage in households and by individuals 2016”.
The coding has been carried out by Eurostat and corresponds directly to the different uses of
electronic government that have been established in the survey, where individuals had to mark whether
they had used them. The data come from the survey question: “Did you contact or interact with public
authorities or public services over the Internet for private purposes in the last 12 months for the following
activities?”, giving the possibility of marking the three uses that they are studying (obtaining information
from websites, downloading official forms, and submitting completed forms). The three dependent
variables will take the value 1 if the individual has made use of e-government, and zero otherwise.
Among the multiple variables included in the survey, the variables that could explain the use of
e-government are grouped into socio-demographic aspects, user digital skills, and type of Internet
connection, to assess its preeminence as it has been hypothesised in the theoretical framework.
The different explanatory variables and their forms are described in Table 2. In those variables where
there are more than two categories, the reference category has been determined as the one with the
least connection of e-government uses.
Table 2. Explanatory variables and forms.
Variables Reference Category Other Categories
Average density
Population density Low density
High density
In transition
Development of the region Less developed
More developed
Not in the labour force (students, Employee or self-employed
Employment
retired, military service, etc.) Unemployed
Socio-demographic
Primary Secondary
Level of education
HigherSustainability 2020, 12, 6807 6 of 19
The distribution of the different variables in the sample fraction is shown in Table 3.
Table 3. Distribution of socio-demographic variables by categories.
Variables Category Frequency PercentageSustainability 2020, 12, 6807 7 of 19
Table 4. Results of the logistic regression for the search for information in e-government websites.
95% C.I. Para EXP(B)
Exp(B) p-Value
Inferior Superior
Population density
Low density * 0.000
Average density (1) 1.100 1.002 1.208 0.044
High density (2) 0.875 0.795 0.964 0.007
Development of the region
Less developed * 0.000
In transition (1) 1.188 1.041 1.356 0.011
More developed (2) 1.359 1.251 1.477 0.000
Employment
Not in the labour force * 0.001
Employee or self-employed (1) 1.213 1.094 1.345 0.000
Unemployed (2) 1.144 0.969 1.350 0.112
Level of education
Primary * 0.000
Secondary (1) 1.146 1.029 1.276 0.013
Higher (2) 1.713 1.516 1.935 0.000
Age
Between 25 and 44 * 0.000Sustainability 2020, 12, 6807 8 of 19
3.2. Results of the Estimation for the Use of E-Government to Download Forms
The dependent variable in the logistic regression is the use of e-government to download forms.
This variable takes the value one when the individual has used this service in the three months prior
to the survey date, and zero otherwise. A total of 34.3% of the individuals in the sample fraction
have downloaded official forms compared to 65.6% who stated that they have not made this use of
electronic government. We have worked with 15,276 valid cases with goodness of fit measures of 22%
for Cox and Snell’s R-square, 30.6% for Nagelkerke’s R-square, and Hosmer and Lemeshow values of
0.412. With this model, it is possible to correctly classify 73% of the total number of cases, correctly
classifying 52.2% of the users who use e-government to download forms, and 83.6% of those who do
not. The results are shown in Table 5.
Table 5. Results of the logistic regression for the downloading of forms.
95% C.I. Para EXP(B)
Exp(B) p Value
Lower Superior
Population density
Low density * 0.000
Average density (1) 1.102 1.002 1.212 0.044
High density (2) 0.846 0.766 0.936 0.001
Development of the region
Less developed * 0.000
In transition (1) 1.377 1.202 1.577 0.000
More developed (2) 1.695 1.555 1.847 0.000
Employment
Not in the labour force * 0.015
Employee or self-employed (1) 1.168 1.047 1.302 0.005
Unemployed (2) 1.194 1.000 1.426 0.050
Level of education
Primary * 0.000
Secondary (1) 1.308 1.160 1.474 0.000
Higher (2) 2.168 1.906 2.466 0.000
Age
Between 25 and 44 * 0.000Sustainability 2020, 12, 6807 9 of 19
Table 5. Cont.
95% C.I. Para EXP(B)
Exp(B) p Value
Lower Superior
Internet connection
Internet connection outside the home (yes) 1.286 1.167 1.417 0.000
Mobile broadband (yes) 1.202 1.109 1.301 0.000
Internet broadband at home (yes) 1.343 1.189 1.518 0.000
Constant 0.009 0.000
Number of cases 15.276
Cox and Snell’s pseudo R2 0.221
Nakelkerke’s pseudo R2 0.306
Cut-off point 0.5
% of cases correctly classified 73
Hosmer and Lemeshow test 0.412
* Reference category. Source: own research using the “European Union survey on ICT usage in households and by
individuals 2016”.
As in the previous regression, the unemployed category remains statistically insignificant and the
sex variable joins this, so being male or female does not influence the downloading of documents on
government websites.
In terms of population density, as in the previous case, moving from a low to a high density level
means that the probability is reduced by 16.4%, while moving from a low to a medium density does
result in an increase in the probability, compared to the decrease seen for areas of greater density.
In regions with the greatest economic development, the probability of downloading forms is
1.6 times higher than compared to those that are less developed.
At higher levels of education, the probability of this use of e-government is doubled and it
decreases by 40% for those under 25 years of age.
Connecting to the Internet at home and mobile broadband also increases the probability.
The highest score is presented by accessing e-government using Internet broadband at home.
3.3. Results of the Estimation for the Use of E-Government for the Delivery of Completed Forms
The dependent variable in the logistic regression is the use of e-government to deliver completed
forms. This variable takes the value one when the individual has used this service in the three months
prior to the survey date, and zero otherwise. The percentage of citizens who submitted complete forms
online is 33.6% in the fraction of the sample who declared that they have used electronic government
to submit completed forms, compared to 66.4% who have not completed this procedure electronically.
We have worked with 15,227 valid cases with goodness of fit measures of 19% for Cox and Snell’s
R-square, 26% for Nagelkerke’s R-square, and Hosmer and Lemeshow values of 0.109. With this model,
it is possible to correctly classify 72.7% of the total number of cases, correctly classifying 47% of the
users who use e-government to download forms, and 86% of those who do not (Table 6).
In this case, the variables that are not statistically significant are sex, the average population
density category, being unemployed, and having secondary education.
Having higher levels of education compared to primary school studies makes it 1.9 times more
likely that people will deliver forms electronically.
Regarding Internet connections, both outside the main residence and inside it, the probability
increases compared to not using these connections. Here, being connected to the Internet outside the
home results in a probability 1.5 higher than that for delivering forms over the Internet among those
who have not connected in this way.Sustainability 2020, 12, 6807 10 of 19
Table 6. Results of the logistic regression for the delivery of completed forms.
95% C.I. for
Exp(B) Lower Superior p Value
Population density
Low density * 0.000
Average density (1) 0.968 0.882 1.063 0.499
High density (2) 0.722 0.654 0.798 0.000
Development of the region
Less developed * 0.000
In transition (1) 1.230 1.076 1.406 0.002
More developed (2) 1.411 1.296 1.535 0.000
Employment
Not in the labour force * 0.000
Employee or self-employed (1) 1.299 1.166 1.447 0.000
Unemployed (2) 1.162 0.974 1.386 0.095
Level of education
Primary* 0.000
Secondary (1) 1.118 0.994 1.257 0.062
Higher (2) 1.871 1.650 2.121 0.000
Age
Between 25 and 44 * 0.000Sustainability 2020, 12, 6807 11 of 19
4. Discussion
Comparing the results of the logistic regression carried out for each of the uses of e-government
analysed, Table 7 shows both the effects it has on the probability of performing this use as well
as the importance of the weights of each of the explanatory variables on the dependent variable.
The variables included in these comparisons are those that are statistically significant in all or some of
the categories considered.
Table 7. Comparison of the results of the logistic regression for each use of e-government.
Website Information Download Forms Completed Forms
Exp(B) Rank * Exp(B) Rank Exp(B) Rank
Population density
Low density *
Medium Density (1) 1.100 11th 1.102 11th
High density (2) 0.875 0.846 0.722 11th
Development of the region
Less developed *
In transition (1) 1.188 1.377 1.230
More developed (2) 1.359 6th 1.695 5th 1.411 7th
Employment
Not in the labour force *
Employee or self-employed (1) 1.213 8th 1.168 10th 1.299 8th
Unemployed (2) 1.162
Level of education
Primary *
Secondary (1) 1.146 1.308
Higher (2) 1.713 4th 2.168 2nd 1.871 3rd
Age
Between 25 and 44 *Sustainability 2020, 12, 6807 12 of 19
skills are twice as likely to use government websites to search for information, while software skills
make them 1.56 times more likely to do this. In terms of e-government to download forms, this use is
higher if people have superior digital skill levels as opposed to having no skills or basic levels. In this
case, the variable with the greatest influence compared to its corresponding reference category for
downloading forms is to have a superior level of digital skills in the search for information, since those
individuals who possess it are six times more likely to make this use than those who have no skills or a
basic level. Continuing with digital skills, the rest of the probabilities increase as the skill level grows,
so having a superior level of digital skills in software or problem solving means that the probability of
downloading documents is practically twice as high as it is for those who do not have any skills or
basic skills in this regard. Finally, obtaining a superior skill level in information triples the probability
of delivering completed forms on government websites. When delivering completed forms, it is the
variable with the greatest influence compared to having no skills or basic skills, while with problem
solving the probability is doubled and for software skills it is multiplied by 1.7.
A ranking has been established for the weight of each explanatory variable in the increase in
the probability of the different uses of e-government being studied. This weight is understood as
those variables with more variability (distance) with respect to the reference category. That is to say,
they lead to a greater increase in the probability with respect to the different uses of e-government.
For those variables that have more than one category, only the one with the highest odd ratio EXP (B)
has been selected.
The variable that leads to the greatest increase in the probability of carrying out the three uses
is having a superior skill level in the search for information, but it can be seen that it becomes more
complicated depending on the use, with the marginal value decreasing from 16.5 in the first regression
to 3.08 in the third. The other digital skills also show high figures in the three uses of e- government,
being among the top five except in the case of communication skills. In this sense, the problem solving
skill exceeds the ability to use software for handling content in the search for information and in the
delivery of completed forms, but it should be noted that, for the use of downloading forms, the increase
in probability with respect to the reference category is very similar for the problem solving skill and
the software skill, although the weight moves to fourth position.
For all uses, as the level of education increases, the probability of being a user of e-government
increases. Having secondary education influences the use except when delivering completed documents.
In the case of downloading documents, higher education levels double the probability of this use of the
Internet compared to primary education. Education is one of the variables that are within the top five
positions in the established ranking, being the fourth for the use of electronic government in information
and for the download of documents and delivery of complete forms, reaches the second and third
position, respectively. Age is another of the influential variables when it comes to using e-government.
Individuals who are 65 years of age or older see their probabilities increased, compared to the reference
category, for the respective uses by values that range from 1.4 times (download forms) to almost
1.8 times (search for information). For the use of searching for government information, this category
occupies third place in the ranking of the weights of all variables. In the case of users under 25 years of
age, the probabilities decrease by between 38% (delivery of forms) and 54% (downloading of forms).
For the delivery of completed forms, age reaches fifth place in importance, and for the downloading of
forms, it reaches sixth place. The results are consistent will previous studies, such as [75] that found
that age along with gender and education were significant in influencing citizens’ intentions to adopt
and use e-government services (in the United Kingdom).
Living in more developed regions similarly increases the use of e-government in all regions,
although for the downloading of documents, it is within the five with the highest weight, but for the
rest of the uses, it is positioned in sixth and seventh. The same happens with employment status,
which has a similar increase in the three uses, moving to unremarkable places in the classification.
Therefore, being an employee or self-employed leads to similar probability increases in the three uses
and the unemployed category only influences the delivery of completed forms.Sustainability 2020, 12, 6807 13 of 19
There are no significant differences in terms of the sex variable in relation to the use for forms,
both downloading and delivering these, and only in the case of information search is this variable
statistically significant, but with a low impact on the increase in probability and occupying values that
are distant in terms of the importance of the weights of the variables.
The type of Internet connection of the users increases the probability of the three uses in a similar
way, with connection outside the home generally occupying a higher position in terms of weights.
Regarding the population density where the habitual place of residence is found, the average
density affects the search for information and the downloading of forms, but with a very low probability
increase compared to low-density regions. This is the variable that for all uses occupies last place in the
classification. However, for the delivery of completed forms, only high density has an influence. For all
the uses of e-government, in the three cases analysed there is a reduction in probability for high-density
regions, of between 28% (delivery of forms) and 13% (search for information on government websites).
The low influence of population density is consistent with the fact that very low populated parts of the
EU, such as Estonia and Scandinavia, are leading the process of digitalisation of public services. There
are also opposite examples, such as the Netherlands. The results open a clear area of future research to
delve into this question.
5. Conclusions
This research area undoubtedly was, and still is, timely and fascinating: it is a well-known fact
that the way the public sector relates to citizens has undergone a drastic transformation since the 1980s
with the arrival of information and communication technologies (ICTs), and especially since the late
1990s with the advent of the Internet. Quantitative empirical e-government research still reflects a
growing, open-ended field that provides many opportunities for investigation [9,15].
The results highlight the importance of the four digital skills analysed in all types of e-government
usage. Having performed previous e-government activities (simpler ones, such as obtaining
information) is the most important factor. Our results are in line with other models on e-service
adoption developed by [76], which stress the importance of learning and previous visits for further
usage. E-government is becoming mandatory in many countries, as part of the transformation of public
services, and citizens are thus forced to interact with the government using these applications [77–79],
so the development of digital skills is increasingly important.
The study has highlighted the differences in behavioural patterns in Europe according to economic
development. This leads to an interesting reflection: a degree of divergence in behaviour can be found
at the EU level, conducting, therefore, inequalities among citizens. This fact may point to a certain
digital divide within the EU as far as e-government services are concerned. There is a need to focus
the attention of the EU authorities and policymakers to avoid the degree of economic development of
the regions influencing the degree to which e-government services are used, resulting in inequalities
between European citizens. Now in Europe, the beginning of the EU programming period 2021–2027
represents a good opportunity to delve into the territorial cohesion policies, and particularly in the
field of digital public policies. If utilised properly, these digital tools can improve services to citizens,
smooth administrative processes, and enhance democracy [80], avoiding any kind of digital divide.
Age, connectivity, and especially acquiring digital skills are all factors that have effects that vary
from one use of e-government to another. It has been pointed out that senior citizens have received little
attention in the e-government literature and that different generations of e-citizens behave in different
ways [81], provoking a digital divide. This could be also related to an impairment in the cognitive,
sensory, and motor functions of older people that may make IT use difficult and limit computer literacy
(skills) in relation to digital services [82]. The increasing interest in e-government use by elderly people
is a relevant finding, since little research has been done into the growing adoption of digital services
by the senior market in Europe [83]. Our results confirm the changing trend: among senior citizens,
there is a dynamic of change and a proactive attitude with respect to the use of e-government, recentlySustainability 2020, 12, 6807 14 of 19
observed [84,85]. Additionally, it seems that minor training has a positive effect on digital inclusion for
elderly citizens and that the effects seem more or less permanent also from a longer perspective [82].
In the study of the digital divide, recent conceptualisations appear to be moving away from
a traditional emphasis on the technological gap, and particularly, the connectivity gap ([86], for a
systematic literature review). During the first decade of the twenty-first century, the preliminary
understanding of the “digital divide” concept evolved to include users’ skills and usage gaps. All groups
must be supported in their transition to the world or digital. The rhetoric of “digital natives”, far from
being useful, is often a distraction to understanding the challenges in a networked world [87].
The e-government and digital divide research are intrinsically intertwined as e-government
policies can be both impeded by and exacerbate the digital divide [70,88]. However, though many
citizens have access to the Internet, this does not automatically mean a high uptake of e-government
use. Our findings, similar to [70], indicate that instead of an access divide, a skills divide is much more
relevant. Digital literacy appears to be the most critical factor for e-government uptake as a whole.
As argued by [89], digital literacy policies seem to be really cost-effective initiatives for increasing the
uptake of e-governmental services, taking into consideration not only their pervasiveness in all types of
interactions. Educational programmes will be necessary [90], and taking a more decided citizen-centric
approach is required to increase uptake of e-government [91], as these digital technologies create
environments that affect the citizens using them [92].
Inequalities in digital skills will not automatically disappear in the future, even in countries with
high Internet diffusion levels, unless clearly targeted interventions are implemented [93]. The results
invite one to suggest to institutions and policy makers a greater effort to consider a sociodemographic
perspective, adopt a target groups strategy (for example, promoting training, and support for
elderly people and other digitally vulnerable groups, as suggested by [94]), or go further with
the mere technological skills, for example, encouraging the practice of problem solving or critical
thinking. It is recommended to enhance skills related to critical thought, skills in the cognitive and
ethical areas, and also the productive skills to promote a critical approach to media production,
sharing, and consumption [92,95,96]. On the other hand, the influence of population density, linking
e-government to population concentration, is an interesting topic for further investigation.
Our study is one of the first to conduct a pan-European analysis using the most recent data, as this
survey wave has recently become available, distancing itself from previous research mainly focused on
certain countries or cities. It is an approach that enables us to have a comprehensive overview of the
situation for the EU as a whole.
This exploratory work has several limitations, most of which arise from the survey design,
incorporating a large number of dichotomous variables. The available data available are from 2016,
which is in itself a limitation, because more recent data were not yet available that could give a more
accurate and updated view. Work has not been done at the country level but rather in distinguishing
less developed, in transition, and more developed regions, introducing the degree of development
as one of the variables of the analysis. This may be a limitation of the study, if interest is focused on
countries. Another limitation of our research is that we do not propose a specific model, but rather focus
specifically on the particular aspect of the evolving role of digital skills, along with other socioeconomic
factors. In any case, given the importance of interaction with public administrations in the digital
context, which becomes mandatory in several countries, our findings add value in the dissemination
of these services. The article also contributes to the academic literature on a question that is very
important for EU policies: it opens up an approach that is more ambitious, from a geographical
viewpoint, and links the question to regional development and population density, which is an original
contribution that deserves to be investigated in future research.
Author Contributions: Conceptualization, J.N.-M.; Data curation, L.F.R.-H. and L.M.R.-G.; Investigation, L.F.R.-H.,
L.M.R.-G. and J.N.-M.; Methodology, L.F.R.-H. and L.M.R.-G.; Supervision, J.N.-M.; Writing—original draft,
L.F.R.-H., L.M.R.-G. and J.N.-M. Writing—review & editing. L.F.R.-H., L.M.R.-G. and J.N.-M. All authors have
read and agreed to the published version of the manuscript.Sustainability 2020, 12, 6807 15 of 19
Funding: This research received no external funding.
Conflicts of Interest: The authors declare no conflict of interest.
References
1. Yadav, J.; Saini, A.K.; Yadav, A.K. Measuring citizens engagement in e-Government projects—Indian
perspective. J. Stat. Manag. Syst. 2019, 22, 327–346. [CrossRef]
2. Rana, N.P.; Dwivedi, Y.K.; Lal, B.; Williams, M.D.; Clement, M. Citizens’ adoption of an electronic government
system: Towards a unified view. Inf. Syst. Front. 2015, 19, 549–568. [CrossRef]
3. West, D.M. E-Government and the Transformation of Service Delivery and Citizen Attitudes. Public Adm.
Rev. 2004, 64, 15–27. [CrossRef]
4. Morgeson, F.V.; VanAmburg, D.; Mithas, S. Misplaced Trust? Exploring the Structure of the E-Government-
Citizen Trust Relationship. J. Public Adm. Res. Theory 2010, 21, 257–283. [CrossRef]
5. Field, T.; Muller, E.; Lau, E.; Gadriot-Renard, H.; Vergez, C. Government Flagship Report “The E-Government
Imperative”. OECD J. Budg. 2003, 3, 61–96.
6. Twizeyimana, J.D.; Andersson, A. The public value of E-Government—A literature review. Gov. Inf. Q. 2019,
36, 167–178. [CrossRef]
7. Gil-Garcia, J.R.; Dawes, S.S.; Pardo, T.A. Digital government and public management research: Finding the
crossroads. Public Manag. Rev. 2017, 20, 633–646. [CrossRef]
8. Madsen, C.Ø.; Berger, J.B.; Phythian, M. The Development in Leading e-Government Articles 2001-2010:
Definitions, Perspectives, Scope, Research Philosophies, Methods and Recommendations: An Update of
Heeks and Bailur. In Proceedings of the Lecture Notes in Computer Science; Springer Science and Business Media
LLC: Berlin, Germany, 2014; Volume 8653, pp. 17–34.
9. Rana, N.P.; Dwivedi, Y.K.; Williams, M.D. A meta-analysis of existing research on citizen adoption of
e-government. Inf. Syst. Front. 2013, 17, 547–563. [CrossRef]
10. Brainard, L.A.; McNutt, J.G. Virtual Government–Citizen Relations. Adm. Soc. 2010, 42, 836–858. [CrossRef]
11. Lee, J. 10year retrospect on stage models of e-Government: A qualitative meta-synthesis. Gov. Inf. Q. 2010,
27, 220–230. [CrossRef]
12. Zhang, H.; Xu, X.; Xiao, J. Diffusion of e-government: A literature review and directions for future directions.
Gov. Inf. Q. 2014, 31, 631–636. [CrossRef]
13. Dixon, B.E. Towards e-government 2.0: An assessment of where e-government 2.0 is and where it is headed.
Public Adm. Manag. 2010, 15, 418–454.
14. Sá, F.; Rocha, A.; Cota, M.P. From the quality of traditional services to the quality of local e-Government
online services: A literature review. Gov. Inf. Q. 2016, 33, 149–160. [CrossRef]
15. Wirtz, B.W.; Daiser, P. A meta-analysis of empirical e-government research and its future research implications.
Int. Rev. Adm. Sci. 2016, 84, 144–163. [CrossRef]
16. Moon, M.J.; Lee, J.; Roh, C.-Y. The Evolution of Internal IT Applications and e-Government Studies in Public
Administration. Adm. Soc. 2012, 46, 3–36. [CrossRef]
17. Wirtz, B.W.; Kurtz, O.T. Determinants of Citizen Usage Intentions in e-Government: An Empirical Analysis.
Public Organ. Rev. 2016, 17, 353–372. [CrossRef]
18. Margetts, H.; Dunleavy, P. The second wave of digital-era governance: A quasi-paradigm for government on
the Web. Philos. Trans. R. Soc. A: Math. Phys. Eng. Sci. 2013, 371, 20120382. [CrossRef]
19. Ma, L.; Zheng, Y. Does e-government performance actually boost citizen use? Evidence from European
countries. Public Manag. Rev. 2017, 20, 1513–1532. [CrossRef]
20. Centeno, C.; Van Bavel, R.; Burgelman, J.-C. A Prospective View of e-Government in the European Union.
Electron. J. e-Gov. 2005, 3, 59–66.
21. Fan, Q. A Longitudinal Evaluation of E-Government at the Local Level in Greater Western Sydney (GWS)
Australia. Int. J. Public Adm. 2017, 41, 13–21. [CrossRef]
22. Gauld, R.; Goldfinch, S.; Horsburgh, S. Do they want it? Do they use it? The ‘Demand-Side’ of e-Government
in Australia and New Zealand. Gov. Inf. Q. 2010, 27, 177–186. [CrossRef]
23. Reddick, C.G.; Turner, M. Channel choice and public service delivery in Canada: Comparing e-government
to traditional service delivery. Gov. Inf. Q. 2012, 29, 1–11. [CrossRef]Sustainability 2020, 12, 6807 16 of 19
24. Liu, H. The embedding convergence of smart cities and tourism internet of things in China: An advance
perspective. Adv. Hosp. Tour. Res. 2014, 2, 54–69.
25. Chadwick, A.; May, C. Interaction between States and Citizens in the Age of the Internet: “e-Government” in
the United States, Britain, and the European Union. Governance 2003, 16, 271–300. [CrossRef]
26. Warf, B. Geographies of e-Government in Europe. Int. J. E-Planning Res. 2018, 7, 61–77. [CrossRef]
27. Layne, K.; Lee, J. Developing fully functional E-government: A four stage model. Gov. Inf. Q. 2001, 18,
122–136. [CrossRef]
28. Hoetker, G.; Fountain, J.E. Building the Virtual State: Information Technology and Institutional Change.
Acad. Manag. Rev. 2002, 27, 619. [CrossRef]
29. Tassabehji, R.; Hackney, R.; Popovič, A. Emergent digital era governance: Enacting the role of the ’institutional
entrepreneur’ in transformational change. In Government Information Quarterly; Elsevier: Amsterdam,
The Netherlands, 2016, Volume 33, pp. 223–236. [CrossRef]
30. Hiller, J.; Bélanger, F. Privacy strategies for electronic government. E-Government 2001, 200, 162–198.
31. Coursey, D.; Norris, D.F. Models of E-Government: Are They Correct? An Empirical Assessment. Public Adm.
Rev. 2008, 68, 523–536. [CrossRef]
32. Janowski, T. Digital government evolution: From transformation to contextualization. Gov. Inf. Q. 2015, 32,
221–236. [CrossRef]
33. Joshi, P.R.; Islam, S. E-Government Maturity Model for Sustainable E-Government Services from the
Perspective of Developing Countries. Sustainability 2018, 10, 1882. [CrossRef]
34. Lee, J.; Kim, B.J.; Park, S.; Park, S.; Oh, K. Proposing a Value-Based Digital Government Model: Toward
Broadening Sustainability and Public Participation. Sustainability 2018, 10, 3078. [CrossRef]
35. Gibreel, O.; Hong, A. A Holistic Analysis Approach to Social, Technical, and Socio-Technical Aspect of
E-Government Development. Sustainability 2017, 9, 2181. [CrossRef]
36. Lee, Y.B. Exploring the Relationship between E-Government Development and Environmental Sustainability:
A Study of Small Island Developing States. Sustainability 2017, 9, 732. [CrossRef]
37. Navarro-Galera, A.; Ruiz-Lozano, M.; Valencia, P.T.; Ríos-Berjillos, A.D.L. Promoting Sustainability
Transparency in European Local Governments: An Empirical Analysis Based on Administrative Cultures.
Sustainability 2017, 9, 432. [CrossRef]
38. Navarro-Galera, A.; Alcaraz-Quiles, F.J.; Ortiz-Rodríguez, D. Enhancing Sustainability Transparency in Local
Governments—An Empirical Research in Europe. Sustainability 2018, 10, 2161. [CrossRef]
39. Estevez, E.; Janowski, T. Electronic Governance for Sustainable Development—Conceptual framework and
state of research. Gov. Inf. Q. 2013, 30, S94–S109. [CrossRef]
40. Sapraz, M.; Han, S. A Review of electronic government for environmental sustainability. In Proceedings of
the Pacific Asia Conference on Information Systems (PACIS), Xi’an, China, 8–12 July 2019; p. 155.
41. Fishbein, M.; Ajzen, I. Belief, Attitude, Intention, and Behavior: An Introduction to Theory and Research;
Addison-Wesley: Boston, MA, USA, 1975.
42. Ajzen, I.; Joyce, N.; Sheikh, S.; Cote, N.G. Knowledge and the Prediction of Behavior: The Role of Information
Accuracy in the Theory of Planned Behavior. Basic Appl. Soc. Psychol. 2011, 33, 101–117. [CrossRef]
43. Rogers, E.M. Diffusion of Innovations: Modifications of a Model for Telecommunications. In Die Diffusion
von Innovationen in der Telekommunikation; Springer Science and Business Media LLC: Berlin, Germany, 1995;
pp. 25–38.
44. Davis, F.D. Perceived Usefulness, Perceived Ease of Use, and User Acceptance of Information Technology.
MIS Q. 1989, 13, 319. [CrossRef]
45. Venkatesh, V.; Davis, F.D. A Theoretical Extension of the Technology Acceptance Model: Four Longitudinal
Field Studies. Manag. Sci. 2000, 46, 186–204. [CrossRef]
46. Hung, S.-Y.; Tang, K.-Z.; Chang, C.-M.; Ke, C.-D. User acceptance of intergovernmental services: An example
of electronic document management system. Gov. Inf. Q. 2009, 26, 387–397. [CrossRef]
47. Lee, J.; Rao, H.R. Task complexity and different decision criteria for online service acceptance: A comparison
of two e-government compliance service domains. Decis. Support Syst. 2009, 47, 424–435. [CrossRef]
48. Chakraborty, A.; Ghosh, S.; Mukhopadhyay, P.; Dinara, S.M.; Bag, A.; Mahata, M.K.; Kumar, R.; Das, S.;
Sanjay, J.; Majumdar, S.; et al. Trapping effect analysis of AlGaN/InGaN/GaN Heterostructure by conductance
frequency measurement. MRS Proc. XXXIII 2014, 33, 81–87.Sustainability 2020, 12, 6807 17 of 19
49. Lu, C.-T.; Huang, S.-Y.; Lo, P.-Y. An empirical study of on-line tax filing acceptance model: Integrating TAM
and TPB. Acad. J. 2010, 4, 800–810.
50. Schaupp, L.C.; Carter, L.; McBride, M.E. E-file adoption: A study of U.S. taxpayers’ intentions. Comput. Hum.
Behav. 2010, 26, 636–644. [CrossRef]
51. Shareef, M.A.; Kumar, V.; Kumar, U.; Dwivedi, Y.K. Factors affecting citizen adoption of transactional
electronic government. J. Enterp. Inf. Manag. 2014, 27, 385–401. [CrossRef]
52. Dwivedi, Y.K.; Rana, N.P.; Jeyaraj, A.; Clement, M.; Williams, M.D. Re-examining the Unified Theory of
Acceptance and Use of Technology (UTAUT): Towards a Revised Theoretical Model. Inf. Syst. Front. 2017,
21, 719–734. [CrossRef]
53. Bélanger, F.; Carter, L. The impact of the digital divide on e-government use. Commun. ACM 2009, 52,
132–135. [CrossRef]
54. Colesca, S.E.; Dobrica, L. Adoption and use of E-Government services: The case of Romania. J. Appl. Res.
Technol. 2008, 6, 204–217. [CrossRef]
55. Gupta, K.P.; Singh, S.; Bhaskar, P. Citizen adoption of e-government: A literature review and conceptual
framework. Electron. Gov. Int. J. 2016, 12, 160. [CrossRef]
56. Hung, S.-Y.; Chang, C.-M.; Yu, T.-J. Determinants of user acceptance of the e-Government services: The case
of online tax filing and payment system. Gov. Inf. Q. 2006, 23, 97–122. [CrossRef]
57. Reddick, C.G. Citizen interaction with e-government: From the streets to servers? Gov. Inf. Q. 2005, 22,
38–57. [CrossRef]
58. Mensah, I.K.; Mi, J. Computer Self-Efficacy and e-Government Service Adoption: The Moderating Role of
Age as a Demographic Factor. Int. J. Public Adm. 2017, 42, 158–167. [CrossRef]
59. Akman, I.; Yazici, A.; Mishra, A.; Arifoglu, A. E-Government: A global view and an empirical evaluation of
some attributes of citizens. Gov. Inf. Q. 2005, 22, 239–257. [CrossRef]
60. Al-Jamal, N.Q.; Abu-Shanab, E.A. E-Government Adoption in Jordan: The Influence of Age. In The 7th
International Conference on Information Technology; ResearchGate: Berlin, Germany, 2015; pp. 345–350.
61. Szopiński, T.; Staniewski, M.W. Manifestations of e-government usage in post-communist European countries.
Internet Res. 2017, 27, 199–210. [CrossRef]
62. Dwivedi, Y.K.; Williams, M.D. Demographic influence on UK citizens’ e-government adoption. Electron. Gov.
Int. J. 2008, 5, 261. [CrossRef]
63. Rana, N.P.; Dwivedi, Y.K.; Williams, M.D. E-government adoption research: An analysis of the employee’s
perspective. Int. J. Bus. Inf. Syst. 2013, 14, 414. [CrossRef]
64. Pereira, J.P.R. Broadband Access and Digital Divide. In Proceedings of the Advances in Intelligent Systems and
Computing; Springer Science and Business Media LLC: Berlin, Germany, 2016; Volume 445, pp. 363–368.
65. Salemink, K.; Strijker, D.; Bosworth, G. Rural development in the digital age: A systematic literature review
on unequal ICT availability, adoption, and use in rural areas. J. Rural. Stud. 2017, 54, 360–371. [CrossRef]
66. Das, A.; Singh, H.; Joseph, D. A longitudinal study of e-government maturity. Inf. Manag. 2017, 54, 415–426.
[CrossRef]
67. Wang, Y.-S. The adoption of electronic tax filing systems: An empirical study. Gov. Inf. Q. 2003, 20, 333–352.
[CrossRef]
68. Wangpipatwong, S.; Chutimaskul, W.; Papasratorn, B. Understanding Citizen’s Continuance Intention to Use
e-Government Website: A Composite View of Technology Acceptance Model and Computer Self-Efficacy.
Electron. J. E-Gov. 2008, 6, 55–64.
69. Van Laar, E.; Van Deursen, A.J.A.M.; Van Dijk, J.A.; De Haan, J. The relation between 21st-century skills and
digital skills: A systematic literature review. Comput. Hum. Behav. 2017, 72, 577–588. [CrossRef]
70. Ebbers, W.E.; Jansen, M.G.; Van Deursen, A.J.A.M. Impact of the digital divide on e-government: Expanding
from channel choice to channel usage. Gov. Inf. Q. 2016, 33, 685–692. [CrossRef]
71. Garín-Muñoz, T.; López, R.; Perez-Amaral, T.; Herguera, I.; Valarezo, A. Models for individual adoption of
eCommerce, eBanking and eGovernment in Spain. Telecommun. Policy 2019, 43, 100–111. [CrossRef]
72. Reddick, C.; Anthopoulos, L. Interactions with e-government, new digital media and traditional channel
choices: Citizen-initiated factors. Transform. Gov. People Process. Policy 2014, 8, 398–419. [CrossRef]
73. Lindgren, I.; Madsen, C. Østergaard; Hofmann, S.; Melin, U. Close encounters of the digital kind: A research
agenda for the digitalization of public services. Gov. Inf. Q. 2019, 36, 427–436. [CrossRef]You can also read