EVALUATION OF THE ION AMPLISEQ PHENOTRIVIUM PANEL: MPS-BASED ASSAY FOR ANCESTRY AND PHENOTYPE PREDICTIONS CHALLENGED BY CASEWORK SAMPLES - MDPI
←
→
Page content transcription
If your browser does not render page correctly, please read the page content below
G C A T
T A C G
G C A T
           genes
Article
Evaluation of the Ion AmpliSeq™ PhenoTrivium
Panel: MPS-Based Assay for Ancestry and Phenotype
Predictions Challenged by Casework Samples
Marta Diepenbroek 1, * , Birgit Bayer 1 , Kristina Schwender 1 , Roberta Schiller 1 , Jessica Lim 2 ,
Robert Lagacé 2 and Katja Anslinger 1
 1   Department of Forensic Genetics, Institute of Legal Medicine, Ludwig Maximilian University of Munich,
     Nußbaumstraße 26, 80336 Munich, Bavaria, Germany; birgit.bayer@med.uni-muenchen.de (B.B.);
     kristina.schwender@med.uni-muenchen.de (K.S.); roberta.schiller@med.uni-muenchen.de (R.S.);
     katja.anslinger@med.uni-muenchen.de (K.A.)
 2   Human Identification Group, Thermo Fisher Scientific, 180 Oyster Point Blvd, South San Francisco,
     CA 94080, USA; jessica.lim2@thermofisher.com (J.L.); robert.Lagace@thermofisher.com (R.L.)
 *   Correspondence: marta.diepenbroek@med.uni-muenchen.de

 Received: 2 November 2020; Accepted: 22 November 2020; Published: 25 November 2020

 Abstract: As the field of forensic DNA analysis has started to transition from genetics to genomics,
 new methods to aid in crime scene investigations have arisen. The development of informative single
 nucleotide polymorphism (SNP) markers has led the forensic community to question if DNA can be
 a reliable “eye-witness” and whether the data it provides can shed light on unknown perpetrators.
 We have developed an assay called the Ion AmpliSeq™ PhenoTrivium Panel, which combines three
 groups of markers: 41 phenotype- and 163 ancestry-informative autosomal SNPs together with
 120 lineage-specific Y-SNPs. Here, we report the results of testing the assay’s sensitivity and the
 predictions obtained for known reference samples. Moreover, we present the outcome of a blind
 study performed on real casework samples in order to understand the value and reliability of the
 information that would be provided to police investigators. Furthermore, we evaluated the accuracy
 of admixture prediction in Converge™ Software. The results show the panel to be a robust and
 sensitive assay which can be used to analyze casework samples. We conclude that the combination of
 the obtained predictions of phenotype, biogeographical ancestry, and male lineage can serve as a
 potential lead in challenging police investigations such as cold cases or cases with no suspect.

 Keywords: forensic phenotyping; HIrisPlex-S; massively parallel sequencing; next-generation
 sequencing; ancestry; appearance; ancestry prediction; phenotype prediction

1. Introduction
     Forensic genetics currently stands in front of a new era of DNA analysis as Massively Parallel
Sequencing (MPS) is becoming a more commonly used tool for DNA analysis. The enhanced
multiplexing capabilities of MPS technology coupled with the ability to analyze a variety of marker
types has led to increased research and use of single nucleotide polymorphisms (SNPs) to predict
externally visible characteristics (EVCs) and biogeographical ancestry (BGA) from a DNA sample [1–15].
To implement the new capabilities in DNA testing, legal changes are obligatory for SNP analysis by
MPS to be applied in new cases. Forensic DNA phenotyping (FDP) concerns coding DNA and goes
beyond the methods used so far, which are based on testing non-coding regions. The latter provides
investigators with the forensic golden standard of an STR profile used to associate a suspect with a
crime scene. Forensic phenotyping has arisen as a tool that can be used in situations where there is no
suspect. In Germany, a legal change was introduced at the end of 2019 which allows for a forensic

Genes 2020, 11, 1398; doi:10.3390/genes11121398                                  www.mdpi.com/journal/genes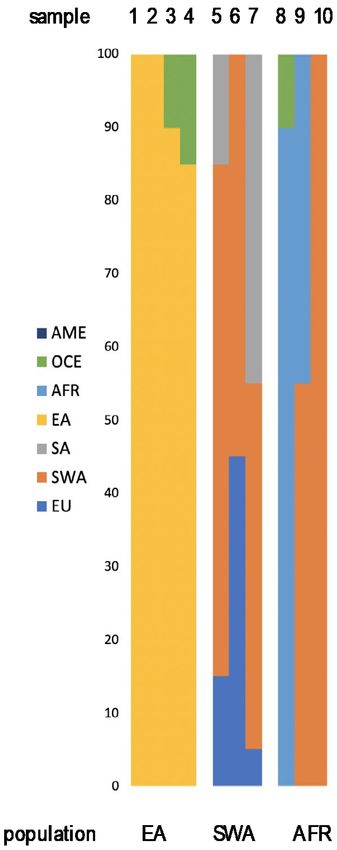
Genes 2020, 11, 1398                                                                                 2 of 24

specialist to be asked to analyze a casework sample for the eye, hair, and skin color and biological age of
the unknown individual who contributed to the trace. A special situation occurs in the federal state of
Bavaria where the law exists in an expanded form and it also includes the prediction of one’s ancestry
with stipulations that the testing can only be performed in particular cases, such as when serious
danger is expected [16]. Due to the ongoing legal changes, the scientific development of forensic DNA
phenotyping (FDP) must be followed by the evaluation of the usefulness of those methods when being
challenged by actual casework samples. What matters is not only the number and type of markers
used or how sensitive and reliable the marker sets are, but also the accuracy of data interpretation
and how clearly the results can be presented to law enforcement to minimize bias in investigations.
Therefore, we developed the Ion AmpliSeq™ PhenoTrivium Panel, an assay combining ancestry and
phenotype-associated SNPs. The panel was tested on known reference samples and real casework
samples, as there is a limited number of studies concerning the latter. Our study presents a complex
evaluation of one of the most important questions: are the obtained EVC and BGA predictions reliable
for forensic investigations?

2. Materials and Methods

2.1. Panel Design
      The Ion AmpliSeq™ PhenoTrivium Panel comprises 320 markers allowing for the prediction of
BGA, appearance, and y-chromosomal lineage. BGA and EVC markers were selected from the available
literature for a total of 200 autosomal SNPs, from which 163 ancestry SNPs overlap with the Precision
ID Ancestry Panel (Thermo Fisher Scientific, Waltham, MA, USA) [5] (rs6464211 and rs12439433 were
not used) and 41 phenotype SNPs correspond with the HIrisPlex-S Panel [11] (four markers overlap
with the ancestry set). The Y-SNPs chosen cover 20 major haplogroups from the basic Y chromosome
phylotree from the International Society of Genetic Genealogy (ISOGG, June 2019) and also include 100
subhaplogroups for better phylogenetic resolution. All 320 markers were submitted to and designed
using the Ion AmpliSeq Designer pipeline (www.ampliseq.com). The design was ordered as a single
primer pool, containing all BGA, EVC, and y-chromosomal markers, at a 2X primer pool concentration.
All 320 SNPs were covered by 196 autosomal targets with a mean amplicon length of 78 bp and 113
Y-chromosomal targets with a mean amplicon length of 217 bp.

2.2. Reference Samples
      A reference set of samples was collected from volunteers living in in the area of Munich, Germany,
following approval given by the Bioethical Commission (reference number 18-870) from the Ludwig
Maximilian University of Munich. Buccal swabs from volunteers were taken and they were asked
to fill out a questionnaire where they self-declared ancestry using a given family tree (down to
the grandparents, with an additional column for those with knowledge about previous ancestors)
and self-described physical appearance (pictures of the iris, the back of the head/roots, and the
forearm were taken for comparison). All samples were anonymized by assigning numbers to the
collected samples immediately following material collection. A total of 140 samples (from 62 males
and 78 females) were used for this study. Based on the provided data, 125 individuals were classified
as European (84 from Germany), 10 as non-European, and five as admixed.

2.3. Sensitivity Study
      A buccal swab sample from a male with known phenotype and ancestry was selected for the
study. Serial dilutions (1 ng, 500 pg, 250 pg, 125 pg, 62 pg, 31 pg, 7 pg) were prepared and amplified
in triplicate.
Genes 2020, 11, 1398                                                                                3 of 24

2.4. Casework Samples
     Casework samples were used for a blind study to assess the reliability of phenotype and ancestry
predictions. Scientists involved in the data analysis and interpretation had no knowledge about
the phenotype and ancestral origin of the DNA donors. The results of the blind study served as an
evaluation of the interpretation pipeline. Altogether, 17 casework samples were collected: 15 samples
(13 blood and 2 bones) from autopsies performed at our Institute (with permission from the Bioethical
Commission) and two samples from an actual investigation, submitted for phenotyping by the police.
All casework samples were amplified in duplicate. For the 13 blood samples, reference phenotype
and ancestry data were based on photos taken during the autopsy and information provided by the
police about the place of birth. For the two bone samples, the place of birth was the only available data.
No reference phenotype and ancestry data were available for the trace samples submitted by the police
as they originated from unknown perpetrators. All collected casework samples were of male origin.

2.5. Library Preparation and Sequencing
     For all samples used in the study, genomic DNA (gDNA) were extracted on the Maxwell®
RSC 48 Instrument using the Maxwell® FSC DNA IQ™ Casework Kit as recommended by the
manufacturer (Promega). The extracts were quantified using a Quantifiler™ Trio DNA Quantification
Kit (Thermo Fisher Scientific) as recommended by the manufacturer. The results were used to assess
possible inhibition, calculate the Degradation Index (DI), and to perform further dilutions of the sample.
The samples were diluted to the recommended DNA input (1 ng), while maximum input was used for
samples
Genes 2020, 11, 1398                                                                              4 of 24

casework samples, consensus genotypes from replicates were used to generate a single SNP profile for
tertiary analysis.

Phenotype and Ancestry Predictions
      SNP profiles used for phenotype predictions were generated by Converge after running the
HIDGenotyper plugin using a hotspot file (SNP names and positions, reference alleles and variants)
containing entries for the 41 SNPs within the HIrisPlex-S (HPS) set. The HIrisPlex-S SNP set contains
an indel SNP (rs796296176), in the form of an insertion A, that was manually reviewed and called
using IGV 2.7 (Integrative Genomics Viewer) [18]. SNP genotypes were exported from Converge in the
form of an Excel file reporting all alleles relative to the forward strand. An in-house Excel workbook
was used to convert the Converge output into the input file format required by the HIrisPlex-S Webtool
(https://hirisplex.erasmusmc.nl/). Predictions were interpreted according to the HPS user manual
shared by the authors (HirisPlexS) [11,19,20]. Sequencing results from the known reference samples
were used together with the HPS predictions to establish interpretation guidelines for the casework
samples tested.
      Ancestry prediction was performed using the bootstrapping admixture analysis feature of
Converge using the Precision ID Ancestry Panel Ancestry Frequency File v1.1. The frequency file
contains genotype frequencies and population data for 146 SNPs of the Precision ID Ancestry panel and
covers seven root populations created by hierarchal clustering of 66 populations from ALFRED based
on allele frequencies [21,22]. As 163 of 165 of the Precision ID Ancestry SNPs were included in our
panel, this corresponds to 145 SNPs (marked in yellow in Table S1) with available genotype frequencies
and population data available for bootstrapping admixture analysis. In the bootstrapping admixture
analysis feature of Converge, admixture predictions are made based on a maximum likelihood approach
used to predict the most likely admixture proportions across seven root populations (herein referred
to as the core admixture algorithm): Africa (AFR), East Asia (EA), South Asia (SA), Southwest Asia
(SWA), Europe (EU), America (AME), and Oceania (OCE) [21–23]. The predictions are bootstrapped
across a random subset of sequenced SNPs, specified by the user in %, with each bootstrapping
replication ran through the core admixture algorithm N times using a different subset of SNPs for each
replication to capture uncertainty in the predictions. The results are displayed as an average of the
bootstrapping replications for each population group and a 95% confidence interval reflecting the
probable range of variability of the estimated ethnicity percentages [21–23]. The predicted ancestry is
presented as a percentage of each population with the corresponding likelihood. Sample admixture
was estimated using default settings (50% resampling size and 40 replications) and later adjusted to 75%
resampling size and 1000 replications after analyzing the reference samples. To contrast the admixture
calculations done by Converge, the same genotypes (145 markers maximum) from all the samples
were analyzed with SNIPPER [24–26]. The analysis was performed using an available reference
set corresponding with the Precision ID Ancestry Panel, which included 2099 genotypes from six
populations: Africa (AFR), East Asia (EA), South Asia (SA), Europe (EU), America (AME), and Oceania
(OCE). Ancestry classification of the studied individuals in SNIPPER was performed using naïve Bayes
and presented on PCA (principal component analysis) graphs. Additionally, population likelihoods
were calculated using called FrogAncestryCalc, a recently published and open source software that
is a stand-alone version of FROG-kb [27–29]. Computations for each sample were performed based
on genotypes consisting of a maximum of 163 SNPs comprising the Precision ID Ancestry Panel for
which the software contains 96 reference populations. The populations with the highest likelihood
were taken into consideration for interpreting the ancestral origin of the samples tested.
      Y-haplogrouping was performed in Converge using the custom Y haplogroup analysis feature
and a custom Y-SNP haplogroup file for 120 Y-SNPs included in the panel. The file was created based
on ISOGG (International Society of Genetic Genealogy) Y-Tree version 14.100, accessed on June 2019
(https://isogg.org/). The file contained the SNP name and position, together with its ancestral and
derived allele, the haplogroup it defines, and the corresponding parent haplogroup. The included
Genes 2020, 11, 1398                                                                                 5 of 24

data were used for the Y-haplogrouping, which was based on detecting mutant SNPs. As the final
report, the result was presented as the major haplogroup predicted and the most derived (within the
panel) subhaplogroup, reported by Converge. All male samples from the study were also analyzed for
Y-STRs (Promega PowerPlex23 System) with Y-haplogrouping using Nevgen (https://www.nevgen.org/)
in order to assess Y haplogroup concordance between both methods.

3. Results

3.1. Coverage and Sensitivity
     The sensitivity study consisted of a serial dilution of a reference male sample from 1 ng to 7 pg
DNA amplified in triplicate for a total of 24 libraries and sequenced on a 530 Chip. Autosomal marker
coverage across the 200 autosomal markers included in the panel varied between 967,808 and 1,241,035
total reads for 1 ng replicates and between 104,629 and 287,668 reads for 7 pg replicates. For the 120
Y-chromosomal markers, the values for 1 ng of DNA input oscillated between 236,690 and 271,058 reads
and for 7 pg between 30,327 and 80,114 reads. The mean coverage for each marker is presented in the
Supplementary Materials Tables S3 and S4. A detailed summary of the performance of the autosomal
markers in the case of coverage and allele balance is presented in the Supplementary Materials Table S7.
     From 41 autosomal SNPs associated with phenotype, full consensus profiles were obtained
down to 125 pg input, where only one marker, rs1470608, did not meet the coverage threshold
(Supplementary Materials Figure S1a). Inter-replicate concordance was observed down to 62 pg.
Below that DNA input, discrepant alleles were called between the replicates. Discrepant alleles were
identified to be drop-in and drop-out alleles. Drop-in alleles passing the coverage thresholds were
designated as false allele calls. Starting with 31 pg, false allele calls and allele drop-outs were observed
across all replicates and resulted in incorrect genotyping. Accuracy (AUC) loss for all prediction
categories was observed starting with 62 pg of input DNA. The observed AUC loss values ranged
between 0.008 and 0.033 for eye color, between 0.001 and 0.044/0.001 and 0.027 for hair color/shade,
and between 0.001 and 0.046 for skin color. For all samples, eye and skin colors were predicted
correctly as blue eyes and pale to intermediate skin. The only incorrect prediction was observed for
the consensus profile of 31 pg input DNA due to a homozygote disparity, where an extra allele causes
a heterozygote call compared to the expected homozygote call, in IRF4 (rs12203592) for two of three
replicates. At 31 pg input DNA, the individual was predicted to have light brown hair when the correct
hair color was blonde.
     Of the 159 autosomal SNPs associated with ancestry (four SNPs are shared between ancestry and
phenotype predictions which were included in the previous section), no drop-outs were observed
down to 125 pg of input DNA. At the lowest amount of input DNA of 7 pg, 74% of SNPs (120 markers)
exceeded the calling thresholds and were included in the final profile. The number of SNPs used by
Converge for admixture predictions was 145 (max. possible) down to 125 pg and 107 markers at 7 pg
of input DNA. Discordances between replicates were observed starting at 31 pg and at 7 pg they were
observed for 12% of the markers. Incorrect calls passing the genotyping thresholds were observed,
starting with 15 pg of input DNA (Supplementary Materials Figure S1b). Admixture predictions
from Converge and SNIPPER were correct for all DNA amounts tested and suggested to be of 100%
European origin.
     From 120 Y-chromosomal SNPs, four markers (P305, M124, M123, and M54) dropped out
completely (Supplementary Materials Figure S1c) and two markers, M31 and D-F6251, started to
underperform in terms of coverage below 62pg of DNA input. The consensus haplotype at 7 pg of
DNA input consisted of 87 Y-SNPs and two markers had an incorrect allele called. The Y haplogroup
was predicted as major R and R1b1a1b (R-M269) as the most derived subhaplogroup and as R only
down at 7 pg. Y-STR analysis for the same sample using the PowerPlex Y23 System and Nevgen
suggested haplogroup R1b1a1b1a1a1 (R-U106).
Genes 2020, 11, 1398                                                                                                                                  6 of 24

3.2. Reference Samples

3.2.1. Phenotype Predictions
      For phenotype predictions, the comparison data consisted of reference photos and a self-described
appearance. In the case of hair color, 40 individuals were excluded due to lack of, grey, or dyed
hair (the provided data were taken under consideration but not used as final reference due to the
subjective color understanding). The outcome of the predictions is presented in Table 1. For the eye
color, the highest p value was taken as the predicted color. If the highest p-value did not exceed 0.5,
the prediction was called inconclusive. For hair and skin color, the prediction model presented by the
authors was used to group the individuals as presented in Table 1. Overall, 88%, 78%, and 95% of eye,
hair, and skin color predictions were correct, respectively, and those values generally correspond with
the ones obtained from the validation of the panel by the authors [19,30–32].

      Table 1. Summary of the phenotype predictions for the reference samples. For each phenotypic trait,
      the mean p-values calculated for each HIrisPlex-S category were used to group the predictions as
      presented. The table also includes a quantitative summary of the predictions.

                Mean p-Values for Each HIrisPlex-S Category                                                           Number of Predictions per
                                                                                  Example        Prediction
                    among Tested Reference Samples                                                                 Category (Incorrect Ones in Red)
                                  Blue            Intermediate      Brown
        EYE COLOR

                                  0.900              0.061           0.039                          Blue

                                  0.097              0.123           0.780                         Brown

                                  0.336              0.240           0.424                      Inconclusive

                                          Color                     Shade
                       Blond         Brown        Red     Black Light Dark

                          0.212       0.103       0.678   0.007   0.969   0.031                     Red

                          0.758       0.185       0.041   0.017   0.986   0.014             Light blond to blond
        HAIR COLOR

                          0.582       0.315       0.066   0.037   0.935   0.065             Blond to dark blond

                          0.302       0.553       0.058   0.088   0.821   0.179             Light brown to brown

                          0.206       0.619       0.012   0.163   0.525   0.475             Brown to dark brown

                          0.013       0.330       0.000   0.657   0.026   0.974             Dark brown to black

                                      Very                                Dark/
                                                  Pale    Inter. Dark
                                      Pale                                Black

                                      0.204       0.705   0.091   0.004   0.000               Very pale to pale

                                      0.046       0.492   0.454   0.008   0.000             Pale to intermediate
                     SKIN COLOR

                                      0.005       0.068   0.878   0.050   0.004                 Intermediate

                                      0.003       0.021   0.497   0.458   0.024             Intermediate to dark

                                      0.001       0.006   0.262   0.721   0.010                    Dark

                                      0.000       0.000   0.000   0.001   0.999                Dark to black
Genes 2020, 11, 1398 7 of 24
3.2.2. Ancestry Predictions
European Samples
Altogether, 125 individuals with self-declared European ancestry down to the 3rd generation
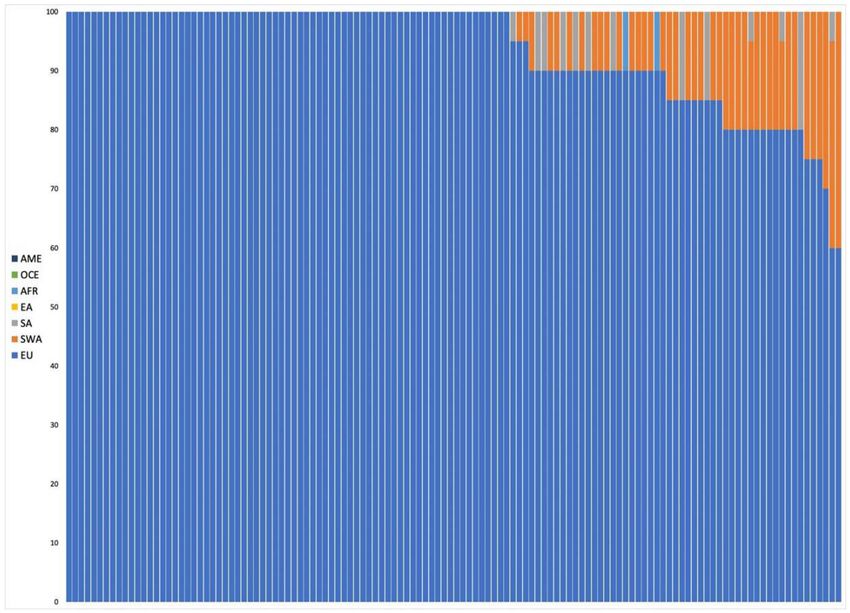
were analyzed. The results of the admixture analysis performed by Converge are presented in Figure 1.
All individuals were assigned to EU with some of them showing SWA admixture up to more than 30%.
These samples included all the southeastern European individuals and a few German individuals.
SNIPPER classified all samples more than a billion times more likely to come from Europe than any
other population included in the reference set (Figure 2a).
Figure 1. Plot presenting ancestry predictions for the European individuals calculated by Converge
Software using the bootstrapping admixture analysis (20–22). The predictions were bootstrapped across
a random subset of sequenced single nucleotide polymorphisms (SNPs) multiple times, with each
bootstrap sampling ran through the core admixture algorithm, producing an average prediction
(summing up to 100%) result from all replications, presented here as a single bar, corresponding with a
single individual. Samples were sorted by ascending percentage of admixtures detected.
As the European genetic landscape is very complex, FROG analysis confirmed the previous
estimates without providing a better differentiation. However, it was observed that for the individuals
with European ancestry of at least 90%, the highest likelihoods were represented by major EU
populations (e.g., Irish, Danes, Hungarians). For the individuals with inferred SWA admixture,
the populations suggested by FROG included, among different EU populations, Turks or ethnic groups
like Ashkenazi Jews (only two of them had confirmed Jewish ancestry). The Y-chromosome SNPs
established for 56 European males are described as common in EU (Figure 3). In only some cases,
the subhaplogroups represented the lineages known to be more frequent among particular populations
and corresponded with the described heritage, like I-L621 (Romania), R-L21 (England), or R-M458
(Czech Republic) [33–35].
Genes 2020, 11, 1398                                                                                        8 of 24

      Figure 2. Principal component analysis plots by SNIPPER for all the reference samples. The results
      are shown separately for individuals classified by the provided data as from (a) Europe, (b) East Asia,
      (c) Southwest Asia, (d) Africa, and (e) admixed. The samples are named by their stated origins.
Genes 2020, 11, 1398                                                                                         9 of 24

      Figure 3. Summary of the Y-lineage analyses on the 62 male individuals of the reference study. For all
      samples, Nevgen’s Y-STR haplotype-based haplogroup predictions were verified by sequencing of
      Y-SNP markers. In 22% of the cases, fully concordant results were obtained. Furthermore, sequencing
      placed 64% of the individuals slightly higher in the phylogeny, as the terminal Y-SNP marker suggested
      by the software was not part of the sequenced marker panel. Finally, 14% of the Y-haplogroup predictions
      were overruled by sequencing (SNPs suggested by Nevgen were sequenced and had ancestral state).
      While the major haplogroup assignments proved stable, the subhaplogroup assignments changed in
      these cases.

Non-European Samples
     The summarized results of ancestry prediction for ten non-European samples are presented in
Table 2 (admixtures by Converge, population likelihood ratios by SNIPPER, population likelihoods
by FROG, Y-lineage) and Figure 2b–d (PCA by SNIPPER). Both Converge and SNIPPER correctly
predicted four samples as EA. Analysis by Converge’s bootstrapping admixture algorithm for three
SWA samples showed admixture between SWA and other populations. One sample with self-reported
ancestry from Palestine showed admixture with EU, one sample (from Iran) showed admixture with
SA, and one sample (from Turkey) showed admixture with both EU and SA. For these samples,
SNIPPER did not detect the same admixtures and they were all assigned to one population only—EU
or SA (Figure 2c)—however, the LR values for two samples, namely Turkey and Iran, were low
(Table 2). From three African samples, only one (from Uganda) was predicted as AFR by both Converge
and SNIPPER. The East African sample (from Eritrea) showed strong admixture with SWA when
analyzed by Converge and was assigned to SA by SNIPPER. The North African individual (from Egypt)
was assigned to SWA only by Converge and SNIPPER detected admixture of EU and SA (Table 2).
Genes 2020, 11, 1398                                                                                             10 of 24

      Table 2. Summary of the ancestry prediction for non-European samples including admixture analysis
      by Converge, likelihood ratio (LR) calculated by SNIPPER using Naïve Bayes, population likelihoods
      by FROG-kb and Y-lineage analysis (most derived subhaplogroup shown; N/A corresponds with
      female samples).

                                                                          Population Likelihoods
          Admixture (by Converge)          LR (by Snipper)                                              Y-Lineage
                                                                             FROG (Highest)
                                             Sample 1 (Japan)                 Sample 1 (Japan)
                                                                                                          O1b2
                                      billion times more likely EA          Japanese 1.3 × 10−51
                                                                                                          P49
                                            than SA and AME             Mainland Japanese 1.9 × 10−52
                                             Sample 2 (China)
                                                                               Sample 2 (China)            O2
                                      billion times more likely EA
                                                                           Yi (Sichuan) 1.1 × 10−51       M122
                                            than AME and SA
                                                                            Sample 3 (Vietnam)
                                           Sample 3 (Vietnam)
                                                                             Hakka 1.1 × 10−46
                                      billion times more likely EA                                        N/A
                                                                            Lao Long 8.3 × 10−47
                                            than AME and SA
                                                                        Mainland Japanese 7.8 × 10−47
                                                                              Sample 4 (Japan)
                                             Sample 4 (Japan)
                                                                        Mainland Japanese 7.2 × 10−53
                                      billion times more likely EA                                        N/A
                                                                        Okinawa Japanese 4.4 × 10−53
                                            than SA and AME
                                                                            Japanese 2.2 × 10−53
                                                                              Sample 5 (Turkey)
                                            Sample 5 (Turkey)
                                                                             Iranians 2.0 × 10−41       R1b1a1b
                                    18.94 times more likely EU than
                                                                              Pathan 6.9 × 10−42         M269
                                        SA and billion than OCE
                                                                              Turks 3.1 × 10−42
                                           Sample 6 (Palestina)
                                                                            Sample 6 (Palestina)
                                      billion times more likely EU                                        N/A
                                                                         Turkish Cypriots 6.1 × 10−49
                                             than SA and EA
                                            Sample 7 (Iran)                     Sample 7 (Iran)
                                                                                                         H1a1a
                                     458 times more likely SA than           Iranians 3.9 × 10−48
                                                                                                          M82
                                       EU and billion than OCE                 Turks 7.2 × 10−49
                                           Sample 8 (Uganda)                 Sample 8 (Uganda)
                                     billion times more likely AFR           Lisongo 1.2 × 10−38          N/A
                                            than SA and OCE                   Hausa 1.1 × 10−39
                                            Sample 9 (Eritrea)                Sample 9 (Eritrea)
                                                                                                         E1b1b1
                                    billion times more likely SA than     Ethiopian Jews 9.1 × 10−51
                                                                                                          M35
                                               EU and AFR                    Somalis 1.6 × 10−52
                                           Sample 10 (Egypt)
                                                                             Sample 10 (Egypt)
                                    1.36 times more likely EU than                                        N/A
                                                                        Palestinian Arabs 1.7 × 10−51
                                    SA and billion more than AME

      As provided in the guidelines for FROG-kb, the calculated probabilities do not consider
multiple ancestries. Therefore, the results presented here for non-European samples did not always
correspond with the detected admixtures but overall, the highest population likelihoods agreed with
self-declared ancestry, e.g., “Mainland Japanese” and “Okinawa Japanese” for Japan or “Ethiopian Jews”
and “Somalis” for East Africa. The established Y-lineages correlated closely with ancestry predictions
based on autosomal markers analysis: e.g., H-M82 for Iran or O-P49 for Japan [36,37].

Admixed Samples
     The results of the predictions for five samples known to be admixed are shown in Table 3
(Converge, SNIPPER, FROG, Y-lineage) and Figure 2e (SNIPPER). The data provided by the volunteers
were used to create “expected” admixtures by referring to seven reference populations. For Sample 1,
an individual with European–East Asian (Germany–China) descent, Converge detected very accurate
admixture of EU and EA. The same sample was assigned to SA by SNIPPER (Figure 2d, Table 3).
Samples 2 and 3 had North African (Tunisia and Algeria) ancestry of 50% and 25% and both were
detected by Converge as an admixture of AFR and SWA. Sample 5, with 25% of SWA ancestry (Iran),
showed SWA and SA admixture, which corresponds with previously presented results obtained for
an individual with Iranian origin. Sample 4 was the only sample with an unexpected result as the
estimated 50% of South American (Guyana) heritage was predicted by Converge to be of AFR descent
Genes 2020, 11, 1398 11 of 24
only. For samples 3–5, no admixture was detected by SNIPPER, but for three of them, the calculated
LR values were low (Table 3).
Table 3. Summary of the ancestry prediction for admixed samples including a graphical presentation
of the expected admixture (based on the data provided and referring to reference populations in
Converge), admixture analysis by Converge, likelihood ratio (LR) calculated by SNIPPER using Naïve
Bayes, population likelihoods by FROG-kb and Y-lineage analysis (most derived subhaplogroup shown;
N/A corresponds with female samples).
Expected Admixture Predicted Admixture
Population Likelihoods
(Based on (Calculated by LR (by SNIPPER) Y Lineage
FROG (Highest)
Provided Data) Converge)
Sample 1
billion times more likely Chuvash 6.2 × 10–53
N/A
SA than EU and EA Qinghai Tibetans 1.1 × 10–53
Khazaks 7.8 × 10–54
Sample 2
billion times more likely Italians 7.0 × 10–48
N/A
EU than SA and AME Turks 5.7 × 10–48
Turkish Cypriots 1.2 × 10–48
128,027 times more likely Sample 3
J1a
EU than SA and billion Kairoun,Tunisia 5.9 × 10–49
P58
more than AME Smar,South Tunisia 5.9 × 10–50
Sample 4
795 times more likely EU
Sousse, Tunisia 1.1 × 10–53
than SA and billion more N/A
Kairoun,Tunisia 1.8 × 10–54
than OCE
Smar, South Tunisia 1.7 × 10–54
Sample 5
221,461 times more likely Mixed EU
EU than SA and billion 4.8 × 10–46 N/A
more than AME Russians 2.7 × 10–46
Finns 1.6 × 10–46
The population likelihoods calculated by FROG-kb did not adequately reflect the calculated
admixtures and for one sample, the results did not correspond with expected reference populations.
For an individual of European–East Asian ancestry, the highest likelihoods were represented by rare
ethnic groups which did not comply with the self-declared ancestry (Germany and Japan). Only one of
the admixed samples was male and the analysis of Y-lineage revealed a haplogroup found rarely in
Europe, namely J-P58 [38,39]. The paternal lineage of this individual was described as Algerian.
3.3. Casework Samples
The lowest total coverage across all the markers was observed for the bones (Sample C1 with
485,514 and Sample C2 with 35,928 total reads) and for one autopsy sample with a high degradation
index (Sample C11 with 449,210 total reads). The mean coverage for each marker is presented in
the Supplementary Materials Tables S5 and S6. The number of markers used and prediction results
based on the consensus profiles are summarized in Table 4. All predictions were made based on the
reported SNP genotypes and the interpretation pipeline established by the sensitivity and reference
sample studies mentioned previously. The combination of the ancestry and phenotype predictions for
casework samples were described as they would be compared with reference data if available (Table 5).Genes 2020, 11, 1398 12 of 24
Table 4. Summary of panel performance on challenging casework samples, together with detailed values obtained for phenotype, ancestry, and Y-lineage analysis.
For phenotype, the highest p-values are bolded. For admixtures, the percentage of each reference population detected is presented. For population likelihoods,
the highest values marked by FROG are presented. For Y-lineage, major haplogroup and subhaplogroup reported by Converge are presented. DI = Degradation Index.
Used SNPs p-Values
Maximum: Eye Color Hair Color Hair Shade Skin Color
V Pale Admixture
Sample and DNA Blond Population Likelihoods
Blue Pale Converge Y-Lineage
Material Input (DI) 163 41 120 Brown Light FROG (Highest)
Inter Inter (% Mean)
Ancestry Phenotype Y-SNPs Red Dark
Brown Dark
Black
B-Dark
0.000
0.097 Major: E
0.001 0.000
C1 125 pg 0.645 0.052 51.50 SWA Subhap:
163 30 110 0.017 0.001 Ethiopian Jews 5.7 × 10−52
bone (1.4) 0.001 0.948 48.50 AFR E1b1b1
0.982 0.192
0.257 (M35)
0.807
C2 31 pg
66 12 29 NA NA NA NA
bone (1.2)
C3 62 pg
154 40 107
trace (1.6) The exact p-values cannot be published due to an ongoing investigation
C4 125 pg
163 40 113
trace (1)
0.098
0.433 Danes 4.5 × 10−45 Major: R
0.932 0.654
C5 1 ng 0.046 1.000 Mixed EU 4.0 × 10−45 Subhap:
163 41 116 0.046 0.249 100 EU
blood (1.1) 0.519 0.000 Irish 3.8 × 10−45 R1a1a1b1a2
0.021 0.000
0.002 Hungarians 3.7 × 10−45 (Z280)
0.000
0.000
0.002 Major: E
0.000 0.000 Yoruba 3.1 × 10⁻³⁴
C6 1 ng 0.301 0.002 Subhap:
162 41 116 0.002 0.000 100 AFR Zaramo 4.7 × 10⁻³⁵
blood (0.9) 0.000 0.998 E1b1a1
0.998 0.003 Lisongo 3.5 × 10⁻³⁵
0.697 (M2)
0.997
0.000
0.003 Major: E
0.000 0.000
C7 1 ng 0.264 0.007 60.64 SWA Subhaplo:
162 41 116 0.002 0.000 Ethiopian Jews 4.1 × 10−57
blood 1 0.000 0.993 39.36 AFR E1b1b1
0.998 0.060
0.733 (M35)
0.940
0.000
0.003
0.000 0.000 Major: T
C8 1 ng 0.425 0.003 55.18 AFR Somalis 6.7 × 10−57
161 41 116 0.002 0.057 Subhaplo:
blood 0.9 0.000 0.997 41.82 SWA Ethiopian Jews 6.6 × 10−57
0.998 0.923 T1a (M70)
0.571
0.020Genes 2020, 11, 1398 13 of 24
Table 4. Cont.
Used SNPs p-Values
Maximum: Eye Color Hair Color Hair Shade Skin Color
V Pale Admixture
Sample and DNA Blond Population Likelihoods
Blue Pale Converge Y-Lineage
Material Input (DI) 163 41 120 Brown Light FROG (Highest)
Inter Inter (% Mean)
Ancestry Phenotype Y-SNPs Red Dark
Brown Dark
Black
B-Dark
0.000
0.007 Major: R
0.000 0.000 Hakka 3.9 × 10−54
C9 1 ng 0.246 0.014 92.40 EA Subhaplo:
163 41 115 0.007 0.998 Taiwanese Han 1.0 × 10−54
blood 1.6 0.000 0.986 7.60 EU R1b1a1b
0.993 0.002 SF Chinese 5.3 × 10−55
0.747 (M269)
0.000
0.084
0.001 Major: O
0.000 0.000
C10 1 ng 0.133 0.003 95.06 EA Lao Long Subhaplo:
161 41 115 0.003 0.976
blood 2.2 0.000 0.997 4.94 SA 4.2 × 10−53 O1b1
0.997 0.024
0.866 (F2320)
0.000
0.021
0.576 Major: R
0.911 0.489 Irish 2.7 × 10−47
C11 1 ng 0.379 0.917 92.84 EU Subhaplo:
162 41 108 0.057 0.475 Danes 1.4 × 10−47
blood 7 0.003 0.083 5.26 SWA R1b1a1b
0.032 0.011 Russians 1.1 × 10−47
0.042 (M269)
0.004
0.000
0.004
0.00 0.000 67.56 SWA Iranians 2.4 × 10−42 Major: I
C12 1 ng 0.311 0.004
163 40 116 0.004 0.019 29.35 EU Palestinian Arabs Subhaplo:
blood 1 0.000 0.996
0.996 0.965 3.09 SA 2.1 × 10−42 I2 (M438)
0.685
0.016
0.000
0.002 Major: E
0.000 0.054 Yoruba 1.1 × 10⁻²⁹
C13 1 ng 0.301 0.002 Subhaplo:
161 40 116 0.002 0.000 100 AFR Ibo 4.9 × 10⁻³⁰
blood 1 0.000 0.998 E1b1a1
0.998 0.005 Lisongo 2.1 × 10−0
0.697 (M2)
0.995
0.000
0.072 Major: R
0.012 0.000 56.77 EU
C14 1 ng 0.706 0.137 Subhaplo:
160 40 115 0.050 0.210 27.40 SA Iranians 9.1 × 10−53
blood 1.3 0.001 0.863 R1a1a1b2
0.938 0.339 15.83 OCE
0.221 (Z93)
0.452Genes 2020, 11, 1398 14 of 24
Table 4. Cont.
Used SNPs p-Values
Maximum: Eye Color Hair Color Hair Shade Skin Color
V Pale Admixture
Sample and DNA Blond Population Likelihoods
Blue Pale Converge Y-Lineage
Material Input (DI) 163 41 120 Brown Light FROG (Highest)
Inter Inter (% Mean)
Ancestry Phenotype Y-SNPs Red Dark
Brown Dark
Black
B-Dark
0.007
0.002 Major: Q
0.000 0.020 76.32 AME
C15 1 ng 0.211 0.004 Ecuadorian Mestizo Subhaplo:
163 41 116 0.003 0.644 15.06 SWA
blood 1 0.000 0.996 2.8 × 10−69 Q1b1a1a
0.997 0.332 8.62 AFR
0.787 (M3)
0.008
0.113
0.087
0.028 0.268 51.54 SWA Major: J
C16 1 ng 0.492 0.169
163 40 116 0.073 0.550 44.23 EU Druze 7.9 × 10−48 Subhaplo:
blood 0.8 0.001 0.831
0.899 0.045 4.23 SA J2a (M410)
0.420
0.024
0.000
0.001
0.000 0.000 Major: D
C17 1 ng 0.087 0.003 95.85 EA Koreans 5.5 × 10−54
163 40 116 0.003 0.997 Subhaplo:
blood 0.8 0.000 0.997 4.15 OCE Japanese 3.0 × 10−54
0.997 0.003 D1b (M55)
0.912
0.000Genes 2020, 11, 1398 15 of 24
Table 5. Summary of final predictions compared to available reference data.
Sample Phenotype Prediction Phenotype (Photo) Ancestry Prediction Place of Birth
Brown eyes
No data ADMIXED (AFR-SWA)
C1 Dark brown to black hair Eritrea
(body skeletonized) Likely: East Africa
Black skin
No data
C2 No prediction No prediction Eritrea
(body skeletonized)
Brown eyes
No data
C3 Light brown to brown hair High: Europe No data
(police investigation)
Pale to intermediate skin
Brown eyes
No data
C4 Light brown to brown hair High: Europe No data
(police investigation)
Pale to intermediate skin
Blue eyes
No data
C5 Red hair High: Europe Russia
(body decayed)
Pale skin
Brown eyes No data
High: Africa
C6 Black hair Black hair Burkina Faso
Likely: Central/West
Black skin Black skin
Brown eyes Brown eyes
ADMIXED (SWA-AFR)
C7 Black hair Black hair Eritrea
Likely: East Africa
Black skin Black skin
Brown eyes Brown eyes
ADMIXED (SWA-AFR)
C8 Black hair Black hair Ethiopia
Likely: East Africa
Dark skin Dark skin
Brown eyes Brown eyes
High: Asia
C9 Black hair Black hair China
High: East Asia
Intermediate skin Intermediate skin
Brown eyes Brown eyes
High: Asia
C10 Black hair Black hair Vietnam
High: East Asia
Intermediate skin Intermediate skin
Blue eyes
No data
C11 Blond to light blond hair High: Europe Brazil
(body decayed)
Pale to intermediate skin
Brown eyes ADMIXED
No data
C12 Black hair (SWA-EU-SA) Iraq
(body decayed)
Dark skin Likely: Southwest Asia
Brown eyes No data
High; Africa
C13 Black hair Black hair Nigeria
Likely: Central/West
Black skin Black skin
Brown eyes No data
ADMIXED
C14 Brown to dark brown hair Dark greying hair Afghanistan
(EU-SA-OCE)
Dark skin to black skin No data
Brown eyes No data ADMIXED
C15 Black hair Black hair (AME-SWA-AFR) Mexico
Intermediate to dark skin Intermediate skin Likely: South America
Brown eyes No data ADMIXED
C16 Dark brown to black hair Dark greying hair (SWA-EU-SA) Iran
Pale to intermediate skin Intermediate skin Likely: Southwest Asia
Brown eyes No data
High: Asia
C17 Black hair Dark greying hair Japan
High: East Asia
Intermediate skin Intermediate skinGenes 2020, 11, 1398 16 of 24
Phenotype predictions were possible for all casework samples tested, with the exception of one
sample, a bone with 31 pg of input DNA and a consensus profile containing only 12 markers which
was not enough for HPS tool to perform a prediction. Accuracy (AUC) loss was observed for skin
color prediction for eight samples; however, AUC loss was low (max. 0.003) and did not affect the final
predictions. Out of 13 blood samples, four samples had predictions of all phenotypic traits (eye, hair,
and skin color) that aligned with the available reference data. For six blood samples, reference data on
hair and skin color were only available and the predicted results were in agreement with the reference
data. The rest of the samples had no comparison data (decay, skeletonization, crime scene).
The final ancestry prediction was based on the results of admixture analysis (Converge), population
likelihoods calculation (FROG), and Y-lineage analysis (Converge). The predicted phenotype from
the HIrisPlex-S tool was also taken into consideration. Ancestry assignment was described on two
levels, inter- and intracontinental (Europe, Africa, Asia, America, Oceania) or admixed, and by
adding the relative probability of the prediction as “high” or “likely” depending on the obtained data.
Predictions were designated as “high” if all ancestry and the phenotype estimates were in agreement.
For predictions classified as “likely”, the phenotype prediction strongly correlated with only part of the
ancestry data (for example, admixed individuals). Of 17 casework samples, one was not interpreted
(Sample C2), a bone sample for which only 40% of the ancestry markers were typed. From the
remaining 16 samples, nine were assigned biogeographical ancestry on an inter/intracontinental level
and seven were described as admixed. The comparison of 15 autopsy samples to the available ancestry
reference data revealed that for 12 samples, the predicted origin of the individuals corresponded
with the place of birth and one sample had an incorrect prediction. For the sample with an incorrect
prediction, the genetic data suggested European ancestry, however the self-reported place of birth was
Brazil (no further information about the individual was available).
4. Discussion
The first studies introducing phenotype and ancestry prediction to forensics [3,20,23,40–44]
have prompted the discovery of new markers and methods that have been published in the scientific
literature [10–13,15,21,45]. The continual development of DNA analysis technology goes hand in
hand with a discussion beyond DNA itself, leading to a debate about the ethics and laws behind
forensic phenotyping [46–51]. Despite great interest in the topic, concerns have been raised against
the new forensic approach. The main purpose of predicting phenotype and ancestry is to include
DNA as an additional, or sometimes the only, “eyewitness” and to compare the data it provides to the
information gathered by police. The understandable concern is that predictions might be incorrect or
wrongly interpreted and they could negatively affect the investigation by introducing bias. Predictions
regarding the biogeographical ancestral origin of a sample are very complex, since the “ancestry”
of an individual can be interpreted on many different levels. The results of ancestry prediction by
DNA analysis alone only provides information about a person’s biogeographical history at the genetic
level. Non-genetic events such as a change in the place of residence, a change in citizenship, or an
adoption (also in previous generations) are not always common knowledge. Additionally, in the case
of phenotype predictions, it must be taken into account that the results and their interpretation can be
faced with some discrepancies due to biased perceptions. As an example, hair color is subjective and
predictions of dark blonde hair color can be described subjectively as brown. Hair and eye color can
also be artificially altered by dying one’s hair or wearing colored contacts. However, if we consider
skepticism towards the information provided by DNA, we should also consider the limitations of
relying on real eyewitnesses only [52,53]. With no solution being absolutely faultless, the final question
is if DNA can lead or mislead the search for a suspect when dealing with cold cases. In an attempt to
investigate this question, we present not only the results of testing our custom SNP panel on known
reference samples but also a blind study performed on real casework samples. This approach was used
in order to better understand the value of ancestry and phenotype predictions, as well as evaluate the
accuracy of the information that would be provided to police investigators.Genes 2020, 11, 1398 17 of 24
As mentioned previously, the accuracy of the predictions depends on many factors including
the number and type of markers used and how sensitive and reliable those sets are. Until recently,
markers associated with phenotype and ancestry were studied separately, with the exception of the
commercially available ForenSeq DNA Signature Prep Kit (Verogen). The newly published panel from
the VISAGE consortium [53,54] is the first MPS-based solution combining phenotype and ancestry
predictions, compatible with two MPS platforms (Ion S5, Thermo Fisher Scientific and MiSeq FGx,
Verogen). The assay consists of 153 autosomal phenotype and ancestry-informative SNPs, compared to
200 autosomal and 120 Y-chromosomal targets included in the presented Ion AmpliSeq Phenotrivium
panel. The sensitivity studies for the VISAGE assays showed that no drop-outs were observed down to
100pg for the AmpliSeq assay and down to 125 pg for the MiSeq platform [54,55]. In the presented study,
only one autosomal SNP (rs1470608) dropped out at 125 pg input due to low coverage. Observations
about the weak amplification rate of rs1470608 have been previously reported in the development
of the SNapShot and MPS versions of the HIrisPlex-S (HPS) Panel [11,17,56]. However, the drop-out
of rs1470608 causes minimal AUC loss of 0.001 and does not affect the final skin color prediction.
We observed that starting with 31 pg of DNA input, drop-in alleles passed the thresholds to call an SNP,
causing incorrect genotyping. When working with the same DNA quantity obtained from a degraded
bone, a consensus profile did not allow for phenotype prediction, demonstrating the strong impact
of DNA quality. A study from Kukla-Bartoszek and Szargut [56] also presents the results of forensic
phenotyping of high degraded bone samples and suggests that full genotypes can be obtained down to
50 pg of DNA input. In the case of the mentioned study, an additional challenge was a lack of reference
data for most of the individuals (almost all of the remains belonged to the victims of communism
crimes in Poland in the 1950s) so the reliability of the predictions could not be entirely evaluated.
Based on our results and HPS interpretation guidelines, we were able to establish an internal
pipeline to be used for unknown samples. The prediction model developed by HPS authors has
undergone forensic developmental validation and shows an accuracy of 80% for eye color, 77 % for
hair color, and 80% for skin color prediction. The values obtained through our own internal validation
were similar or higher than the suggested values obtained in the HPS developmental validation.
The predictions we obtained for the casework samples used in this study were compared with the
available premortem data about the studied individuals and suggested a high degree of correctness of
predicted phenotypes.
In addition to concerns associated with the use of forensic DNA phenotyping, predicting one’s
biogeographical ancestry for criminal investigations has additional reservations due to the possibility
of investigational bias. As previously mentioned, the concept of “ancestry” is complex and can lead to
many misunderstandings, which has been well recognized by scientists [57,58]. Naturally, it raises
more concerns when considered as a potential investigative lead in police work. In the case of forensics,
the complexity of one’s ancestry suffers from an additional factor, which is the quality of DNA that
forensic scientists deal with. The detection of ancestry admixture and the understanding of predicted
outcomes can be affected by incorrect genotyping caused by SNP drop-out, and allele drop-in and
drop-out, commonly encountered with degraded and/or low-input DNA. However, over the years, a few
compact sets of SNPs were developed and suggested for forensic purposes [3,44,59,60], accompanying
different analysis approaches that are recommended for biogeographical ancestry prediction [61–64].
In the Ion AmpliSeq™ PhenoTrivium panel, 163 autosomal ancestry-informative SNPs from the
Precision ID Ancestry Panel were included, which has been tested on various ethnic groups [65–68].
Among the markers within the panel, 55 SNPs are known as the KiddLab Set, which are also present in
the ForenSeq DNA Signature Prep Kit [69,70] and the VISAGE assay [54,55]. The remaining markers
correspond with a set established by the Seldin group [59,71]. A widely known golden standard in
population structure analysis and ancestry inference is an open source software known as STRUCTURE
by the Pritchard Lab, Stanford University. However, becoming familiar with the software’s algorithm
can be challenging for less experienced researchers, especially if they are based solely in forensics and
not familiar with advanced population genetics. As also observed by others, the results produced byGenes 2020, 11, 1398 18 of 24
STRUCTURE can be overinterpreted and this is one of the fears in using ancestry predictions in police
investigations [72]. In the presented study, we evaluated the effectiveness and reliability of ancestry
predictions based on admixture analysis performed by user-friendly Converge software when using
the previously described SNP set. The predictions are based on a maximum likelihood approach that
is used to calculate the most likely admixture proportions across the seven root populations of Africa,
East Asia, South Asia, Southwest Asia, Europe, America, and Oceania. The predictions are bootstrapped
across a random subset of SNPs to capture uncertainty in the predictions. For the validation of the
discussed workflow, we collected 140 known reference samples that came from volunteers living
in the federal state of Bavaria. Based on the information provided by volunteers, we divided the
collected samples in to three categories: Europe (EU), non-European (non-EU), and admixed. All of
the individuals assigned to the first group were correctly predicted to be European, with some of them
showing Southwest Asian admixture (up to over 30%). The high SWA admixtures were inferred for
around 20% of the samples declared to be German (all from South Germany) and among Southeast
Europeans (Albania, Bulgaria, former Yugoslavia). The Bayesian and PCA analysis done by SNIPPER
assigned all the samples as 100% EU but the available reference grid used for the predictions does
not include SWA populations. The detection of Southwest Asian admixture in European samples,
especially in the southeast region of Europe, corresponds with similar findings from other studies
and may be explained as a consequence of earlier human migrations when the farmers from Anatolia
and Western Asia spread throughout Europe [73–75]. Of the individuals classified as non-European,
none declared admixed ancestry. For almost all of the samples, Converge detected admixture of
two or even three reference populations; however, the results reflected the genetic origin of the
samples when historical migration patterns are taken into account. The admixtures detected for the
studied individuals correspond with extensive studies concerning the populations of interest [76–81].
Additionally, for the remaining European individuals with confirmed mixed ancestry, the analysis
showed that the detected admixtures reflect their non-European origin. Only one sample showed a
surprising prediction, namely the individual of European and South American ancestry. The obtained
results can be explained not by the data provided in the questionnaire but by population studies that
try to explain the complexity of ancestry by understanding migration patterns and historical events.
For this sample, an admixture of European and African ancestry was predicted by Converge, in contrast
to the expected admixture of European and American reported by the individual. Volunteers were
asked to specify any additional details about their heritage but were not expected to be familiar with
their complete genetic heritage. The presence of African lineages in Latin America is a well-studied
topic [82,83] and corresponds with the African admixture detected for the studied individual.
The complexity of admixture detection and interpretation is a complicated issue from a scientific
point of view and can be more problematic when the information may be shared with police
investigators for use in criminal investigations. Therefore, based on the studies performed, we included
ancestry inference in the form of relative population likelihoods calculated by FROG-kb and, for male
individuals, paternal lineage analysis results in our final interpretation pipeline, all in order to have
a better understanding of the predicted ancestry due to the complexity of biogeographical ancestry
prediction. This approach, combined with phenotype predictions, was tested on real casework samples.
The challenging aspects of this study were not limited to the quantity and quality of the DNA, but also
the blinded aspect of the study. The comparison of the estimated phenotype and ancestry predictions
with available reference data revealed high correctness of the predictions, but also pointed out the
possible limitations in using phenotype and ancestry predictions as investigative leads for police.
5. Conclusions
This study presents the evaluation of the Ion AmpliSeq™ PhenoTrivium Panel and Converge™
Software for use in forensic investigations. The assay contains 200 autosomal and 120 Y-chromosomal
SNPs, allowing for predictions of phenotype, biogeographical ancestry, and male lineage. The panel
demonstrated to be a sensitive assay, which provides reliable predictions down to 125 pg of DNAGenes 2020, 11, 1398 19 of 24
input. Biogeographical ancestry and phenotype predictions were possible down to 62 pg but are to
be interpreted with caution. Samples with less DNA, especially degraded ones, were treated as not
suitable for forensic phenotyping. The results provide a basis for an analysis pipeline to combine
ancestry and phenotype predictions using a combination of Converge™ Software, SNIPPER and
Frog-kb for ancestry analysis, and the HIrisPlex-S webtool for phenotype analysis. Y-chromosomal
lineage markers added informative data about male individuals and aided in a better understanding of
the ancestry predictions. Future research could explore the use of additional haploid markers, such as
mitochondrial DNA, together with autosomal markers to assess the amount of informativeness when
combining autosomal and haploid markers together for analysis. The Ion AmpliSeq™ PhenoTrivium
Panel, covering 200 autosomal markers and 120 Y-SNPs, will be available as a community panel via
https://ampliseq.com/.
Supplementary Materials: The following are available online at http://www.mdpi.com/2073-4425/11/12/1398/s1,
Table S1: The list of autosomal SNPs used in the panel design, Table S2: The list of the Y-chromosomal SNPs used in
the panel design, Table S3: Mean coverage obtained for autosomal markers through the sensitivity study, Table S4:
Mean coverage obtained for Y-chromosomal markers through the sensitivity study, Table S5: Mean coverage
obtained for autosomal markers for casework samples, Table S6: Mean coverage obtained for Y-chromosomal
markers for casework samples, Figure S1: Heatmaps summarizing the performance of the panel based on the
consensus genotypes/haplotypes obtained through the sensitivity study. Table S7: Detailed performance of the
autosomal markers for calling genotypes.
Author Contributions: Conceptualization, M.D., B.B., J.L., R.L., K.A.; validation, all authors; formal analysis,
M.D.; investigation, M.D., B.B., R.S., K.S.; writing—original draft preparation, M.D.; writing—review and editing,
all authors. All authors have read and agreed to the published version of the manuscript.
Funding: This research was partially funded by the Baur-Stiftung Foundation.
Acknowledgments: The authors thank all the volunteers who willingly donated their DNA samples for this study.
Conflicts of Interest: Author M.D. received part of reagents used in the study from Thermo Fisher Scientific.
Two co-authors (J.L. and R.L.) are employees of Thermo Fisher Scientific which manufactures and sells the reagents,
consumables, and equipment used in this study.
References
1. Gettings, K.B.; Lai, R.; Johnson, J.L.; Peck, M.A.; Hart, J.A.; Gordish-Dressman, H.; Schanfield, M.S.;
Podini, D.S. A 50-SNP assay for biogeographic ancestry and phenotype prediction in the U.S. population.
Forensic Sci. Int. Genet. 2014, 8, 101–108. [CrossRef] [PubMed]
2. Nievergelt, C.M.; Maihofer, A.X.; Shekhtman, T.; Libiger, O.; Wang, X.; Kidd, K.K.; Kidd, J.R. Inference of
human continental origin and admixture proportions using a highly discriminative ancestry informative
41-SNP panel. Investig. Genet. 2013, 4, 13. [CrossRef] [PubMed]
3. Phillips, C.; Parson, W.; Lundsberg, B.; Santos, C.; Freire-Aradas, A.; Torres, M.; Eduardoff, M.; Børsting, C.;
Johansen, P.; Fondevila, M.; et al. Building a forensic ancestry panel from the ground up: The EUROFORGEN
Global AIM-SNP set. Forensic Sci. Int. Genet. 2014, 11, 13–25. [CrossRef] [PubMed]
4. Santos, C.; Phillips, C.; Fondevila, M.; Daniel, R.; Van Oorschot, R.A.; Burchard, E.G.; Schanfield, M.S.;
Souto, L.; Uacyisrael, J.; Via, M.; et al. Pacifiplex: An ancestry-informative SNP panel centred on Australia
and the Pacific region. Forensic Sci. Int. Genet. 2016, 20, 71–80. [CrossRef]
5. Pereira, V.; Mogensen, H.S.; Børsting, C.; Morling, N. Evaluation of the Precision ID Ancestry Panel for crime
case work: A SNP typing assay developed for typing of 165 ancestral informative markers. Forensic Sci.
Int. Genet. 2017, 28, 138–145. [CrossRef]
6. Bulbul, O.; Filoglu, G. Development of a SNP panel for predicting biogeographical ancestry and phenotype
using massively parallel sequencing. Electrophoresis 2018, 39, 2743–2751. [CrossRef]
7. Phillips, C.; Freire-Aradas, A.; Kriegel, A.K.; Fondevila, M.; Bulbul, O.; Santos, C.; Serrulla Rech, F.;
Perez Carceles, M.D.; Carracedo, A.; Schneider, P.M.; et al. Eurasiaplex: A forensic SNP assay for
differentiating European and South Asian ancestries. Forensic Sci. Int. Genet. 2013, 7, 359–366. [CrossRef]
8. Shi, C.-M.; Liu, Q.; Zhao, S.; Chen, H. Ancestry informative SNP panels for discriminating the major East
Asian populations: Han Chinese, Japanese and Korean. Ann. Hum. Genet. 2019, 83, 348–354. [CrossRef]You can also read