Photophysiology and Spectroscopy of Sun and Shade Leaves of Phragmites australis and the Effect on Patches of Different Densities - MDPI
←
→
Page content transcription
If your browser does not render page correctly, please read the page content below
remote sensing
Article
Photophysiology and Spectroscopy of Sun and Shade
Leaves of Phragmites australis and the Effect on
Patches of Different Densities
Dimitris Stratoulias 1,2         and Viktor R. Tóth 3, *
 1    Department for Management of Science and Technology Development, Ton Duc Thang University, Ho Chi
      Minh City, Vietnam; dimitris.stratoulias@tdtu.edu.vn
 2    Faculty of Applied Sciences, Ton Duc Thang University, Ho Chi Minh City, Vietnam
 3    Balaton Limnological Institute, Centre for Ecological Research, Tihany 8237, Hungary
 *    Correspondence: toth.viktor@okologia.mta.hu; Tel.: +36-87-448244; Fax: +36-87-482006

 Received: 31 October 2019; Accepted: 31 December 2019; Published: 6 January 2020

 Abstract: Remote sensing of vegetation has largely been revolving around the measurement of
 passive or active electromagnetic radiation of the top of the canopy. Nevertheless, plants hold a
 vertical structure and different processes and intensities take place within a plant organism depending
 on the environmental conditions. One of the main inputs for photosynthesis is photosynthetic active
 radiation (PAR) and a few studies have taken into account the effect of the qualitative and quantitative
 changes of the available PAR within the plants canopies. Mostly large plants (trees, shrubs) are
 affected by this phenomena, while signs of it could be observed in dense monocultures, too. Lake
 Balaton is a large lake with 12 km2 dense reed stands, some of which have been suffering from reed
 die-back; consequently, the reed density and stress condition exhibit a vertical PAR variability within
 the canopy due to the structure and condition of the plants but also a horizontal variability attributed
 to the reedbed’s heterogeneous density. In this study we investigate the expression of photosynthetic
 and spectroscopic parameters in different PAR conditions. We concentrate on chlorophyll fluorescence
 as this is an early-stage indicator of stress manifestation in plants. We first investigate how these
 parameters differ across leaf samples which are exposed to a higher degree of PAR variability due to
 their vertical position in the reed culm (sun and shade leaves). In the second part, we concentrate on
 how the same parameters exhibit in reed patches of different densities. We then look into hyperspectral
 regions through graphs of coefficient of determination and associate the former with the physiological
 parameters. We report on the large variability found from measurements taken at different parts
 of the canopy and the association with spectral regions in the visible and near-infrared domain.
 We find that at low irradiance plants increase their acclimation to low light conditions. Plant density
 at Phragmites stands affects the vertical light attenuation and consequently the photophysiological
 response of basal leaves. Moreover, the hyperspectral response from the sun and shade leaves has
 been found to differ; charts of the coefficient of determination indicate that the spectral region around
 the red-edge inflection point for each case of sun and shade leaves correlate strongly with ETRmax
 and α. When analysing the data cumulatively, independent of their vertical position within the stand,
 we found correlations of R2 = 0.65 (band combination 696 and 651) and R2 = 0.61 (band combination
 636 and 642) for the ETRmax and α, respectively.

 Keywords: reed; spectroscopy; chlorophyll fluorescence; photosynthesis; foliar density; PAR

1. Introduction
     Light is the primary source of energy for plants, affecting their growth, development and structure
in both terrestrial and aquatic settings, and creating strong selection pressure through its variability [1–3].

Remote Sens. 2020, 12, 200; doi:10.3390/rs12010200                          www.mdpi.com/journal/remotesensing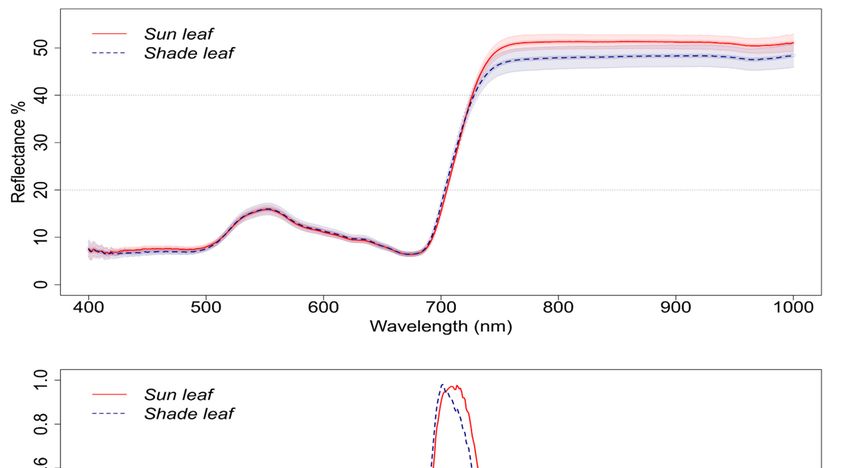
Remote Sens. 2020, 12, 200                                                                             2 of 18

Adequate response to light is of central importance for plants since either a suboptimal or an excessive
amount of it could result in significant decrease of its fitness; therefore, low-light and high-light
adaptation processes in plants have been discovered and studied [4,5]. It has been observed since a
long time ago that plants which grow under a shaded environment and plants which grow under high
light intensities exhibit distinguished photosynthetic activity and efficiency [6]; moreover, individual
leaves, as a functional unit of biomass production, are utilising and being affected by the intensity and
spectral composition of the sunlight. This successful adaptation to different light intensities at the
apical and basal parts of the plant is possible due to greater flexibility of foliar responses and, thus,
more effective light capture. Eventually, the constant competition for light harvesting results to an
additional increase in spatial and temporal foliar variability that alters the architecture of individual
plants [3,7]. Consequently, for instance, Lichtenthaler et al. [8] studied the pigment composition and
photosynthetic activity of deciduous and coniferous plants and concluded that the sun leaves of all
tree species were thicker, with lower specific leaf area and water content and higher total chlorophyll
a + b and carotenoid content per leaf area unit compared to the shade leaves. Schultz [9], in a study
measuring the reflectance of grapevine (Vitis vinifera L.) leaves, reports that reflectance was highest at
the beginning of the season for apical leaves and at the end of the season for basal senescent leaves,
evidencing the temporal changes occurring. In another old study, Gausman [10] measured total defuse
reflectance over the 500–750 nm spectral window on Valencia orange (Citrus sinensis (L.) Osbeck) leaves
and indicated that there are considerable differences between the shade and sun leaves of the specific
species. For a review on the changes induced by conditions of sun (high light) and shade (low light) on
the process of photosynthesis, the reader is directed to Mathur et al. [11].
      A prime example of species which demonstrates a wide variability of available photosynthetically
active radiation (PAR) in its structure is that of common reed (Phragmites australis (Cav.) Trin. ex Steudel).
Phragmites is a widespread tall rhizomatous perennial grass [12] growing in wetland environments [13].
It typically forms dense reedbeds which allow only a fraction of the available PAR to reach the basal
parts of the plant, hence, its architecture inherits differing conditions in the vertical PAR availability.
Moreover, different patches of reedbed, depending on the environmental conditions, may grow in
different densities, diversifying the horizontal PAR availability as well.
      On this note, since the beginning of the 1960s, a decline of the reed area, especially in the waterward
side of the stands, has been observed in several parts of Europe [14,15]. This phenomenon, known
as reed die-back syndrome, was first scientifically documented in 1951 (as cited by Ostendorp [16])
and scientific interest has been brought up. Reed die-back is manifested through reduced plant
height, weaker culms, abnormal rhizomes, formation of clumps [17], gradual thinning, natural
degeneration and retreat from relatively deep water [15]. Consequently, reed die-back is inducing
spatial fragmentation and, therefore, altering the density, the natural horizontal (zonation) and vertical
structure of the reed stand.
      Photosynthesis is the plant’s prime process of light harvesting; incident solar energy is absorbed
by leaves and through a system of energy transfers is converted to chemical energy that sustains the
organism’s functions and eventually leads to biomass accumulation. The first step of this energy
transfer (the absorption of light) is performed by photosystems of autotrophs that regulate not
only the absorption, but also the dissipation of the unused energy within the photosynthetic organ.
One of the tools for assessing the dynamic changes occurring in the photosystems is chlorophyll
fluorescence [18,19]. Emphasis on research on chlorophyll fluorescence and photosynthesis has
increased the last decades, indicated by the steep increase from 1990 onwards of the number of
publications relating to the keywords aforementioned [20].
      Remote sensing has been long used in vegetation studies in a variety of applications and, currently,
an abundance of data and tools are available to ecologists [21,22]. For instance, hyperspectral data
is essentially the most detailed representation of the spectrum and, hence, can provide a wealth of
information at canopy and foliar levels likewise. However, in the context of vegetation monitoring,
the majority of the spectral information, which is materialized as vegetation indices, is constructed to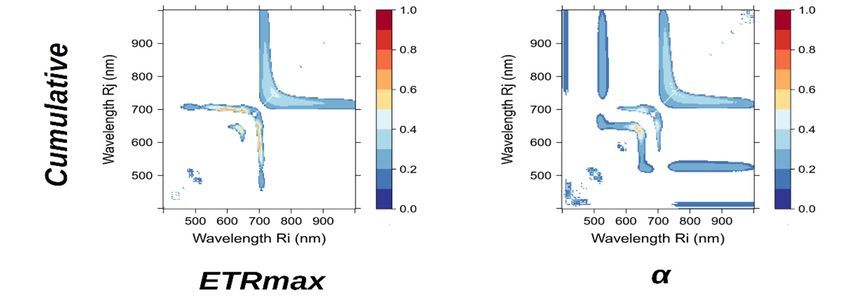
Remote Sens. 2020, 12, 200                                                                            3 of 18

relate to vegetation traits other than photosynthesis; for instance, chlorophyll content has been a feature
suggested to be approximated by the ratio of reflectances at the red-edge wavelengths at 750 nm and 710
nm (i.e., R750/R710) by Zarco-Tejada et al. [23], R750/R550 and R750/R700 by Gitelson and Merzlyak [24]
and the empirical indices modified Normalized Difference Vegetation Index (mNDVI) [25], the Plant
Senescence Reflectance Index (PSRI) [26] and the Structure Insensitive Pigment Index (SIPI) [27], just to
name a few. Other traits have also been related, such as xanthophyll with the Photochemical Reflectance
Index (PRI) [28]. Another variable frequently attempted to relate to spectroscopic information is
the poor performance of the plant in terms of the photo-efficiency, which is generically named as
“stress”. In any case, it is not a mainstream procedure that the physiology/photosynthetic process
of the plant is directly associated to the spectral information; despite the fact that both chlorophyll
fluorescence and remote sensing are quite established techniques, only lately this field is gaining
attention (e.g., [22,29–32]). This has mainly taken place in the context of passive remote sensing
targeting the analysis of sun induced fluorescence features (e.g., [33]), which are a precursor sign of
plant stress and reduced photosynthetic activity. Narrow-band PRI has been proposed to assess PS II
Light-Use Efficiency (LUE) [34] and suggested as a good proxy for photosynthetic efficiency at different
spatial and temporal scales [35]; however, PRI may vary and depends on environmental conditions
such as nutrients, water status or temperature [36]. Other studies have reported strong correlation
of popular empirical indices, such as the the Normalized Difference Vegetation Index (NDVI), with
canopy photosynthesis (e.g., [37,38]). In a recent study Dechant et al. [39] suggest that nitrogen
content is the dominant mechanism through which photosynthesis is related to leaf reflectance spectra;
they also argue that their method is applicable to many tree species and both sun and shade leaves.
Finally, in the context of foliar and plant density, another important application of earth observation is
mapping the density variability with remote sensing images. The explanation of this variability might
be related to spectral indices. This spatio-temporal exhibition is especially suitable for the study of
emergent macrophytes.
     This papers studies the expression of the photosynthetic and spectroscopic parameters in different
PAR conditions; more specifically, we focus on two aspects. First, we measure certain physiological
and hyperspectral parameters from Phragmites leaf samples, which are exposed to a different degree of
available PAR due to their vertical position in the reed culm (sun and shade leaves) and we investigate
if and how the parameters differ and associate with each other. In the second part, we look into the
exhibition of these parameters on leaves grown in reed patches of different densities.

2. Materials and Methods

2.1. Study Site
      Lake Balaton is a large (596 km2 ) and relatively shallow (average water depth 3.5 m) freshwater
lake located in Central Europe. Extended and continuous populations of helophytic perennial plants
at the littoral zone of the lake form reed stands scattered along 112 km of the 240 km of the total
shoreline [40,41]. The reed stands cover cumulatively an area of approximately 16 km2 with the majority
of it (73%—12 km2 ) encountered at the northern part of the shore. The steep windward northern
shore’s sediment consists of dolomite limestone, while the shallow southern shore is dominated by
sandy sediment. On the northern shore of the lake the average and maximum depth of water that reed
stand can be found is 1.5 m and 2.4 m respectively, while on the southern shore the average depth on
the waterward side of reed stands is 1 m [40,41]
      Lake Balaton has received significant scientific attention due to the reed die-back phenomenon
observed (e.g., [40–43]), the macrophytic traits and species mapping (e.g., [44–47]) and the dynamic
trophic gradient of the water (e.g., [48,49]). The field data for this study were collected at the Kerekedi
bay, an oligo-mesotrophic bay at the easternmost basin of Lake Balaton situated at the geographic
coordinates 46◦ 580 2.8400 N, 17◦ 550 4.3400 E (Figure 1). The main species encountered there are Phragmites
australis, Carex sp., Typha angustifolia, Typha latifolia and Bolboschoenus sp. The survey took place under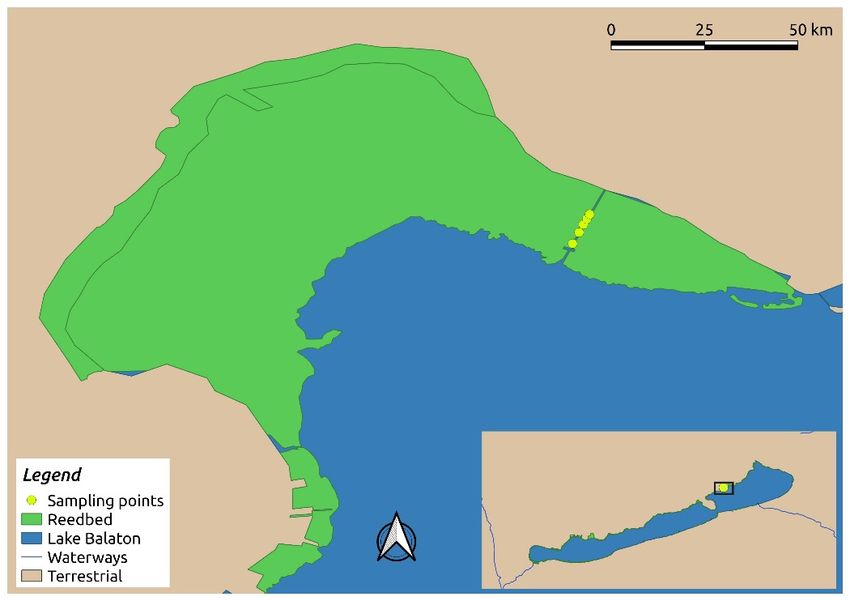
Remote
Remote Sens.
       Sens. 2020,
             2020, 12,
                   12, x200
                         FOR PEER REVIEW                                                                        44of
                                                                                                                   of 21
                                                                                                                      18

australis, Carex sp., Typha angustifolia, Typha latifolia and Bolboschoenus sp. The survey took place under
clear sky
      sky conditions
           conditionsbetween
                        between10:00
                                  10:00and 13:00
                                         and     local
                                             13:00      time
                                                    local    (Central
                                                           time       European
                                                                (Central         Time)
                                                                          European      on 14–15
                                                                                     Time)          August
                                                                                             on 14–15      2012.
                                                                                                         August
This period
2012.         falls within
      This period          the peak
                    falls within the of theof
                                     peak   vegetation    growing
                                              the vegetation      and alland
                                                               growing     species are at are
                                                                             all species  full at
                                                                                               growth.
                                                                                                  full growth.

     Figure 1.
     Figure    Mapof
            1. Map  of the
                        the study
                             study area
                                   area in
                                         in Lake
                                            Lake Balaton
                                                 Balaton (inset)
                                                         (inset) and
                                                                 and field
                                                                     field sampling
                                                                           sampling points’
                                                                                    points’ location
                                                                                            location in
                                                                                                     in the
     Kerekedi Bay (main).

2.2. Data
2.2.  Data Survey
           Survey
       Chlorophyll fluorescence
       Chlorophyll     fluorescence andand spectroradiometric
                                             spectroradiometric measurements
                                                                     measurements were    were collected
                                                                                                  collected along
                                                                                                             along aa
perpendicular-to-the-shore transect.
perpendicular-to-the-shore        transect. Two
                                              Two types
                                                    types ofof measurements
                                                               measurements were were performed
                                                                                         performed on      Phragmites
                                                                                                       on Phragmites
plants   on-site. Firstly, the largest fully  emerged    green  apical and  the  largest   intact green  basal
plants on-site. Firstly, the largest fully emerged green apical and the largest intact green basal leaves,     leaves,
of approximately     4  m  high plants  in a dense  (>80  plants  m−2 ) and non-degrading stand, were selected.
of approximately 4 m high plants in a dense (>80 plants m−2) and non-degrading stand, were selected.
These leaves
These   leaves are
                are referred
                    referred to
                              to thereafter
                                 thereafter as
                                             as the
                                                the sun
                                                    sun (youngest,
                                                         (youngest, mature,
                                                                     mature, apical)
                                                                               apical) and
                                                                                         andshade
                                                                                              shade(oldest,
                                                                                                      (oldest,mature,
                                                                                                              mature,
basal,  green)  leaves,  respectively. Second,    photophysiological    parameters   of   oldest,
basal, green) leaves, respectively. Second, photophysiological parameters of oldest, mature, basal,mature,  basal, still
green   leaves of  Phragmites   were determined     in reed  patches of  varying   density.   The  plant
still green leaves of Phragmites were determined in reed patches of varying density. The plant density    density  was
estimated
was         fromfrom
      estimated    a photograph    captured
                         a photograph         at ground
                                          captured        level (water
                                                     at ground          or soil)or
                                                                 level (water    from
                                                                                   soil)anfrom
                                                                                            upward    lookinglooking
                                                                                                an upward     camera.
camera.
2.2.1. Photophysiological Measurements
       The light response curves (i.e., the electron transport rate (ETR) of photosystem II (PSII) as a
function of PAR intensity) of leaves were measured with a pulse amplitude modulated chlorophyll
fluorometer (PAM-2500, Heinz Walz GmbH, Effeltrich, Germany). A 20 min dark adaptation period
was applied in the beginning of the routine and the same actinic light was used for both sun and shade
leaves. First, the fluorescence values were detected for a dark adapted leaf with a pulse of a saturated
light (630 nm, intensity 3000 µmol m−2 s−1 ). Thereafter, the leaves were exposed to 11 actinic lights
(at 5, 9, 67, 104, 144, 201, 274, 366, 477, 622 and 788 µmol m−2 s−1 intensity, see Figure 2) at 630 nm
wavelength with a duration of 15 s; subsequently, the fluorescence values were measured after each
illumination step with a new pulse of saturated light (3000 µmol m−2 s−1 ). During this process the
minimal (F0 ) and maximal (Fm ) fluorescence yield of a dark-adapted leaf, as well as the fluorescence
yield (F), maximal fluorescence yield (Fm ’) during saturation pulse and minimal fluorescence yield
(F0 ’) of a pre-illuminated sample were determined. The equipment calculated other parameters using
these fluorescence yields (Table 1).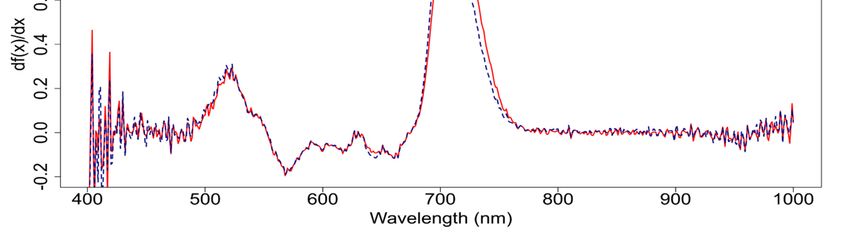
Remote Sens. 2020, 12, x FOR PEER REVIEW                                                                         6 of 21
Remote Sens. 2020, 12, 200                                                                                        5 of 18

      Figure2.2. Light
     Figure       Light curve
                         curve of
                                ofphotophysiological
                                   photophysiological parameters
                                                          parameters of
                                                                     of the
                                                                         the sun
                                                                              sun(black
                                                                                  (blackcircles)
                                                                                          circles)and
                                                                                                   andshade
                                                                                                        shade(open
                                                                                                              (open
      circles)leaves
     circles)  leaves of
                      of Phragmites australis.
                                     australis. The
                                                 The± ±Standard Deviation
                                                         Standard Deviation (SD) (n (n
                                                                               (SD)    = 15)
                                                                                    = 15) is also indicated
                                                                                              is also       for each
                                                                                                      indicated  for
      measurement.
     each  measurement.
Remote Sens. 2020, 12, 200 6 of 18
Table 1. Fluorescence parameters calculated from PAM fluorometry. The equations contain the
minimum (F0 ) and the maximum (Fm ) fluorescence yields, the apparent (Fs ) and maximum (Fm 0 ) values
of fluorescence, the irradiance value (I) and the empirical absorption factor (AF = 0.84). For more
information the reader is directed to the cited literature.
Parameter Name Equation
qP photochemical quenching (Fm − F)/(Fm 0 − F0 0 )
0
qN non-photochemical quenching 1 − (Fm 0 − F0 0 )/(Fm − F0 )
Y(II) quantum yield of PSII (Fm 0 − F)/(Fm 0 )
ETR electron transport rate (Fm − F)/(Fm 0 )·I·AF·0.5
0
2.2.2. Spectroradiometric Measurements
The reflectance values of sun and shade Phragmites leaves were recorded using a hand-held ASD
portable FieldSpec 2 spectroradiometer (Analytical Spectral Devices Inc., Boulder, Colorado, USA).
The instrument records radiation intensity in 750 consecutive narrow-bands between 325 nm and 1075
nm with a spectral resolution of less than 3 nm at 700 nm. Leaf reflectance values were acquired with
the ASD leaf clip attached to the device with an optical fibre. The source of light was integrated in the
leaf clip and the black reference panel on the opposing side was used to calibrate the instrument in
order to convert the recorded radiance values to reflectance. For each leaf sample 10 measurements
were recorded from the same point at 544 ms integration time and then averaged. Three positions of
the leaf were identified (i.e., next to the stem, middle of the leaf and upper third of the leaf) which
did not yield any statistical differences in reflectance values (data not shown here), therefore, the
measurements from the upper third of the leaf blade were used.
2.3. Data Analysis
The mean values of the photophysiological properties of sun and shade leaves were compared on
the basis of the Student’s t-test and the Mann-Whitney Rank Sum test. The measurements were taken
from the same position as the hyperspectral measurements aforementioned. Parameters were correlated
with Pearson and Spearman Rank Order correlations. The light response data were fitted with an
exponentially saturating curve [50] with the method of the least squares applied on exponential rise;
subsequently, the maximum ETR (ETRmax ), theoretical saturation light intensity (Ik ) and the maximum
quantum yield for whole chain electron transport at low radiation (α) were retrieved [18]. The analysis
was performed in the statistical software R version 2.15.3 [51]. Sigma Plot v 12.5 (Systat Software Inc.,
San Jose, California, USA) was used for the curve fitting and the production of the graphics.
The hyperspectral data were first exported using the software ViewSpec Pro 6.0 (Analytical
Spectral Devices Inc., Boulder, Colorado, USA) and the marginal wavelengths at 325–400 nm and
1000–1075 nm from all spectra were removed as they contained a high level of noise. Subsequently, the
spectra were divided in shade and sun samples according to the collection protocol and the curve of
the mean and standard deviation of the reflectance value for each group was plotted. Moreover, the
first derivative of the mean value was explored and the wavelength of the inflection point (λp ) was
used as the measure of the position of the red-edge reflectance critical value. Thereafter, the exhaustive
combination of spectral indices for all spectral bands, as in similar studies (e.g., [22,52,53]), was
calculated based on the mathematical formula:
NDSI(i,j) = (Ri − Rj)/(Ri + Rj)
where NDSI is the Normalised Difference Spectral Index (NDSI) and Ri and Rj are the reflectance values
for bands i and j, respectively. Three physiological parameters were correlated with the NDSI, namely
α, ETRmax and Ik . For each parameter and each NDSI combination, we calculated the coefficient of
determination (R2 ) and the corresponding significance level (p) assuming a linear relationship for the
n pair of measurements of hyperspectrum and physiological parameter recorded in each experimentalRemote Sens. 2020, 12, 200 7 of 18
setup. The results were visualized using raster maps of the coefficient of determination. The R2 values
corresponding to spectral pairs yielding p > 0.05 (which is deemed statistically insignificant) were
masked out to highlight only the statistically significant regions, based on which the results were
interpreted. The spectral regions which yields the highest R2 between the NDSIi,j and the parameter
under study can then be identified. Moreover, several popular empirical indices were extracted as
presented in Table 2. For the hyperspectral calculations, the R programming language was used as
well [51].
Table 2. Empirical vegetation indices extracted from the hyperspectral data collected with the leaf clip.
Index Equation Reference
R782 −R675
NDVI (Normalized Difference Vegetation Index) R782 +R675 [54]
NDVI750 (Red Edge Normalized Difference R750 −R705
R750 +R705 [55]
Vegetation Index)
R800
SRI (Simple Ratio Index) R680 [56]
2.5∗R782 −R675
EVI (Enhanced Vegetation Index) R782 +6∗R675 −7.5∗R445 +1 [57]
R865 −2∗R660 +R470
ARVI (Atmospherically resistant vegetation index) R865 +2∗R660 −R470 [58]
SGI (Sum Green Index) Mean(R500 |R600 ) [59]
mNDVI (modified Normalized Difference R752 −R702
R752 +R702 −2∗R447 [25]
Vegetation Index)
R750 −R445
mSR705 (modified Simple Ratio Index) R705 −R445 [25]
R740
VOG1 (Vogelmann) R720 [60]
R734 −R747
VOG2 (Vogelmann) R715 +R726 [60]
R734 −R747
VOG3 (Vogelmann) R715 +R720 [60]
R531 −R570
PRI (Photochemical Reflectance Index) R531 +R570 [61]
R800 −R445
SIPI (Structure Insensitive Pigment Index) R800 −R680 [27]
R690
RGI (Red Green Index) R550 [62]
R680 −R500
PSRI (Plant Senescence Reflectance Index) R750 [26]
1 1
CRI1 (Carotenoid Reflectance Index) R510 − R550 [63]
1 1
CRI2 (Carotenoid Reflectance Index) R510 − R700 [63]
ARI2 (Anthocyanin Reflectance Index) 1 1 [64]
R800 ∗ R550 − R700
R900
WBI (Water Band Index) R970 [65]
gNDVI (green Normalized Difference Vegetation R872 −R559
R872 +R559 [66]
Index)
PCAi-1 First component of PCA −
3. Results
3.1. Sun and Shade Leaves Comparison
The light intensity within a dense Phragmites stand decreased exponentially (data not shown),
resulting in significant illumination difference at the apical and basal parts of the plants, accounting
for 1251 ± 245 µmol m−2 s−1 and 268 ± 88 µmol m−2 s−1 respectively (Mann–Whitney Rank Sum Test,
T = 6442, p ≤ 0,001). Prolonged exposure of leaves to different light intensities resulted in substantially
different photophysiological parameters of the sun and shade leaves of Phragmites in dense reedrespectively, and were deemed insignificant and disregarded.
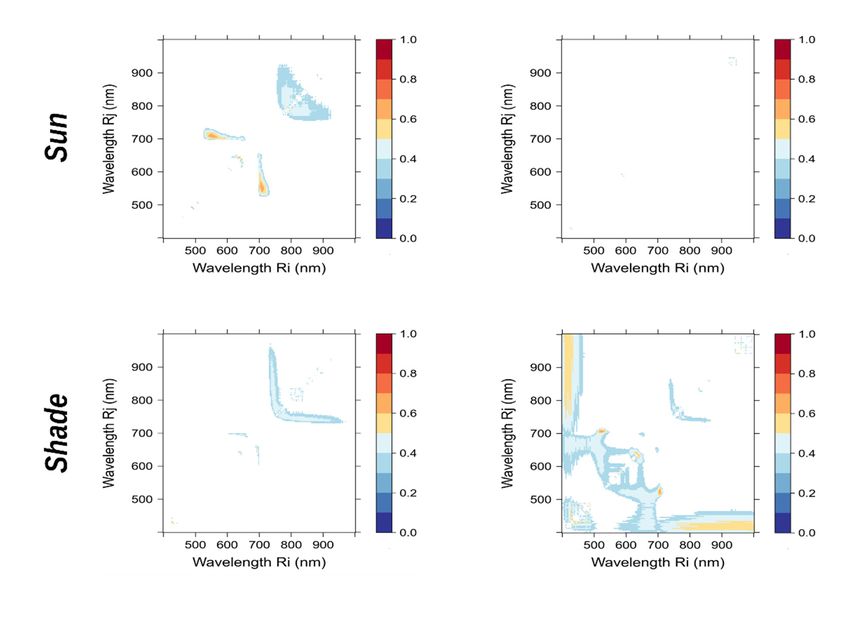
The R2 graph resulting from the measurements during the two consecutive days of fieldwork
cumulatively is presented in Figure 7. Values of R2 corresponding to spectral pairs yielding p > 0.05
were deemed statistically insignificant and have been masked out of the graph for ease of
interpretation. The graphs for parameters Ik and ETRmax were very similar (data not shown here),
Remote Sens. 2020, 12, 200 8 of 18
hence the graph of Ik has been disregarded for further analysis and is not presented.
Figure 8 presents the statistical results from the extraction of a few empirical vegetation indices,
which were
patches selected
(Figures 2–4). on
As the basis of
an effect ofthe
differing statistical distribution
lower irradiance, between
the Ik , ETRmax the qP
, Y(II) and shade and the
of shade sun
leaves
leaves.
decreased, while α and qN significantly increased (Figures 3 and 4).
Figure3.
Figure 3. The
The maximum
maximum quantum
quantum yieldyield for
for whole
whole chain
chain electron
electron transport
transport(α),
(α), the
the maximum
maximum electron
electron
transport capacity
transport capacity (ETR
(ETRmax
max)) and the theoretical light saturation
saturation intensity
intensity (I
(Ikk) for the
the sun
sun and
and shade
shade
leavesof
leaves ofPhragmites
Phragmitesaustralis
australisinindense
densepatches.
patches. Boxes
Boxes encompass
encompass the the 25%
25% and
and 75%75% quartiles
quartiles of
ofall
allthe
the
data,the
data, thecentral
centralsolid
solidand
anddashed
dashedlines
linesrepresents
representsthethemedian
medianandandthetheaverage,
average,barsbarsextend
extendto
to the
the 95%
95%
confidence
confidence limits,
limits, and
and dots
dotsrepresent
representoutliers.
outliers. For
For all bars nn== 15.
all bars 15. Differences
Differences were
were tested
tested with
with the
the
Remote Sens. 2020, 12, x FOR PEER REVIEW 10 of 21
Mann-Whitney
Mann-WhitneyRank RankSum
SumTest;
Test;*** indicatesppFigure 4. The quantum yield of PSII (Y(II)), photochemical (qP) and non-photochemical (qN)
quenching for the sun and shade leaves of Phragmites australis in dense patches. Boxes encompass the
25% and 75% quartiles of all the data, the central solid and dashed lines represents the median and
the average, bars extend to the 95% confidence limits, and dots represent outliers. For all bars n = 15.
Remote Differences
Sens. 2020, 12,were
200 tested with the Mann–Whitney Rank Sum Test; ** indicates p < 0.01, while *** 9 of 18
indicates p < 0.001.
Figure5.5.Mean
Figure Mean(curve)
(curve)and andstandard
standarddeviation
deviation(shaded
(shadedarea)
area)of
ofrelative
relativereflectance (ρ)ofofPhragmites
reflectance(ρ) Phragmites
australis
australis sun (solid line) and shade (dashed line) leaves (upper inset) and the first derivative(lower
sun (solid line) and shade (dashed line) leaves (upper inset) and the first derivative (lower
inset).
inset).Each
Eachline
lineisisan
anaverage
averageofof12
12measurements.
measurements.
The Principal Component Analysis (PCA) of the spectroradiometric data further revealed the
difference between the reflectance of sun and shade leaves of Phragmites (Figure 6). The major diversity
of the data is reflected in the NIR responses of the leaves, while the RGB component had no significant
contribution in the explanation of the first two orthogonal principal components. The third and fourth
principal components explained only the 2.6 and 1.5 of the variation inherited in the data, respectively,
and were deemed insignificant and disregarded.
The R2 graph resulting from the measurements during the two consecutive days of fieldwork
cumulatively is presented in Figure 7. Values of R2 corresponding to spectral pairs yielding p > 0.05
were deemed statistically insignificant and have been masked out of the graph for ease of interpretation.
The graphs for parameters Ik and ETRmax were very similar (data not shown here), hence the graph of
Ik has been disregarded for further analysis and is not presented.
Figure 8 presents the statistical results from the extraction of a few empirical vegetation indices,
which were selected on the basis of differing statistical distribution between the shade and the
sun leaves.Remote Sens. 2020, 12, 200 10 of 18
Remote Sens. 2020, 12, x FOR PEER REVIEW 11 of 21
Figure 6. PCA of the spectral response features of sun (open circles) and shade (black circles) leaves
Figure 6. PCA2020,
Remote Sens.
of the spectral
12, x FOR
response features of sun (open circles) and shade (black circles)
PEERinREVIEW
leaves of
12 of 21
of Phragmites australis Lake Balaton. Axis 1 explains 81.3% of the variation, axis 2—14.5%.
Phragmites australis in Lake Balaton. Axis 1 explains 81.3% of the variation, axis 2—14.5%.
Coefficient
Figure 7. Figure of determination (R(R2 )2 between the two photophysiological parameters (ETRmax
7. Coefficient of determination ) between the two photophysiological parameters (ETRmax
(left) and α (right)) and the
(left) and α (right)) and the NDSI (Ri, Rj)NDSI (Ri, Rj)measured
measured onon Phragmites australis
Phragmites plants atplants
australis Kerekediat Bay,
Kerekedi Bay,
Lake Balaton on 14–15 August. The NDSI was calculated using the exhaustive combinations of the
Lake Balaton on 14–15 August. The NDSI was calculated using the exhaustive combinations of the
hyperspectrum of reflectance of two wavebands at i and j. R2 corresponding to spectral pairs yielding
hyperspectrum of reflectance of two wavebands at i and j. R2 corresponding to spectral pairs yielding
p > 0.05 (statistical insignificant) have been masked out (blank pixels).
p > 0.05 (statistical insignificant) have been masked out (blank pixels).Remote
Remote Sens.
Sens. 2020,
2020, 12, 12,
200x FOR PEER REVIEW 13 11
of of
21 18
Figure
Figure 8. Boxplots
8. Boxplots of major
of major vegetation
vegetation indexes
indexes of sun
of sun andand shade
shade leaves
leaves of Phragmites
of Phragmites australis.
australis. DataData
from
from different
different leaves
leaves were were compared
compared with Mann-Whitney
with Mann-Whitney Rank Rank Sum Test:
Sum Test: ns—Not
ns—Not significant,
significant, < p0.01,
** p ** <
*** p < 0.001.
0.01, *** p < 0.001.
3.2.3.2.
Density Effect
Density Effect
In In
thethe
second
secondpart
partofofthe
theexperiment,
experiment, thethe effect
effect of
of the
the density
density of Phragmitesstands
of Phragmites standsononthethe
photophysiological
photophysiological parameters
parametersand the reflectance
and the reflectanceofofthethe oldest
oldest basal
basal greengreen leaves
leaves were studied.
were studied. The
Themajority
majorityofofthethephotophysiological
photophysiologicalparameters
parameters(seven
(seven ofofnine)
nine)correlated
correlatedwith the
with density
the densityofof
plants
plants
(Table
(Table 3). Mostly
3). Mostly negative
negative correlations
correlations werewere determined
determined (with(with increase
increase in density
in density the parameters
the parameters were
were decreasing),
decreasing), althoughalthough the different
the different indices ofindices of the non-photochemical
the non-photochemical quenching quenching
positivelypositively
correlated
correlated
with the plantwith the plant
density. density.
On the otherOn the other
hand, hand, the
the majority of majority
vegetationof vegetation
indices (13indices (13 of 21)no
of 21) showed
showed no significant correlation
significant correlation (Table 3). (Table 3).
Table 3. Spearman rank order correlation between the density of the Phragmites australis patch and
Table 3. Spearman rank order correlation between the density of the Phragmites australis patch and
empirical vegetation indices and photophysiological data. n = 24, ns—Not significant, * p < 0.05, ** p <
empirical vegetation indices and photophysiological data. n = 24, ns—Not significant, * p < 0.05,
0.01. In bold values the parameters for which the correlation is significant (i.e., 0 < p < 0.05).
** p < 0.01. In bold values the parameters for which the correlation is significant (i.e., 0 < p < 0.05).
Vegetation Index rP
Vegetation Index rP
NDVI
NDVI −0.05
−0.05 ns ns
NDVI
NDVI 750750 −0.47 * *
−0.47
SRI −0.09 ns
SRI
EVI 0.36 ns ns
−0.09
ARVI −0.04 ns
EVI
SGI 0.040.36
ns ns
mNDVI
ARVI −0.50 * ns
−0.04
mSR705 −0.51 *
SGI
VOG1 −0.510.04
* ns
VOG2 0.56 **
mNDVI −0.50 *
VOG3 0.55 **
PRI −0.01 ns
mSR705 −0.51 *
SIPI −0.05 ns
VOG1
RGI 0.12−0.51
ns *
PSRI −0.07 ns
VOG2 0.56
ns
**
CRI1 0.08
VOG3
CRI2 0.31 ns **
0.55
ARI2 0.50 * ns
PRI −0.01
WBI −0.22 ns
gNDVI −0.19 ns
PCAi-1 0.59 **Remote Sens. 2020, 12, 200 12 of 18
Table 3. Cont.
Photophysiological parameter rP
α 0.51 *
ETRmax −0.56 **
Ik −0.58 **
F 0.26 ns
Fm 0 −0.11 ns
Y(II) −0.56 **
qN 0.58 **
qP −0.54 **
ETR −0.56 **
4. Discussion
Due to its high adaptability, high growth rate and predominantly clonal vegetative reproduction,
Phragmites monopolized littoral zones of most freshwater lakes and became the dominant
species [40,67–69]. As seed dispersal in Phragmites stands is impossible in water covered areas, the spatial
distribution of their shoots (ramets) is mainly determined by vegetative (clonal) spread using rhizomes.
Clonal Phragmites is physiologically integrated within the genets (clones) facilitating cooperation [70–72]
and, thus, substantially changing our perception of competition within a reed stand. In the end,
the interconnected clone is the basic physiological unit that interacts with its environment [70–72].
The density of Phragmites plants within the stand is affected by two counteracting processes: the
plants tend to remain as dense as the rhizome architecture and the habitat’s resource-supplying
capacity allows, while the density of plants is limited, among others, by optical properties within the
stand [69,73]. Respectively, the density of Phragmites affects the optical environment of the stands: the
denser the stand, the less light reaches the basal parts of the plants.
In this study performed in a temperate zone freshwater lake, Phragmites exhibited major differences
between apical (sun) and basal (shade) leaves. Our results (Figures 2–4) show that reed in dense stands
could vertically alleviate irradiance, so that while the apical part of plants exposed to sun could develop
sun adapted leaves, the fully shaded conditions at the basal part result in shade-tolerant adaptations of
Phragmites. All the determined changes showed adaptations to specific light intensities of the apical
and basal part of Phragmites: electron transport rates (proxy of photosynthetic activity), photochemical
quenching and theoretical light saturation intensities of the sun leaves were 84%, 63% and 113% higher
than in shade leaves showing that leaves were adapted to utilise higher light intensities. On the other
hand, the shade-tolerant leaves were able to react better to smallest changes in light environment (21%
higher quantum yield for whole chain electron transport) and maintain alternative metabolic pathways
(17% higher nonphotochemical quenching). Moreover, the results indicate that the shade leaves inherit
more variability in their spectral profile (standard deviation in Figure 5 and the PCs in Figure 6), and
are thus potentially able to absorb larger spectral variety as compared to sun leaves. These adaptations
were consistent and were translated to foliar reflectance data. Similar changes in the vertical profile
of vegetation have been observed in other studies; for instance, D’Odorico et al. [74], when studying
the leaf photosynthetic traits for top and bottom canopy leaves for winter barley (Hordeum vulgare L.)
and rape seed (Brassica napus L.), found that traits such as the maximum photosynthetic capacity, dark
respiration, leaf nitrogen and chlorophyll contents and leaf mass per area presented consistently higher
values for top leaves throughout the growing season and for both crop types.
A closer look at the reflectance curves of sun and shade leaves (Figure 5) presents that the red-edge
shift observed, from λp = 713 nm for the sun leaves to λp = 701 nm for the shade leaves, is affecting
the vegetation indices, and especially the ones that use this part of the spectrum, such as the VOG2
and the mNDVI which demonstrate the highest correlation amongst the empirical vegetation indices
(Table 2). A similar slight change is observed in the the NIR reflectance (700–1000 nm) spectrum for
which sun leaves demonstrated 6.5% higher reflectance compared to the shade leaves; however, theseRemote Sens. 2020, 12, 200 13 of 18
both changes are comparatively small and as the standard deviation indicates in Figure 5, they might
be attributed to variability within the data. Similar studies have presented contrasting results; in an
older study, Schultz [9] reports that leaf reflectance was independent of the sun-shade environment of
the samples within the canopy, regardless of the leaf age and the acquisition time during the season;
however his samples were grapevine (Vitis vinifera L.) leaves grown under commercial practice, which
normally are not grown in as a dense environment as Phragmites. An earlier study, however, from
Gausman [10] suggest that there are considerable differences in the visible reflectance of the upper
surface of the Valencia orange tree leaves.
While the reflectance curves (Figure 5) present the spectral differences of the two experimental
sample groups, Figure 7 presents the association between the full combination of derived spectral
NDSI indices and the physiological parameters ETRmax and α. An observation arising from the
results is that the red-edge region is the strongest associated with ETRmax for the sun leaves and
the cumulative measurements; this is not so apparent in the shade leaves graph, perhaps because
the physiological variability (as indicated by the standard deviation) of the shade leaves is smaller
(Figure 3) and consequently the correlation weaker. Just above 700 nm there is a spectral area in the
sun leaves for ETRmax with a correlation of R2 > 0.60 (maximum R2 = 0.65 at wavelength combination
708/558); this area coincides with the inflection point of the sun leaves (i.e., λp = 713 nm) (Figure 5)
which indicates the importance of the inflection point in regard to ETRmax . In the cumulative graph of
ETRmax the same highest correlation is encountered in the same spectral area in a slightly narrower but
wider window; the narrow-band pair with the highest correlation is at 696/651 with R2 = 0.65. In the
graph of ETRmax for the shade leaves there is no correlation with R2 > 0.5. In regard to α, the opposite
from the ETRmax is observed; the statistical distribution for the shade leaves has a larger standard
deviation and an outlier is apparent (Figure 3). The graph for the sun leaves and α do not present
statistically significant results, however, the graph for the shade leaves presents two areas of interest;
first, there is a narrow isolated spectral combination at 708/525 with R2 = 0.68 which is the highest
correlation coefficient we have found in this study; this fact seconds the importance of the inflection
point for the shade leaves (λp = 701 nm) which falls within this area and is 7 nm apart from the spectral
combination with the maximum R2 . Secondly, there is a wider spectral region constructed at the very
short visible and the very long near-infrared wavelengths of the available spectrum, which provides
R2 > 0.5. The cumulative graph for α indicates a narrow area at 636/642 with a correlation of R2 = 0.61
which is also evidenced in the shade leaves graph.
It is worth noting that, in order to collect the chlorophyll fluorescence measurements, a 20 min
adaptation period is required for each sample; this fact in combination with the requirement to record
the data around solar noon (which was between 10:00 am and 13:00 pm local time) restricts the number
of measurements that can actually be recorded within this time period from a single PAM device,
and consequently results to a low repeat count in the experimental set up for a single day; this was
the reason that we used cumulatively the data collected during two consecutive days as presented
above. Moreover, we attempted to analyse the data separately for these two days; the differences in
this case were large (results not shown here) and we believe that the main reason is the small sample
size for a single individual day. Second, environmental (e.g., temperature) and vegetative (e.g., density,
heterogeneity) conditions change even between consecutive days and we only report the similarities in
the clear sky conditions, which is just one of the many variables that can affect the physiological and
spectral behaviour of plants.
Figure 8 presents the results from selected spectral indices indicating which ones are sensitive and
insensitive to shade and sun leaves; this can provide information in estimating the ratio of sun and
shade leaves from the canopy. It is apparent that the spectral indices NDVI705 , mNDVI, EVI, mSR705 ,
VOG2 provide distinguishing results for sun and shade leaves, while the spectral indices NDVI, ARVI,
SR, PRI, SIPI do not demonstrate any important differences for sun and shade leaves in their respective
statistical distribution. It is worth noting the considerably different results from NDVI and NDVI705 ;
the former results to almost identical distributions for sun and shade leaves while the latter providesRemote Sens. 2020, 12, 200 14 of 18
distinguishing results; this is an indication that narrow-band indices highly depend on the wavelength
used and are not to be assumed identical with the broadband indices and generalized. Moreover,
PRI, which is a spectral index assumed to be related to photochemistry, did not yield any significant
differences for the two leaf sets.
Our study relied on spectroscopic data and the spectral results indicate narrow-bands of correlation
with the photophysiological parameters. In the context of wetlands, several studies have been utilizing
such data, as for instance, Pengra et al. [75] used EO-1 Hyperion hyperspectral sensor to map the extent
and location of invasive monodominant Phragmites in Green Bay, WI, USA. with 81.4% accuracy. These
type of satellite hyperspectral data could be used, based on the findings of our study, to investigate
the density and physiological status of Phragmites based on the proposed narrow-band NDSI spectral
indices. Nevertheless, care should be taken when translating our findings, which are based on foliar
data, to satellite or airborne imagery which observes foliar data; in this case, a radiative transfer model
could be used to bridge the gap from leaf to canopy level.
Nevertheless, wetland characteristics are mapped with remote sensing based mainly on
multispectral data from a variety of platforms, such as unmanned aerial vehicles (UAVs) (e.g., [76–79]),
or satellite passive sensors, such as the Landsat Thematic Mapper (TM) and Indian Remote Sensing
Satellite (IRS) [80], Satellite pour l’Observation de la Terre (SPOT) [81], WorldView-2 [82] and
Sentinel-2 [83]). Figure 7 indicates that there are only a few broadband spectral regions correlating
with the parameters under study, and specifically the reflectance of the shade leaves with α at the
shorter wavelengths. However, as more of these satellites integrate narrow-band spectral channels in
their capabilities (e.g., Sentinel-2, WorldView 2/3, RapidEye) it would be possible to utilize the findings
of our results in regard to ETR and α, since we suggest that the red-edge is the most important spectral
region, and this is the available spectral region that the narrow-band channels onboard satellites
currently integrate.
5. Conclusions
This study examined the intertwined effect of plant density and sun/shade leaves’ photophysiology
in regard to chlorophyll fluorescence and hyperspectral response. Although Phragmites is considered a
sun adapted species, in our study we showed that basal parts of the plant exhibited a shade-tolerant
nature in photophysiological response to foliage shading. Low irradiance increased the acclimation of
plants to low light conditions. At normal conditions and at high plant densities only the signals from
sun leaves could reach from the canopy level, although even the slightest move of canopy (breeze,
wind) could expose the basal, shade leaves affecting the acquired high resolution (not satellite) data.
At relatively lower densities within the stand the vertical light attenuation was still large, and this
modified the photophysiology of basal foliage, so Phragmites exhibit signals from both sun and shade
leaves, thus showing higher variability at the data level of canopy reflectance. At low densities,
the vertical light attenuation is low, making all the leaves exhibit dominantly sun-adopted properties.
The hyperspectral response from the sun and shade leaves has been found to differ and the charts of
the coefficient of determination indicate that there are specific narrow-band spectral regions associated
to the leaf vertical position and the photophysiological parameter under study. The spectral bands
around the red-edge inflection point for each case of sun and shade leaves has been found to correlate
strongly with ETRmax and α. When analyzing the data cumulatively, independent of their vertical
position within the stand, we found correlations of R2 = 0.65 (696/651) and R2 = 0.61 (636/642) for the
ETRmax and α, respectively. The outcomes of this study could help to predict density of reed stands or
correct previously seen anomalies.
Author Contributions: D.S. and V.R.T. collected the data and wrote the paper. V.R.T. analyzed the chlorophyll
fluorescence data and D.S. analyzed the hyperspectral data. All authors have read and agreed to the published
version of the manuscript.Remote Sens. 2020, 12, 200 15 of 18
Funding: This research was funded by GIONET, supported by the European Commission, Marie Curie Programme,
Initial Training Networks, grant agreement number PITN-GA-2010-264509. This study was funded by grant from
the Hungarian National Research, Development and Innovation Office NKFIH KH-129505.
Acknowledgments: The authors would like to thank the financial support from GIONET, during which the field
data collection was carried out.
Conflicts of Interest: The authors declare no conflict of interest.
References
1. Lacoul, P.; Freedman, B. Environmental influences on aquatic plants in freshwater ecosystems. Environ. Rev.
2006, 14, 89–136. [CrossRef]
2. Mooney, H.A.; Ehleringer, J.R. Photosynthesis. In Plant Ecology; Blackwell Publishing Ltd.: Oxford, UK, 2009;
pp. 1–27. ISBN 978-1-4443-1364-2.
3. Tilman, D. Mechanisms of Plant Competition. In Plant Ecology; Blackwell Publishing Ltd.: Oxford, UK, 2009;
pp. 239–261. ISBN 978-1-4443-1364-2.
4. Lichtenthaler, H.K.; Buschmann, C.; Döll, M.; Fietz, H.J.; Bach, T.; Kozel, U.; Rahmsdorf, U. Photosynthetic
activity, chloroplast ultrastructure, and leaf characteristics of high-light and low-light plants and of sun and
shade leaves. Photosynth. Res. 1981, 2, 115–141. [CrossRef]
5. Givnish, T.J. Adaptation to sun and shade: A whole-plant perspective. Funct. Plant Biol. 1988, 15, 63–92.
[CrossRef]
6. Boardman, N.T. Comparative photosynthesis of sun and shade plants. Annu. Rev. Plant Physiol. 1977, 28,
355–377. [CrossRef]
7. Crawley, M.J. Life History and Environment. In Plant Ecology; Blackwell Publishing Ltd.: Oxford, UK, 2009;
pp. 73–131. ISBN 978-1-4443-1364-2.
8. Lichtenthaler, H.K.; Ač, A.; Marek, M.V.; Kalina, J.; Urban, O. Differences in pigment composition,
photosynthetic rates and chlorophyll fluorescence images of sun and shade leaves of four tree species. Plant
Physiol. Biochem. 2007, 45, 577–588. [CrossRef] [PubMed]
9. Schultz, H.R. Leaf absorptance of visible radiation in Vitis vinifera L.: Estimates of age and shade effects
with a simple field method. Sci. Hortic. 1996, 66, 93–102. [CrossRef]
10. Gausman, H.W. Evaluation of factors causing reflectance differences between sun and shade leaves. Remote
Sens. Environ. 1984, 15, 177–181. [CrossRef]
11. Mathur, S.; Jain, L.; Jajoo, A. Photosynthetic efficiency in sun and shade plants. Photosynthetica 2018, 56,
354–365. [CrossRef]
12. Haslam, S.M. The development of shoots in Phragmites communis Trin. Ann. Bot. 1969, 33, 695–709.
[CrossRef]
13. Tucker, G.C. The Genera of Arundinoideae (Gramineae) in the Southeastern United States. J. Arnold Arbor.
1990, 71, 145–177. [CrossRef]
14. Brix, H. The European research project on reed die-back and progression (EUREED). Limnologica 1999, 29,
5–10. [CrossRef]
15. Van der Putten, W.H. Die-back of Phragmites australis in European wetlands: An overview of the European
research programme on reed die-back and progression (1993–1994). Aquat. Bot. 1997, 59, 263–275. [CrossRef]
16. Ostendorp, W. ‘Die-back’ of reeds in Europe—A critical review of literature. Aquat. Bot. 1989, 35, 5–26.
[CrossRef]
17. Fogli, S.; Marchesini, R.; Gerdol, R. Reed (Phragmites australis) decline in a brackish wetland in Italy. Mar.
Environ. Res. 2002, 53, 465–479. [CrossRef]
18. Genty, B.; Briantais, J.M.; Baker, N.R. The relationship between the quantum yield of photosynthetic electron
transport and quenching of chlorophyll fluorescence. Biochim. Biophys. Acta (BBA)-Gen. Subj. 1989, 990,
87–92. [CrossRef]
19. Krause, G.H.; Weis, E. Chlorophyll fluorescence and photosynthesis: The basics. Annu. Rev. Plant Biol. 1991,
42, 313–349. [CrossRef]
20. Baba,
˛ W.; Kompała-Baba, ˛ A.; Zabochnicka-Światek,˛ M.; Luźniak, J.; Hanczaruk, R.; Adamski, A.; Kalaji, H.
Discovering trends in photosynthesis using modern analytical tools: More than 100 reasons to use chlorophyll
fluorescence. Photosynthetica 2019, 57, 668–679. [CrossRef]Remote Sens. 2020, 12, 200 16 of 18
21. Kwok, R. Ecology’s remote-sensing revolution. Nature 2018, 556, 137–139. [CrossRef]
22. Stratoulias, D.; Balzter, H.; Zlinszky, A.; Tóth, V.R. Assessment of ecophysiology of lake shore reed vegetation
based on chlorophyll fluorescence, field spectroscopy and hyperspectral airborne imagery. Remote Sens.
Environ. 2015, 157, 72–84. [CrossRef]
23. Zarco-Tejada, P.J.; Miller, J.R.; Noland, T.L.; Mohammed, G.H.; Sampson, P.H. Scaling-up and model inversion
methods with narrowband optical indices for chlorophyll content estimation in closed forest canopies with
hyperspectral data. IEEE Trans. Geosci. Remote Sens. 2001, 39, 1491–1507. [CrossRef]
24. Gitelson, A.A.; Merzlyak, M.N. Signature analysis of leaf reflectance spectra: Algorithm development for
remote sensing of chlorophyll. J. Plant Physiol. 1996, 148, 494–500. [CrossRef]
25. Sims, D.A.; Gamon, J.A. Relationships between leaf pigment content and spectral reflectance across a
wide range of species, leaf structures and developmental stages. Remote Sens. Environ. 2002, 81, 337–354.
[CrossRef]
26. Merzlyak, M.N.; Gitelson, A.A.; Chivkunova, O.B.; Rakitin, V.Y. Non-destructive optical detection of pigment
changes during leaf senescence and fruit ripening. Physiol. Plant. 1999, 106, 135–141. [CrossRef]
27. Peñuelas, J.; Filella, I.; Gamon, J.A. Assessment of photosynthetic radiation-use efficiency with spectral
reflectance. New Phytol. 1995, 131, 291–296. [CrossRef]
28. Gamon, J.A.; Penuelas, J.; Field, C.B. A narrow-waveband spectral index that tracks diurnal changes in
photosynthetic efficiency. Remote Sens. Environ. 1992, 41, 35–44. [CrossRef]
29. Pieczywek, P.M.; Cybulska, J.; Szymańska-Chargot, M.; Siedliska, A.; Zdunek, A.; Nosalewicz, A.; Kurenda, A.
Early detection of fungal infection of stored apple fruit with optical sensors–Comparison of biospeckle,
hyperspectral imaging and chlorophyll fluorescence. Food Control 2018, 85, 327–338. [CrossRef]
30. Tan, C.W.; Wang, D.L.; Zhou, J.; Du, Y.; Luo, M.; Zhang, Y.J.; Guo, W.S. Assessment of F v/F m absorbed
by wheat canopies employing in-situ hyperspectral vegetation indexes. Sci. Rep. 2018, 8, 9525. [CrossRef]
[PubMed]
31. Zarco-Tejada, P.J.; González-Dugo, M.V.; Fereres, E. Seasonal stability of chlorophyll fluorescence quantified
from airborne hyperspectral imagery as an indicator of net photosynthesis in the context of precision
agriculture. Remote Sens. Environ. 2016, 179, 89–103. [CrossRef]
32. Wolanin, A.; Rozanov, V.V.; Dinter, T.; Noël, S.; Vountas, M.; Burrows, J.P.; Bracher, A. Global retrieval of
marine and terrestrial chlorophyll fluorescence at its red peak using hyperspectral top of atmosphere radiance
measurements: Feasibility study and first results. Remote Sens. Environ. 2015, 166, 243–261. [CrossRef]
33. Joiner, J.; Yoshida, Y.; Guanter, L.; Middleton, E.M. New methods for the retrieval of chlorophyll red
fluorescence from hyperspectral satellite instruments: Simulations and application to GOME-2 and
SCIAMACHY. Atmos. Meas. Tech. 2016, 9, 3939–3967. [CrossRef]
34. Peñuelas, J.; Baret, F.; Filella, I. Semi-empirical indices to assess carotenoids/chlorophyll a ratio from leaf
spectral reflectance. Photosynthetica 1995, 31, 221–230.
35. Zhang, C.; Filella, I.; Garbulsky, M.; Peñuelas, J. Affecting factors and recent improvements of the
photochemical reflectance index (PRI) for remotely sensing foliar, canopy and ecosystemic radiation-use
efficiencies. Remote Sens. 2016, 8, 677. [CrossRef]
36. Wong, C.Y.; Gamon, J.A. Three causes of variation in the photochemical reflectance index (PRI) in evergreen
conifers. New Phytol. 2015, 206, 187–195. [CrossRef] [PubMed]
37. Gamon, J.A.; Field, C.B.; Goulden, M.L.; Griffin, K.L.; Hartley, A.E.; Joel, G.; Valentini, R. Relationships
between NDVI, canopy structure, and photosynthesis in three Californian vegetation types. Ecol. Appl. 1995,
5, 28–41. [CrossRef]
38. Grace, J.; Nichol, C.; Disney, M.; Lewis, P.; Quaife, T.; Bowyer, P. Can we measure terrestrial photosynthesis
from space directly, using spectral reflectance and fluorescence? Glob. Chang. Biol. 2007, 13, 1484–1497.
[CrossRef]
39. Dechant, B.; Cuntz, M.; Vohland, M.; Schulz, E.; Doktor, D. Estimation of photosynthesis traits from leaf
reflectance spectra: Correlation to nitrogen content as the dominant mechanism. Remote Sens. Environ. 2017,
196, 279–292. [CrossRef]
40. Tóth, V.R. Reed stands during different water level periods: Physico-chemical properties of the sediment
and growth of Phragmites australis of Lake Balaton. Hydrobiologia 2016, 778, 193–207. [CrossRef]Remote Sens. 2020, 12, 200 17 of 18
41. Tóth, V.R.; Szabó, K. Morphometric structural analysis of Phragmites australis stands in Lake Balaton.
In Annales de Limnologie-International Journal of Limnology; EDP Sciences: Nantes, France, 2012; Volume 48,
pp. 241–251.
42. Zlinszky, A.; Mücke, W.; Lehner, H.; Briese, C.; Pfeifer, N. Categorizing wetland vegetation by airborne laser
scanning on Lake Balaton and Kis-Balaton, Hungary. Remote Sens. 2012, 4, 1617–1650. [CrossRef]
43. Stratoulias, D. Assessment of physiological status and spatial distribution of emergent macrophytes based
on imaging spectroscopy (Doctoral dissertation, Department of Geography). Dep. Geogr. 2015.
44. Stratoulias, D.; Balzter, H.; Sykioti, O.; Zlinszky, A.; Tóth, V. Evaluating Sentinel-2 for lakeshore habitat
mapping based on airborne hyperspectral data. Sensors 2015, 15, 22956–22969. [CrossRef]
45. Villa, P.; Pinardi, M.; Tóth, V.R.; Hunter, P.D.; Bolpagni, R.; Bresciani, M. Remote sensing of macrophyte
morphological traits: Implications for the management of shallow lakes. J. Limnol. 2017. [CrossRef]
46. Stratoulias, D.; Keramitsoglou, I.; Burai, P.; Csaba, L.; Zlinszky, A.; Tóth, V.R.; Balzter, H. A framework for
lakeshore vegetation assessment using field spectroscopy and airborne hyperspectral imagery. Earth Obs.
Land Emerg. Monit. 2017, 159. [CrossRef]
47. Stratoulias, D.; Balzter, H.; Zlinszky, A.; Tóth, V.R. A comparison of airborne hyperspectral-based
classifications of emergent wetland vegetation at Lake Balaton, Hungary. Int. J. Remote Sens. 2018,
39, 5689–5715. [CrossRef]
48. Wilkie, C.J.; Scott, E.M.; Miller, C.; Tyler, A.N.; Hunter, P.D.; Spyrakos, E. Data fusion of remote-sensing and
in-lake chlorophylla data using statistical downscaling. Procedia Environ. Sci. 2015, 26, 123–126. [CrossRef]
49. Blix, K.; Pálffy, K.; RTóth, V.; Eltoft, T. Remote Sensing of Water Quality Parameters over Lake Balaton by
Using Sentinel-3 OLCI. Water 2018, 10, 1428. [CrossRef]
50. Eilers, P.H.C.; Peeters, J.C.H. A model for the relationship between light intensity and the rate of photosynthesis
in phytoplankton. Ecol. Model. 1988, 42, 199–215. [CrossRef]
51. R Core Team. R: A language and environment for statistical computing. Computing 2013. [CrossRef]
52. Stagakis, S.; Markos, N.; Sykioti, O.; Kyparissis, A. Monitoring canopy biophysical and biochemical
parameters in ecosystem scale using satellite hyperspectral imagery: An application on a Phlomis fruticosa
Mediterranean ecosystem using multiangular CHRIS/PROBA observations. Remote Sens. Environ. 2010, 114,
977–994. [CrossRef]
53. Inoue, Y.; Sakaiya, E.; Zhu, Y.; Takahashi, W. Diagnostic mapping of canopy nitrogen content in rice based on
hyperspectral measurements. Remote Sens. Environ. 2012, 126, 210–221. [CrossRef]
54. Tucker, C.J. Red and photographic infrared linear combinations for monitoring vegetation. Remote Sens.
Environ. 1979, 8, 127–150. [CrossRef]
55. Gitelson, A.A.; Merzlyak, M.N. Spectral reflectance changes associated with autumn senescence of Aesculus
hippocastanum L. and Acer platanoides L. leaves. Spectral features and relation to chlorophyll estimation. J.
Plant Physiol. 1994, 143, 286–292. [CrossRef]
56. Jordan, C.F. Derivation of leaf area index from quality of light on the forest floor. Ecology 1969, 50, 663–666.
[CrossRef]
57. Huete, A.; Didan, K.; Miura, T.; Rodriguez, E.P.; Gao, X.; Ferreira, L.G. Overview of the radiometric
and biophysical performance of the MODIS vegetation indices. Remote Sens. Environ. 2002, 83, 195–213.
[CrossRef]
58. Kaufman, Y.J.; Tanre, D. Atmospherically resistant vegetation index (ARVI) for EOS-MODIS. IEEE Trans.
Geosci. Remote Sens. 1992, 30, 261–270. [CrossRef]
59. Gamon, J.A.; Surfus, J. Assessing leaf pigment content and activity with a reflectometer. New Phytol. 1999,
143, 105–117. [CrossRef]
60. Vogelmann, J.E.; Rock, B.N.; Moss, D.M. Red edge spectral measurements from sugar maple leaves. Int. J.
Remote Sens. 1993, 14, 1563–1575. [CrossRef]
61. Gamon, J.A.; Serrano, L.; Surfus, J.S. The photochemical reflectance index: An optical indicator of
photosynthetic radiation use efficiency across species, functional types and nutrient levels. Oecologia
1997, 112, 492–501. [CrossRef]
62. Zarco-Tejada, P.J.; Berjón, A.; López-Lozano, R.; Miller, J.R.; Martín, P.; Cachorro, V.; González, M.R.; de
Frutos, A. Assessing vineyard condition with hyperspectral indices: Leaf and canopy reflectance simulation
in a row-structured discontinuous canopy. Remote Sens. Environ. 2005, 99, 271–287. [CrossRef]You can also read