Physiological and Morphological Variation in Balsam Fir Provenances Growing in New Brunswick, Canada - MDPI
←
→
Page content transcription
If your browser does not render page correctly, please read the page content below
Article
Physiological and Morphological Variation in Balsam Fir
Provenances Growing in New Brunswick, Canada
Matthew E. Akalusi *                and Charles P.-A. Bourque

                                          Faculty of Forestry and Environmental Management, University of New Brunswick,
                                          Fredericton, NB E3B 5A3, Canada; cbourque@unb.ca
                                          * Correspondence: me.akalusi@unb.ca

                                          Abstract: There is a need to understand the physio-morphological responses of northern tree species
                                          to climate change. The hypothesis of the current study was that provenance and light intensity
                                          were both influential in the control of intrinsic water-use efficiency (iWUE). Diameter at breast
                                          height (DBH)-increment was hypothesized as being more affected by provenance. Intrinsic water-
                                          use efficiency (iWUE), the ratio of photosynthesis (A) to stomatal conductance (gs ), was assessed in
                                          foliage under two levels of photosynthetically active radiation (PAR; i.e., 300 and 1200 µmol m−2 s−1 )
                                          in 63-year-old balsam fir [Abies balsamea (L.) Mill.] provenances derived from seed sources from
                                          across the species’ natural range (namely, within 44–51◦ N latitudes and 53–102◦ W longitudes) and
                                          cultivated in a common garden in eastern Canada. Diameter at breast height (DBH) of provenances
                                          from the common garden were measured when they were 42 and 58 years old (DBH1998 , DBH2014 ).
                                          The results confirmed the hypotheses regarding the roles of provenance on iWUE and DBH (p < 0.05),
                                          but showed a diminished role of PAR on iWUE. The lowest and highest mean iWUE and DBH among
                                          the provenances ranged between 0.028 and 0.031 and 0.079–0.083 µmol mmol−1 and 11.82–12.78 and
                                16.38–18.44 cm, respectively. Stomatal conductance of balsam fir had a strong relationship with iWUE

                                          at both light settings, whereas A had a weaker relationship with iWUE. There were no significant
Citation: Akalusi, M.E.; Bourque,
                                          relationships between iWUE at the two light settings and climatic variables at the provenance source
C.P.-A. Physiological and
                                          (p > 0.05). Diameter at breast height in 2014 was significantly greater than DBH1998 (p < 0.05). The
Morphological Variation in Balsam
                                          relationships between DBH2014 and climatic variables at the provenance source were statistically
Fir Provenances Growing in New
Brunswick, Canada. Forests 2021, 12,
                                          significant (p < 0.05). There was a significant positive relationship between iWUE and DBH measured
186. https://doi.org/10.3390/             in 2014. Survivorship of provenances was shown to vary with DBH-increment. The results show
f12020186                                 that for present-day and future forest management, (i) selection in balsam fir, in relation to iWUE
                                          should ideally be based on a criterion of intraspecific stomatal conductance; (ii) shade tolerance of
Academic Editor: Alfredo Di Filippo       balsam fir, population differentiation, and consistent pace of DBH-growth under variable climatic
Received: 30 December 2020                conditions are important factors in the species’ sustained growth under changes in forest dynamics
Accepted: 5 February 2021                 projected to accompany changes in regional climate; (iii) temperature variables are strong indicators
Published: 6 February 2021
                                          of DBH-increment in balsam fir; (iv) the effect of tree size on its survival is maintained under variable
                                          climatic conditions; and (v) there is a clear association between iWUE and the species’ radial growth.
Publisher’s Note: MDPI stays neutral
with regard to jurisdictional claims in
                                          Keywords: diameter growth; intrinsic water-use efficiency; photosynthesis; stomatal conductance;
published maps and institutional affil-
                                          species shade tolerance
iations.

                                          1. Introduction
Copyright: © 2021 by the authors.
                                               Increased temperatures and varied precipitation patterns resulting from the anthro-
Licensee MDPI, Basel, Switzerland.
                                          pogenic buildup of atmospheric carbon dioxide (CO2 ) concentrations and other green-
This article is an open access article
distributed under the terms and
                                          house gases could have profound impacts on the temperate and boreal forests at mid to
conditions of the Creative Commons
                                          high latitudes in the Northern Hemisphere. This necessitates an understanding of the
Attribution (CC BY) license (https://     physio-morphological responses of northern tree species to climate change to facilitate the
creativecommons.org/licenses/by/          sustainable utilization of forests [1–3].
4.0/).

Forests 2021, 12, 186. https://doi.org/10.3390/f12020186                                                   https://www.mdpi.com/journal/forests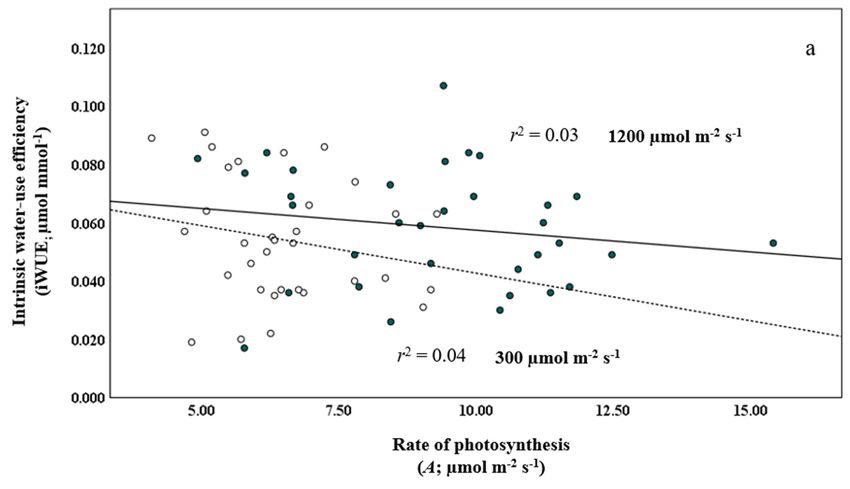
Forests 2021, 12, 186                                                                                           2 of 18

                              Plant assimilation of atmospheric CO2 during leaf photosynthesis is accompanied
                        by water loss during transpiration, through leaf stomata [4,5]. Regulation of these leaf
                        gas-exchange processes, which link the global carbon and hydrological cycles, is achieved
                        by control of the stomata relative to changes in the environment [6–9]. The global carbon
                        cycle is pivotally affected by terrestrial ecosystems that sequester a significant amount of
                        anthropogenic CO2 emissions, which have caused a rise in global air temperatures since the
                        mid-20th century [10]. Terrestrial ecosystems act as a key control on climate warming [11].
                        Forests cover ~4.1 billion ha of the Earth’s surface and hold 80% and 40% of terrestrial
                        carbon above and belowground, respectively. Regional carbon stocks influence the dy-
                        namics of global carbon pools and fluxes [12–14]. The carbon cycle is characterized by
                        gross primary production (GPP) from carbon assimilation resulting from photosynthesis.
                        Net primary production (NPP) is the portion of GPP stored in plants after accounting
                        for losses to respiration. Net ecosystem production (NEP) is NPP minus heterotrophic
                        respiration [15]. The hydrological cycle of forest ecosystems commences with precipita-
                        tion, which reaches and enters the soil through gaps in the forest-canopy, flows down
                        tree trunks, and drips from tree crowns. A large portion of water that reaches the soil
                        surface is absorbed by the roots of trees and understory plants, and then released into
                        the atmosphere during transpiration or it recharges soil water. The rest, intercepted by
                        the canopy, is evaporated back to the atmosphere [16]. Water-use efficiency (WUE), the
                        rate of carbon uptake per unit water loss, is a key characteristic of ecosystem functioning.
                        The variable enables the evaluation of tree performance in relation to water availability
                        and consumption [4,17–21]. Intrinsic water-use efficiency (iWUE) is the ratio of the rate
                        of photosynthesis (A) to stomatal conductance (gs ), both of which can be obtained from
                        leaf gas-exchange measurements [9,22]. Changes in iWUE influence ecosystem function-
                        ing, as higher iWUE, can result from reductions in stomatal conductance, increases in
                        photosynthesis, or the combined effect of the two responses [22,23].
                              Light is one of the main environmental variables that affect plant development. It is
                        an important energy source for plant photosynthesis and stomatal activity. To maximize
                        their morphological growth and physiological processes, plants must be able to sense and
                        respond to changes in light properties, which vary spatially and temporally in natural
                        conditions, especially within forest canopies. There is a marked decrease in light intensity
                        from the upper to the lower canopy, with upper-canopy foliage exposed to higher irra-
                        diance than lower-canopy foliage shaded by leaves and branches residing in the upper
                        canopy [24–28]. There is a need to clarify how iWUE varies with light intensity. This is
                        because the quantification of changes in plant WUE characteristics, their drivers as well as
                        their relationships to climatic factors is important in modeling plant-growth response and
                        regional forest carbon uptake [9,28–30].
                              Tree diameter-growth occurs through the formation of consecutive layers of structural
                        tissue by the vascular cambium, inwardly toward the pith, and outwardly toward the bark,
                        giving rise to the water and nutrient-conducting xylem, and photosynsynthate-conducting
                        phloem, respectively. The presence of lignin in the xylem gives the tree trunk strength [31].
                        The anticipated effect of climate change on forest ecosystem processes has necessitated
                        an increase in the knowledge of climate–growth relationships, with resultant studies at
                        diurnal, seasonal, annual, and multi-annual timescales [32–36]. Studies of relationships
                        between climatic factors and stem-increment dynamics will facilitate the understanding of
                        the effects of changing climatic conditions on the growth of trees and enhance the modeling
                        of tree–climate relationships [37,38]. Several studies have been conducted in the past to
                        assess the response of conifers to climate change, with trials based on provenances of jack
                        pine (Pinus banksiana Lamb.) [39], white spruce [Picea glauca (Moench.) Voss.] [40], black
                        spruce [Picea mariana (Mill.) B.S.P.] [41], and Scots pine (Pinus sylvestris L.) [42]. Studies
                        based on balsam fir [A. balsamea (L.) Mill.] are not common [43].
                              Our hypotheses are that (i) provenance and light intensity play a significant role in
                        the control of iWUE, and (ii) provenance in the multi-year increment in diameter at breast
                        height (DBH). Our study assesses these controls in provenances of balsam fir.
Forests 2021, 12, 186                                                                                                          3 of 18

                                       2. Materials and Methods
                                       2.1. Study Site
                                            The study was conducted at a research site of Natural Resources Canada, in north-
                                      western New Brunswick (NB), Canada (47◦ 70 N, 67◦ 320 W). The study site is a balsam fir
                                      provenance trial established in 1961, with the planting of five-year-old balsam fir seedlings.
                                      The provenance trial was comprised of twelve provenances from locations within 44–51◦ N
                                      latitudes and 53–102◦ W longitudes across North America [44] (Table 1), along a climatic
                                      gradient with mean annual temperature and total annual precipitation from 1.5–6.7 ◦ C and
Forests 2021, 12, 186 4 of 18
was again collected in 2014, when the provenances were 58 years old. The DBH data
collected from the unthinned portion of each provenance-plot in 2014 were subsequently
used to determine the mean DBH for all sampled plots. The mean DBH for each sampled
plot (plot-DBH) was then used in the selection of representative sample trees for quantifying
species evaluation of iWUE and DBH. Data from one of the provenances (i.e., MS-131) were
only used in the study of DBH and not iWUE because of low tree-survival in 2014, and
only one of the trees was alive in 2019.
For the study on iWUE, three representative sample trees were selected from each
provenance plot (except MS-131) for foliar gas-exchange measurements. Measurements
were acquired for the rate of photosynthesis (A; µmol m−2 s−1 ) and stomatal conductance
(gs; mmol m−2 s−1 ), which were used in the calculation of iWUE (µmol mmol−1 ):
A
iWUE = (1)
gs
Measurements were made on a total of 33 foliage samples.
For the study on provenance DBH, five representative sample trees were selected from
each provenance plot (the three trees from which branches were removed for foliar gas-
exchange measurement and two additional trees) for the comparison of provenance DBH
at the two points of measurement (i.e., DBH1988 and DBH2014 , respectively). Measurements
were made on a total of 60 foliage samples.
2.3. Gas-Exchange Measurements
The foliar gas-exchange measurements were conducted in 2019 when the provenances
were 63 years old. Gas-exchange measurements were made over a 6-day period between
September and October 2019 from 09:00–15:00 h (local daylight time) each day. In light of
the heights of trees in the provenance plots (≥10 m), telescopic pole pruners were used
to detach branches from each tree. Gas exchange in the detached foliage of trees can be
affected by the time interval between branch cutting and gas-exchange measurement [52].
However, Clark [53], Koike and Sakagami [54], and Gauthier and Jacobs [55] showed the
practicality of measuring gas exchange in detached foliage, as evidenced by unchanged
gas-exchange rates associated with the foliage of species studied, ranging from seven to
20 min after detachment. Earlier measurements on attached and detached balsam fir foliage
(unpublished data) showed no statistically significant differences in gas-exchange rates
(p > 0.05).
Specifically, branches 50–80 cm long were detached from the south-facing, upper-
canopy sections of each tree. Gas-exchange measurements were made immediately there-
after. Measurements were acquired for the rate of photosynthesis (A; µmol m−2 s−1 ) and
stomatal conductance (gs ; mmol m−2 s−1 ) in 1-year-old foliage, after current-year needles
were removed with hand pruners. Measurements were taken under two photosynthetically
active radiation (PAR) settings, with light perpendicularly incident on foliage, supplied by
a tungsten halogen light unit attached to a CIRAS-2 Photosynthesis System (PP Systems,
Amesbury, MD, USA). The two light settings were 1200 and 300 µmol m−2 s−1 , with light
varied downward from the former to the latter setting. Measurements were made on
foliage of the detached tree branches, of which needles at the lower end were removed
with tweezers. The remaining needles were completely enclosed in the conifer chamber
(cuvette) with a CO2 concentration maintained at 400 µmol mol−1 , together with a flow rate,
chamber temperature, and relative humidity of 400 mL min−1 , 18 ◦ C, and 70%, respectively.
Before starting each series of measurements, foliage was acclimated to cuvette conditions
for 15 min at 1200 µmol m−2 s−1 . Photosynthesis and gs were permitted to stabilize for
two min at 1200 and 300 µmol m−2 s−1 (hereafter high and low light, respectively) before
being measured.
On completion of each set of measurements, all needles (n = 20–90) on each foliage
sample enclosed in the cuvette were removed and then scanned using a CanoScanLiDE
110 Flatbed Scanner (Canon Canada Inc, Mississauga, ON, Canada) for the determinationForests 2021, 12, 186 5 of 18
of projected leaf area (i.e., 12 of total leaf area) with Image J software (version 1.49, National
Institutes of Health, Bethesda, MD, USA). Projected leaf area was then used to estimate A
and gs on a leaf area basis, following which iWUE was determined.
2.4. Data Analysis
2.4.1. Mixed Analysis of Variance (ANOVA)
Mixed analysis of variance (ANOVA) was performed on (i) iWUE at high and low
light settings, and (ii) DBH at 42 and 58 years old. The analyses were performed with
SPSS Statistical software (version 24, IBM Corp., New York, NY, USA) using the repeated
measures option, with provenance, the between-subjects factor in (i) and (ii), and PAR
and age, the within-subjects factors, and iWUE and DBH as the corresponding dependent
variables. An assessment of the homogeneity of sample variances was carried out using
Levene’s test. Mixed ANOVA was used to determine the significance level of the effects
of provenance, PAR, and provenance × PAR interaction on iWUE, and the effects of
provenance, growth period, and provenance × growth period interaction on DBH. The
Bonferroni test was used subsequently to separate the effect means when significant
differences were detected with respect to both between- and within-subjects factors.
2.4.2. Regression Analysis
Regression analysis was performed using the methods of Matyas and Yeatman [56]
and Thomson and Parker [57] by relating the physio-morphological variables measured
to climate at the provenance-source stands. This was done to identify climatic variables
that exert selective pressures on the traits of the provenances in the development of climate
models for balsam fir. Climate normals for the 1981–2010 period were generated from
weather station data including (i) annual and seasonal temperature-variables (18, in total);
(ii) precipitation variables (seven); indices of heat accumulation (i.e., growing degree-days
> 5 and 10 ◦ C) (two); annual and seasonal moisture indices (eight); and durations above
specified temperature and precipitation-thresholds (ten, five for each grouping). The
number of climatic variables used in the regression analysis was reduced using principal
component analysis (PCA). The climatic variables extracted by PCA were then used in
regressions of iWUE at low and high light settings, and DBH of provenances at 58 years
old against the various provenance-source stand climatic variables. Note that regressions
for DBH of provenances at 42 years old had already been determined [51]. Scatter plots of
iWUE and climatic variables indicated nonlinear relationships, and as a result, quadratic
and third-order polynomials were used in an expanded regression analysis. Equations
used in the regressions involving iWUE and DBH2014 are as follows:
Y = β0 + β1 X + e (2)
Y = β0 + β1 X + β2 X2 + e (3)
and
Y = β0 + β1 X + β2 X2 + β3 X3 + e (4)
In Equations (2)–(4), Y, dependent variable is the provenance trait; X, the independent
variable, is the explanatory climatic variable for the provenance; β0 , β1 , β2 , and β3 are
equation coefficients estimated by least squares regression; and ε is the provenance-source
error. Climatic variables were assessed for suitability in balsam fir model development
based on values of r2 > 0.40 and p < 0.05.
A 3-parameter Gaussian-equation was used, which related survivorship (lx ) of trees in
the provenance plots to DBH-increment over the 16-year period, 1998–2014. This was done
using SigmaPlot Statistical software (version 11, Systat Software Inc., San Jose, CA, USA).
Diameter-increment over the 16-year period for the sampled trees in each provenance plot
was calculated from the difference between DBH1998 and DBH2014 . Survivorship (i.e., lx )Forests 2021, 12, 186 6 of 18
over the 16-year period was calculated for trees in the provenance plots [58,59] from which
DBH was determined:
n2
lx = (5)
n1
In Equation (5), n1 and n2 are the number of trees at the beginning and end of the
16-year period, respectively. The equation used in the regression analysis is as follows:
!
X−b 2
Y = a × exp −0.5 (6)
c
Here, Y is the survivorship; X is the DBH-increment; and a, b, and c are the equation
coefficients. This equation was selected because the relationship between tree DBH-growth
and survival is non-linear, and the representation of this relationship requires flexible
equations that allow for variable curve forms [60,61].
Regression analysis was performed between iWUE at high and low light with DBH2014 .
This was done after an assessment of time series temperature and precipitation data for the
study site over a ten-year period (i.e., 2010–2019), since both variables were measured in
different years. The assessment was done to determine the similarity of climatic conditions
at the study site when iWUE and DBH2014 were collected. An autocorrelation analysis was
done with a regression of temperature and precipitation in a 5-year period (i.e., 2015–2019)
on those for the preceding 5-year period (2010–2014) and Durbin–Watson values obtained
(indicator of presence-absence of autocorrelation). Based on a strong similarity of the
temperature data in the period assessed, the regression analysis relating iWUE at high and
low light with DBH2014 was then performed excluding data from the MS-131 provenance.
3. Results
3.1. Intrinsic Water-Use Efficiency
The results showed that provenance and light setting had significant effects on iWUE
in balsam fir (F(10) = 6.420, p < 0.05 and F(1) = 4.398, p = 0.048,respectively), but at a
reduced level of significance in the latter relationship. The lowest and highest mean iWUE
among the provenances ranged between 0.028 and 0.031 and 0.079 and 0.083 µmol mmol−1 ,
respectively. There was no significant provenance × PAR interaction (F(10) = 1.084, p > 0.05).
Provenance, PAR, and provenance × PAR interaction accounted for 74.50, 16.70, and
33.0%, respectively, of the variation in iWUE (Tables 2 and 3). Relative to the location
of the common garden, the best-performing provenances were from Hawke’s Bay, NL
(MS-126; 0.6 ◦ C cooler and 74.8 mm drier), the Acadia Research Forest, NB (MS-118;
1.4 ◦ C warmer and 90.8 mm wetter), Duck Mountain, SK (MS-130; 1.9 ◦ C cooler and
635.7 mm drier), and the Adirondack Mountains, NY (MS-303; 2.9 ◦ C warmer and 119.7 mm
drier). Intrinsic WUE in most provenances increased with an increased light setting
(Table 2).The components of iWUE for the provenances (i.e., A and gs ) had mean ranges of
7.037(±1.956)–8.783(±2.402) µmol m−2 s−1 and 90.733(±25.353)–252.835(±76.863) mmol
m−2 s−1 , respectively (see Table 4 for provenance-specific results).
Three of the four best-performing provenances, those from Hawke’s Bay, NL, the
Acadia Research Forest, NB, and Duck Mountain, SK, had the lowest gs , whereas the
provenance from Bonne Bay, NL, with the lowest iWUE, had the highest gs . This indicates
that stomatal conductance played an influential role in the water-use characteristics of
the provenances. This is buttressed by regressions, which were performed against A and
gs with iWUE. Rates of photosynthesis and stomatal conductance at low and high light
produced weak and strong inverse linear relationships with iWUE, yielding r2 ’s of 0.04
and 0.03 and 0.79 and 0.77 (Figure 1a,b), respectively. The provenances from Hawke’s Bay,
NL, and Duck Mountain, SK, had the second and third lowest mean A.Forests 2021, 12, 186 7 of 18
Table 2. Mean intrinsic water-use efficiency (i.e., iWUE; µmol mmol−1 ) at photosynthetically active
radiation (PAR) of 300 and 1200 µmol m−2 s−1 in provenances of balsam fir (n = 11, three samples per
provenance) growing in a common garden established in northern New Brunswick, with standard
deviations in parenthesis.
PAR (µmol m− 2 s− 1 )
Provenance
300 1200
MS-130 0.074(±0.010) 0.068(±0.001) ac
MS-133 0.052(±0.014) 0.048(±0.012) a
MS-126 0.083(±0.009) 0.079(±0.006) ab
MS-123 0.044(±0.012) 0.051(±0.008) a
MS-2 0.052(±0.002) 0.067(±0.016) a
MS-127 0.031(±0.010) 0.028(±0.011) a
MS-124 0.035(±0.014) 0.044(±0.022) ab
MS-118 0.078(±0.013) 0.083(±0.021) a
MS-125 0.049(±0.011) 0.061(±0.016) a
MS-117 0.032(±0.010) 0.040(±0.008) a
MS-303 0.064(±0.026) 0.073(±0.017) ac
a no statistical difference in iWUE when compared to the other provenances with a similar letter; ab iWUE was
significantly greater than in MS-117, MS-124, and MS-127; ac iWUE was significantly greater than in MS-127 at
p < 0.05.
Table 3. Output of mixed analysis of variance on iWUE (µmol mmol−1 ) at 300 and 1200 µmol m−2 s−1
in provenances of balsam fir growing in a common garden established in northern New Brunswick;
“df” stands for degrees of freedom.
Source df F-Value p-Value Partial Eta Squared
Provenance 10 6.420Forests 2021, 12, 186 8 of 18
Figure 1. Regression of intrinsic water-use efficiency (i.e., iWUE, µmol mmol−1 ) against (a) the rate of photosynthesis
(A), and (b) stomatal conductance (gs ) at 300 and 1200 µmol m−2 s−1 (open and closed circles, dashed and solid lines,
respectively) in provenances of balsam fir growing in a common garden in northern New Brunswick.
3.2. Diameter at Breast Height Growth
The results showed that provenance had a significant effect on DBH in balsam fir
(F(11) = 2.888, p < 0.05). Diameter at breast height in 2014 was significantly larger than DBH
in 1998 (F(1) = 195.664, p < 0.05). The lowest and highest mean DBH across provenances
ranged between 11.82 and 12.78 and 16.38 and 18.44 cm, respectively.
There was no significant provenance × growth period interaction (F(11) = 1.936,
p > 0.05). Provenance, growth period, and provenance × growth period interaction ac-
counted for 39.80, 80.30, and 30.70%, respectively, of the variation in DBH (Tables 5 and 6).
Over the course of the 40-year period between 1971 and 2010, there were 0.3, 0.7, and 0.1 °C
increases in MAT, MWT, and MST, and a 49.4 mm decline in precipitation at the common
1
garden (see Table 1 in Akalusi and Bourque [51] and Table 1 above).Forests 2021, 12, 186 9 of 18
Table 5. Mean diameter at breast height (i.e., DBH; cm) in 1998 and 2014 in provenances of balsam fir
(n = 12, five samples per provenance) growing in a common garden established in northern New
Brunswick, with standard deviations in parenthesis.
Year
Provenance
1998 2014
MS 131 11.82(±1.62) 12.78(±1.91) a
MS 130 15.26(±2.50) 16.89(±3.10) ad
MS 133 14.06(±0.34) 15.24(±0.38) a
MS 126 12.94(±3.55) 15.16(±4.13) a
MS 123 12.50(±1.82) 15.39(±0.84) a
MS 2 15.64(±1.87) 18.60(±1.07) ac
MS 127 14.48(±0.84) 16.49(±1.09) ad
MS 124 15.18(±0.62) 17.29(±0.81) ad
MS 118 16.38(±3.85) 18.44(±4.88) ab
MS 125 12.72(±0.97) 14.50(±1.91) a
MS 117 15.00(±2.26) 17.28(±0.94) ad
MS 303 15.58(±2.65) 19.12(±1.14) ab
a no statistical difference in DBH when compared to the other provenances with a similar letter; ab DBH was
significantly greater than in MS-123, MS-125, MS-126, and MS-131; ac DBH was significantly greater than in
MS-125, MS-126, and MS-131; ad DBH was significantly greater than in MS-131 at p < 0.05.
Table 6. Output of mixed analysis of variance on 16-year DBH-increment between 1998 and 2014 for
provenances of balsam fir growing in a common garden established in northern New Brunswick;
“df” stands for degrees of freedom.
Source df F-Value p-Value Partial Eta Squared
Provenance 11 2.888 20 ◦ C), although
with r2 -values < 0.40 (r2 = 0.34 for both variables), also had statistically significant linear
relationships with DBH (Figure 2).Forests 2021, 12, 186 10 of 18
Table 7. Climatic variables and their abbreviations.
Parameter Abbreviation
Mean maximum annual temperature MMAX
Lowest temperature of the warmest month LTWM
Mean spring temperature SpMN
Mean minimum summer temperature SMIN
Growing degree-days > 10 ◦ C GDD10
Number of days with temperature > 20 ◦ C DMAX20
Number of days with precipitation > 25 mm DPPT25
Number of days with rainfall > 25 mm DRnF25
Table 8. Coefficient of determination r2 and p-values from regressions of mean iWUE (µmol mmol−1 )
at light settings of 300 and 1200 µmol m−2 s−1 in balsam fir growing in northwestern New Brunswick,
relative to climate at the point of origin. See Table 7 for climatic variable definitions.
Climatic Variable PAR (µmol m−2 s−1 ) Regression Type r2 p
300 Polynomial 0.50 0.16
MMAX
1200 Polynomial 0.30 0.45
300 Polynomial 0.43 0.25
LTWM
1200 Polynomial 0.26 0.53
300 Polynomial 0.31 0.42
DPPT10
1200 Polynomial 0.32 0.40
Forests 2021, 12, 186 300 Polynomial 0.84 >0.05 11
a of 19
DPPT25
1200 Polynomial 0.55 0.12
a not all regression coefficients had p-values < 0.05.
Figure 2. Diameter at breast height (DBH, cm; n = 12, five samples per provenance) in provenances of balsam fir measured
Figure
in 2014,2.in
Diameter at breast
northwestern Newheight (DBH,
Brunswick cm; n to
relative = 12,
(a) five
mean samples perannual
maximum provenance) in provenances
temperature, of balsam
(b) mean spring fir measured
temperature,
in(c)2014, in northwestern New Brunswick relative to (a) mean maximum annual temperature, (b) mean
◦
mean minimum summer temperature, (d) growing degree-days with a base temperature > 10 C, and (e) maximumspring temperature,
(c) mean minimum summer temperature, (d) growing degree-days with a base temperature >10°C, and (e) maximum
temperature > 20 ◦ C at the point of origin.
temperature > 20 °C at the point of origin.
3.4. Survivorship-Diameter at Breast Height Relationship
The regression analysis of survivorship (lx) against DBH-increment (Table 9) revealed
a non-linear relationship (Figure 3a,b). The relationship showed low survival at low DBH-
increment, increased survival at intermediate DBH-increment, followed by another de-Forests 2021, 12, 186 11 of 18
3.4. Survivorship-Diameter at Breast Height Relationship
The regression analysis of survivorship (lx ) against DBH-increment (Table 9) revealed
a non-linear relationship (Figure 3a,b). The relationship showed low survival at low DBH-
increment, increased survival at intermediate DBH-increment, followed by another decline
at high DBH-increment. A data-point for one of the provenances (i.e., MS-133) appeared to
be an outlier (indicated in Figure 3a). When all provenances were used in the regression, r2
was 0.28, and the unimodal relationship formed was not statistically significant (p > 0.05).
When the provenance was excluded, r2 increased to 0.89 and the relationship formed was
statistically significant (p < 0.5). Data from the provenance suspected of being an outlier
departed from the expected trend. The reason for the uncharacteristic level of survival
Forests 2021, 12, 186 for the DBH-increment (Table 9) is unclear, but may have been less obvious with a 12 of 19
larger
sample size.
Table9.9.Mean
Table MeanDBH-increment (cm;nn==12,
DBH-increment(cm; 12,five
fivesamples
samplesper
perprovenance)
provenance)and
andsurvival
survivalfor
forthe
theperiod
period
from
from1998
1998toto2014
2014ininprovenances
provenancesofofbalsam
balsamfir
firgrowing
growingininaacommon
commongarden
gardenestablished
establishedininnorthern
northern
NewBrunswick.
New Brunswick.
Provenance
Provenance Mean
MeanDBH-Increment
DBH-Increment Survivorship
Survivorship
MS 131 0.96(±0.44) 0.28
MS 131 0.96(±0.44) 0.28
MS 130 1.63(±0.69) 0.38
MS 130 1.63(±0.69) 0.38
MS 133
MS 133 1.18(±0.61)
1.18(±0.61) 0.91 0.91
MS 126
MS 126 2.22(±0.97)
2.22(±0.97) 0.78 0.78
MS 123
MS 123 2.89(±1.14)
2.89(±1.14) 0.79 0.79
MS 2MS 2 2.96(±1.17)
2.96(±1.17) 0.87 0.87
MS 127
MS 127 2.01(±1.05)
2.01(±1.05) 0.60 0.60
MS 124
MS 124 2.11(±0.39)
2.11(±0.39) 0.83 0.83
MS 118
MS 118 2.06(±1.15)
2.06(±1.15) 0.63 0.63
MS 125
MS 125 1.78(±1.66)
1.78(±1.66) 0.59 0.59
MS 117 2.28(±1.70) 0.89
MS 117 2.28(±1.70) 0.89
MS 303 3.54(±1.97) 0.59
MS 303 3.54(±1.97) 0.59
Figure3.3.Regression
Figure Regressionofofsurvivorship
survivorship against
againstDBH-increment
DBH-increment (cm; n =n12,
(cm; five
= 12, samples
five perper
samples provenance)
provenance)in balsam fir growing
in balsam fir grow-
ining
a common gardengarden
in a common in northern New Brunswick
in northern over theover
New Brunswick 1998–2014 study period.
the 1998–2014 studyPanel (a) gives
period. Panelthe
(a) fit of the
gives the3-parameter
fit of the 3-
Gaussian
parameter equation
Gaussian(i.e.,equation
Equation(i.e.,
(6)) Equation
with the suspected outlier
(6)) with the (MS-133,
suspected identified
outlier by the
(MS-133, arrow) included,
identified whereas
by the arrow) panel
included,
whereas
(b) panel
gives the same(b)regression
gives the same regression
excluding excluding
the suspected the suspected outlier.
outlier.
3.5. Intrinsic Water-Use Efficiency-Diameter
Efficiency-Diameter at at Breast
Breast Height
Height Relationship
Relationship
Theregression
The regressionofoftemperature
temperatureand andprecipitation
precipitationininthe
the2015–2019
2015–2019period
periodon onthose
thosefor
for
the 2010–2014 period showed that temperature had a strong 2
r2-value of 0.95, whereas pre-
the 2010–2014 period showed that temperature had a strong r -value of 0.95, whereas pre-
cipitationwas
cipitation wassubstantially weaker,atatr2r2==0.02.
substantiallyweaker, 0.02.Autocorrelation
Autocorrelationanalysis
analysisofofthe
theregression
regression
done on the monthly temperature and precipitation data for the 10-year period, 2010–2019
(Figure 4), generated Durbin–Watson values of 1.337 and 1.143, respectively, indicating
autocorrelation. The regression analysis relating iWUE at 300 and 1200 μmol m−2 s−1 with
DBH2014 showed a statistically significant positive linear relationship (r2 = 0.18 and p < 0.05,
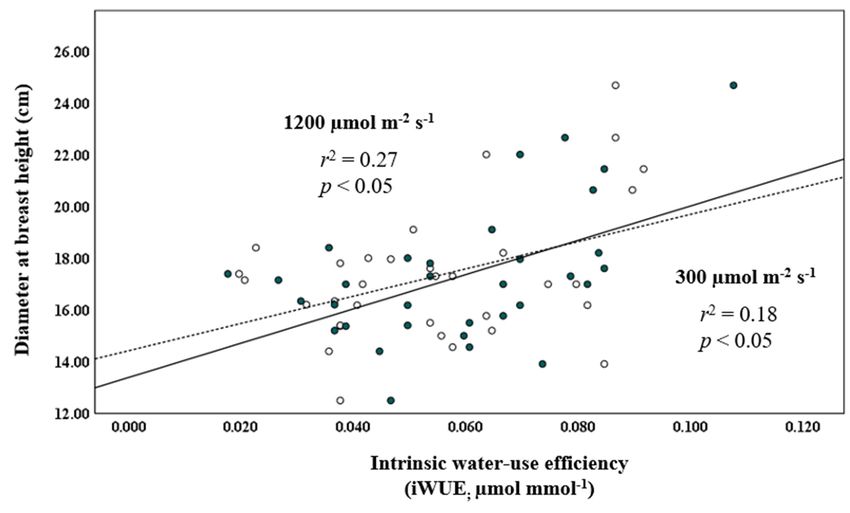
and r2 = 0.27 and p < 0.05, respectively; Figure 5). Quadratic regression also showed a sta-Forests 2021, 12, 186 12 of 18
done on the monthly temperature and precipitation data for the 10-year period, 2010–2019
(Figure 4), generated Durbin–Watson values of 1.337 and 1.143, respectively, indicating
autocorrelation. The regression analysis relating iWUE at 300 and 1200 µmol m−2 s−1 with
DBH2014 showed a statistically significant positive linear relationship (r2 = 0.18 and p < 0.05,
and r2 = 0.27 and p < 0.05, respectively; Figure 5). Quadratic regression also showed a
statistical significant relationship, but equation coefficients for linear regression revealed
greater statistical significance.
Figure 4. Monthly temperature (solid line) and precipitation (dashed line) at the common garden in
northern New Brunswick over the 2010–2019 study period.
Figure 5. Regression of DBH (cm) measured in 2014 against intrinsic water-use efficiency (i.e., iWUE,
µmol mmol −1 −2 −1
D ) at 300 and 1200 µmol m s (open and closed circles, dashed and solid lines,
respectively) in provenances of balsam fir growing in a common garden in northern New Brunswick.
4. Discussion
The results showed a significant provenance effect on balsam fir iWUE (p < 0.05).
Intraspecific variation in iWUE has been reported to have a genetic basis [62–64]. Intraspe-
cific variation in iWUE is mainly the result of variations in gs , and not in A [65–68]. The
values of iWUE obtained in this study were like those obtained by Medrano et al. [69],
Hu et al. [21], and Roussel et al. [66], when compared at similar units of measurement.Forests 2021, 12, 186 13 of 18
Variation in iWUE in this study was a result of the marked differences in stomatal
conductance among the provenances, as three of the four best-performing provenances
had the lowest gs , whereas the provenance with the lowest iWUE had the highest gs .
Furthermore, regressions between A and iWUE and gs and iWUE at low and high light
settings showed a weak negative linear relationship regarding the former, and a stronger
negative linear relationship with the latter. Stomatal conductance influences iWUE, with
lower gs associated with higher iWUE. Increases in iWUE can be the result of reduced
water loss via stomatal control, a higher level of photosynthesis, or a combination of
changes in the two variables. A meta-analysis by Gago et al. [70] on iWUE in 237 species
of trees, shrubs, and herbaceous species showed variations in iWUE correlated well with
gs . Correlations with A, in contrast, were much lower, suggesting a stronger control of
iWUE by gs . They observed this trend across the species studied, treatments applied, and
in well-watered plants. A similar trend in the relationship between gs and iWUE was
observed by Medrano et al. [69], Roussel et al. [66], and Galmes et al. [71].
The provenance with the highest iWUE had the lowest mean gs and lowest mean A.
As gs and A are not independent [65], along with a reduction in gs is an increase in iWUE
and, thereby, a reduction in water losses is expressed as a reduction in A as less substrate
CO2 enters the leaves. Therefore, an increase in iWUE, due to a reduction in gs , results in
reduced A, with the inverse being true as gs increases [68].
There was a reduced level of significance in the difference in provenance-based iWUE
between light settings (p = 0.046). Catoni et al. [30] found that A and gs (the two components
of iWUE) of sun leaves were significantly higher than those of shade leaves in a study
of Quercus robur L., Corylus avellana L., Populus alba L., Acer campestre L., and Robinia
pseudoacacia L. Murphy et al. [72] reported similar findings when A and gs in sun and shade
leaves of Toona ciliate M. Roem. were assessed. The marginally significant difference in
iWUE in provenances between light settings is likely an indication of the fact that balsam
fir is a shade-tolerant species.
Shade tolerance, an important ecological driver behind forest succession, is an indica-
tion of the extent to which a plant can survive and grow in low light conditions. In relation
to shade tolerance, tree species are classified into three broad categories: (i) shade-tolerant
species that can reproduce and survive in low light conditions associated with heavy
shading; (ii) intermediate shade-tolerant species with an ability to tolerate shade during
some phases of the species’ life cycle; and (iii) shade-intolerant species requiring open,
high-growth conditions [73–77]. Balsam fir, a shade-tolerant species, rates 9.8 on a ten-point
tolerance scale developed by Graham [78]; also refer to Hett and Loucks [79]. The high
shade tolerance of balsam fir is a result of its high light-capture efficiency [80–82]. This is
because shade-tolerant species, to optimize light capture, typically assign a higher priority
to foliage growth [83]. Furthermore, species in the genus Abies, to which balsam fir belongs,
allocate resources in comparable proportions to branches and needles, presumably to hold
branches horizontally to favor light interception [82,84]. It is likely that the shade tolerance
of balsam fir may be an important factor in the survival of populations of the species under
changes in forest dynamics projected to accompany climate change [85].
There were no significant relationships between iWUE and climatic variables at the
provenance source despite the strong provenance effect on the parameter. This finding is
consistent with that of Santini et al. [86], who found no relationship between C-isotope
composition and climate at provenance source in a study of Pinus sylvestris populations.
This finding differs from that of Ferrio and Voltas [87], who found relationships between
the parameters in populations of Pinus halepensis Mill. and climatic variables at their source
sites. C-isotope composition (i.e., δ13 C) is reported to have a close relationship with iWUE,
and as a result, can be used as an alternative measure of plant water consumption [20,86,88].
The lack of significant relationship between iWUE and climatic variables at the provenance
source, despite the strong provenance effect on the parameter, may be an indication that
climatic conditions at the provenance source do not play a significant role in intraspecific
variation in iWUE in the species [86].Forests 2021, 12, 186 14 of 18
Diameter at breast height differed significantly among provenances. This is like the
finding from the earlier study based on the 1998 provenance data at the same site [51].
Diameter at breast height in 2014 was significantly larger than DBH1998 , which may be an
indication that the rate of radial growth in the provenances during the 16-year period under
review was not negatively impacted by the increases in temperature (via, e.g., MAT, MWT,
and MST), and decline in precipitation (TPPT) at the common garden. Wang et al. [38]
stated that tree DBH-increments are indicators of forest productivity, with the dynamics
of such increments influenced by the times of initiation, cessation, and growth rate. The
significant increase in DBH during the study period may be a result of the provenances
maintaining good levels of productivity, even after several decades of growth.
Diameter at breast height in 2014 had significant linear relationships with temperature
variables at provenance source. This reaffirms the earlier finding of the larger study at
the same site, of the predominant effect of temperature on DBH [51]. The finding is also
consistent with other studies of this kind (e.g., [41,56,89]). The pairwise relationships
between DBH and MMAX, SpMN, GDD10, and SMIN are indicative of the importance of
the growing season, which spans the period between the last and first frost, and periods of
low temperature [31,90,91] to growth and development in balsam fir.
Survival declined at small and large DBH-increments and increased at intermediate
DBH increments. This is an indication of the influence of size on tree survival [92,93] and is
consistent with other studies that have reported increasing survival with increasing DBH
up to a maximum, after which it begins to decrease [61,94]. High competition brought
about by limited resource availability is responsible for the low survival at small DBH
increases, resulting in improved spacing for trees at intermediate DBH-increments and
higher levels of survival [95]. The decline in survival with large DBH-increments is the
result of high maintenance costs relative to the photosynthate produced, associated with
large trees, and size-limitations, which constrain water and nutrient transport to their
canopies [95,96].
Intrinsic water-use efficiency at low and high light showed positive linear relationships
with DBH2014 . On a global scale, it has been found that increase in iWUE has not been
accompanied by an increase in tree DBH-growth. Penuelas et al. [97] and Silva and
Anand [98], however, state that the relationship between iWUE and tree DBH-growth
varies latitudinally, with positive relationships between the two variables in alpine and
boreal regions, and a trend toward a negative relationship with decreasing latitude.
5. Conclusions
A study was conducted on balsam fir provenances growing in a common garden
in eastern Canada. Intrinsic water-use efficiency (iWUE) of the foliage of provenances,
63 years old, was assessed under low and high light. Diameter at breast height (DBH)
of the provenances were independently measured when they were 42 and 58 years old.
It was concluded from the findings of this study that stomatal conductance, not climatic
factors, influences intraspecific variation in iWUE in balsam fir, and should therefore be
used as a criterion in selection within the species under conditions of climate change. Shade
tolerance, population differentiation, and the consistent pace of DBH-growth in balsam fir
will facilitate sustained growth of the species under changes in forest dynamics projected
to occur with climate change. The strong relationships of balsam fir DBH measured in
2014 with climate factors, particularly temperature-based, demonstrates that temperature
variables are reliable indicators of variation in the trait. Under variable climatic conditions,
the effect of size on tree survival is persistent. The observed positive relationship between
iWUE and DBH confirms the association of these traits in the species.
Author Contributions: M.E.A. and C.P.-A.B. developed the ideas; M.E.A. collected the data, designed
the methods, analyzed the data, and led the writing of the manuscript for the study; C.P.-A.B.
reviewed the drafts, amended the manuscript, and gave final approval for its publication. All authors
have read and agreed to the published version of the manuscript.Forests 2021, 12, 186 15 of 18
Funding: This research was funded by a Discovery Grant from the Natural Sciences and Engineering
Research Council of Canada (NSERC).
Data Availability Statement: The data presented in this study are openly available in FigShare at
https://doi.org/10.6084/m9.figshare.13661207.v1.
Acknowledgments: This work was supported by a Discovery Grant from the Natural Sciences and
Engineering Research Council of Canada (NSERC).
Conflicts of Interest: The authors declare that they have no conflict of interest.
References
1. Oechel, W.C.; Hastings, S.J.; Vourlrtis, G.; Jenkins, M.; Riechers, G.H.; Grulke, N. Recent change of Arctic tundra ecosystems from
a net carbon dioxide sink to a source. Nat. Cell Biol. 1993, 361, 520–523. [CrossRef]
2. Huang, J.; Tardif, J.C.; Bergeron, Y.; Denneler, B.; Berninger, F.; Girardin, M.P. Radial growth response of four dominant boreal
tree species to climate along a latitudinal gradient in the eastern Canadian boreal forest. Glob. Chang. Biol. 2010, 16, 711–731.
[CrossRef]
3. Grossiord, C.; Sevanto, S.; Adams, H.D.; Collins, A.D.; Dickman, L.T.; McBranch, N.; Michaletz, S.T.; Stockton, E.A.; Vigil, M.;
McDowell, N.G. Precipitation, not air temperature, drives functional responses of trees in semi-arid ecosystems. J. Ecol. 2016, 105,
163–175. [CrossRef]
4. Keenan, T.F.; Hollinger, D.Y.; Bohrer, G.; Dragoni, D.; Munger, J.W.; Schmid, H.P.; Richardson, A.D. Increase in forest water-use
efficiency as atmospheric carbon dioxide concentrations rise. Nat. Cell Biol. 2013, 499, 324–327. [CrossRef]
5. Hetherington, A.M.; Woodward, F.I. The role of stomata in sensing and driving environmental change. Nature 2003, 424, 901–908.
[CrossRef]
6. Aphalo, J.; Jarvis, P.G. Do stomata respond to relative humidity? Plant Cell Environ. 1991, 14, 127–132.
7. Papanatsiou, M.; Amtmann, A.; Blatt, M.R. Stomatal clustering in Begonia associates with the kinetics of leaf gaseous exchange
and influences water use efficiency. J. Exp. Bot. 2017, 68, 2309–2315. [CrossRef]
8. Chen, B.; Chen, J.M.; Huang, L.; Tans, P.P. Modeling dynamics of stable carbon isotopic exchange between a boreal forest
ecosystem and the atmosphere. Glob. Chang. Biol. 2006, 12, 1842–1867. [CrossRef]
9. Xu, G.; Liu, X.; Belmecheri, S.; Chen, T.; Wu, G.; Wang, B.; Zeng, X.; Wang, W. Disentangling Contributions of CO2 Concentration
and Climate to Changes in Intrinsic Water-Use Efficiency in the Arid Boreal Forest in China’s Altay Mountains. Forests 2018, 9,
642. [CrossRef]
10. Intergovernmental Panel on Climate Change (IPCC). Summary for policymakers. In Climate Change 2007: The Physical Science
Basis; Solomon, S., Qin, D., Manning, M., Chen, Z., Marquis, M., Averyt, K.B., Tignor, M., Miller, H.L., Eds.; Contribution of
Working Group I to the Fourth Assessment Report of the Intergovernmental Panel on Climate Change, Cambridge University
Press: Cambridge, UK, 2007; pp. 1–18.
11. Hayes, D.J.; McGuire, A.D.; Kicklighter, D.W.; Gurney, K.R.; Burnside, T.J.; Melillo, J.M. Is the northern high-latitude land-based
CO2sink weakening? Glob. Biogeochem. Cycles 2011, 25. [CrossRef]
12. Schroeder, P. Can intensive management increase carbon storage in forests? Environ. Manag. 1991, 15, 475–481. [CrossRef]
13. Dixon, R.K.; Solomon, A.M.; Brown, S.; Houghton, R.A.; Trexier, M.C.; Wisniewski, J. Carbon Pools and Flux of Global Forest
Ecosystems. Science 1994, 263, 185–190. [CrossRef]
14. Vogt, K.A.; Vogt, D.J.; Palmiotto, P.A.; Boon, P.; O’Hara, J.; Asbjornsen, H. Review of root dynamics in forest ecosystems grouped
by climate, climatic forest type and species. Plant Soil 1996, 187, 159–219. [CrossRef]
15. Schulze, E.; Wirth, C.; Heimann, M. Managing forests after Kyoto. Science 2000, 289, 2058–2059. [CrossRef]
16. Roberts, J.M. The role of forests in the hydrological cycle. For. For. Plants 2009, 3, 42–76.
17. Monclus, R.; Dreyer, E.; Villar, M.; Delmotte, F.M.; DeLay, D.; Petit, J.-M.; Barbaroux, C.; Le Thiec, D.; Brechet, C.; Brignolas, F.
Impact of drought on productivity and water use efficiency in 29 genotypes of Populus deltoides x Populus nigra. New Phytol. 2006,
169, 765–777. [CrossRef]
18. Cernusak, L.A.; Aranda, J.; Marshall, J.D.; Winter, K. Large variation in whole-plant water-use efficiency among tropical tree
species. New Phytol. 2006, 173, 294–305. [CrossRef]
19. Barbour, M.M.; Tcherkez, G.; Bickford, C.P.; Mauve, C.; Lamothe, M.; Sinton, S.; Brown, H. δ13C of leaf-respired CO2 reflects
intrinsic water-use efficiency in barley. Plant Cell Environ. 2011, 34, 792–799. [CrossRef]
20. Battie-Laclau, P.; Delgado-Rojas, J.S.; Christina, M.; Nouvellon, Y.; Bouillet, J.-P.; Piccolo, M.D.C.; Moreira, M.Z.; Gonçalves,
J.L.D.M.; Roupsard, O.; Laclau, J.-P. Potassium fertilization increases water-use efficiency for stem biomass production without
affecting intrinsic water-use efficiency in Eucalyptus grandis plantations. For. Ecol. Manag. 2016, 364, 77–89. [CrossRef]
21. Hu, Y.; Zhao, P.; Zhu, L.; Zhao, X.; Ni, G.; Ouyang, L.; Schäfer, K.V.; Shen, W. Responses of sap flux and intrinsic water use
efficiency to canopy and understory nitrogen addition in a temperate broadleaved deciduous forest. Sci. Total. Environ. 2019, 648,
325–336. [CrossRef]
22. Wang, W.; Liu, X.; An, W.; Xu, G.; Zeng, X. Increased intrinsic water-use efficiency during a period with persistent decreased tree
radial growth in northwestern China: Causes and implications. For. Ecol. Manag. 2012, 275, 14–22. [CrossRef]Forests 2021, 12, 186 16 of 18
23. Liu, X.; Shao, X.; Wang, L.; Liang, E.; Qin, D.; Ren, J. Response and dendroclimatic implications of δ13C in tree rings to increasing
drought on the northeastern Tibetan Plateau. J. Geophys. Res. Biogeosciences 2008, 113. [CrossRef]
24. Walters, R.G.; Horton, P. Acclimation of Arabidopsis thaliana to the light environment: Changes in composition of the photosynthetic
apparatus. Planta 1994, 195, 248–256. [CrossRef]
25. Zhang, S.; Ma, K.; Chen, L. Response of photosynthetic plasticity of Paeonia suffruticosa to changed light envi-ronments. Environ.
Exp. Bot. 2003, 49, 121–133. [CrossRef]
26. Legner, N.; Fleck, S.; Leuschner, C. Within-canopy variation in photosynthetic capacity, SLA and foliar N in tem-perate broad-
leaved trees with contrasting shade tolerance. Trees 2014, 28, 263–280. [CrossRef]
27. Niglas, A.; Papp, K.; S˛ekiewicz, M.; Sellin, A.; Goldstein, G. Short-term effects of light quality on leaf gas exchange and hydraulic
properties of silver birch (Betula pendula). Tree Physiol. 2017, 37, 1218–1228. [CrossRef]
28. Passos, L.C.; Da Silva, J.R.; Rodrigues, W.P.; Reis, F.D.O.; Vasconcellos, M.A.D.S.; Filho, J.A.M.; Campostrini, E. Leaf photosynthetic
responses of passion fruit genotypes to varying sunlight exposure within the canopies. Theor. Exp. Plant Physiol. 2018, 30, 103–112.
[CrossRef]
29. Yu, M.; Xie, Y.; Zhang, X. Quantification of Intrinsic Water Use Efficiency along a Moisture Gradient in Northeastern China. J.
Environ. Qual. 2005, 34, 1311–1318. [CrossRef]
30. Catoni, R.; Gratani, L.; Sartori, F.; Varone, L.; Granata, M.U. Carbon gain optimization in five broadleaf deciduous trees in
response to light variation within the crown: Correlations among morphological, anatomical and physiological leaf traits. Acta
Bot. Croat. 2015, 74, 71–94. [CrossRef]
31. Barnes, B.V.; Zak, D.R.; Denton, S.R.; Spurr, S.H. Forest Ecology, 4th ed.; John Wiley and Sons Inc.: New York, NY, USA, 1998.
32. Duchesne, L.; Houle, D. Modelling day-to-day stem diameter variation and annual growth of balsam fir (Abies balsamea (L.) Mill.)
from daily climate. For. Ecol. Manag. 2011, 262, 863–872. [CrossRef]
33. Subedi, N.; Sharma, M. Climate-diameter growth relationships of black spruce and jack pine trees in boreal Ontario, Canada.
Glob. Chang. Biol. 2013, 19, 505–516. [CrossRef] [PubMed]
34. Fraser, D.A. Ecological Studies of Forest Trees at Chalk River, Ontario, Canada. I. Tree Species in Relation to Soil Moisture Sites.
Ecology 1954, 35, 406. [CrossRef]
35. Fritts, H.C. An Analysis of Radial Growth of Beech in a Central Ohio Forest during 1954–1955. Ecol. 1958, 39, 705–720. [CrossRef]
36. Hofgaard, A.; Tardif, J.; Bergeron, Y. Dendroclimatic response of Picea mariana and Pinus banksiana along a longi-tudinal gradient
in the eastern Canadian boreal forest. Can. J. For. Res. 1999, 29, 1333–1346. [CrossRef]
37. Kulmala, L.; Read, J.; Nöjd, P.; Rathgeber, C.B.; Cuny, H.E.; Hollmén, J.; Mäkinen, H. Identifying the main drivers for the
production and maturation of Scots pine tracheids along a temperature gradient. Agric. For. Meteorol. 2017, 232, 210–224.
[CrossRef]
38. Wang, M.; Jiang, Y.; Dong, M.; Zhang, W.; Wang, B.; Zhang, Y.; Ding, X.; Kang, M.; Xu, H. The contributions of rate and duration of
stem radial increment to annual increments of Picea meyeri in a sub-alpine habitat, North-Central China. Trees 2018, 32, 1029–1041.
[CrossRef]
39. Savva, Y.; Bergeron, Y.; Denneler, B.; Koubaa, A.; Tremblay, F. Effect of interannual climate variations on radial growth of jack
pine provenances in Petawawa, Ontario. Can. J. For. Res. 2008, 38, 619–630. [CrossRef]
40. Andalo, C.; Beaulieu, J.; Bousquet, J. The impact of climate change on growth of local white spruce populations in Québec,
Canada. For. Ecol. Manag. 2005, 205, 169–182. [CrossRef]
41. Thomson, A.M.; Riddell, C.L.; Parker, W.H. Boreal forest provenance tests used to predict optimal growth and response to climate
change: 2. Black spruce. Can. J. For. Res. 2009, 39, 143–153. [CrossRef]
42. Rehfeldt, G.E.; Tchebakova, N.M.; Parfenova, Y.I.; Wykoff, W.R.; Kuzmina, N.A.; Milyutin, L.I. Intraspecific responses to climate
change in Pinus sylvestris. Glob. Chang. Biol. 2002, 8, 912–929. [CrossRef]
43. Carter, K. Provenance tests as Indicators of growth response to climate change in 10 north temperate tree species. Can. J. For. Res.
1996, 26, 1089–1095. [CrossRef]
44. MacGillivray, H.G. Progress Report, Balsam Fir Provenance Planting 1956 sowing, Project M. 95; Related Studies: Petawawa
Experiments Number 63, Number 175 and Number 176; Department of Forestry, Forest Research Branch, Canada: Kamloops, BC,
Canada, 1963.
45. Bailey, R.G. Descriptions of the Ecoregions of the United States; US Department of Agriculture Forest Service: Washington, DC,
USA, 1995.
46. Ecological Stratification Working Group. A National Ecological Framework for Canada; Environment Canada: Gatineau, QC, Canada,
1996; p. 76.
47. Environment and Climate Change Canada. 2018. Available online: http://climate.weather.gc.ca/climate_normals/index_e.html
(accessed on 24 April 2018).
48. National Oceanic and Atmospheric Administration, United States of America. Comparative Climatic Data. 2018. Available
online: https://www.ncdc.noaa.gov/ghcn/comparative-climatic-data (accessed on 24 April 2018).
49. Environment and Climate Change Canada. 2019. Available online: https://climate.weather.gc.ca/prods_servs/cdn_climate_
summary_e.html (accessed on 16 December 2019).
50. Canadian Soil Information Service. 2019. Available online: http://sis.agr.gc.ca/cansis/publications/index.html (accessed on 12
December 2019).Forests 2021, 12, 186 17 of 18
51. Akalusi, M.E.; Bourque, C.P.-A. Effect of climatic variation on the morphological characteristics of 37-year-oldbalsam fir prove-
nances planted in a common garden in New Brunswick, Canada. Ecol. Evol. 2018, 8, 3208–3218. [CrossRef] [PubMed]
52. Richardson, A.D.; Berlyn, G.P. Changes in foliar spectral reflectance and chlorophyll fluorescence of four temperate species
following branch cutting. Tree Physiol. 2002, 22, 499–506. [CrossRef] [PubMed]
53. Clark, J. The Immediate Effect of Severing on the Photosynthetic Rate of Norway Spruce Branches. Plant Physiol. 1954, 29, 489–490.
[CrossRef] [PubMed]
54. Koike, T.; Sakagami, Y. Examination of methods of measuring photosynthesis with detached parts of three species of birch in
Hokkaido. J. Jpn. For. Soc. 1984, 66, 337–340.
55. Gauthier, M.-M.; Jacobs, D.F. Reductions in net photosynthesis and stomatal conductance vary with time since leaf detachment in
three deciduous angiosperms. Trees 2018, 32, 1247–1252. [CrossRef]
56. Matyas, C.S.; Yeatman, C.W. Effect of geographical transfer on growth and survival of jack pine (Pinus banksiana Lamb.)
populations. Silvae Genet. 1992, 41, 370–376.
57. Thomson, A.M.; Parker, W.H. Boreal forest provenance tests used to predict optimal growth and response to climate change. 1.
Jack pine. Can. J. For. Res. 2008, 38, 157–170. [CrossRef]
58. Sheil, D.; Burslem, D.F.R.P.; Alder, D. The Interpretation and Misinterpretation of Mortality Rate Measures. J. Ecol. 1995, 83, 331.
[CrossRef]
59. Roman, L.A.; Battles, J.J.; McBride, J.R. Determinants of establishment survival for residential trees in Sacramento County, CA.
Landsc. Urban Plan. 2014, 129, 22–31. [CrossRef]
60. Buchman, R.G.; Pederson, S.P.; Walters, N.R. A tree survival model with application to species of the Great Lakes region. Can. J.
For. Res. 1983, 13, 601–608. [CrossRef]
61. Monserud, R.A.; Sterba, H. Modeling individual tree mortality for Austrian forest species. For. Ecol. Manag. 1999, 113, 109–123.
[CrossRef]
62. Martin, B.; Nienhuis, J.; King, G.; Schaefer, A. Restriction Fragment Length Polymorphisms Associated with Water Use Efficiency
in Tomato. Science 1989, 243, 1725–1728. [CrossRef]
63. Masle, J.; Gilmore, S.R.; Farquhar, G.D. The ERECTA gene regulates plant transpiration efficiency in Arabidopsis. Nat. Cell Biol.
2005, 436, 866–870. [CrossRef]
64. Flexas, J.; Niinemets, U.; Galle, A.; Barbour, M.M.; Centritto, M.; Diaz-Espejo, A.; Douthe, C.; Galmes, J.; Ribas-Carbo, M.;
Rodriguez, P.L.; et al. Diffusional conductances to CO2 as a target for increasing photosynthesis and pho-tosynthetic water-use
efficiency. Photosynth. Res. 2013, 117, 45–59. [CrossRef]
65. Blum, A. Drought resistance, water-use efficiency, and yield potential—are they compatible, dissonant, or mutually exclusive?
Aust. J. Agric. Res. 2005, 56, 1159–1168. [CrossRef]
66. Roussel, M.; Le Thiec, D.; Montpied, P.; Ningre, N.; Guehl, J.-M.; Brendel, O. Diversity of water use efficiency among Quercus
robur genotypes: Contribution of related leaf traits. Ann. For. Sci. 2009, 66, 408. [CrossRef]
67. Tomás, M.; Medrano, H.; Escalona, J.M.; Martorell, S.; Pou, A.; Ribas-Carbó, M.; Flexas, J. Variability of water use efficiency in
grapevines. Environ. Exp. Bot. 2014, 103, 148–157. [CrossRef]
68. Flexas, J.; Díaz-Espejo, A.; Conesa, M.A.; Coopman, R.; Douthe, C.; Gago, J.; Gallé, A.; Galmés, J.; Medrano, H.; Ribas-Carbo, M.;
et al. Mesophyll conductance to CO2 and Rubisco as targets for improving intrinsic water use efficiency in C3 plants. Plant Cell
Environ. 2015, 39, 965–982. [CrossRef]
69. Medrano, H.; Flexas, J.; Galmés, J. Variability in water use efficiency at the leaf level among Mediterranean plants with different
growth forms. Plant Soil 2008, 317, 17–29. [CrossRef]
70. Gago, J.; Douthe, C.; Florez-Sarasa, I.; Escalona, J.M.; Galmes, J.; Fernie, A.R.; Flexas, J.; Medrano, H. Opportunities for improving
leaf water use efficiency under climate change conditions. Plant Sci. 2014, 226, 108–119. [CrossRef]
71. Galmés, J.; Conesa, M.À.; Ochogavía, J.M.; Perdomo, J.A.; Francis, D.M.; Ribas-Carbó, M.; Savé, R.; Flexas, J.; Medrano, H.;
Cifre, J. Physiological and morphological adaptations in relation to water use efficiency in Mediterranean accessions of Solanum
lycopersicum. Plant Cell Environ. 2010, 34, 245–260. [CrossRef] [PubMed]
72. Murphy, M.R.C.; Jordan, G.J.; Brodribb, T.J. Differential leaf expansion can enable hydraulic acclimation to sun and shade. Plant
Cell Environ. 2012, 35, 1407–1418. [CrossRef] [PubMed]
73. Shirley, H.L. Is tolerance the capacity to endure shade? J. For. 1943, 41, 339–345.
74. Anderson, R.C.; Loucks, O.L.; Swain, A.M. Herbaceous response to canopy cover, light intensity and through fall precipitation in
coniferous forests. Ecology 1969, 50, 255–263. [CrossRef]
75. Kobe, R.K.; Pacala, S.W.; Silander, J.A., Jr.; Canham, C.D. Juvenile tree survivorship as a component of shade tol-erance. Ecol.
Appl. 1995, 5, 517–532. [CrossRef]
76. Kneeshaw, D.D.; Kobe, R.K.; Coates, K.D.; Messier, C. Sapling size influences shade tolerance ranking among southern boreal tree
species. J. Ecol. 2006, 94, 471–480. [CrossRef]
77. Humbert, L.; Gagnon, D.; Kneeshaw, D.; Messier, C. A shade tolerance index for common understory species of northeastern
North America. Ecol. Indic. 2007, 7, 195–207. [CrossRef]
78. Graham, S.A. Scoring Tolerance of Forest Trees; Research Note 4; University of Michigan, Department of Forestry, School of Natural
Resources: Ann Arbor, MI, USA„ 1954.
79. Hett, J.M.; Loucks, O.L. Age Structure Models of Balsam Fir and Eastern Hemlock. J. Ecol. 1976, 64, 1029. [CrossRef]You can also read